global metabolomics · global metabolomics platform metabolite coverage and methods methods...
TRANSCRIPT
www.metabolon.com
GLOBAL METABOLOMICSINNOVATIVE TECHNOLOGY FOR BIOLOGICAL INSIGHT
Unlocking Biology with MetabolomicsSurveying metabolites is crucial to unlocking biology because almost every factor impacting the phenoytpe—from genetics and the microbiota, to disease and drug exposure—exerts influence by altering metabolite levels.
By identifying, quantifying, tracking and mapping all of the metabolites of a system under study, metabolomics can provide unique biological insight and empower biomarker discovery.
While many laboratories have metabolite profiling or analytical chemistry capabilities, comprehensive metabolomics technologies are extremely rare. This is because accurate and unbiased metabolite identification across the entire metabolome presents sizable challenges that very few laboratories are equipped to handle.
A Metabolomics Solution: Precision Metabolomics™
With more than 15 years of experience and continuous innovation, Metabolon has overcome the challenges of whole-metabolome profiling and created the industry’s most advanced metabolomics technology, Precision Metabolomics.
Powering Precision Metabolomics is our global metabolomics platform, which is an ideal tool for gaining biological insight and discovering biomarkers.
Our global metabolomics technology effectively functions as an automated “metabolic sequencer” that unlocks critical information contained within the metabolome. It can quickly and accurately identify and quantitate upwards of 1,000 metabolites with less than 5% process variability and is compatible with almost any sample type.
This exceptional data is then imported into our pathway analysis environment for intuitive and insightful interpretation. This combination of data represents a unique system for creating knowledge across all areas of life sciences.
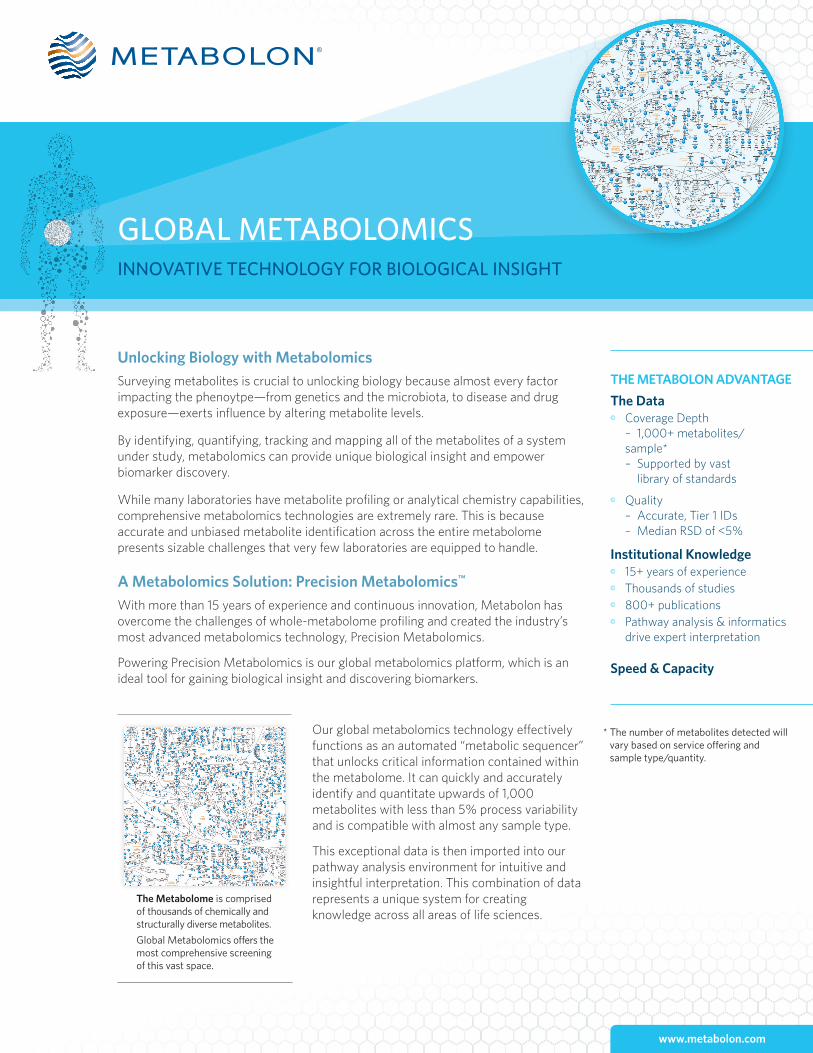
The Metabolome is comprised of thousands of chemically and structurally diverse metabolites. Global Metabolomics offers the most comprehensive screening of this vast space.
THE METABOLON ADVANTAGE The Data© Coverage Depth – 1,000+ metabolites/ sample* – Supported by vast library of standards© Quality – Accurate, Tier 1 IDs – Median RSD of <5%
Institutional Knowledge© 15+ years of experience© Thousands of studies© 800+ publications © Pathway analysis & informatics drive expert interpretation Speed & Capacity
* The number of metabolites detected will vary based on service offering and sample type/quantity.
GLOBAL METABOLOMICS PLATFORM METABOLITE COVERAGE AND METHODS
Methods
Precision Metabolomics combines multiple mass spectrometry methods and a proprietary LIMS system with the industry’s largest reference library of authenticated metabolite standards and a suite of patented informatics and quality-control software. This allows us to automatically and rapidly identify and quantitate metabolites. A team of chemical spectral analysts then performs final quality-control using proprietary software tools. These features collectively allow Precision Metabolomics to overcome the “signal-to-noise” challenges that plague many metabolomics platforms. The result is the rapid production of the highest quality data possible.
Supporting References ■ A. M. Evans, B. R. Bridgewater et al., Metabolomics 4, 2153-0769 (2014).■ A. Evans, M. Mitchell et al., Metabolomics: Open Access, (2012).■ C. D. DeHaven, A. Evans et al., INTECH Open Access Publisher (2012).
■ C. D. Dehaven, A. M. Evans et al., J Cheminform 2, (2010).■ A. M. Evans, C. D. DeHaven et al., Analytical Chemistry 81, 6656-6667
(2009).
Around 1,000 metabolites across diverse classes can be measured* from 100 µL of plasma/serum, 50-100 mg of tissue, or a 50-100 µL cell pellet with approxima-tely 5% CVs.
* The metabolites detected from the above classes can vary based on the type of sample and the abundance levels in those samples.
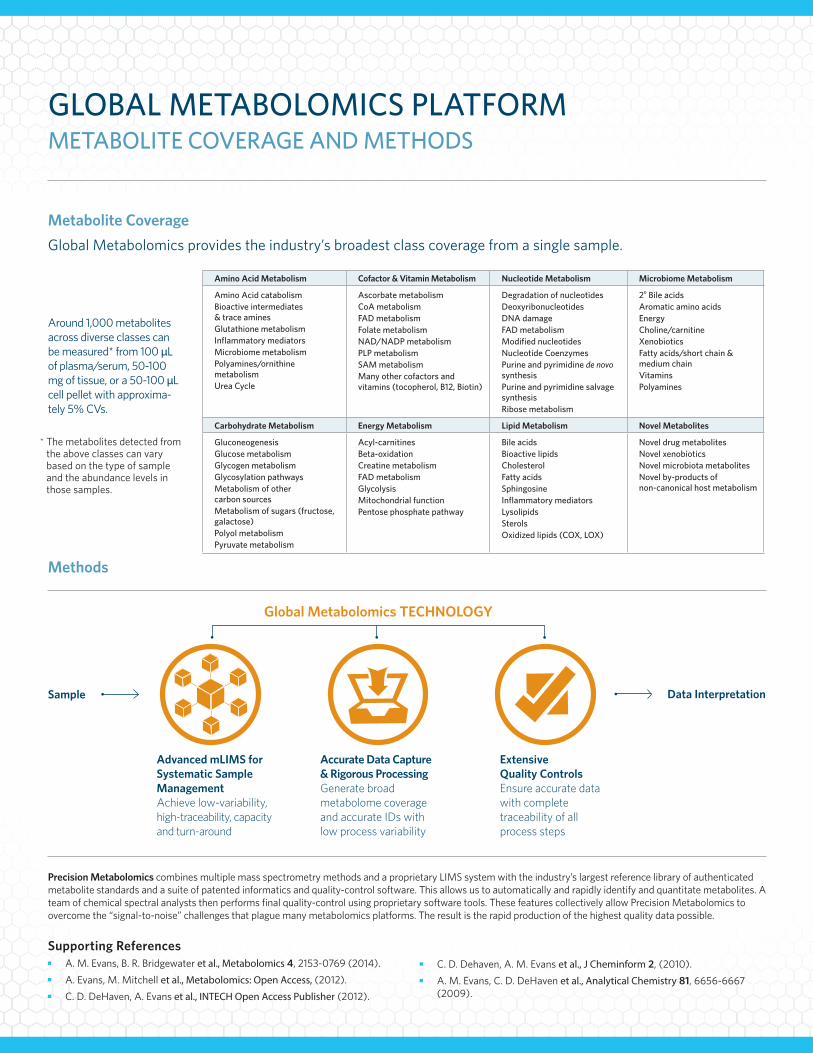
Amino Acid Metabolism Cofactor & Vitamin Metabolism Nucleotide Metabolism Microbiome Metabolism
Amino Acid catabolismBioactive intermediates & trace aminesGlutathione metabolismInflammatory mediatorsMicrobiome metabolismPolyamines/ornithine metabolismUrea Cycle
Ascorbate metabolismCoA metabolismFAD metabolismFolate metabolismNAD/NADP metabolismPLP metabolismSAM metabolismMany other cofactors and vitamins (tocopherol, B12, Biotin)
Degradation of nucleotidesDeoxyribonucleotidesDNA damageFAD metabolismModified nucleotidesNucleotide CoenzymesPurine and pyrimidine de novo synthesisPurine and pyrimidine salvage synthesisRibose metabolism
2o Bile acidsAromatic amino acidsEnergyCholine/carnitineXenobioticsFatty acids/short chain & medium chainVitaminsPolyamines
Carbohydrate Metabolism Energy Metabolism Lipid Metabolism Novel Metabolites
GluconeogenesisGlucose metabolismGlycogen metabolismGlycosylation pathwaysMetabolism of other carbon sourcesMetabolism of sugars (fructose, galactose)Polyol metabolismPyruvate metabolism
Acyl-carnitinesBeta-oxidationCreatine metabolismFAD metabolismGlycolysisMitochondrial functionPentose phosphate pathway
Bile acidsBioactive lipidsCholesterolFatty acidsSphingosineInflammatory mediatorsLysolipidsSterolsOxidized lipids (COX, LOX)
Novel drug metabolitesNovel xenobioticsNovel microbiota metabolitesNovel by-products of non-canonical host metabolism
Sample
Accurate Data Capture & Rigorous Processing Generate broad metabolome coverage and accurate IDs with low process variability
Extensive Quality Controls Ensure accurate data with complete traceability of all process steps
Data Interpretation
Global Metabolomics TECHNOLOGY
Advanced mLIMS for Systematic Sample Management Achieve low-variability, high-traceability, capacity and turn-around
Metabolite CoverageGlobal Metabolomics provides the industry’s broadest class coverage from a single sample.
Scientific Consultation The value of metabolomics is heightened through our collaborative process. Our team of accomplished Ph.D. scientists works with you through every step of the process to ensure that the results are both meaningful and tractable.
Whole Metabolome Screening Our innovative technology provides the deepest coverage of the metabolome of any published platform in the industry.
Data to KnowledgeData are an essential component to metabolomic discoveries, but interpretation of the data is the final barrier to discovery. Our expertise and institutional knowledge clear this barrier through interpretation services led by our Ph.D. scientists and access to bioinformatics tools that enable you to explore the data.
From our initial consultation to the delivery of results, the entire process of working with Metabolon is designed to empower your informed decision making so that you can move forward with confidence.
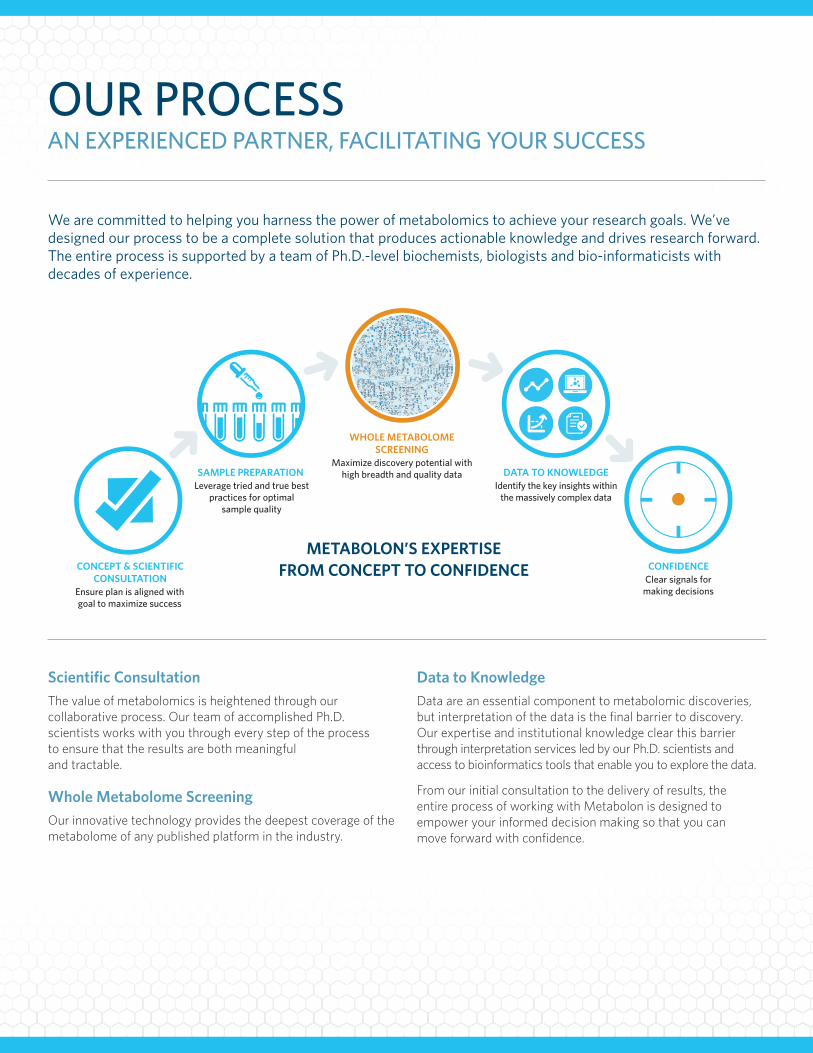
METABOLON’S EXPERTISEFROM CONCEPT TO CONFIDENCE
WHOLE METABOLOME SCREENING
SAMPLE PREPARATION
CONCEPT & SCIENTIFICCONSULTATION
DATA TO KNOWLEDGE
CONFIDENCE
Ensure plan is aligned withgoal to maximize success
Leverage tried and true best practices for optimal
sample quality
Maximize discovery potential with high breadth and quality data
Identify the key insights within the massively complex data
Clear signals for making decisions
OUR PROCESS AN EXPERIENCED PARTNER, FACILITATING YOUR SUCCESS
We are committed to helping you harness the power of metabolomics to achieve your research goals. We’ve designed our process to be a complete solution that produces actionable knowledge and drives research forward. The entire process is supported by a team of Ph.D.-level biochemists, biologists and bio-informaticists with decades of experience.
Our commitment to ensuring success includes deliverables that facilitate your understanding and put your metabolomics results into action. The following three elements form the core of our deliverables.
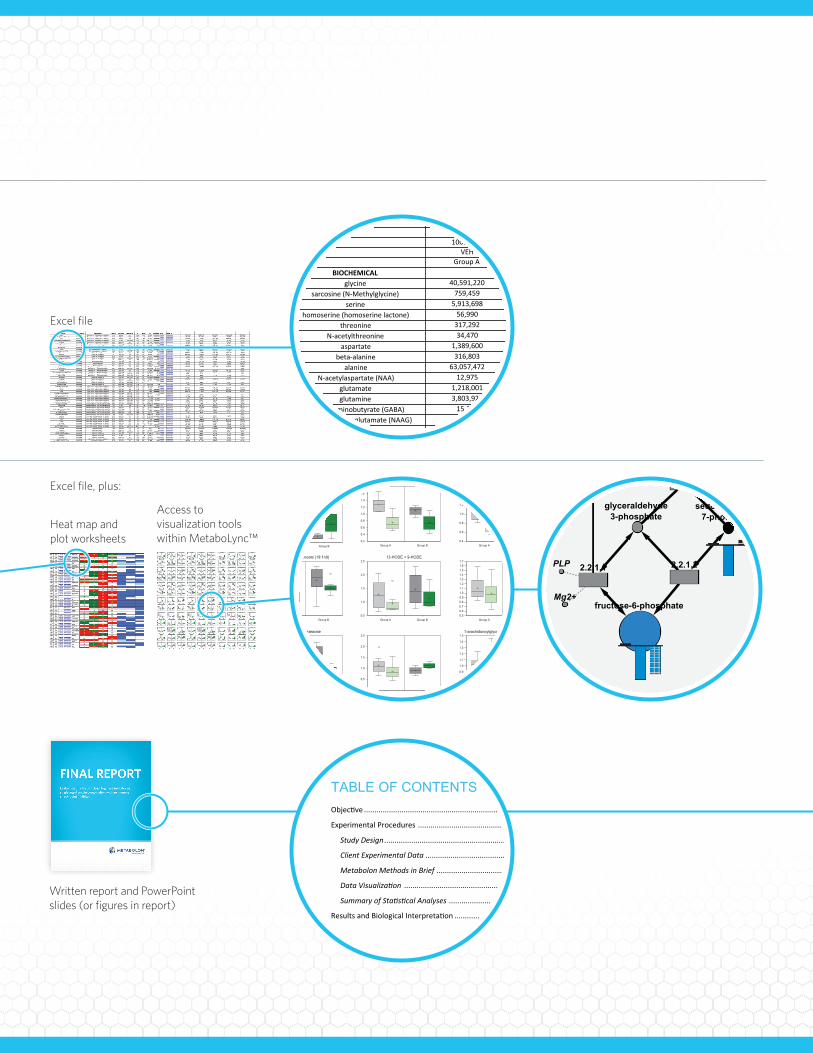
DELIVERABLES CONVERT DATA TO KNOWLEDGE WITH METABOLOMICS
Excel file, plus:
Heat map and plot worksheets
Access to visualization tools within MetaboLync™
Written report and PowerPoint slides (or figures in report)
Excel file
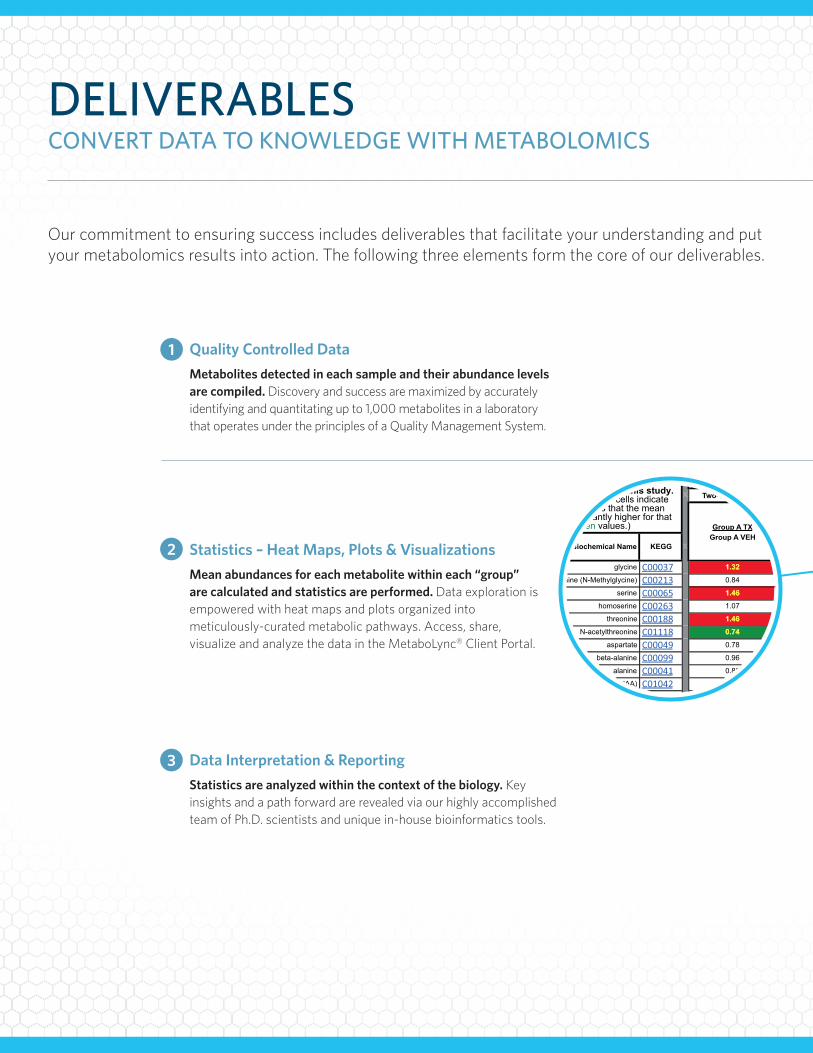
Quality Controlled DataMetabolites detected in each sample and their abundance levels are compiled. Discovery and success are maximized by accurately identifying and quantitating up to 1,000 metabolites in a laboratory that operates under the principles of a Quality Management System.
Data Interpretation & ReportingStatistics are analyzed within the context of the biology. Key insights and a path forward are revealed via our highly accomplished team of Ph.D. scientists and unique in-house bioinformatics tools.
1
Statistics – Heat Maps, Plots & VisualizationsMean abundances for each metabolite within each “group” are calculated and statistics are performed. Data exploration is empowered with heat maps and plots organized into meticulously-curated metabolic pathways. Access, share, visualize and analyze the data in the MetaboLync® Client Portal.
2
3
TABLE OF CONTENTS .......................................................................................................................... 5
Experimental Procedures ................................................................................................
.......................................................................................................
.................................................................................
...............................................................................
................................................................................................................
............................................................................................
.......................................................................................
7
Study Design 7
Client Experimental Data 7
Metabolon Methods in Brief 7
7
8
9
Excel file, plus:
Heat map and plot worksheets
Access to visualization tools within MetaboLync™
Written report and PowerPoint slides (or figures in report)
Excel file
Quality Controlled DataMetabolites detected in each sample and their abundance levels are compiled. Discovery and success are maximized by accurately identifying and quantitating up to 1,000 metabolites in a laboratory that operates under the principles of a Quality Management System.
Data Interpretation & ReportingStatistics are analyzed within the context of the biology. Key insights and a path forward are revealed via our highly accomplished team of Ph.D. scientists and unique in-house bioinformatics tools.
1
Statistics – Heat Maps, Plots & VisualizationsMean abundances for each metabolite within each “group” are calculated and statistics are performed. Data exploration is empowered with heat maps and plots organized into meticulously-curated metabolic pathways. Access, share, visualize and analyze the data in the MetaboLync® Client Portal.
2
3
TABLE OF CONTENTS .......................................................................................................................... 5
Experimental Procedures ................................................................................................
.......................................................................................................
.................................................................................
...............................................................................
................................................................................................................
............................................................................................
.......................................................................................
7
Study Design 7
Client Experimental Data 7
Metabolon Methods in Brief 7
7
8
9
sedoheptulose-7-phosphate
H+
H+
5.3.1.6
H+
NADP+
xylulose
1.1.1.21
xylitol (D or L)
1.1.1.10
NADPH
NADPH
2.2.1.2
2.2.1.1
NAD+
Mg2+
1.1.1.44
ribulose5-phosphate
lactate
TPP
6-phosphogluconate
NADP+
CO2
xylulose5-phosphate
2.2.1.1
5.1.3.1
1.1.1.27
H+
PLP
glyceraldehyde3-phosphate
NADH
fructose-6-phosphateMg2+
Mg2+
2.7.1.17
ADP
ATP
CO2
3.1.1.31
NADP+H+
H+
6-phosphonoglucono-1,5-lactone
H2O
4.1.2.13dihydroxyacetonephosphate
(DHAP)
1.2.1.12
2.7.1.29
5.3.1.1
H+
glyceraldehyde-3-phosphate
ADP
ADP
ATP
K+
pyruvate
phosphoenolpyruvate(PEP)
4.2.1.11 Mg2+
2.7.1.40Mg2+
H+
4.1.1.34
ADP
H2O
3.1.3.9
1.1.1.49
glucose-6-phosphate
H+
5.4.2.11
3-phosphoglycerate
H2O
2.7.2.3
2-phosphoglycerate
1,3-biphosphoglycerate
Mg++
H+
3.1.3.46
H2O
Pi
ADP
NAD+
NADH
fructose-2,6-bisphosphate
ATP
H2O H+
3.1.3.11
ADP
Pi
2.7.1.11
fructose-1,6-bisphosphate
Mg2+
Mg2+
2.7.1.2
glucoseMg2+
5.4.2.2
Pi
glucose1-phosphate
ATP
glucose-1,6-bis-P
Microbiome NADP+
5.4.2.5
5.3.1.9
H+
fructose-6-phosphateNADPH
ATP
2.4.1.1
2.4.1.1
maltose
2.4.1.1
maltotriose
2.4.1.1
2.4.1.1
maltopentaose
maltohexaose
glucose-1-phosphate
maltotetraose
fructose
1.1.1.14
fructose1-phosphate
2.7.1.3
sorbitol
4.1.2.13
glyceraldehyde
NADP+
NADH
H+
ATP
ADP
NAD+
SORBITOLAND
GLYCEROLMETABOLISM
dihydroxyacetone
2.7.1.69
2.7.1.1
NADPH
sorbitol6-phosphate
ADP
Mg2+
ATP
1.1.1.21
ATP
maltodextrin (n)
Pi
2.4.1.1
2.4.1.1
Glycogen
glucose
GLYCOGENMETABOLISM
XXXX-‐0001 XXXX-‐00021 2
10000001 10000002VEH VEH
Group A Group ABIOCHEMICAL
glycine 40,591,220 33,865,704sarcosine (N-‐Methylglycine) 759,459 491,812
serine 5,913,698 4,930,427homoserine (homoserine lactone) 56,990 19,355
threonine 317,292 315,797N-‐acetylthreonine 34,470 30,501
aspartate 1,389,600 1,266,097beta-‐alanine 316,803 242,789
alanine 63,057,472 53,878,948N-‐acetylaspartate (NAA) 12,975 25,088
glutamate 1,218,001 1,315,757glutamine 3,803,925 3,995,435
gamma-‐aminobutyrate (GABA) 15,392 21,947N-‐acetyl-‐aspartyl-‐glutamate (NAAG) 153,442 148,265
histidine 54,248 50,459histamine 228,782 205,108lysine 423,773 343,642
pipecolate 169,650 181,314phenylalanine 5,933,031 6,403,386p-‐cresol sulfate
tyrosine 2,931,991 3,017,0583-‐(4-‐hydroxyphenyl)lactate (HPLA) 13,755 14,351
phenylacetylglycine 3,946 4,157phenol sulfate 38,003 24,996kynurenine 18,401 33,544tryptophan 1,734,083 1,570,806indolelactate
C-‐glycosyltryptophan* 28,601 27,8403-‐indoxyl sulfate 13,479 9,983
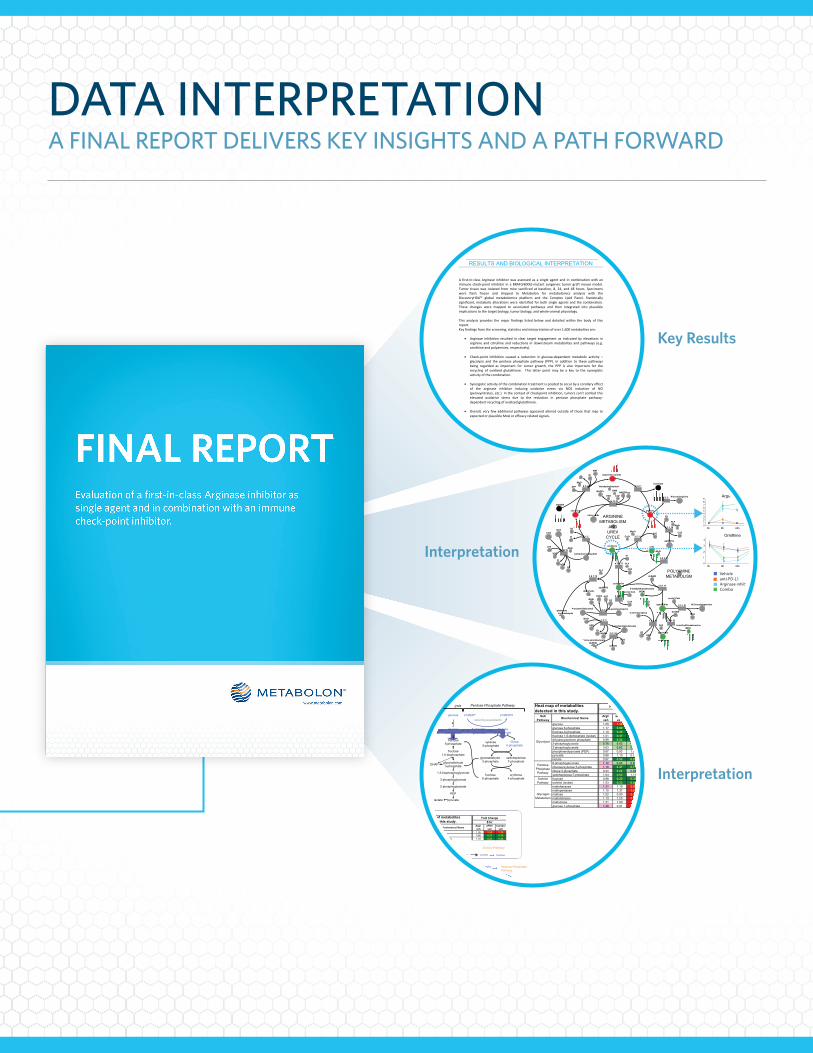
DATA INTERPRETATION A FINAL REPORT DELIVERS KEY INSIGHTS AND A PATH FORWARD
Interpretation
Interpretation
Key Results
RESULTS AND BIOLOGICAL INTERPRETATION A first-in-class Arginase inhibitorwas assessed as a single agent and in combinationwith animmune check-point inhibitor in aBRAF(V600E)-mutant syngeneic tumorgraftmousemodel.Tumor tissue was isolated frommice sacrificed at baseline, 8, 24, and 48 hours. Specimenswere flash frozen and shipped to Metabolon for metabolomics analysis with theDiscoveryHD4™ global metabolomics platform and the Complex Lipid Panel. Statisticallysignificant,metabolic alterationswere identified forboth single agents and the combination.These changes were mapped to associated pathways and then integrated into plausibleimplicationstothetargetbiology,tumorbiology,andwhole-animalphysiology.This analysis provides the major findings listed below and detailed within the body of thisreport.Keyfindingsfromthescreening,statisticsandinterpretationofover1,600metabolitesare:
• Arginase inhibition resulted in clear target engagement as indicated by elevations inarginine and citrulline and reductions in downstreammetabolites and pathways (e.g.ornithineandpolyamines,respectively).
• Check-point inhibition caused a reduction in glucose-dependent metabolic activity –glycolysis and the pentose phosphate pathway (PPP). In addition to these pathwaysbeing regarded as important for tumor growth, the PPP is also important for therecycling of oxidized glutathione. This latter point may be a key to the synergisticactivityofthecombination.
• Synergisticactivityofthecombinationtreatmentispositedtooccurbyacorollaryeffectof the arginase inhibitor inducing oxidative stress via NOS induction of NO(peroxynitrates,etc.)Inthecontextofcheckpointinhibition,tumorscan’tcombatthiselevated oxidative stress due to the reduction in pentose phosphate pathway-dependentrecyclingofoxidizedglutathione.
• Overall, very few additional pathways appeared altered outside of those thatmap toexpectedorplausibleMoAorefficacyrelatedsignals.
Make a glycolysis one with heat map
Make synthesis �gure for mVision only
0
GSSG
0h 8h 24h 48h
1
2
3
4
0
Glucose 6-phosphate
0h 8h 24h 48h
1
2
3
4
aspartate
NAD+
SPO
ADP
Pi
L-glutamategamma-semialdehyde
spermidine
N-acetylputrescine
N(1)-acetylspermine2.3.1.57
1.4.3.4
CoA3-aminopropanal dcSAM
acetyl CoAH2O2CoAO2
H2OH2O2 2.3.1.57
putrescine
alpha-KG2.5.1.16
5-methylthioadenosine(MTA)acetyl CoA
POLYAMINEMETABOLISM
CO2
PLP4.1.1.17
dcSAM
PLP
3.5.3.11
Mn2+
agmatine
urea
4.1.1.19
H2O
Mg2+
CO2
PLP
ARGININEMETABOLISM
ANDUREA
CYCLE
ornithine
Co2+
H+
Mn2+
3.5.3.1CO2
ATP
NH3 H+
Pi
Mg2+6.3.4.16
H2O
H+
O2
1.5.3.16
H2O
FAD
spermine
2.5.1.22
5-methylthioadenosine(MTA)
acetate
H2O
3.5.1.63H+
1.2.1.3
4-acetamidobutanoate
NADH
2.1.3.3
4-acetamidobutanal
NAD+
gamma-aminobutyrate(GABA)
H2O
glutamate
NH4+
carbamoyl-phosphate
2.6.1.13
nitric oxide
AMP
argininosuccinateH+PPi
ATP 6.3.4.5Mg2+
citrulline
O2NADPHCa2+FAD
FMN
tetrahydrobiopterin
NADP+
1.14.13.39
N-acetylarginine5.3.3.-
fumarate4.3.2.1
H+
arginine
Vehicleanti-PD-L1 Arginase inhibitorCombo
0123456789
Arginine
0h 8h 24h 48h
0
Ornithine
0h 8h 24h 48h
1
2
3
4
Mean Value+ 1 standard error
- 1 standard error
0123456789
Metabolite name
0h 8h 24h 48h
Scal
ed In
tens
ity
Vehicleanti-PD-L1 Arginase inhibitorCombo
Time (h)
fructose6-phosphate
3-phosphoglycerate
2 NADPHglucose
glucose6-phosphate
glyceraldehyde3-phosphate
PEP
ribulose5-phosphate
ribose5-phosphate
2 NADP+
Glycolysis Pentose Phosphate Pathway
xylulose5-phosphate
6-phospho gluconateGlycogen
glyceraldehyde3-phosphate
sedoheptulose7-phosphate
fructose6-phosphate
erythrose4-phosphate
glucose1-phosphate
Glycogenolysis
fructose1,6-bisphosphate
DHAP
lactate
2-phosphoglycerate
pyruvate
1,3-bisphosphoglycerate
reducing equivalentsGlucose stores
2 NADPH
glucose
glucose6-phosphate
2 NADP+Glycolysis
Pentose Phosphate Pathway
6-phospho gluconateGlycogen glucose
1-phosphate
Glycogenolysisreducing equivalents
sorbitol fructose
Sorbitol Pathway
Sub Pathway Biochemical Name Argi/
vehaPD1/ veh
Combo/veh
glucose 1.05 1.30 1.18fructose 0.88 0.22 0.35sorbitol (isobar) 1.03 0.23 0.42
Sorbitol Pathway
8 hrHeat map of metabolites detected in this study.
Fold Change
Glycolysis
Sub Pathway Biochemical Name Argi/
vehaPD1/ veh
Combo/veh
glucose 1.05 1.30 1.18glucose 6-phosphate 1.17 0.60 0.83fructose-6-phosphate 1.10 0.20 0.26fructose 1,6-diphosphate (isobar) 1.01 0.47 0.19dihydroxyacetone phosphate 0.99 0.22 0.213-phosphoglycerate 0.76 0.63 0.782-phosphoglycerate 0.83 0.82 0.77phosphoenolpyruvate (PEP) 0.87 0.93 1.01pyruvate 0.88 1.10 0.98lactate 0.97 0.59 0.256-phosphogluconate 1.12 0.63 0.89ribulose/xylulose 5-phosphate 1.18 0.47 0.71ribose 5-phosphate 0.94 0.22 0.88sedoheptulose-7-phosphate 1.04 0.53 1.11fructose 0.88 0.22 0.35sorbitol (isobar) 1.03 0.23 0.42maltohexaose 1.31 1.10 3.50maltopentaose 1.15 1.37 1.89maltose 1.02 0.90 3.02maltotetraose 1.13 1.23 2.28maltotriose 1.21 1.00 2.48glucose 1-phosphate 1.28 0.91 1.53
Sorbitol Pathway
Glycogen Metabolism
8 hrHeat map of metabolites detected in this study.
Fold Change
Glycolysis
Pentose Phosphate Pathway
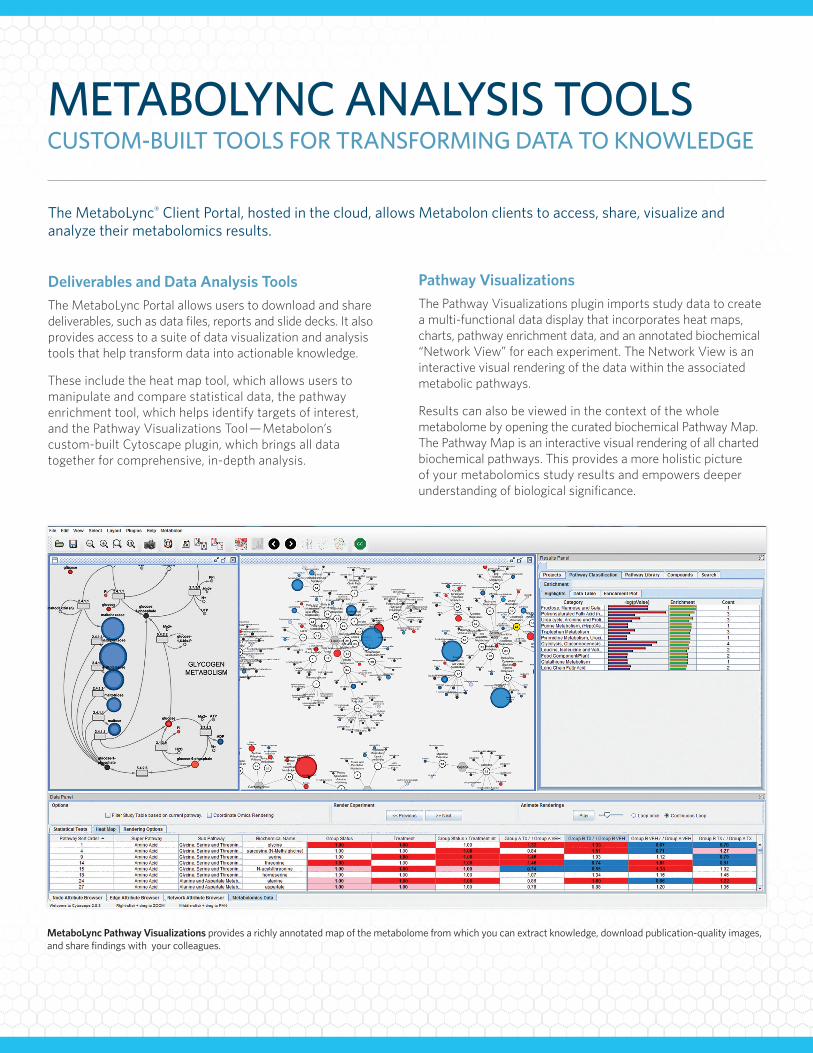
Deliverables and Data Analysis ToolsThe MetaboLync Portal allows users to download and share deliverables, such as data files, reports and slide decks. It also provides access to a suite of data visualization and analysis tools that help transform data into actionable knowledge.
These include the heat map tool, which allows users to manipulate and compare statistical data, the pathway enrichment tool, which helps identify targets of interest, and the Pathway Visualizations Tool—Metabolon’s custom-built Cytoscape plugin, which brings all data together for comprehensive, in-depth analysis.
The MetaboLync® Client Portal, hosted in the cloud, allows Metabolon clients to access, share, visualize and analyze their metabolomics results.
Pathway VisualizationsThe Pathway Visualizations plugin imports study data to create a multi-functional data display that incorporates heat maps, charts, pathway enrichment data, and an annotated biochemical “Network View” for each experiment. The Network View is an interactive visual rendering of the data within the associated metabolic pathways.
Results can also be viewed in the context of the whole metabolome by opening the curated biochemical Pathway Map. The Pathway Map is an interactive visual rendering of all charted biochemical pathways. This provides a more holistic picture of your metabolomics study results and empowers deeper understanding of biological significance.
MetaboLync Pathway Visualizations provides a richly annotated map of the metabolome from which you can extract knowledge, download publication-quality images, and share findings with your colleagues.
METABOLYNC ANALYSIS TOOLS CUSTOM-BUILT TOOLS FOR TRANSFORMING DATA TO KNOWLEDGE
CORPORATE HEADQUARTERSResearch Triangle Park, North Carolina
[email protected] COPYRIGHT © METABOLON, 2017. ALL RIGHTS RESERVED.