global oils & fats outlook - -forecasts on demand...
TRANSCRIPT

15 Jan 2014
Your Information Provider - - Independent, Unbiased, Authoritative - - Since 1958 © www.oilworld.de
there somebody to pick me up tomorrow at the airport
Global Oils & Fats Outlook - -Forecasts on Demand & Consumption
Presentation given at POTS in Tehran on 20 Jan 2014
Thomas Mielke, Executive Director of ISTA Mielke, Oil World, Global Market Research on Oilseeds, Oils and Meals,
E-mail <[email protected]>
15 Jan 2014
Your Information Provider - - Independent, Unbiased, Authoritative - - Since 1958 © www.oilworld.de
there somebody to pick me up tomorrow at the airport
§ ISTA Mielke GmbH – publisher of OIL WORLD - was founded in 1958 § ISTA = International STatistical Agricultural Information § Independent, not involved in trading § Leading private authority for global research and market analyses for
oilseeds, oils & fats and oilmeals § unbiased information on the past and current global supply, demand
and price developments as well as forecasts § Daily, weekly and monthly publications on www.oilworld.de
Company Profil and Services

15 Jan 2014
Your Information Provider - - Independent, Unbiased, Authoritative - - Since 1958 © www.oilworld.de
January 2003 until 14 Jan 20142003 2004 2005 2006 2007 2008 2009 2010 2011 2012 2013 14
200300400500600700800900
1000110012001300
Crude Palm Oil, cif Rott.10-year average (1998-2007)
Monthly Prices of Crude Palm Oil (US-$/T)Palm oil prices recovered by US $ 120 in the past 3 months until mid-Dec But declined by US $ 60 since What is the further price trend?
15 Jan 2014
Your Information Provider - - Independent, Unbiased, Authoritative - - Since 1958 © www.oilworld.de
Daily prices from 3 Jan 2012 until 14 Jan 2014Jan12 Mar Jun Aug Oct Jan13 Mar May Jly Sep Nov Jan14
700
800
900
1000
1100
1200
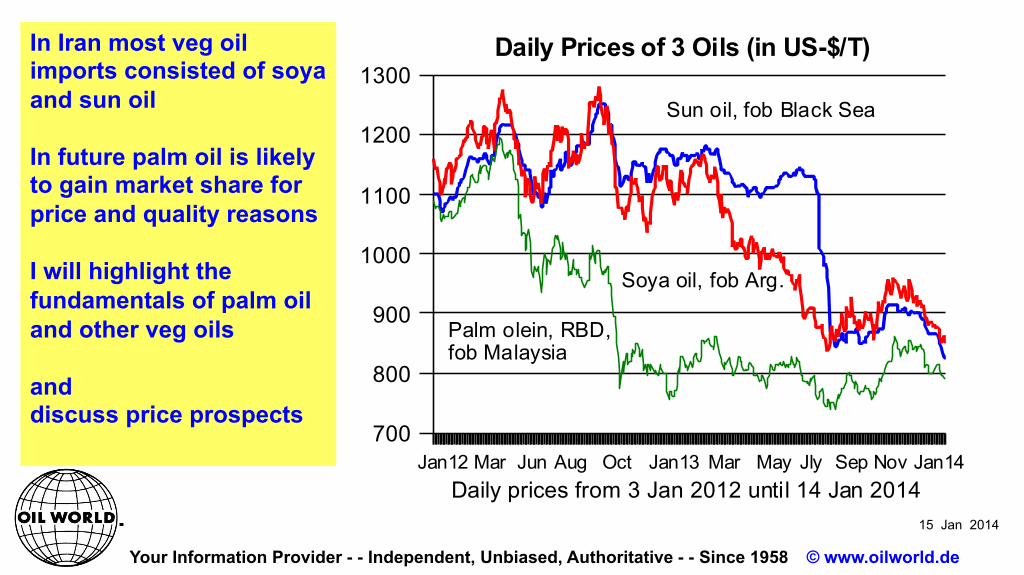
1300Daily Prices of 3 Oils (in US-$/T)
Sun oil, fob Black Sea
Soya oil, fob Arg.
Palm olein, RBD,fob Malaysia
In Iran most veg oil imports consisted of soya and sun oil In future palm oil is likely to gain market share for price and quality reasons I will highlight the fundamentals of palm oil and other veg oils and discuss price prospects
15 Jan 2014
Your Information Provider - - Independent, Unbiased, Authoritative - - Since 1958 © www.oilworld.de
there somebody to pick me up tomorrow at the airport
91/92 93/94 95/96 97/98 99/00 01/02 03/04 05/06 07/08 09/10 11/12 13/140
5
10
15
20
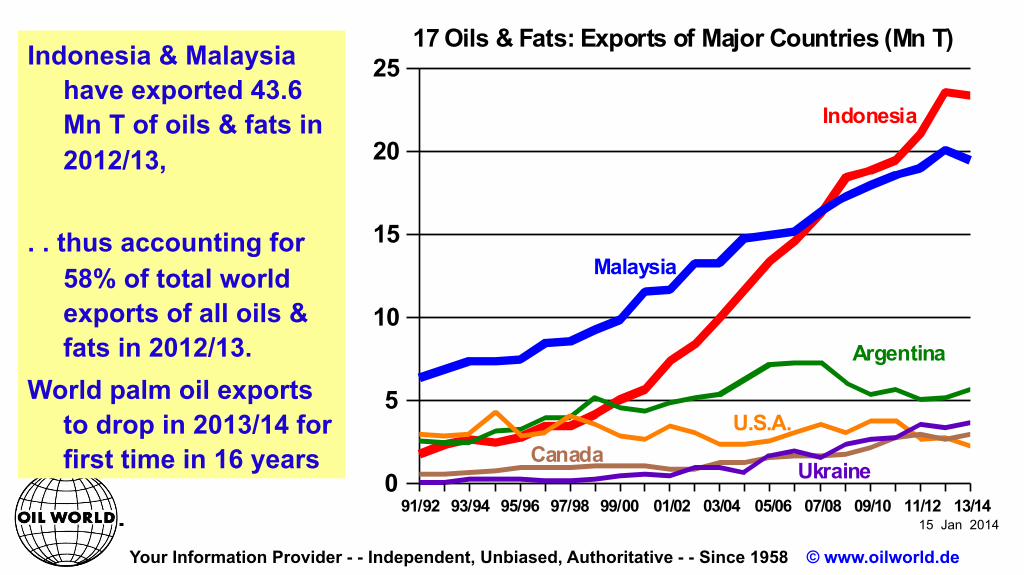
2517 Oils & Fats: Exports of Major Countries (Mn T)
Indonesia
Argentina
U.S.A.Canada
Ukraine
Malaysia
Indonesia & Malaysia have exported 43.6 Mn T of oils & fats in 2012/13,
. . thus accounting for 58% of total world exports of all oils & fats in 2012/13.
World palm oil exports to drop in 2013/14 for first time in 16 years
15 Jan 2014
Your Information Provider - - Independent, Unbiased, Authoritative - - Since 1958 © www.oilworld.de
The Impact from Oilseeds

15 Jan 2014
Your Information Provider - - Independent, Unbiased, Authoritative - - Since 1958 © www.oilworld.de
88/89 91/92 94/95 97/98 00/01 04/05 07/08 10/11 13/14140
180
220
260
300
340
380
420
460
500Production (Mn T)Area (Mn ha)
10 Oilseeds: World Area and ProductionIn past 25 years world oilseed production more than doubled (strong demand) Rising acreage and yields About half of the acreage increased came from grains. But this shift will slow down. Agricultural land has become a limiting factor worldwide, big potential in Russia + Braz Land values more than doubled in past 6 years

15 Jan 2014
Your Information Provider - - Independent, Unbiased, Authoritative - - Since 1958 © www.oilworld.de
Soybeans 58%
Rapeseed 14%
Sunflowerseed 8%
Cottonseed 9%
Groundnuts 6%
Copra & Palmkernels 4%
Other 3 Oilseeds 2%
2013/14 = 497 Mn T
Other ctries 15%
EU-28 6%
C.I.S. 7%
Canada & U.S.A. 24%
Brazil 19%
Argentina 12%
China 10%
India 8%
10 Oilseeds - - 497 Mn T
Global Production of 10 Oilseeds
15 Jan 2014
Your Information Provider - - Independent, Unbiased, Authoritative - - Since 1958 © www.oilworld.de
Trade Flows An increasing share of global import requirements is satisfied from a declining numbers of countries Logistics getting a constraint

15 Jan 2014
Your Information Provider - - Independent, Unbiased, Authoritative - - Since 1958 © www.oilworld.de
there somebody to pick me up tomorrow at the airport
89/90 92/93 95/96 98/99 01/02 04/05 07/08 10/11 13/1405
1015
202530
354045
10 OILSEEDS: Exports of Major Countries (Mn T)
U.S.A.
Oth. America
Brazil
CanadaAustralia
Ukraine
LOGISTICS ! In 13/14 USA and South America account for: - 80% of world exports of 10 oilseeds (131 Mn T) - 95% of world soybean exports (total 109 Mn T)
In 2020: Brazil + Arg will have to produce at least 162-167 Mn T of soybeans (vs 130 in 2013).

15 Jan 2014
Your Information Provider - - Independent, Unbiased, Authoritative - - Since 1958 © www.oilworld.de
Assuming normal weather in South America: Ample oilseed supplies ahead in 2013/14. Biggest increases in soybeans, sunflowerseed, rapeseed and palmkernels In 2013/14 world production seen surging by 28 Mn T and opening stocks up 8 Mn T, boosting world supplies by 36 Mn T - - > BEARISH !
10 OILSEEDS: World Production (Mn T)
13/14F 12/13 11/12 10/11
Avg.Change15 Yearsto 12/13
Soybeans . . . . 287.59* 267.12 240.69 264.93 +3.5%Cottonseed . . . 43.40* 45.04 47.17 43.55 +1.8%Grdnuts,shelled 28.77* 28.02 27.25 27.75 +2.1%Sunflowerseed 40.19* 35.57 39.51 33.60 +2.8%Rapeseed . . . . 69.09* 63.91 61.46 61.83 +4.5%
Sesameseed . . 3.93* 3.74 3.83 3.83 +2.3%Palmkernels . . 14.66* 13.92 13.30 12.54 +7.4%Copra . . . . . . . 5.33* 5.38 5.26 4.80 +0.4%Linseed . . . . . . 2.30* 2.01 2.13 1.82 -1.0%Castorseed . . . 1.37* 1.48 2.04 1.56 +0.7%Total. . . . . . . . 496.63* 466.19 442.64 456.20 +3.3%

15 Jan 2014
Your Information Provider - - Independent, Unbiased, Authoritative - - Since 1958 © www.oilworld.de
Soybean Prices Overvalued Relative to Fundamentals
Daily futures from 1 Aug 2013 until 14 Jan 2014Aug'13 Sep Oct Nov Dec Ja'14
1050
1100
1150
1200
1250
1300
1350
1400CBOT: Daily Soybean Futures (c/bu)
Jan 2014
May 2014
Nov 2014
Firmness in the nearby huge Chinese imports
US soybean exports frontloaded (84% already in Sep/Feb) US soybean stocks low

15 Jan 2014
Your Information Provider - - Independent, Unbiased, Authoritative - - Since 1958 © www.oilworld.de
75/76 81/82 87/88 93/94 99/00 05/06 13/140
20
40
60
80
100
120
140
160Soybean Crop Trend Since 74/75 (Mn T)
U.S.A.
Argentina, Brazil & Paraguay
Growing dependence on South America - - but supply risks owing to weather, strikes, infrastructure shortages + political issues (Argentina !) Record plantings should boost S. Amer. soybean output to a new high in early 2014 (up 14 Mn T) In 2013/14 S. American soya crop almost 70 Mn T above US crop ! Favorable crop outlook in Brazil, Paraguay & Uruguay. In Argentina renewed concern about dry weather in Jan (& Feb?)

15 Jan 2014
Your Information Provider - - Independent, Unbiased, Authoritative - - Since 1958 © www.oilworld.de
Limi$ng Factors – Inland Transport
In Argen(na and in Brazil truck remains the main form of transport from the farm to the port More expensive, more pollu(ng, and less efficient than barges and train
Brazil Argentina USABarges 7% 4% 61%Train 33% 13% 23%Trucks 60% 83% 16%Ave distance to Port in Km 950 300 980
Soybean Transportation Matrix

15 Jan 2014
Your Information Provider - - Independent, Unbiased, Authoritative - - Since 1958 © www.oilworld.de
Limi$ng Factors – Inland Transport
Bo?lenecks in Rosario area in Argen(na during April/May Roadblocks and protests further complicate inland transporta(on
Line of trucks wai$ng to unloading soybeans at Brazil’s ports created long wai(ng (me in March 2013 U$S/ton 152 freight cost to transport beans from Mato Grosso to Paranaguá

15 Jan 2014
Your Information Provider - - Independent, Unbiased, Authoritative - - Since 1958 © www.oilworld.de
EU-28C.I.S.
CanUSA
ArgBra
AustraliaIndia
China
-4
-2
0
2
4
6
8Annual Change from 2012/13 ( in Mn T)
10 Oilseeds: Estimated Production Change in 2013/14Significant improvement in production in most countries in 2013/14 Big increases in Argentina, Brazil and the C.I.S. India: Higher oilseed output in 2013/14; slowdown of veg. oil import needs; but some crop damage Major exception is China. Much higher import needs.
15 Jan 2014
Your Information Provider - - Independent, Unbiased, Authoritative - - Since 1958 © www.oilworld.de
92/93 95/96 98/99 01/02 04/05 07/08 10/11 13/140
10
20
30
40
50
60
70
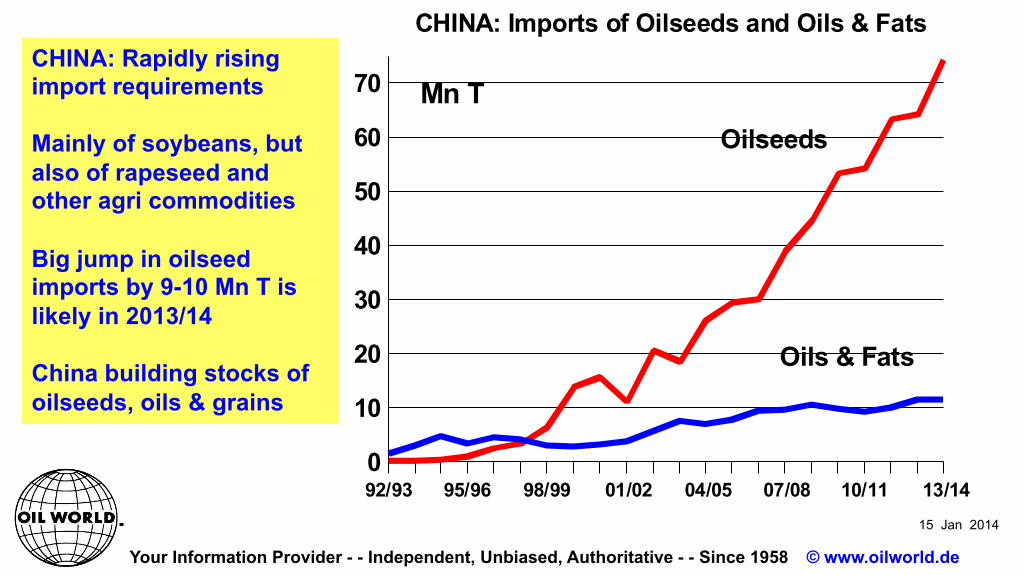
CHINA: Imports of Oilseeds and Oils & Fats
Mn T
Oils & Fats
Oilseeds
CHINA: Rapidly rising import requirements Mainly of soybeans, but also of rapeseed and other agri commodities Big jump in oilseed imports by 9-10 Mn T is likely in 2013/14 China building stocks of oilseeds, oils & grains

15 Jan 2014
Your Information Provider - - Independent, Unbiased, Authoritative - - Since 1958 © www.oilworld.de
O c t o b e r / S e p t e m b e r90/91
91/9292/93
93/9494/95
95/9696/97
97/9898/99
99/00 00/01
01/02 02/03
03/04 04/05
05/06 06/07
07/08 08/09
09/1010/11
11/1212/13
13/14F0
10
20
30
40
50
60
70
ChinaRest of world
Imports of Soybeans (Mn T)CHINA: to account for 64% of world soybean imports in 2013/14 Longer term: China set to import 90 Mn T of soybeans in 2020

15 Jan 2014
Your Information Provider - - Independent, Unbiased, Authoritative - - Since 1958 © www.oilworld.de
Rapeseed and Canola
15 Jan 2014
Your Information Provider - - Independent, Unbiased, Authoritative - - Since 1958 © www.oilworld.de
93/9494/95
95/9696/97
97/9898/99
99/0000/01
01/02 02/03
03/04 04/05
05/06 06/07
07/08 08/09
09/10 10/11
11/1212/13
13/14
152025303540455055606570
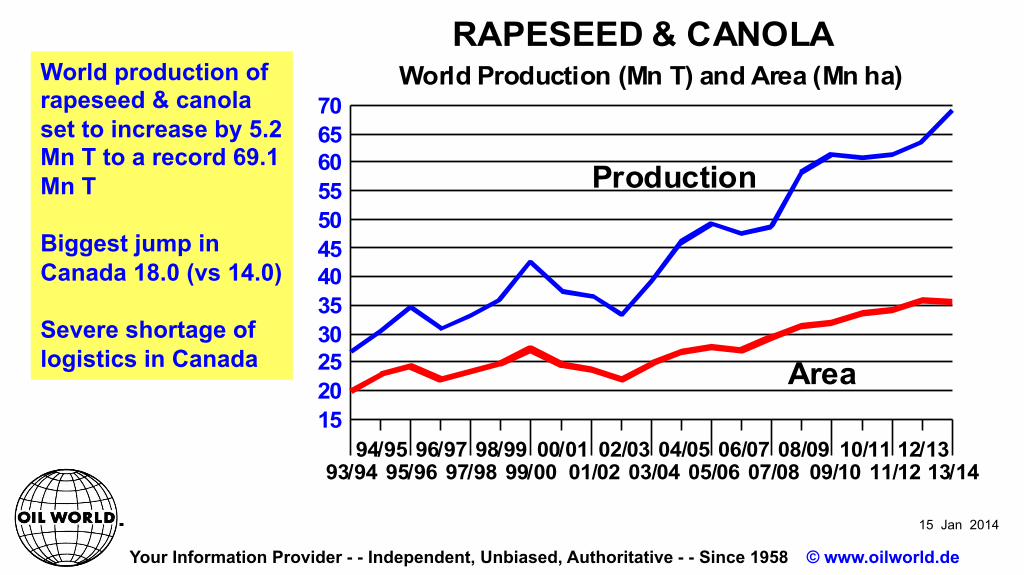
World Production (Mn T) and Area (Mn ha)RAPESEED & CANOLA
Production
Area
World production of rapeseed & canola set to increase by 5.2 Mn T to a record 69.1 Mn T Biggest jump in Canada 18.0 (vs 14.0) Severe shortage of logistics in Canada
15 Jan 2014
Your Information Provider - - Independent, Unbiased, Authoritative - - Since 1958 © www.oilworld.de
Prices from 1 Jan 2012 until 14 Jan 2014Jan12 Mar May Jly Sep Nov Jan13 Mar May Jly Sep Jan14360
385410435460485510535560585610635660685
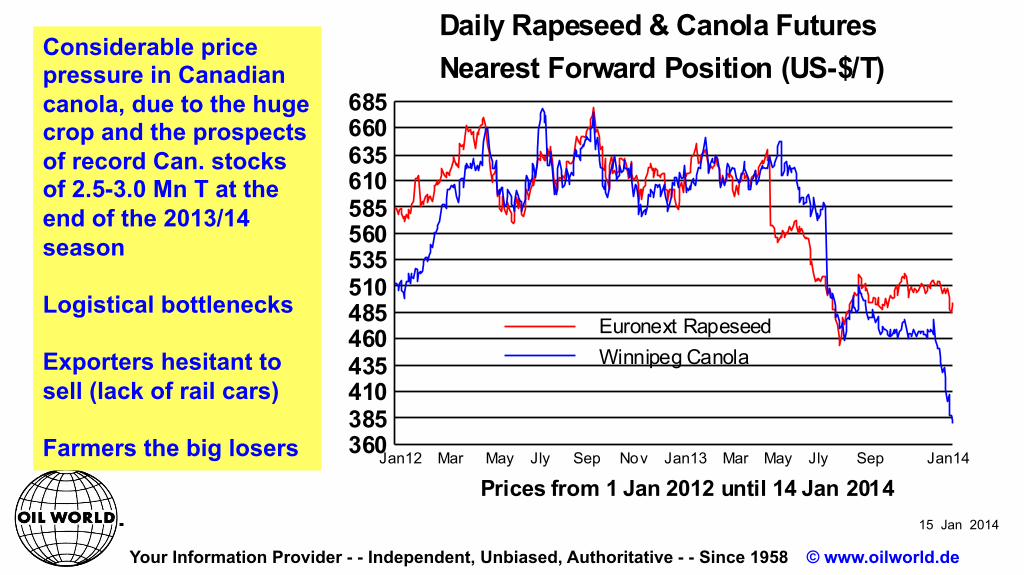
Euronext RapeseedWinnipeg Canola
Nearest Forward Position (US-$/T)Daily Rapeseed & Canola Futures
Considerable price pressure in Canadian canola, due to the huge crop and the prospects of record Can. stocks of 2.5-3.0 Mn T at the end of the 2013/14 season Logistical bottlenecks Exporters hesitant to sell (lack of rail cars) Farmers the big losers

15 Jan 2014
Your Information Provider - - Independent, Unbiased, Authoritative - - Since 1958 © www.oilworld.de
93/9494/95
95/9696/97
97/9898/99
99/0000/01
01/02 02/03
03/04 04/05
05/06 06/07
07/08 08/09
09/10 10/11
11/1212/13
13/14
1618202224262830323436384042
World Production (Mn T) and Area (Mn ha)SUNFLOWERSEED
Production
Area
In 2013/14 record crops of sunflowerseed
EU 8.6 Mn T (vs 7.1) Russia 9.5 Mn T (vs 8.0) Ukraine 10.0 Mn (vs 8.4) § World output up 4.7
Mn T - - creating price discounts

15 Jan 2014
Your Information Provider - - Independent, Unbiased, Authoritative - - Since 1958 © www.oilworld.de
95/96 97/98 99/00 01/02 03/04 05/06 07/08 09/1011/12 13/140
1,5
3
4,5
6
7,5
9
EU-28RussiaUkraineArgentina
October / SeptemberSunseed: Crushings in Key Countries (Mn T)
§ Argentine sunflowerseed crop only at 2.3-2.4 Mn T in early 2014
§ Argentine crush and sun oil export supplies much smaller than expected
15 Jan 2014
Your Information Provider - - Independent, Unbiased, Authoritative - - Since 1958 © www.oilworld.de
Daily prices from 3 Jan 2012 until 14 Jan 2014Jan12 Mar Jun Aug Oct Jan13 Mar May Jly Sep Nov Jan14
700
800
900
1000
1100
1200
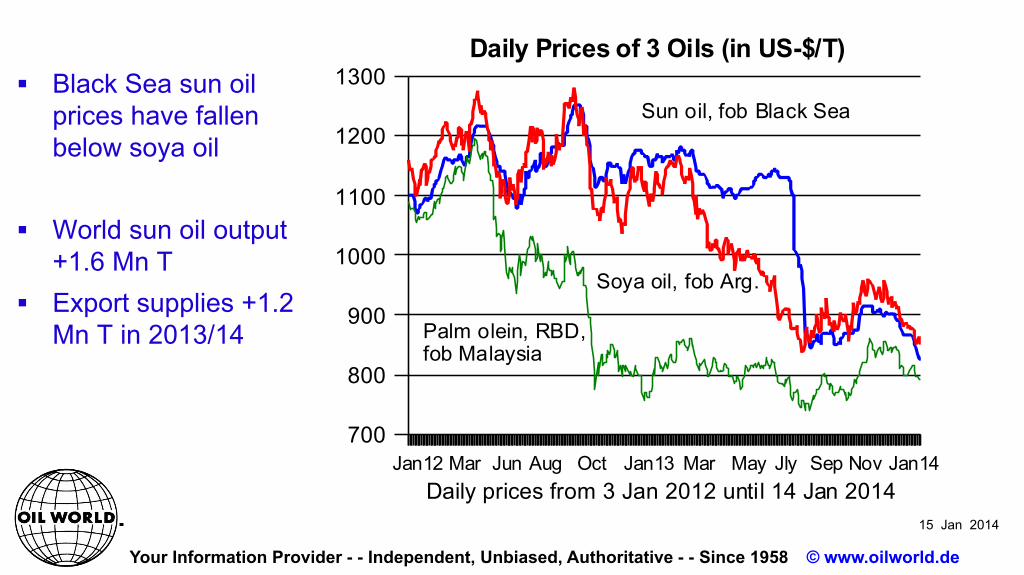
1300Daily Prices of 3 Oils (in US-$/T)
Sun oil, fob Black Sea
Soya oil, fob Arg.
Palm olein, RBD,fob Malaysia
§ Black Sea sun oil prices have fallen below soya oil
§ World sun oil output
+1.6 Mn T § Export supplies +1.2
Mn T in 2013/14
15 Jan 2014
Your Information Provider - - Independent, Unbiased, Authoritative - - Since 1958 © www.oilworld.de
99/00 01/02 03/04 05/06 07/08 09/10 11/12 13/140
200
400
600
800
1000
1200
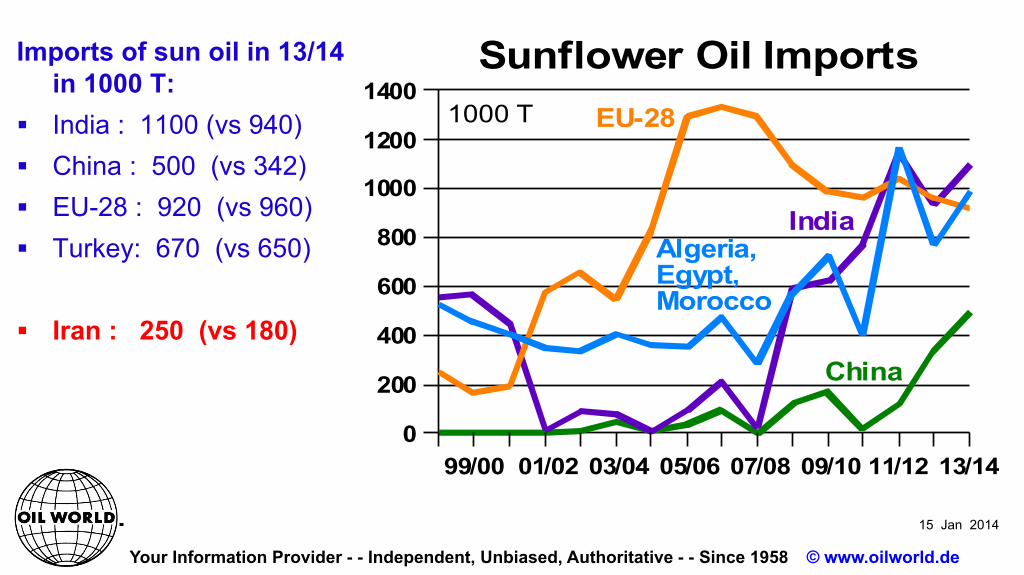
1400Sunflower Oil Imports
China
IndiaAlgeria,Egypt,Morocco
EU-281000 T
Imports of sun oil in 13/14 in 1000 T:
§ India : 1100 (vs 940) § China : 500 (vs 342) § EU-28 : 920 (vs 960) § Turkey: 670 (vs 650) § Iran : 250 (vs 180)

15 Jan 2014
Your Information Provider - - Independent, Unbiased, Authoritative - - Since 1958 © www.oilworld.de
The Impacts from Oilmeals
15 Jan 2014
Your Information Provider - - Independent, Unbiased, Authoritative - - Since 1958 © www.oilworld.de
From Oct 1997 until mid-Jan 2014'97'98 '99 '00 '01 '02 '03 '04 '05 '06'07 '08 '09 '10 '11 12 '13
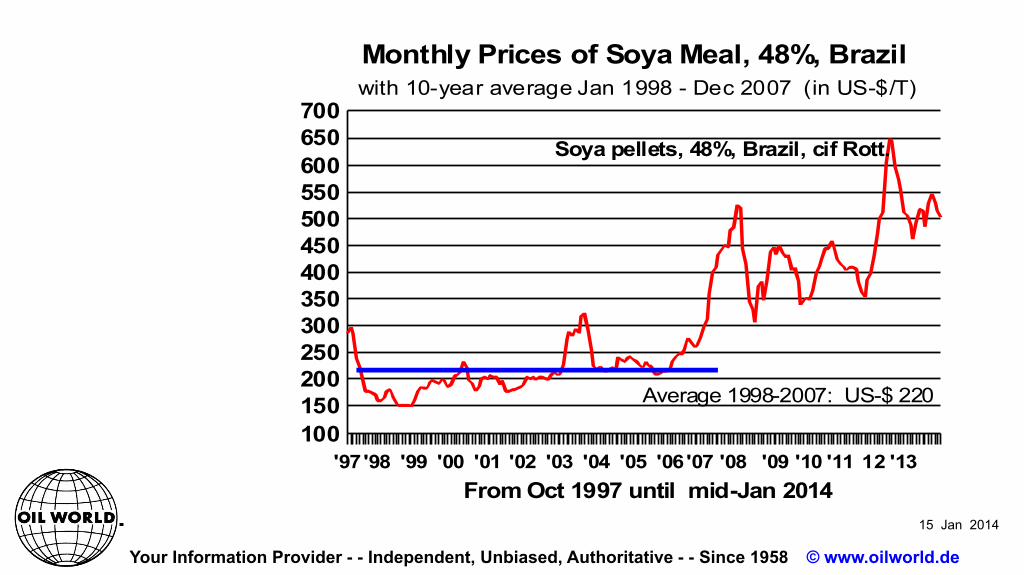
100150200250300350400450500550600650700
with 10-year average Jan 1998 - Dec 2007 (in US-$/T)Monthly Prices of Soya Meal, 48%, Brazil
Average 1998-2007: US-$ 220
Soya pellets, 48%, Brazil, cif Rott.

15 Jan 2014
Your Information Provider - - Independent, Unbiased, Authoritative - - Since 1958 © www.oilworld.de
92/93 95/96 98/99 01/02 04/05 07/08 10/11 13/140
50
100
150
200
250
300
350
400
450
-10
-5
0
5
10
15
20
25
30
35Total and Annual Change (Mn T)
10 Oilseeds : World Crushings
World Crushings
Annual change
15 Jan 2014
Your Information Provider - - Independent, Unbiased, Authoritative - - Since 1958 © www.oilworld.de
95/96 97/98 99/00 01/02 03/04 05/06 07/08 09/10 11/12 13/14708090
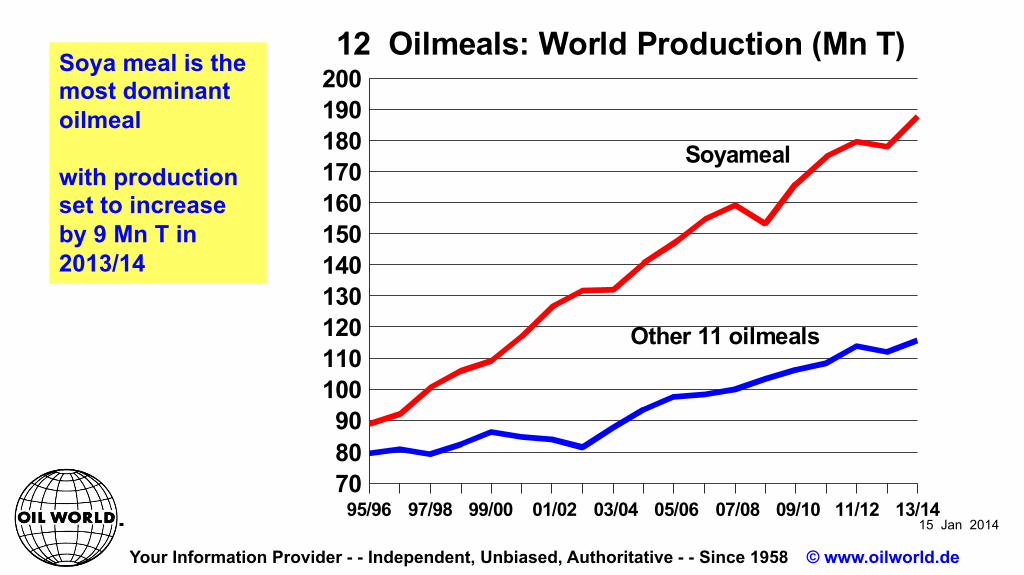
10011012013014015016017018019020012 Oilmeals: World Production (Mn T)
Other 11 oilmeals
Soyameal
Soya meal is the most dominant oilmeal with production set to increase by 9 Mn T in 2013/14

15 Jan 2014
Your Information Provider - - Independent, Unbiased, Authoritative - - Since 1958 © www.oilworld.de
'90'91
'92'93
'94'95
'96'97
'98'99
'00'01
'02'03
'04'05
'06'07
'08'09
'10'11
'12'13
'14 2020
00.5
11.5
22.5
33.5
44.5
55.5
66.5
Production Growing 7-10% AnnuallyINDIA: Production of Poultry Meat
Mn T

15 Jan 2014
Your Information Provider - - Independent, Unbiased, Authoritative - - Since 1958 © www.oilworld.de
The Outlook for Oils & Fats
15 Jan 2014
Your Information Provider - - Independent, Unbiased, Authoritative - - Since 1958 © www.oilworld.de
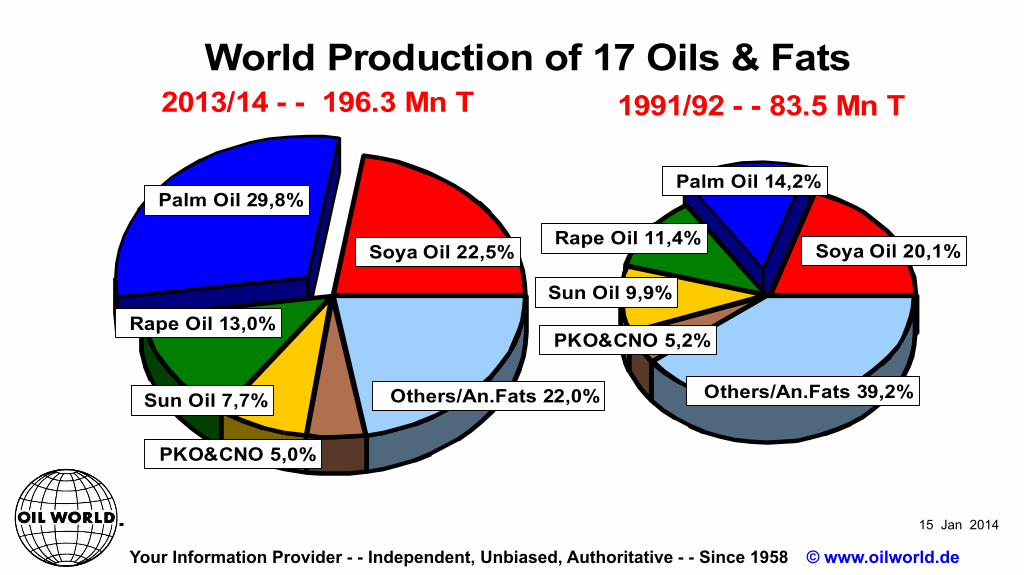
Soya Oil 22,5%
Palm Oil 29,8%
Rape Oil 13,0%
Sun Oil 7,7%
PKO&CNO 5,0%
Others/An.Fats 22,0%
2013/14 - - 196.3 Mn T
Soya Oil 20,1%
Palm Oil 14,2%
Rape Oil 11,4%
Sun Oil 9,9%
PKO&CNO 5,2%
Others/An.Fats 39,2%
1991/92 - - 83.5 Mn TWorld Production of 17 Oils & Fats

15 Jan 2014
Your Information Provider - - Independent, Unbiased, Authoritative - - Since 1958 © www.oilworld.de
91/92 93/94 95/96 97/98 99/00 01/02 03/04 05/06 07/08 09/10 11/12 13/1405
1015202530354045505560
17 Oils & Fats: World Production (Mn T)
Sun oil
Rape oil
Soya oil
Palm oil
9 Other oils4 Animal Fats
Palm oil has become the most important veg. oil worldwide Palm oil production was boosted by more than 4 times in the past 20 years from 14 Mn T in 1993/94 and is estimated to reach 58.5 Mn T in 2013/14, Thereof: Malaysia 19.7 Mn and Indonesia 29.8 Mn T

15 Jan 2014
Your Information Provider - - Independent, Unbiased, Authoritative - - Since 1958 © www.oilworld.de
World consumption of all oils & fats more than doubled in the latest 20 years to 188 Mn T in 12/13 Palm oil and Pkernel oil: annual growth rates were more than double of those of other oils & fats. Today both oils account worldwide for : - - 33% of consumption - - 63% of exports
98/99 01/02 04/05 07/08 10/11 13/140
50
100
150
200palm oil + palmkernel oil15 other oils & fats
World Consumption of 17 Oils & Fats
Mn T
Growing Dominance of Palm Oil & Palmkernel Oil Worldwide

15 Jan 2014
Your Information Provider - - Independent, Unbiased, Authoritative - - Since 1958 © www.oilworld.de
3,400 Ha of UP’s advanced planting materials yielded an average of 7.6 Tonnes of CPO per Ha

15 Jan 2014
Your Information Provider - - Independent, Unbiased, Authoritative - - Since 1958 © www.oilworld.de
3,8
4,5
0,53 0,51
1,31,6
Palm oil Soya oil Rape oil
0
1
2
3
4
5Vegetable Oil Output per ha
Indonesia
Malaysia
U.S.A. Brazil
EU
T/ha
Germany
Source: ISTA Mielke GmbH, OIL WORLD
Palm oil yields per ha are much above soya and rape oils
15 Jan 2014
Your Information Provider - - Independent, Unbiased, Authoritative - - Since 1958 © www.oilworld.de
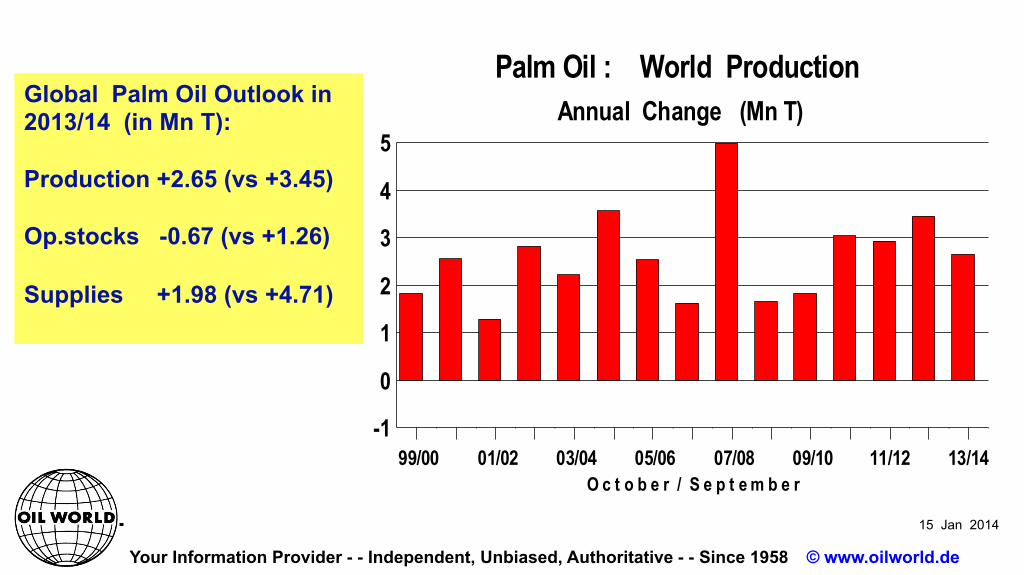
O c t o b e r / S e p t e m b e r 99/00 01/02 03/04 05/06 07/08 09/10 11/12 13/14
-1
0
1
2
3
4
5Annual Change (Mn T)
Palm Oil : World Production Global Palm Oil Outlook in 2013/14 (in Mn T): Production +2.65 (vs +3.45) Op.stocks -0.67 (vs +1.26) Supplies +1.98 (vs +4.71)

15 Jan 2014
Your Information Provider - - Independent, Unbiased, Authoritative - - Since 1958 © www.oilworld.de
O c t o b e r / S e p t e m b e r 03/04 05/06 07/08 09/10 11/12 13/14
0
2
4
6
8
10
12
14Production Consumption
Growth Rates in % Palm Oil : World Output and Consumption

15 Jan 2014
Your Information Provider - - Independent, Unbiased, Authoritative - - Since 1958 © www.oilworld.de
Rising Dependence on Palm Oil
97/98 99/00 01/02 03/04 05/06 07/08 09/10 11/12 13/140
5
10
15
20
25
30
35
40
45Soy, Rape, Sun Oils4 Animal FatsPalm Oil 9 Other
World Exports in Mn T17 Oils & Fats
1997/98 - 2012/13: § Palm oil exports (blue line)
almost quadrupled § Exports of all 16 other
oils & fats + 48%
In Oct/Sept 2013/14: § Palm oil exports (blue line)
are set for the 1st year-on-year decline in 16 years
§ Combined exports of soya, sun & rapeseed oils (red) are likely to reach a record

15 Jan 2014
Your Information Provider - - Independent, Unbiased, Authoritative - - Since 1958 © www.oilworld.de
there somebody to pick me up tomorrow at the airport
2011/12 2012/13 2013/14A/J J/S O/D J/M A/J J/S O/D J/M A/J J/S O/D J/M
-1000
-500
0
500
1000
1500Change from year ago (in 1000 T)
PALM OIL: Quarterly World Imports
15 Jan 2014
Your Information Provider - - Independent, Unbiased, Authoritative - - Since 1958 © www.oilworld.de
there somebody to pick me up tomorrow at the airport
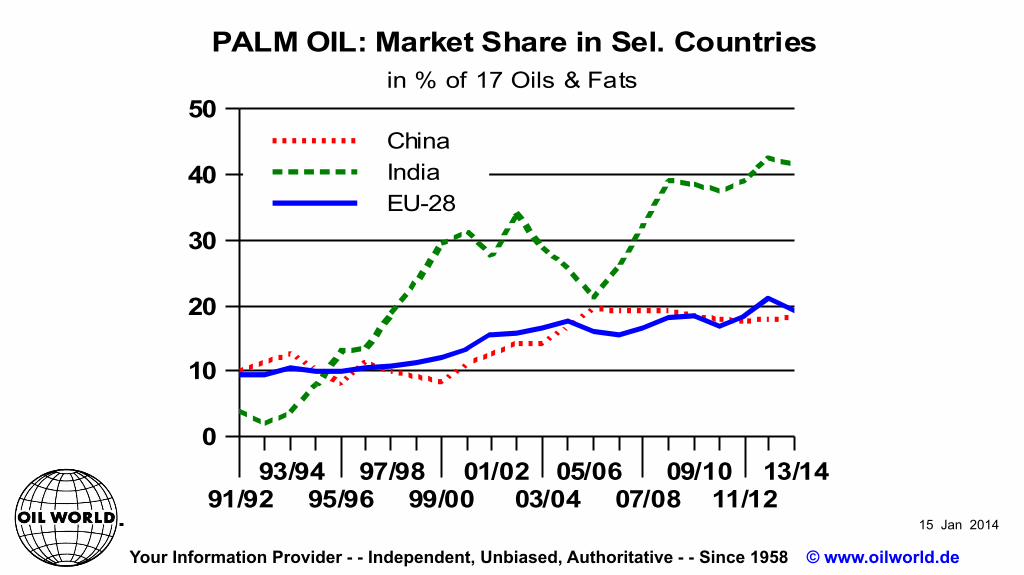
91/9293/94
95/9697/98
99/00 01/02
03/04 05/06
07/08 09/10
11/1213/14
0
10
20
30
40
50ChinaIndiaEU-28
in % of 17 Oils & FatsPALM OIL: Market Share in Sel. Countries

15 Jan 2014
Your Information Provider - - Independent, Unbiased, Authoritative - - Since 1958 © www.oilworld.de
there somebody to pick me up tomorrow at the airport
The Success Story of the past 30 Years § Substantial growth in world production of palm oil § In 1980: 4.6 Mn T or 8% of 17 oils & fats § In 1990: 11.0 Mn T or 14% § In 2000: 21.9 Mn T or 19% § In 2010: 46.1 Mn T or 27% (only 6% of area)
§ In 2011: 50.8 Mn T or 28% (57% of exports) § In 2012: 53.7 Mn T (plus 5.9 Mn T of Palmkern oil) § In 2013: 56.1 Mn T § In 2020 at least 78 Mn T of palm oil required

15 Jan 2014
Your Information Provider - - Independent, Unbiased, Authoritative - - Since 1958 © www.oilworld.de
Price Prospects
15 Jan 2014
Your Information Provider - - Independent, Unbiased, Authoritative - - Since 1958 © www.oilworld.de
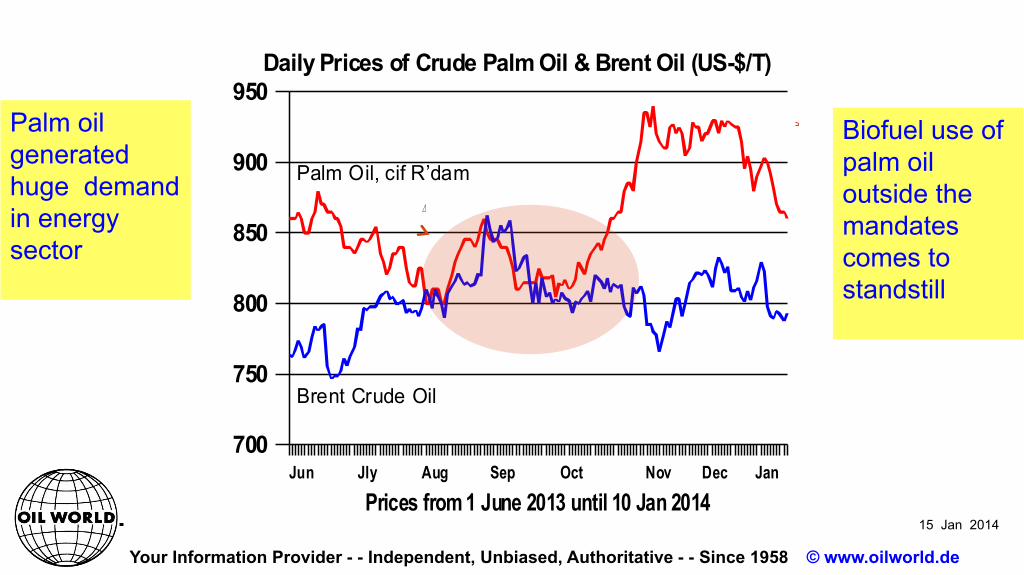
Prices from 1 June 2013 until 10 Jan 2014Jun Jly Aug Sep Oct Nov Dec Jan
700
750
800
850
900
950Daily Prices of Crude Palm Oil & Brent Oil (US-$/T)
Brent Crude Oil
Palm Oil, cif R’dam
Palm oil generated huge demand in energy sector
Biofuel use of palm oil outside the mandates comes to standstill
15 Jan 2014
Your Information Provider - - Independent, Unbiased, Authoritative - - Since 1958 © www.oilworld.de
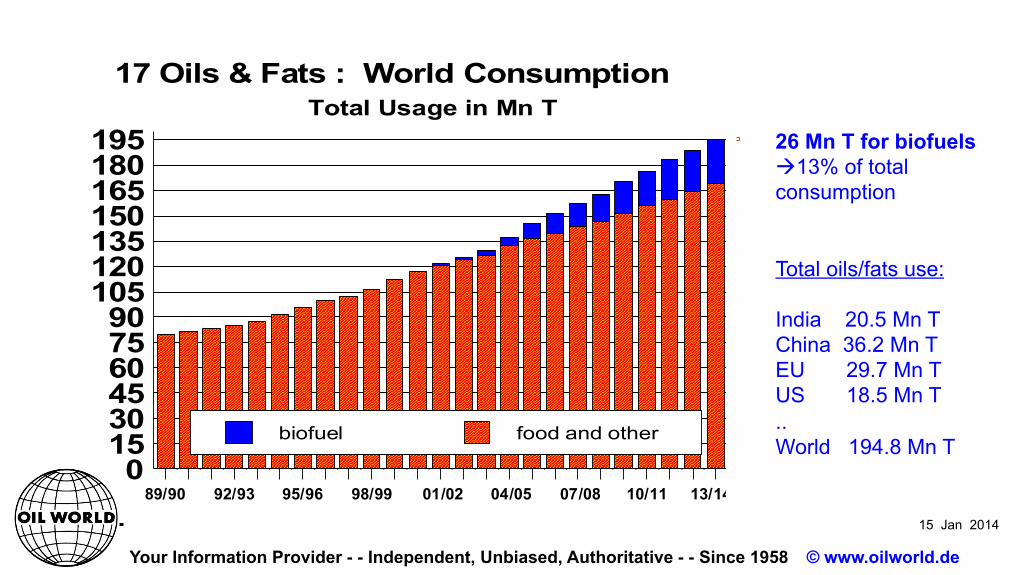
89/90 92/93 95/96 98/99 01/02 04/05 07/08 10/11 13/14 0
153045607590
105120135150165180195
biofuel food and other
Total Usage in Mn T17 Oils & Fats : World Consumption
26 Mn T for biofuels à 13% of total consumption
Total oils/fats use: India 20.5 Mn T China 36.2 Mn T EU 29.7 Mn T US 18.5 Mn T .. World 194.8 Mn T

15 Jan 2014
Your Information Provider - - Independent, Unbiased, Authoritative - - Since 1958 © www.oilworld.de
In Mn T 13/14 12/13 11/12 10/11 China +1.00 +1.10 +1.04 +1.09
India +0.90 +0.87 +0.75 +0.48
EU -0.30 +0.26 -0.33 -0.87 U.S.A. +0.10 +0.49 +1.19 +0.90
Argentina +0.10 -0.93 +0.53 +0.55
Brazil +0.76 +0.04 +0.15 +0.60
Indonesia +1.50 +1.00 +0.99 +1.02
Others +2.34 +2.39 +2.47 +2.49
World +6.40 +5.22 +6.79 +6.26 CPO, $/T 900-950 835 1053 1150
17 Oils & Fats: Consumption Growth
2014 2013
10% 8%
7% 5%
10%
Rising biodiesel mandates

15 Jan 2014
Your Information Provider - - Independent, Unbiased, Authoritative - - Since 1958 © www.oilworld.de
J a n u a r y 1 2010 2011 2012 2013 2014
012345678 Indo PO
Mal POUS SBO
Veg. Oil Stocks in Key Countries
● Stocks of palm oil in Malaysia/Indonesia and of soya oil in US reduced sharply in 2013... ● But China replenished veg. oil stocks – probably curbing Chinese import requirements in 2013/14...
15 Jan 2014
Your Information Provider - - Independent, Unbiased, Authoritative - - Since 1958 © www.oilworld.de
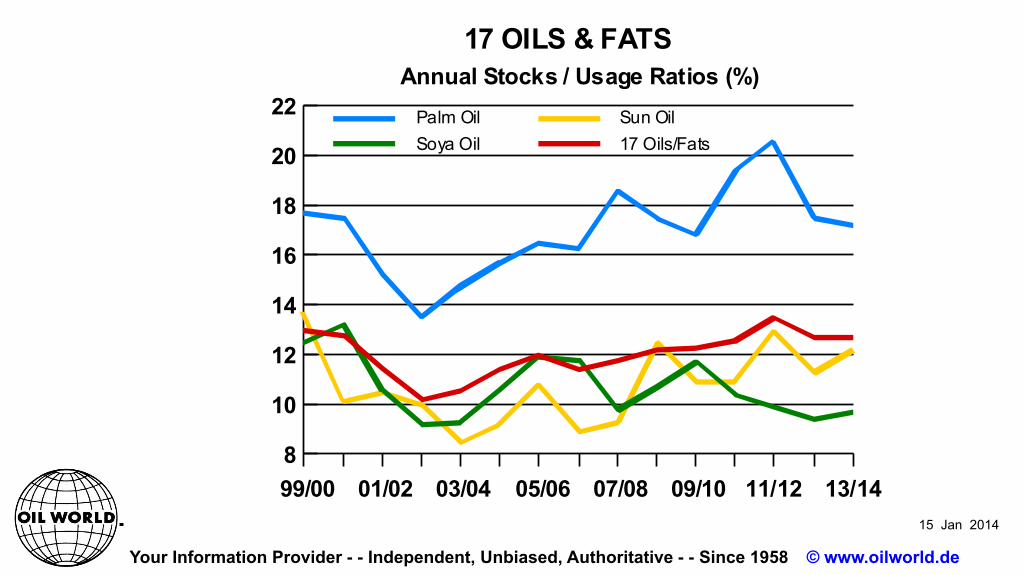
99/00 01/02 03/04 05/06 07/08 09/10 11/12 13/148
10
12
14
16
18
20
22 Palm Oil Sun OilSoya Oil 17 Oils/Fats
Annual Stocks / Usage Ratios (%)17 OILS & FATS
15 Jan 2014
Your Information Provider - - Independent, Unbiased, Authoritative - - Since 1958 © www.oilworld.de
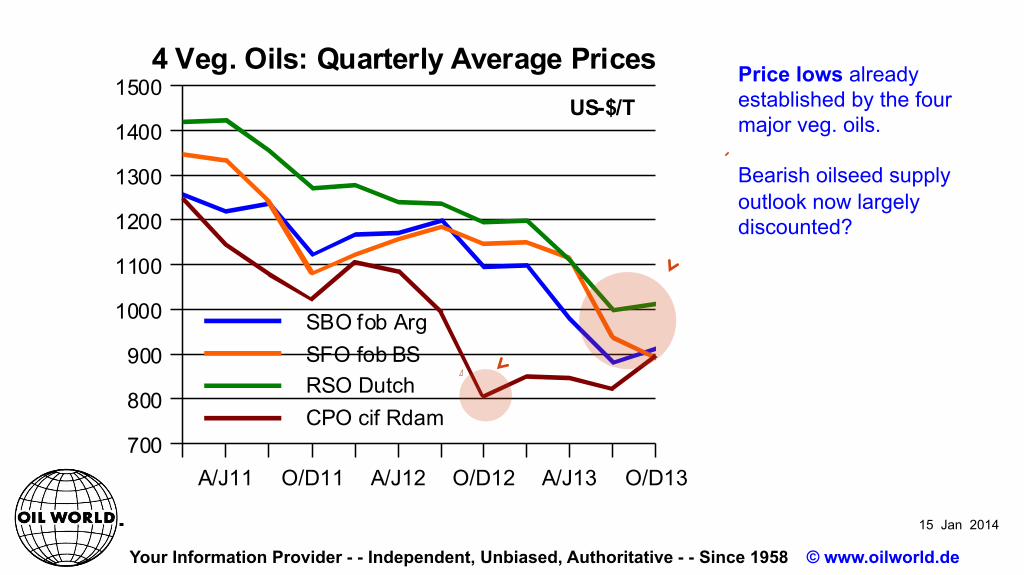
A/J11 O/D11 A/J12 O/D12 A/J13 O/D13700
800
900
1000
1100
1200
1300
1400
1500
SBO fob ArgSFO fob BSRSO DutchCPO cif Rdam
4 Veg. Oils: Quarterly Average PricesUS-$/T
Price lows already established by the four major veg. oils. Bearish oilseed supply outlook now largely discounted?

15 Jan 2014
Your Information Provider - - Independent, Unbiased, Authoritative - - Since 1958 © www.oilworld.de
A/J11 O/D11 A/J12 O/D12 A/J13 O/D13 J/J14700
800
900
1000
1100
1200
1300
1400
1500
SBO fob ArgSFO fob BSRSO DutchCPO cif Rdam
4 Veg. Oils: Quarterly Average PricesUS-$/T $/T vs OD Av. Jan/June14 O/D13 J/S13
SBO fob Arg
+4% 960* 930-990 917 883
CPO cif Rdm
+5% 945* 920-970 897 827
SFO fob BS
+3% 920* 890-950 893 940
RSO Dutch
+2% 1040* 1020-1060 1016 1001

15 Jan 2014
Your Information Provider - - Independent, Unbiased, Authoritative - - Since 1958 © www.oilworld.de
Monthly prices from Jan 2011 until 12 Dec 2013Jan'11 Jan'12 Jan'13 Dec
500
1000
1500
2000
2500
Palm oil crude, cif N.W. EurPalm olein RBD, Mal, fobPalmkern oil,Mal/Indo,cif RottCoconut oil,Phil/Indo,cif Rott
Monthly Prices of 4 Veg. Oils (US-$/T)
Widening premium of lauric oil prices

15 Jan 2014
Your Information Provider - - Independent, Unbiased, Authoritative - - Since 1958 © www.oilworld.de
§ First of all, there is a volume problem that needs to be solved globally in soybeans and products, other oilseeds, oils, meals and grains
§ Limitation of land and water § More focus to raise yields. (They stayed behind
expectations in the past 10 years.) GMO needed § A small numbers of countries provide supplies § Higher investments to improve logistics § Oil and meal demand strong (food + biofuels)
In the longer term
15 Jan 2014
Your Information Provider - - Independent, Unbiased, Authoritative - - Since 1958 © www.oilworld.de
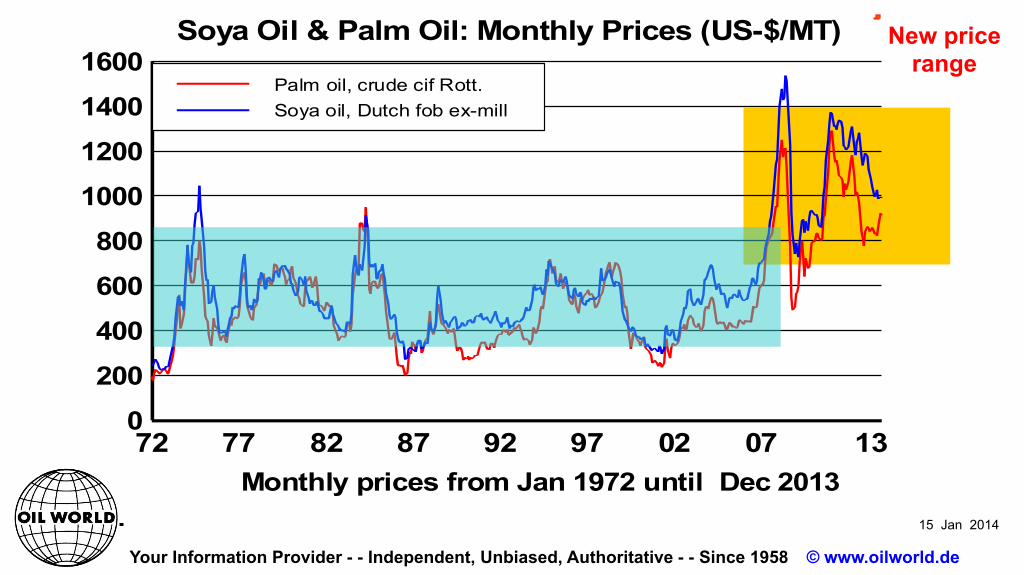
Monthly prices from Jan 1972 until Dec 201372 77 82 87 92 97 02 07 13
0
200
400
600
800
1000
1200
1400
1600Palm oil, crude cif Rott.Soya oil, Dutch fob ex-mill
Soya Oil & Palm Oil: Monthly Prices (US-$/MT)
New price range

15 Jan 2014
Your Information Provider - - Independent, Unbiased, Authoritative - - Since 1958 © www.oilworld.de
Thank You for Your Kind Attention !
If I can be of assistance to you in the future, you are invited to contact me any time.
More details and background information are given in the Oil World Weekly & Monthly Reports, which can all be obtained from the
Internet.

15 Jan 2014
Your Information Provider - - Independent, Unbiased, Authoritative - - Since 1958 © www.oilworld.de
there somebody to pick me up tomorrow at the airport