global report on drowning - who | world … report on drowning iii foreword every hour of every day...
TRANSCRIPT

GLOBAL REPORT ON DROWNINGPREVENTING A LEADING KILLER


Made possible by funding from
Bloomberg Philanthropies
GLOBAL REPORT ON DROWNINGPREVENTING A LEADING KILLER

WHO Library Cataloguing-in-Publication Data :
Global report on drowning: preventing a leading killer.
1.Drowning – prevention and control. 2.Drowning – mortality. 3.Health Policy. 4.National Health Programs. 5.Safety Management. I.World Health Organization.
ISBN 978 92 4 156478 6 (NLM classification: WA 292)
© World Health Organization 2014
All rights reserved. Publications of the World Health Organization are available on the WHO website (www.who.int) or can be purchased from WHO Press, World Health Organization, 20 Avenue Appia, 1211 Geneva 27, Switzerland (tel.: +41 22 791 3264; fax: +41 22 791 4857; e-mail: [email protected]).
Requests for permission to reproduce or translate WHO publications – whether for sale or for non-commercial distribution – should be addressed to WHO Press through the WHO website (www.who.int/about/licensing/copyright_form/en/index.html).
The designations employed and the presentation of the material in this publication do not imply the expression of any opinion whatsoever on the part of the World Health Organization concerning the legal status of any country, territory, city or area or of its authorities, or concerning the delimitation of its frontiers or boundaries. Dotted and dashed lines on maps represent approximate border lines for which there may not yet be full agreement.
The mention of specific companies or of certain manufacturers’ products does not imply that they are endorsed or recommended by the World Health Organization in preference to others of a similar nature that are not mentioned. Errors and omissions excepted, the names of proprietary products are distinguished by initial capital letters.
All reasonable precautions have been taken by the World Health Organization to verify the information contained in this publication. However, the published material is being distributed without warranty of any kind, either expressed or implied. The responsibility for the interpretation and use of the material lies with the reader. In no event shall the World Health Organization be liable for damages arising from its use.
Printed in Spain.

GLOBAL REPORT ON DROWNING I
CONTENTS
FOREWORD iii
CONTRIBUTORS iv
ACKNOWLEDGEMENTS iv
ABBREVIATIONS v
EXECUTIVE SUMMARY vii
INTRODUCTION 1
SECTION 1 DROWNING – A NEGLECTED PUBLIC HEALTH ISSUE 3
SECTION 2 TEN ACTIONS TO PREVENT DROWNING 18
SECTION 3 CONCLUSION AND RECOMMENDATIONS 41 APPENDIX 1 PREVENTING DROWNING – FURTHER READING AND RESOURCES 44
APPENDIX 2 DATA 49

ii

GLOBAL REPORT ON DROWNING iii
FOREWORD
Every hour of every day more than 40 people lose their lives to drowning. Whether it is small children slipping unnoticed into a pond, pool or well; adolescents swimming under the influence of alcohol or drugs; passengers on vessels that capsize; or residents of coastal communities struck by floods, the daily toll of this leading global killer continues its quiet rise.
The Global report on drowning is the first World Health Organization report dedicated exclusively to drowning – a highly preventable public health challenge that has never been targeted by a global strategic prevention effort. This report aims to change this. It sets out current knowledge about drowning and drowning prevention, and calls for a substantial scaling up of comprehensive efforts and resources to reduce what is an intolerable death toll, particularly among children and adolescents.
While drowning is a leading cause of death worldwide, particularly in low- and middle-income countries, prevention is possible. Evidence shows that a range of interventions are effective at preventing drowning. Among others, these include the strategic use of barriers to control access to water, provision of safe places such as day care centres for pre-school children, and teaching school-age children basic swimming skills. Progress in other areas called for in this report includes better and more integrated flood risk management; improved boating, shipping and ferry regulations; and development of national water safety policies.
Advances in many of these areas are feasible for low- and middle-income countries, although they will need political will and technical support to achieve them. Some interventions, such as day care centres, provide benefits beyond drowning prevention.
Drowning also has important intersections with a range of major agendas, including climate change; mass migration, including of asylum seekers; and child and adolescent health. The multisectoral nature of drowning prevention demands improved coordination across various agendas and sectors.
While there is much to learn about drowning and drowning prevention, we must take proven, preventive action while research continues. This means urgently targeting vulnerable populations in exposed communities with strategies most likely to save lives.
Drowning has a similar burden today as diseases such as diarrhoea and measles in the 1970s and 1980s. These were daunting challenges that nonetheless were made the subject of concerted prevention efforts by national governments, nongovernmental organizations and international bodies. This approach can be successful today to reduce the global drowning burden.
Margaret ChanDirector-General, World Health Organization

IV
CONTRIBUTORS
EDITORIAL GUIDANCE
Editorial committeeDavid MeddingsAdnan A HyderJoan Ozanne-SmithAminur Rahman
Executive editorDavid Meddings
Advisory committeeStephen BeermanJoost BierensLauren S BlumAnuradha BoseChristine M BrancheRuth BrennerAlfredo CelisRichard C FranklinJonathan P GuevarraOlive KobusingyeMichael LinnanKevin MoranLinda QuanAKM Fazlur RahmanFrederick RivaraJustin ScarrGordon S Smith
The World Health Organization would like to thank the members of the Editorial and Advisory committees whose contributions and peer review made the Global report on drowning possible.
The report also benefited from the contributions and review of a number of other people. In particular, acknowledgement is made to Angela Burton, who edited the report. Additional input and thoughtful reviews were contributed by Grant Baldwin, Jonathon Passmore and Carolyn Staines. Rebecca Bavinger, Jennifer Ellis, Kelly Henning and Kelly Larson from Bloomberg Philanthropies also contributed thoughtful reviews. Comments and contributions were also received from Erin Cassell, Milhar Fuazudeen, John Harding, Ashok Mahapatra, José Riera, Sumbul Rizvi, Katja Rytkoenen and Cecilia Scharp.
Other WHO staff who contributed to the report include Jonathan Abrahams, Rudi Coninx, Richard Johnston, Hyo-Jeong Kim, Etienne Krug, Rachel Mackenzie, Doris Ma Fat, Colin Mathers, Margie Peden and Florence Rusciano.
Finally the World Health Organization wishes to thank Bloomberg Philanthropies for its generous financial support for the development and publication of this report.
ACKNOWLEDGEMENTS
iv

GLOBAL REPORT ON DROWNING v
CPR Cardiopulmonary resuscitationICD International Classification of DiseasesIMO International Maritime OrganizationILS International Life Saving FederationNGO Nongovernmental organizationUNHCR United Nations High Commissioner for RefugeesUNICEF United Nations Children’s FundUNISDR United Nations Office for Disaster Risk ReductionWHO World Health Organization
REGIONS OF THE WORLD HEALTH ORGANIZATIONAFRO African RegionAMRO Region of the AmericasEMRO Eastern Mediterranean RegionEURO European RegionSEARO South-East Asia RegionWPRO Western Pacific Region
ABBREVIATIONS

VI

GLOBAL REPORT ON DROWNING vii
EXECUTIVE SUMMARYDrowning is a serious and neglected public health threat claiming the lives of 372 000 people a year worldwide.
More than 90% of these deaths occur in low- and middle-income countries.
This death toll is almost two thirds that of malnutrition and well over half that of malaria – but unlike these public health challenges, there are no broad prevention efforts that target drowning.

While this report addresses drowning across all countries and ages, the particularly high incidence of drowning in low- and middle-income countries and among children and young people makes these countries and groups a central focus.
OUR MESSAGE: PREVENTION IS VITAL
Once someone starts to drown, the outcome is often fatal. Unlike other injuries, survival is determined almost exclusively at the scene of the incident, and depends on two highly variable factors: how quickly the person is removed from the water, and how swiftly proper resuscitation is performed. Prevention, therefore, is vital.
SECTION 1 DROWNING – A NEGLECTED PUBLIC HEALTH ISSUE
GLOBAL BURDENAlarmingly, drowning is among the 10 leading causes of death of children and young people in every region of the world, with children aged under 5 years disproportionately at risk and males twice as likely to drown as females. Over half of casualties are aged under 25 years. Income levels also have an impact – the overwhelming majority of drownings happen in low- and middle-income countries where people have close daily contact with water for work, transport and agriculture.
LIMITATIONS OF DATAData collection in many low- and middle-income countries is limited, hampering the planning, implementation and monitoring of drowning prevention measures. In addition, the way deaths are classified means the full extent of the world’s drowning problem is underrepresented – statistics currently exclude intentional drowning (for example, suicide and homicide), as well as drowning deaths resulting from flood disasters and water transport incidents.1 Data on non-fatal drownings, which could reveal something about the burden of serious injury and lifelong disability, are not routinely collected.
KEY RISK FACTORSLack of barriers controlling exposure to water bodies and lack of adequate, close supervision for infants and young children are a drowning risk, as are poor swim skills and low awareness of water dangers. In addition, high-risk behaviour, including consuming alcohol while engaging with water, is a risk among young people and adults. Other risk factors are transport on water and water crossings, lack of safe water supply, and flood disasters.
viii EXECUTIVE SUMMARY
1 Using the International Classification of Diseases (ICD) 10, WHO’s global drowning mortality estimates are based only on deaths where drowning is classified as the external cause of death (i.e. where drowning was the event that caused the death – for example, a child drowning in a well), and not those where drowning was only the consequence of another classified external cause of death (e.g. transport incident, suicide, homicide, flood disaster, etc.).
EXECUTIVE SUMMARY

GLOBAL REPORT ON DROWNING ix
SECTION 2 TEN ACTIONS TO PREVENT DROWNING
High-income countries have reduced their drowning burden and some of the strategies used have been successfully adapted in low- and middle-income settings. Based on available evidence, Section 2 sets out 10 actions that can help prevent drowning.
COMMUNITY-BASED ACTION
1. Install barriers controlling access to water.
2. Provide safe places (for example, a crèche2) away from water for pre-school children, with capable child care.
3. Teach school-age children basic swimming, water safety and safe rescue skills.
4. Train bystanders in safe rescue and resuscitation.
5. Strengthen public awareness of drowning and highlight the vulnerability of children.
EFFECTIVE POLICIES AND LEGISLATION
6. Set and enforce safe boating, shipping and ferry regulations.
7. Build resilience and manage flood risks and other hazards locally and nationally.
8. Coordinate drowning prevention efforts with those of other sectors and agendas.
9. Develop a national water safety plan.
FURTHER RESEARCH
10. Address priority research questions with well-designed studies.
SECTION 3 CONCLUSION AND RECOMMENDATIONS
Drowning is an important public health issue with major impacts on children and youth. Drowning is preventable. Proven strategies implemented at household, community and national level range from teaching basic swim skills and installing barriers that control exposure to water hazards, to providing safe spaces for children such as crèches and learning about safe rescue. Tailored to individual settings and risk groups, countries should take steps to improve data on drowning mortality and morbidity, and establish a national water safety plan.
Drowning is a multisectoral issue. Drowning prevention strategies have much in common with other public health agendas including safe water supply, rural development, disaster risk management and child health. More must be done to maximize these synergies – for example, village-based day care for pre-school children not only provides the early child development benefits associated with day care, it also prevents drowning and provides employment. Likewise, drowning risks could become a more clearly stated consideration of disaster risk management efforts in settings where flood disasters occur.
Given the multisectoral nature of drowning, a global partnership for drowning prevention should be established in order to serve as a policy and implementation leadership community for the issue of drowning prevention.
In summary, donors and governments must prioritize drowning prevention, and its integration with other public health agendas.
2 A crèche – also referred to as day care or a day care centre – is a place where young children are cared for during the day, usually while their parents are working.

DROWNING: A DEFINITION
The definition of drowning used in this report is that adopted at the first World Congress on Drowning (2002):
“The process of experiencing respiratory impairment from submersion/immersion in liquid.”
x

GLOBAL REPORT ON DROWNING 1
INTRODUCTIONThere needs to be much more national and international attention focused on drowning, given the limited data available on its true scale and the heavy toll it takes on families, communities and economies.
This report aims to galvanize such attention and action by highlighting how preventable drowning is, and how collaboration across sectors – be it health and rural development, fisheries, maritime or disaster risk management – can save lives.
Section 1 sets out key estimates and risk factors for drowning based on the most recent data available to the World Health Organization (WHO).3 It describes who is most affected, where, and how, and gives an overview of how tackling the drowning burden can be stepped up. Section 2 outlines 10 drowning prevention actions. Section 3 presents conclusions and recommendations.
3 See Appendix 2 for national death data reported to WHO, and WHO mortality estimates. Note these data are for deaths and do not include serious injury due to drowning (e.g. brain injury resulting from lack of oxygen).

2

SECTION 1
DROWNING – A NEGLECTED PUBLIC HEALTH ISSUE
THE FULL SCALE OF THE DROWNING PROBLEM IS UNKNOWN
The estimated death toll is all the more alarming because official data categorization methods for drowning exclude intentional drowning deaths (suicide or homicide) and drowning deaths caused by flood disasters and water transport incidents (including those where vessels carrying migrants, refugees and stateless people capsize during so-called irregular transport on water).
Data from high-income countries suggest these categorization methods result in significant underrepresentation of the full drowning toll by up to 50% in some high-income countries.4 Survey data from a number of low- and middle-income countries contrast markedly with WHO estimates – some suggest a level four or five times higher than the WHO estimated drowning rate.5
Other factors obscuring the full scale of global drowning include poor data collection systems, the fact that many drowning victims never reach a medical facility where their death may have been recorded, and the rapid burial of drowning victims (for cultural reasons) that leads to deaths remaining unreported.
The increase in drowning deaths in countries such as Australia, Finland and the USA if deaths recorded under other causes (e.g. water transport incident) were classed as drowning deaths.Source: Linnan M et al. Child Drowning: Evidence for a newly recognized cause of child mortality in low- and middle-income countries and its prevention. Working Paper 2012-07, Special Series on Child Injury No. 2. Florence, UNICEF Office of Research, 2012.
Relative to its global impact, drowning (fatal and non-fatal) is a vastly neglected area of public health. In 2012, an estimated 372 000 people died from drowning, making it the world’s third leading unintentional injury killer.
GLOBAL REPORT ON DROWNING 3
4 Lunetta P et al. Unintentional drowning in Finland 1970–2000: A population-based study. International Journal of Epidemiology. 2004;33(5):1053–1063.
5 Peden M et al, eds. World report on child injury prevention 2008. Geneva: World Health Organization and UNICEF; 2008.
39–50%

BOX 1 DROWNING ACCOUNTS FOR 43% OF DEATHS AMONG CHILDREN AGED 1–4 YEARS, BANGLADESH The Bangladesh Demographic Health Survey 2011 says the country’s “absolute risk of death (per 1000 live births) declined substantially between 2004 and 2011 for most causes, except for deaths due to drowning… Diarrhoea, which has always been considered a major cause of child morbidity and mortality in Bangladesh, is now responsible for only 2% of under-five deaths. Although deaths from infectious disease have declined, drowning has emerged as a key cause of death, especially among children aged 12 to 59 months (43%).”
4 SECTION 1 | DROWNING – A NEGLECTED PUBLIC HEALTH ISSUE

NEGLECT EXTENDS TO PREVENTION EFFORTS, POLICY AND RESEARCH
Poor-quality drowning data have contributed to a neglect of drowning prevention research. While there has been some success globally in focusing attention on drowning prevention, prevention efforts have mainly targeted recreational settings in high-income countries – not the day-to-day settings in low- and middle-income countries where the vast majority of drowning occurs, and where action is most urgently needed.
Many successful drowning prevention strategies from high-income country settings are unlikely to be appropriate for low- and middle-income settings, so it is vital that tackling drowning prevention in low- and middle-income countries is done using strategies tailored to the local context.
DROWNING NEEDS TARGETED ATTENTION LIKE OTHER PUBLIC HEALTH ISSUES
The success that targeted attention can bring to tackling public health issues is clear – in many low- and middle-income countries, childhood killer diseases have declined dramatically over the past three decades. However, drowning has seen no such decline – in Bangladesh, drowning now accounts for 43% of deaths among children aged 1–4 (see Box 1). And in the Matlab area, a subdistrict of Bangladesh with a well-established demographic health surveillance system, this figure exceeds 60% (see Figure 1).
GLOBAL REPORT ON DROWNING 5
FIGURE 1
EMERGENCE OF DROWNING AS THE LEADING KILLER OF CHILDREN AGED 1–4 YEARS, MATLAB, BANGLADESH
‘84 ‘85 ‘86 ‘87 ‘88 ‘89 ‘90 ‘91 ‘92 ‘93 ‘94 ‘95 ‘96 ‘97 ‘98 ‘99 ‘00 ‘01 ‘02 ‘03 ‘04 ‘05 ‘06 ‘07 ‘08 ‘09 ‘10 ‘110 0%
1000
10%
2000
20%
3000
30%
4000
40%
5000 100%
90%
80%
70%
60%
50%
YEAR
% DEATHS DUE TO DROWNINGMORTALITY / 100 000
ALL CAUSE MORTALITY / 100 000 DROWNING MORTALITY / 100 000 % DROWNING DEATHS

6 SECTION 1 | DROWNING – A NEGLECTED PUBLIC HEALTH ISSUE
6 Ahlm K, Saveman B, Björnstig U. Drowning deaths in Sweden with emphasis on the presence of alcohol and drugs – a retrospective study, 1992–2009. BMC Public Health. 2013;Mar 11;13:216.
DROWNING KEY FACTS
There are approximately 42 DROWNING DEATHS EVERY HOUR, every day
Globally, OVER HALF of all drowning deaths are among those aged UNDER 25 YEARS
Drowning rates in low- and middle- income countries are OVER THREE TIMES HIGHER than in high-income countries
Alcohol use around water is an IMPORTANT RISK FACTOR for drowning in many countries, especially for adolescents and adults6
Drowning is one of the 10 LEADING CAUSES OF DEATH for people aged 1–24 years in every region of the world (see Figure 2)
The drowning death toll is almost TWO THIRDS that of malnutrition and well OVER HALF that of malaria
MALES ARE TWICE AS LIKELY to drown as females
372 000 people die from drowning EVERY YEAR

AGE GROUPS
GLOBAL REPORT ON DROWNING 7
FIGURE 2
RANK OF DROWNING AMONG 10 LEADING CAUSES OF DEATH BY REGION AND AGE GROUP
RANK OF DROWNING AMONG 10 LEADING
CAUSES OF DEATH
WesternPacificRegion
South-East Asia
Region
Eastern Mediterranean
Region
EuropeanRegion
Region of the
Americas
AfricanRegion
High-incomecountries
10TH9TH8TH7TH6TH5TH4TH3RD2ND1ST
Note: Data for all high-income countries appears as ‘High-income countries’. All WHO regions provided show ranking for only the low- and middle-income countries within those regions.
Analysis of mortality data submitted to WHO shows drowning is one of the top five causes of death for people aged 1–14 years for 48 of the 85 countries where data meet inclusion criteria (see Figure 3).7
1–59 MONTHS 5–9 YEARS 10–14 YEARS 15–24 YEARS
7 Mortality data for countries were considered if they met the following criteria: estimated coverage of national deaths of 70% or more; ill-defined causes of death less than 20%; 10 or more deaths in the 1–14 year old age group; and data available from 2007 or later.
FIGURE 3
DROWNING AS A LEADING CAUSE OF DEATH AMONG 1–14 YEAR OLDS, SELECTED COUNTRIES
DROWNING WITHIN FIRST
5 CAUSES OF DEATH
DATA DO NOT MEET
INCLUSION CRITERIA
DATA NOT AVAILABLE
DROWNING NOT WITHIN
TOP 5 CAUSES OF DEATH
DATA NOT APPLICABLE

8 SECTION 1 | DROWNING – A NEGLECTED PUBLIC HEALTH ISSUE
The percentage of global drowning deaths occurring in low- and middle-income countries.
Source: World Health Organization, Global Health Estimates 2012 (released 2014).
91%

WHAT ARE THE RISKS?
Drowning happens in many different ways, and needs a range of prevention strategies to target the biggest risks. The main risk factors are:
WHO IS AT RISK?
PEAK DROWNING RATES ARE AMONG CHILDREN
Globally, the highest drowning rates are among children aged 1–4 years, followed by children aged 5–9 years. Worldwide, males are twice as likely to drown as females.
In the Western Pacific Region, children aged 5–14 years die more frequently from drowning than from any other cause, meaning drowning deaths outnumber those caused by road traffic crashes, congenital anomalies, leukaemia, lower respiratory infections, epilepsy, dengue and meningitis (see Figure 2).8
CHILDREN’S VULNERABILITY CHANGES WITH AGE
Children aged under 12 months are relatively immobile and entirely dependent on caregivers. They can drown very quickly and in very little water, and in water containers that may not be perceived as risks (for example, in a bucket or a toilet).
Children who are mobile but too young to recognize danger or to get out of water are at risk, especially in the absence of barriers and capable supervision.
Adolescents tend to be less supervised and are more likely to engage in risky behaviour around water, including consuming alcohol.
GLOBAL REPORT ON DROWNING 9
8 The Convention on the Rights of the Child defines childhood as ending on the 18th birthday, but because health data collection systems typically report data for 5-year age groups, the statistics in this report refer to children as those aged under 19 years. In this report, age ranges are always indicated in tables and figures.
Lack of physical barriers between people and water, particularly close to home
Lack of (or inadequate) supervision of young children
Uncovered or unprotected water supplies and lack of safe water crossings
Lack of water safety awareness and risky behaviour around water, such as swimming alone
Travelling on water, especially on overcrowded or poorly maintained vessels
Flood disasters, whether from extreme rainfall, storm surges, tsunamis or cyclones
!

DROWNING HITS THE POOR AND MARGINALISED
Regional drowning rates in low- and middle-income countries are up to 3.4 times greater than those in high-income countries (see Figure 4).
Regardless of a country’s economic development, drowning often hits the poorest and least-educated people who live in rural settings (especially around water), and communities with the least resources to safely adapt to the risks around them. Drowning rates are also disproportionately high among minority populations in places where overall drowning rates are low, including in high-income countries.9
DROWNING DESTROYS LIVES AND LIVELIHOODS
Fatal drowning is an abrupt and tragic loss of a loved one – a child, a mother, a father. And when many people drown at once, as in flood disasters, or when a ferry capsizes, entire villages and communities are shattered.
The economic cost of lives lost is also high, and while difficult to quantify globally, national-level estimates for Australia, Canada and the United States of America (USA) range from US$ 85 million to US$ 4.1 billion per year.
In high-income countries in particular, those who survive drowning but are left with catastrophic brain damage and disability create a potentially overwhelming challenge of care and financial cost for families. At the same time, lack of adequate medical care in low- and middle-income countries means those surviving but disabled by drowning often do not live long.
10 SECTION 1 | DROWNING – A NEGLECTED PUBLIC HEALTH ISSUE
9 According to the World report on child injury prevention (2008), in high-income countries there are large differences in fatal drowning rates between population subgroups, with an increased risk of between two and four times for children and young people from racial ethnic minority groups. Suggested explanations include difference in swimming ability and experience in the water, lack of opportunities to learn to swim and lack of supervision in environments where such population groups are at high-risk.
FIGURE 4 AGE-STANDARDIZED DROWNING DEATHS PER 100 000 POPULATION, BY REGION AND INCOME LEVEL
Western PacificRegion
South-East Asia
Region
Eastern Mediterranean
RegionEuropeanRegion
Region of the
AmericasAfricanRegion
High-incomecountries
3.0
2.0
1.0
0.0
4.0
5.0
6.0
7.0
8.0 DROWNING DEATHS PER 100 000 POPULATION
Note: Data for all high-income countries appears as ‘High-income countries’. All WHO regions provided show ranking for only the low- and middle-income countries within those regions.

GLOBAL REPORT ON DROWNING 11

WHERE ARE THE RISKS?
Bucket, bathtub, pond or pool: wherever there is water, there is the threat of drowning
Even in countries with large coastlines such as Australia, Canada, New Zealand and Viet Nam, most drowning happens inland. Whether in a bucket, bathtub, pond or pool, almost all water is a risk for drowning – especially where young children are concerned.
In Bangladesh, a national survey found 80% of drowning among children aged under 5 years happened within 20 metres of the family home – mainly in ponds, followed by ditches and water containers (see Figure 5). Older children and adults drown further away from home, typically in natural water bodies, often while working, travelling or collecting water.
A similar study in the rural community of Kaniyambadi, in Vellore, India, found that nearly 90% of drowning deaths among children aged 1–12 years involved water in a pot, well or pond.10
LIVING AROUND WATER
People in low- and middle-income countries interact with water very differently to those in high-income countries, and the general level of economic and social development in low- and middle-income countries means exposure to water is riskier.
Collecting water Just under half the world’s population have no access to piped water, meaning water holes, wells or surface water are the only water sources for drinking, washing, cooking and daily household chores.11
Living near water Lack of barriers or signs around water hazards such as unsafe crossings, open wells, uncovered manholes and ditches in low- and middle-income countries poses a risk. In low- and middle-income countries, many homes in these settings are on lakes or river banks – some are built over the water – and this, along with poor flood disaster protection, puts local people at greater risk.
Travelling on water Daily commuting and journeys made by migrants or asylum seekers often take place on overcrowded and unsafe vessels that lack safety equipment or are operated by personnel not trained to deal with transport incidents or high-seas navigation. Personnel under the influence of alcohol or drugs are also a risk.
Working on or around water Small-scale fishing is estimated to employ around 37 million people worldwide – around 90% are in Asia.12 Reducing drowning risk for these and others who earn their living on or around water requires adequate enforcement of safety standards and equipment, and warning services such as weather alerts.
Flood disasters The number of people exposed to hazards is rising with the increased frequency and severity of flood disasters, and unplanned urbanization. Drowning risks increase with floods, particularly in low- and middle-income countries where people live in flood-prone areas and the ability to warn, evacuate, or protect communities from floods is weak or only just developing. Between 1980 and 2009 there were over 500 000 estimated deaths from floods and 2.8 billion people affected by floods worldwide (excluding tsunamis).
12 SECTION 1 | DROWNING – A NEGLECTED PUBLIC HEALTH ISSUE
10 Bose A, George K, Joseph A. Drowning in childhood: a population-based study. Indian Pediatrics. 2000;37:80-83.
11 Joint Monitoring Programme (JMP) for Water Supply [online database]. Geneva: WHO/UNICEF (http://www.wssinfo.org/data-estimates/tables/, accessed 19 May, 2014).
12 Small-scale fisheries around the world. FAO Fisheries and Aquaculture Department [website]. Rome: Food and Agriculture Organization (http://www.fao.org/fishery/ssf/world/en, cited 3 April 2014).

GLOBAL REPORT ON DROWNING 13
Source: Rahman A et al. Analysis of the childhood fatal drowning situation in Bangladesh: exploring prevention measures for low-income countries. Injury Prevention. 2009;15:75–79.
FIGURE 5 PLACE OF DROWNING OF BANGLADESHI CHILDREN AGED UNDER 5 YEARS
43%Pond
6%Other
5%River
26%Ditch
13% Container
7%Lake

14 SECTION 1 | DROWNING – A NEGLECTED PUBLIC HEALTH ISSUE
WHERE ASSISTANCE IS LIMITED
Rescue and resuscitation must be done immediately at the scene of the incident if it is to be effective, making it highly desirable that the skills to perform rescue and resuscitation of drowning victims are present in as much of the population as possible.
But establishing programmes to instil these skills in low- and middle-income countries requires a certain set of conditions, including generally high education levels, a culture of good Samaritanism and legal protection for those attempting rescue and resuscitation. Lack of these conditions poses a significant obstacle to the establishment and effective function of such programmes in low- and middle-income countries.
Added to this, traditional responses such as forcibly pushing the stomach or rubbing the victim with salt or ashes can cause harm, as they delay or prevent effective cardiopulmonary resuscitation (CPR) as may other cultural or religious beliefs. Transport to a medical facility for further treatment may also be severely limited because of distance or cost.

HOW CAN WE REDUCE THE THREAT OF DROWNING?
Drowning can be prevented through targeted prevention strategies, improved community infrastructure (water supply, bridges, levees etc.), public awareness, appropriate policies and legislation, and research that refines what is seen as best practice and that identifies new drowning prevention measures.
Strategies such as these have worked in high-income countries and some low- and middle-income countries – scaling up these approaches will bring further gains.
ADAPT SUCCESSFUL STRATEGIES FOR DIFFERENT SETTINGS
Drowning rates show long-term declines in high-income countries. Some of these reductions are likely the result of the provision of piped water, reduced exposure to open water, and better literacy and economic development, but other factors such as safety standards, policies and legislation have also played a role. Measures readily achievable in low-income settings include:
GLOBAL REPORT ON DROWNING 15
Reduced exposure to water hazards through strategic use of barriers
Close and capable adult supervision for young children
Improved swimming and water safety skills
Requirements for use of personal flotation devices (PFDs, see Box 2)
Comprehensive boating regulations and enforcement
Signage and designation of hazardous water bodies
Timely rescue and resuscitation by a trained bystander or lifesaver through mouth-to-mouth resuscitation and chest compression when needed
Supervision of recreational swimming areas

BOX 2 PERSONAL FLOTATION DEVICES (PFDS)
The term ‘personal flotation device’ (PFD) covers flotation devices such as lifejackets, as well as buoyancy devices designed to keep the wearer afloat (but that do not meet the higher performance requirements for lifejackets, which are designed to prevent drowning at sea). PFDs are considered appropriate for use by children, recreational boaters and water-sports participants undertaking activities in calm waters, close to the shore or close to help from rescuers.
Some governments require all recreational vessels to carry one wearable PFD (of a specified type) for each person on board but authorities and water safety bodies generally advocate that PFDs be worn by boaters to protect against unexpected entry into the water. The findings of a recent study of United States Coast Guard records comparing risk of drowning death for PFD wearers and non-wearers indicated that 50% of recreational boating drowning
deaths may be prevented by wearing an appropriate PFD. Two Australian states have introduced regulations mandating PFD wearing for recreational boaters. A before-after observational study of the effectiveness of these in one state found the regulations were associated with a significant increase (from 22% to 63%) in PFD wearing. A subsequent study found the regulations were effective in reducing drowning deaths among all recreational boaters, to 59 recreational boating drowning deaths occurring in the six-year pre-legislation period compared to 16 in the 5-year post-legislation period.
Sources:
Cummings P, Mueller BA, Quan L. Association between wearing a personal floatation device and death by drowning among recreational boaters: a matched cohort analysis of United States Coast Guard data, Injury Prevention. 2011;17:156–9.
Cassell E, Newstead S. Did compulsory wear regulations increase personal flotation device (PFD) use by boaters in small power recreational vessels? A before-after observational study conducted in Victoria, Australia. Injury Prevention. 2014; 2 June. doi:10.1136/injuryprev-2014-041170.
Bugeja L, Cassell E, Brodie LR, Walter SJ. Effectiveness of the 2005 compulsory personal flotation device (PFD) wearing regulations in reducing drowning deaths among recreational boaters in Victoria, Australia. Injury Prevention. 2014; 23 June. doi: 10.1136/injuryprev-2014-041169.
16 SECTION 1 | DROWNING – A NEGLECTED PUBLIC HEALTH ISSUE

GLOBAL REPORT ON DROWNING 17
BUILD ON SUCCESSES IN LOW- AND MIDDLE-INCOME COUNTRIES
There is increasing evidence of effective drowning prevention programmes in low- and middle-income countries. The SwimSafe programme – a regional, basic swim skills training programme operating in Bangladesh, Thailand and Viet Nam – is one example of this. A study of SwimSafe Bangladesh demonstrated a significant reduction in drowning following basic swimming and water safety training for children aged 4–12 years and the establishment of child care centres for children aged 1–5 years (see page 22). Initial cost-effectiveness of these strategies, individually and combined, compare favourably with other interventions to reduce child mortality.
INTEGRATE DROWNING PREVENTION INTO THE LOCAL SETTING
Understanding the way communities live around water is critical to developing and implementing effective drowning prevention programmes and policies (see Box 3). This is particularly important in low- and middle-income settings, where many livelihoods depend on water, where there are fewer (and often less-safe) water crossings and bridges, and where there is a heavy dependence on boats and ferries – making everyday life riskier than in high-income settings.
MAKE DROWNING PREVENTION PART OF A MULTISECTORAL APPROACH
A wide range of sectors influence drowning risk, including fisheries, maritime transport, disaster risk management, health, and rural development. Because of this, it is important that drowning prevention programmes and activities are multisectoral. Coordination across sectors can be of particular benefit in low- and middle-income countries, where doing more to prevent drowning will likely require efforts across a range of sectors.
BOX 3
WORKING WITH THE COMMUNITY TO PREVENT DROWNING, THE PHILIPPINES
A drowning prevention pilot project in Lucao village, Dagupan City, Philippines, engaged villagers in researching and choosing suitable drowning prevention measures. The project – culturally appropriate and site-specific – identified local risks by reviewing drowning mortality records, holding key informant interviews, focus group discussions and community ‘walk-throughs’.
Risk factors identified were proximity to bodies of water without barriers, inadequate child supervision, lack of information and awareness of prevention strategies and lack of drowning prevention programmes. The measures implemented through the community’s newly developed drowning prevention committee included community education sessions, redesigning community wells, developing playpens, using barriers around water and training community workers to deliver safety messages and teach people CPR.
Source: Guevarra JP, Franklin RC, Basilio JA, Orbillo LL, Go JJ. Child drowning prevention in the Philippines: the beginning of a conversation. International Journal of Injury Control and Safety Promotion. doi: 10.1080/17457300.2014.912235
GLOBAL REPORT ON DROWNING 17

18
SECTION 2
TEN ACTIONS TO PREVENT DROWNING
18
COMMUNITY-BASED ACTION
This death toll is almost two thirds that of malnutrition and well over half that of malaria
Provide safe places (for example, a crèche) away from water for pre-school children, with capable child care
2Strengthen public awareness and highlight the vulnerability of children
5
Install barrierscontrolling accessto water
1Train bystanders in safe rescue and resuscitation
4
Teach school-age children basic swimming, water safety and safe rescue skills
3
!
The 10 actions outlined in this section are based on available evidence and are deemed to be effective, feasible and scalable. Complementary measures such as drawing on best-practice models, using social media and communication to raise public awareness, and adapting interventions to suit local contexts (for example, making barriers from locally sourced materials) are important in ensuring these strategies are effectively implemented.
In addition, in resource-poor settings where educational levels are low, it is important to understand how people perceive drowning before introducing interventions, including what local people see as the cause of drowning and appropriate ways to treat and prevent it. Findings should guide how actions are implemented.
Our 10 actions fall into three categories:

SECTION 1
DROWNING – A NEGLECTED PUBLIC HEALTH ISSUE
THE FULL SCALE OF THE DROWNING PROBLEM IS UNKNOWN
The estimated death toll is all the more alarming because official data categorization methods for drowning exclude intentional drowning deaths (suicide or homicide) and drowning deaths caused by flood disasters and water transport incidents (including those where vessels carrying migrants, refugees and stateless people capsize during so-called “irregular” transport on water). Data from high-income countries suggest these categorization methods result in significant underrepresentation of the full drowning toll by up to 50% in some high-income countries.4 Survey data from a number of low- and middle-income countries contrast markedly with WHO estimates – some suggest a level four or five times higher than the WHO estimated drowning rate.5 Other factors obscuring the full scale of global drowning include poor data collection systems, the fact that many drowning victims never reach a medical facility where their death may have been recorded, and the rapid burial of drowning victims (for cultural reasons) that leads to deaths remaining
unreported.
39–50%The estimated increase in the number of re-ported drowning deaths in countries such as the USA, Australia and Finland if fatalities cur-rently recorded under other external causes of death (e.g. flood disaster or water transport incident) were instead categorized as drown-ing deaths.
Source: Linnan M et al. Child Drowning: Evidence for a newly recognized cause of child mortality in low- and middle-income countries and its prevention. Working Paper 2012-07, Special Series on Child Injury No. 2. Florence, UNICEF Office of Research, 2012.
Relative to its global impact, drowning (fatal and non-fatal) is a vastly neglected area of public health. In 2012, an estimated 372 000 people died from drowning, making it the world’s third leading unintentional injury killer.
GLOBAL REPORT ON DROWNING 19
4 Lunetta P et al. Unintentional drowning in Finland 1970–2000: A population-based study. International Journal of Epidemiology. 2004;33(5):1053-1063.
5 Peden M et al, eds. World report on child injury prevention 2008. Geneva: World Health Organization and UNICEF; 2008.
GLOBAL REPORT ON DROWNING 19
EFFECTIVE POLICIES AND LEGISLATION
FURTHER RESEARCH
Address priority research questions with well-designed studies
10
Set and enforce safe boating, shipping and ferry regulations
6
Coordinate drowning prevention efforts with those of other sectors and agendas
8
9
GLOBAL REPORT ON DROWNING 19
Build resilience and manage flood risks and other hazards locally and nationally
7
!
Develop a national water safety plan

COMMUNITY-BASED ACTION
INSTALL BARRIERS CONTROLLING ACCESS TO WATER
Placing barriers strategically so access to water hazards is limited or more tightly controlled reduces exposure and drowning risk. While seemingly a straightforward task, care must be taken to ensure barriers are practical, sustainable, and create no further risk by their use.
Barrier approaches to prevent drowning include:
covering wells and cisterns (water tanks). The use of a pump (manual, electrical or other) helps keep the water source covered while water is drawn.
using doorway barriers and playpens.13 The use of barriers should not replace the care or attention of a capable, supervising adult, or run the risk of the child being trapped.
fencing swimming pools with four-sided, child-resistant fences and self-closing gates with safety latches.
legislating for the implementation and enforcement of policies, standards and building codes to support these measures.
13 A playpen is a portable, four-sided enclosure in which a baby or young child can be safely placed without constant supervision.
1
20 SECTION 2 | TEN ACTIONS TO PREVENT DROWNING

GLOBAL REPORT ON DROWNING 21
The percentage of swimming pool drowning deaths among young children that could be prevented by four-sided fencing completely separating the pool from the house and yard.
Source: Pool fencing for preventing drowning in children. Thompson DC, Rivara FP. Cochrane Database Syst Rev. 2000;(2):CD001047.
75%
GLOBAL REPORT ON DROWNING 21

PROVIDE SAFE PLACES FOR
PRE-SCHOOL CHILDREN WITH CAPABLE CHILD CARE
Community-based, supervised child care for pre-school children can reduce drowning risk and has other proven health benefits.
Supervised child care programmes have been established at village level in a number of low- and middle-income countries. In southern India, such programmes (known locally as balwadis) have been suggested by local populations as effective responses to prevent drowning associated with lapses in supervision.14 In Cambodia, village-based child care programmes for pre-school children have also been established to prevent drowning.
A village-based child care programme studied extensively in relation to drowning prevention took place across three rural regions in Bangladesh.15 Here, village-based child-carers were trained in child safety, supervision and early childhood development, and a maximum ratio of 25 children per supervising adult and assistant was set. Child care was made available for pre-school children from 9am– 1pm – the period when drowning was most likely to occur – and included early childhood development activities and early learning, supplementary nutrition and health and hygiene awareness (such as hand washing and latrine use).
This child care programme (known locally as anchal) was associated with a significant reduction in drowning, and in terms of cost- effectiveness compared favourably with other child survival strategies such as oral rehydration therapy. An additional and powerful rationale for expanding village-based child care programmes such as this is that their benefits (potentially lifelong) extend to many health areas, including the well-known advantages of child care for early childhood development, and the prevention of other child injuries and infections.
Such efforts should be systematically implemented and monitored in order to identify best practices, with a particular focus on identifying how these can be brought to scale in low- and middle-income countries.
14 Isaac R et al. Community perception of child drowning in South India: a qualitative study. Annals of Tropical Paediatrics. 2007;27(3):225–229. doi:10.1179/146532807x220343.
15 Rahman F, Bose S, Linnan M et al. Cost-Effectiveness of an injury anddrowning prevention program in Bangladesh. Pediatrics. 2012 Dec;130(6):e1621–8.
2
22 SECTION 2 | TEN ACTIONS TO PREVENT DROWNING

GLOBAL REPORT ON DROWNING 23GLOBAL REPORT ON DROWNING 23

24 EXECUTIVE SUMMARY24 SECTION 2 | TEN ACTIONS TO PREVENT DROWNING
Instructor providing swim skills training in a low-income setting. A submerged platform limits the depth to 1 metre where these children are learning kicking skills. The area outside is deeper, permitting children to practice in water that may go over their heads. The training area is enclosed by bamboo fencing to limit access to the larger pond.
Instructor providing swim skills training in a high-income setting.

GLOBAL REPORT ON DROWNING 25GLOBAL REPORT ON DROWNING 25
TEACH SCHOOL-AGE
CHILDREN BASIC SWIMMING, WATER SAFETY AND SAFE RESCUE SKILLS
Studies of programmes in Australia, Bangladesh, China, Thailand, the United States and Viet Nam show that teaching children basic swimming, water safety and safe rescue skills reduces drowning. Based on this knowledge, systematic and carefully monitored replication of such programmes will help clarify best practice.
Most recently, a study was made of almost 80,000 children aged 4–12 years who completed the SwimSafe programme in Bangladesh. SwimSafe is a structured programme that requires children to learn 21 steps of swimming skills, typically over 14 days.16 The training dramatically reduced the likelihood of drowning, and was shown to be very cost-effective under the WHO-CHOICE criteria, meaning this intervention compares very favourably with other child survival interventions.
To replicate these results in other resource-poor settings with high drowning risk, such programmes should include the following:
1. A structured, safety-tested curriculum. The SwimSafe curriculum17 developed from local studies (in Bangladesh, Thailand and Viet Nam) of how children acquire swimming skills in each setting. These were then ranked for safety and effectiveness. Following this, best practices were adapted in line with established swim training curricula. These include identifying children with conditions (e.g. seizures or respiratory disorders) that may place them at increased risk of drowning during swim skills training, and ensuring these are dealt with appropriately. The objective is a safe, structured curriculum adapted to the local population and context.
2. A safe training environment. Physically demarcated areas in village ponds with submerged platforms or above-ground, transportable pools filled with fresh water to a controllable depth are examples of training environments adapted to local settings. These provide safe areas where children can be actively supervised while they learn.
3. Trained instructors. Programmes must be established in safe and controlled environments with trained instructors who are well versed in the curriculum, its training methods and what is expected of them in relation to supervision.
4. Student-instructor ratios established for safety. These should be appropriate for the skill level and water conditions, with due consideration for the safety of all taking part.
Underlying these prerequisites for teaching children to swim is a heavy emphasis on safety. Curricula, training environment, screening and student selection, instructors and student- instructor ratios all need to be seen as part of an overall risk management system. Training children to swim is an inherently dangerous process, and swim skills training should be approached as a public health intervention – where safety should be demonstrated and constantly monitored.
3
16 Rahman F, Bose S, Linnan M et al. Cost-Effectiveness of an injury and drowning prevention program in Bangladesh. Pediatrics. 2012 Dec;130(6):e1621–8.
17 See www.swimsafe.org.

18 Venema A, Groothoff J, Bierens J. The role of bystanders during rescue and resuscitation of drowning victims. Resuscitation. 2010 Apr;81(4):434–9. doi: 10.1016/j.resuscitation.2010.01.005. Epub 2010 Feb 10.
19 Szpilman D, Soares M. In-water resuscitation – is it worthwhile? Resuscitation. 2004 Oct;63(1):25–31.
20 Drowning resuscitation requires another state of mind. Bierens J, Warner, DS. Resuscitation. Volume 84, Issue 11, 1467–1469.
21 Szpilman D, Bierens J, Handley A, Orlowski J. Drowning. New England Journal of Medicine. 2012;366(22):2102–2110.
TRAIN BYSTANDERS
IN SAFE RESCUE AND RESUSCITATION
SAFE RESCUE
Some rescue attempts end with the rescuer fatally drowning, either because they could not swim well or were not aware of simple, safe rescue techniques that avoid entering the water, such as using a rod or pole, throwing a rope, lifebuoy or improvised life-line such as a garden hose.
But rescue can be done safely, and bystanders’ actions can make a critical difference.18 Given the importance of removing the drowning person from the water immediately, and the principle that rescuers must not put themselves at risk, awareness of safe rescue techniques should be a focus of community-based awareness raising, and part of learn-to-swim programmes.
The International Life Saving Federation (ILS) provides technical guidance on how these skills should be taught and assessed, recommending that basic aquatic survival skills training includes the ability to “rescue and be rescued by extending or grasping a rescue aid (for example a pole, bottle, rope etc.) and be guided to safety over a distance (i.e. 3 to 5 metres)”. Successful programmes promoting skills such as these have been carried out by the ILS and others, including (over many years) the Herald Sun programme in Victoria, Australia, Red Cross Societies in a range of countries and the YMCA programmes in the United States.
RESUSCITATION
There is strong evidence that CPR – meaning both chest compression and mouth-to-mouth resuscitation – is the only way to prevent death when a drowning victim has no pulse and is not breathing (see Box 4). Survival improves when appropriate resuscitation is performed as soon as submersion is over, although survivors may have severe neurological damage if there has been a prolonged stoppage of the heart and breathing.19,20
A simplified method of CPR that involves chest compressions only (i.e. no mouth-to-mouth resuscitation) has been promoted for untrained first aiders witnessing cardiac arrests, but it is important to note that this so-called hands-only CPR is not appropriate for drowning victims who have no pulse and are not breathing. An ILS statement on this issue draws attention to the role played by lack of oxygen in relation to heart stoppage caused by drowning, and a recent review has outlined more areas where the approach to CPR for drowning victims is different to that for cases of cardiac arrest.21
The number of rescuers fatally drowned in 15 incidents in Australia (2002–2007) trying to rescue a drowning child. In 93% of these incidents, the child survived.
Source: Franklin R, Pearn J. Drowning for love: the aquatic victim-instead-of-rescuer syndrome: drowning fatalities involving those attempting to rescue a child. Journal of Paediatrics and Child Health. 2011;47(1–2)44–7.
17
4
26 SECTION 2 | TEN ACTIONS TO PREVENT DROWNING

GLOBAL REPORT ON DROWNING 27GLOBAL REPORT ON DROWNING 27GLOBAL REPORT ON DROWNING 27
BOX 4
CPR AND MOUTH-TO-MOUTH RESUSCITATION
CPR consists of a combination of mouth-to-mouth breathing and chest compression and is indicated when the drowned person has no pulse and is not breathing.
Mouth-to-mouth resuscitation (also called artificial respiration or rescue breathing) is indicated when the drowned person has a pulse but is not breathing.
CPR or mouth-to-mouth resuscitation should be done as soon as possible, as delays result in poorer outcomes.

STRENGTHEN PUBLIC
AWARENESS AND HIGHLIGHT THE VULNERABILITY OF CHILDREN
Governments and communities in many high-income countries and some low- and middle-income countries have made progress on drowning prevention. For those yet to gain the necessary momentum to engage with the issue in a targeted way there are many rapid gains to be had. Creating public awareness is a powerful tool for achieving this.
Public awareness is most effective when it is:
directed at specific risk factors, such as ensuring adult supervision of young children or reducing exposure to water hazards;
coordinated with practical interventions such as community child care, basic swimming lessons, and low-cost protective items such as well covers and playpens;
linked to strengthened enforcement of regulations.
Lifesaving societies, injury prevention committees and other nongovernmental organizations (NGOs) can be very active in strengthening public awareness. The ILS has played a critical role in leading and supporting the work of national and international organizations (including members and non-members of the ILS) engaged in drowning prevention. In many countries Red Cross societies have played an important role. Collectively, these entities have educated communities on the dangers of, and ways to avoid, drowning. Long-term declines in drowning in a number of countries are associated with the establishment and community actions of lifesaving societies.
ENSURE RISKS TO CHILDREN ARE UNDERSTOOD AND ADDRESSED
A national water safety plan (see page 36) can enable NGOs to work with the education system to deliver water safety programmes to school-age children. Such a strategy can also support the work of advocacy organizations to ensure parents and caregivers are aware of drowning risks for children, and take preventative steps.
SIGNPOST DANGEROUS AREAS AND PRE-POSITION RESCUE EQUIPMENT
Ensuring adequate signage to draw attention to hazards such as riptides,22 waterfalls and fast currents is another important aspect of raising public awareness of drowning risks. In addition, lifebuoys can be placed in locations where there is a known drowning risk, acting both as a visual alert for the nearby risk, and as a potential life saver. Instructions on how to deploy any lifebuoys in hazard areas should be clear and simple.
GET THE MEDIA ON BOARD
Social marketing and media training for journalists on the public health aspects of drowning greatly increase the reach and effectiveness of public awareness efforts (see Box 5). Such efforts should target the main risk factors, risk groups and prevention strategies relevant to each setting.
5
22 A riptide is a strong current caused by tidal flow in confined areas such as inlets that may present a hazard to swimmers and boaters.
28 SECTION 2 | TEN ACTIONS TO PREVENT DROWNING

GLOBAL REPORT ON DROWNING 29
BOX 5
‘TURN AROUND, DON’T DROWN’: PUBLIC AWARENESS IN TEXAS, USA
The United States’ National Weather Service (NWS) reports that 80% of flood-related deaths in southern Texas result from driving through low-water crossings, walking along banks of flooded areas or playing in floodwater. More than half of flood fatalities result from automobiles being swept downstream.
To deter drivers and walkers from using flooded crossings and paths, staff at NWS launched the ‘Turn around, don’t drown’ campaign in 2003, in partnership with the Federal Alliance for Safe Homes and the Texas Division of Emergency Management. Leaflets, posters and bumper stickers were provided and a website was developed. In May 2005 the campaign expanded across Texas. Billboards carried the flood safety message, and in the city of San Antonio, bumper stickers on police, fire and city vehicles displayed the slogan. The message was also spread through local media via public service announcements, distribution of bumper stickers by the Texas Floodplain Management Association, animated presentations and informative FLASH flood safety flash cards.
GLOBAL REPORT ON DROWNING 29

EFFECTIVE POLICIES AND LEGISLATION
SET AND ENFORCE SAFE BOATING, SHIPPING AND FERRY REGULATIONS
People travel on water every day using a wide range of watercraft – passenger ferries, commercial freighters and smaller recreational boats.
All water travel poses a drowning risk, but while ferry incidents often make the headlines, drowning deaths related to small boats rarely do.
Data from countries such as Australia, Canada, Germany, Finland and the United States suggest the number of deaths related to small boat23 incidents forms a significant proportion of all drowning fatalities.
Enforcement of safety regulations for ferries and boats is therefore essential for all countries to reduce drowning deaths. Many countries have signed up to International Maritime Organization (IMO) rules (see Box 6), and base their own domestic regulations and standards on them, but their success depends on how well rules are enforced.
REGULATING PASSENGER FERRIES
Any transport incident involving a passenger ferry can result in many deaths. Ferry safety is improved by establishing systems that reliably ensure:
the vessel is seaworthy and in good condition;
there are enough accessible PFDs on board to meet the vessel’s passenger capacity;
the captain has the necessary skills and competence to command the vessel;
evacuation plans are established and rehearsed by the crew;
appropriate travel routes and rules are adhered to, avoiding the chance of collision;
maximum capacity is well documented, and overcrowding and overloading are avoided;
travel is restricted in poor weather and small boats are not used on the high seas.
23 There is no consistent definition of a small boat – most jurisdictions consider this to be boats up to 5–8 metres in length.
6
30 SECTION 2 | TEN ACTIONS TO PREVENT DROWNING
GLOBAL REPORT ON DROWNING 31
BOX 6
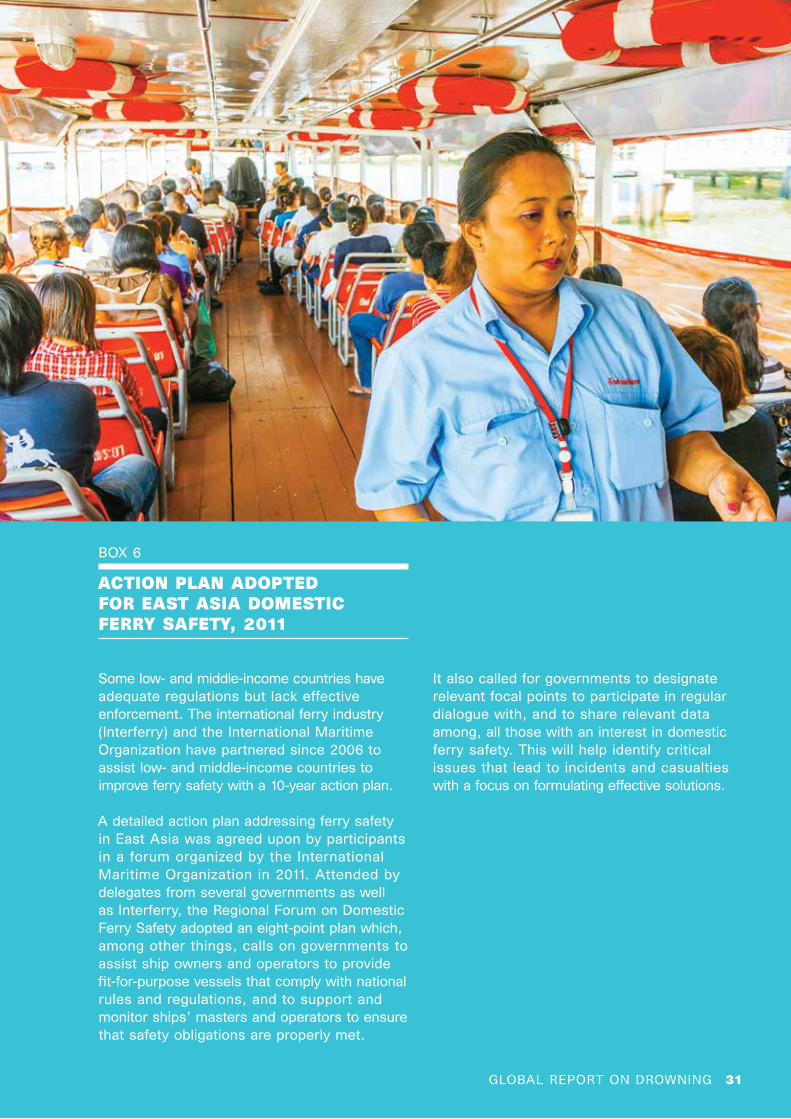
ACTION PLAN ADOPTED FOR EAST ASIA DOMESTIC FERRY SAFETY, 2011
Some low- and middle-income countries have adequate regulations but lack effective enforcement. The international ferry industry (Interferry) and the International Maritime Organization have partnered since 2006 to assist low- and middle-income countries to improve ferry safety with a 10-year action plan.
A detailed action plan addressing ferry safety in East Asia was agreed upon by participants in a forum organized by the International Maritime Organization in 2011. Attended by delegates from several governments as well as Interferry, the Regional Forum on Domestic Ferry Safety adopted an eight-point plan which, among other things, calls on governments to assist ship owners and operators to provide fit-for-purpose vessels that comply with national rules and regulations, and to support and monitor ships’ masters and operators to ensure that safety obligations are properly met.
It also called for governments to designate relevant focal points to participate in regular dialogue with, and to share relevant data among, all those with an interest in domestic ferry safety. This will help identify critical issues that lead to incidents and casualties with a focus on formulating effective solutions.
GLOBAL REPORT ON DROWNING 31

REGULATING SMALL BOATS
The majority of deaths in incidents involving some form of watercraft occur not in transport incidents involving large vessels, but rather in fishing, recreational and small transport vessels.
Regulation of safety measures for small boats includes:
carrying out regular maintenance of boats;
avoiding overloading with passengers or goods;
setting an estimated departure, return and travel route;
setting and enforcing blood alcohol concentration limits for operators;
ensuring boats carry: approved PFDs for all on board,
to be worn at all times; a communication device, for example,
a mobile phone, VHF radio or an emergency position indicating radio beacon;
a bucket with a line attached to remove water;
an anchor with a cable; a waterproof torch or lantern; a set of paddles or oars.
MULTILATERAL AND REGIONAL COOPERATION FOR SO-CALLED IRREGULAR MOVEMENTS ON WATERCRAFT
Migrants, refugees and asylum seekers looking for opportunities and sometimes safety elsewhere often take to the world’s oceans and seas in what are called irregular movements – this means unauthorised travel and it frequently ends in tragedy.
The Office of the United Nations High Commissioner for Refugees (UNHCR) is due to hold a Commissioner’s Dialogue on a UNHCR initiative for protection at sea in December 2014. A central objective of the dialogue and of the initiative itself is to limit loss of life in these situations. This in turn calls for greater harmonization and regulation of procedures such as maritime search and rescue (see Box 7).
BOX 7
DROWNING AND REFUGEES, ASYLUM SEEKERS AND STATELESS PEOPLE
Refugees, asylum seekers and stateless people in search of protection often use overcrowded and unsafe vessels to reach safety.
According to UNHCR, limiting the loss of life of migrants, refugees and asylum seekers who take to the sea in unseaworthy vessels calls for:
effective national and regional search and rescue capacities;
strengthened cooperation systems (particularly for international situations);
policies to remove disincentives for commercial vessels to rescue those in peril;
shared understanding of safe places where those rescued can disembark;
possible application of approaches as laid out in the IMO’s International Convention on Maritime Search and Rescue, and the International Convention on Safety of Life at Sea.
32

GLOBAL REPORT ON DROWNING 33GLOBAL REPORT ON DROWNING 33
BUILD RESILIENCE AND MANAGE FLOOD RISKS AND OTHER HAZARDS LOCALLY AND NATIONALLY
Drowning is the leading cause of death in flood disasters and such events (see Box 8) are becoming more frequent – a trend that is projected to continue.24
But despite the increasing frequency of flood disasters, in some regions deaths due to sudden floods and cyclones have declined. This is thought to be the result of improvements in development conditions in low- and middle- income countries, and in early warning, disaster preparedness and response.
PREVENTING DROWNING THROUGH DISASTER RISK MANAGEMENT
Flood risk management has evolved considerably over recent years. A major policy shift has been towards integrated approaches to flood risks and the notion of living with floods, where floodplains and watersheds are restored and maintained and – for example in urban areas – flooding is managed through infrastructure such as levees, dams and canals. Rapid flooding poses the biggest drowning risk and local populations can be prepared and better protected from this risk through:
disaster preparedness plans with strong community awareness and education. It is critical that local communities are involved in disaster preparedness planning, and that the plan enhances their awareness and understanding of the local flood risk reduction strategy, including what it means for them in terms of early warning, improved drainage, ecosystem management, investments in local infrastructure, insurance schemes and agricultural and land use planning.25
effective early warning systems. These depend on a clear understanding of the at-risk population, and can prevent drowning by monitoring hazards and speedily disseminating flood warnings to vulnerable people, making sure they know what to do if a warning is issued (for example, evacuate to high ground or a designated centre).
land use planning. This must ensure that shelter, housing, hospitals and other critical infrastructure are not located in flood-prone or coastal areas at risk of storm surge or tsunami, and that buildings are designed to reduce the risk of damage caused by floods. Levees separating water channels from flood plains protect against drowning in populated areas (though if damaged, they may contribute to flooding). In coastal cities such as Ho Chi Minh and Amsterdam, extensive levee systems protect against flooding but require regular maintenance.
preserving forests, wetlands and washlands (land sometimes flooded by a river or stream). This helps retain natural water storage capacity, which may help prevent floods and drowning fatalities.
water safety awareness and basic swimming skills. These may reduce drowning risks during floods in high-risk communities. Disaster preparedness should include raising community awareness about these skills.
Additional actions are needed to prevent drowning in floods, and further research is needed to identify the best measures to address different vulnerable populations.
24 IPCC. Managing the risks of extreme events and disasters to advance climate change adaptation. A special report of working groups I and II of the Intergovernmental Panel on Climate Change. Field CB et al, editors. Cambridge: Cambridge University Press; 2012.
25 WWAP (World Water Assessment Programme). Managing Water under Uncertainty and Risk (chapter 4): The United Nations World Water Development Report 4. Paris: UNESCO; 2012.
7
!

34 EXECUTIVE SUMMARY34 SECTION 2 | TEN ACTIONS TO PREVENT DROWNING
BOX 8
FLOOD HAZARDS ARE OF FOUR MAIN TYPES
Coastal floods – including high tides and storm surge floods where water is pushed onto dry land by onshore winds, storms and cyclones.
Tsunamis – where large volumes of water are displaced onto land, usually following underwater seismic activity.
River floods – in a watercourse
due to intense or persistent rain over large areas.
Flash floods – rapid flooding of low-lying areas, at the base of hills or in dry river beds, following heavy rain or collapse of a structure withholding water, for example a dam.
The percentage of flood deaths caused by drowning – though these are not categorized as drowning deaths in official statistics.
Source: Doocy S, Daniels A, Murray S, Kirsch TD. The human impact of floods: a historical review of events 1980–2009 and systematic literature review. PLOS Currents Disasters. 2013; Apr 16. Edition 1.
75%

GLOBAL REPORT ON DROWNING 35
COORDINATE DROWNING PREVENTION EFFORTS WITH THOSE OF OTHER SECTORS AND AGENDAS
Drowning is a multisectoral issue. There is much to be gained from increased coordination and collaboration across the sectors that shape drowning risk, from fisheries to maritime transport, and from disaster risk management to health, education and rural development.
For example, a major water, sanitation and health agenda is to increase the number of people worldwide who access drinking-water from sources protected from outside contamination. An additional benefit of protected water sources – though one rarely cited in support of such programmes – is that people using them are less likely to drown in them than they are if using surface water or open wells. Similarly, controlling water-borne diseases by draining or filling in unwanted ditches, waterholes or ponds also reduces exposure to drowning risks.
Also, there are instances where the objectives of drowning prevention may benefit those of other agendas – for example, the construction of safe bridges and fords (shallow parts of rivers or streams where people can wade or drive across) reduces drowning risk, but it also improves access for transport and trade.
Development agencies support much of this work, and though they may rarely consider drowning prevention as a specific goal in its own right, they are potentially important champions for it. For example, irrigation canals designed to boost local food production by making barren land fertile can be made safe as they pass near villages by ensuring local people can cross them safely without the risk of falling in.
Drowning risks can be managed and ultimately reduced if approaches to development are more integrated (see Box 9), and take into consideration potential impacts on drowning risk.
BOX 9
WORKING TOGETHER TO PREVENT DROWNING AND DISEASE, CAMBODIA
A WHO drowning prevention programme in Kampong Chhnang Province, Cambodia, targeted the population living on and around the Tonle Sap and Mekong Rivers, and who were at high risk of drowning. As this same population is also at risk of many water-borne diseases, water, sanitation and health measures were carried out alongside the drowning prevention activities to address both sets of issues.
Elements of the programme included the piloting of a day care centre run by care givers specially trained in child care, hygiene and child health; materials to build safety barriers in the homes of over 1200 families; covering water hazards; and using PFDs for small children when in boats.
In addition, the village health support group and commune council members promoted awareness of drowning in the community, and data collection on drowning in their respective communes.
8
GLOBAL REPORT ON DROWNING 35

DEVELOP A NATIONAL WATER SAFETY PLAN
All countries can benefit from a national water safety plan. Whether it is a single, unified plan or one comprising several separate plans implemented by concerned parties such as the maritime, health or fisheries sectors, or the lifesaving community itself, collaboration across sectors is essential.
There are currently a range of countries with water safety plans, including Australia (see Box 10), the Philippines and Viet Nam. There is no one-size-fits-all plan, and resources and commitment for creating such a plan will vary from country to country (not least on the basis of each country’s drowning problem), but certain elements are universal: success of the plan will depend on winning stakeholders’ support, clearly defining objectives and actions, and monitoring progress (see Figure 6).
Any national water safety plan should aim to:
raise awareness of safety around water and the importance of drowning prevention;
build consensus around solutions and develop a coherent, effective response involving all relevant partners;
provide strategic direction and a framework to guide multisectoral efforts to prevent drowning;
monitor action, including obtaining better data and reporting on drowning and prevention.
9
FIGURE 6
ESSENTIAL STEPS FOR DEVELOPING A NATIONAL WATER SAFETY PLAN
Assess the drowning situation and raise awareness. If needed, establish data collection systems ensuring data on drowning is accurate, timely and inclusive.
Engage stakeholders and identify leadership.
Agree upon a vision and principles of the stategy, and define its goals.
Set objectives and select evidence-based drowning prevention strategies to be implemented.
Establish priorities, responsibilities and coordination mechanisms and define resource needs.
Obtain stakeholder and government approval.
Implement, monitor and revise strategy and targets as necessary.
STEP
1
STRATEGIC PRINCIPLES Appropriate targets Coordinated and integrated Evidence-based Data driven Continually monitored
STEP
2STEP
3STEP
4STEP
5STEP
6STEP
7
36 SECTION 2 | TEN ACTIONS TO PREVENT DROWNING

GLOBAL REPORT ON DROWNING 37
BOX 10
NATIONAL WATER SAFETY STRATEGY, AUSTRALIA
The Australian Water Safety Strategy 2012–2015 aims to halve the country’s drowning deaths by 2020 by targeting three priority areas and 10 associated goals.
Supported by the Australian government, the Australian Water Safety Council* leads, facilitates and promotes the strategy (drawn up in collaboration with water safety agencies, government and other groups with an interest in preventing drowning) through its extensive community network. The strategy’s priorities and goals are:
PRIORITY AREA 1TAKING A LIFE STAGES APPROACH
1. Reduce drowning deaths in children aged 0–14 years
2. Reduce drowning deaths in young people aged 15–24 years
3. Reduce drowning deaths in people aged over 55 years
PRIORITY AREA 2TARGETING HIGH-RISK LOCATIONS
4. Reduce drowning deaths in inland waterways
5. Reduce surf beach drowning deaths
6. Reduce drowning deaths by strengthening the aquatic industry
PRIORITY AREA 3FOCUSING ON KEY DROWNING CHALLENGES
7. Reduce alcohol and drug-related drowning deaths
8. Reduce drowning deaths attributed to watercraft and recreational aquatic activities
9. Reduce drowning deaths in high-risk populations
10. Reduce the impact of disaster and extreme weather on drowning deaths
GLOBAL REPORT ON DROWNING 37
* Convened by Royal Life Saving Society – Australia (RLSSA); Surf Life Saving Australia (SLSA); Australian Council for Teachers of Swimming and Water Safety (AUSTSWIM); members also include the Australian Leisure Facilities Association (ALFA); Australian National Sportfishing Association; Australian Swim Coaches and Teachers Association; Divers Alert Network (DAN); Farmsafe; KidSafe; Surfing Australia; Swimming Australia.

38 EXECUTIVE SUMMARY
The number of people set to benefit from implementation research* assessing the largescale effectiveness of two childhood drowning prevention interventions (playpens and crèches) in rural Bangladesh.
*This is a study by the Johns Hopkins Bloomberg School of Public Health’s International Injury Research Unit in collaboration with International Centre for Diarrhoeal Disease Research and Center for Injury Prevention and Research Bangladesh, funded by Bloomberg Philanthropies.
Source: Hyder AA, Alonge O, He S, Wadhwaniya S et al. Saving of Children’s lives from Drowning in Bangladesh. American Journal of Preventive Medicine. 2014 (in press).
38 SECTION 2 | TEN ACTIONS TO PREVENT DROWNING
1.2 million

GLOBAL REPORT ON DROWNING 39
ADDRESS PRIORITY RESEARCH QUESTIONS WITH WELL-DESIGNED STUDIES
Further research can do much to clarify key issues and should be actively supported.
Drowning is a leading and preventable killer that has been largely overlooked, and there are a number of areas where further research is urgently needed. Key areas and potentially innovative interventions that should be on the global drowning research and development agenda include:
1. Improving drowning data in countries to understand the full extent and circumstances of drowning, to target interventions and evaluate their effectiveness;
2. Improving understanding of swim skills training as a public health approach. This includes:
characterizing determinants of swim skills protection across different drowning risk environments;
determining what types of risk management protocols – including identifying children with conditions that put them at increased risk of drowning during swim skills training – are best suited to low- and middle-income countries in order to ensure that children are safely trained;
determining best practices for training of trainers and identifying suitability of teachers and other community members to serve as swim skills instructors;
characterizing the most effective models to provide swim skills training, including through integration within primary school curricula.
3. Improving understanding of the contextual features that impact drowning programme effectiveness, including cultural barriers to CPR and acquisition of swimming skills, supervision of children, risk taking, enforcement of legislation and alcohol;
4. Improved understanding of effectiveness for a number of potential interventions, including:
providing PFDs to children to enhance safe access to school in high-risk locations and to people engaged in fishing or water transport;
establishing systems for sending text messages to mobile phones to provide early warnings of approaching cyclones, storm surges or tsunamis;
determining best practices in teaching safe rescue and resuscitation to potential bystander rescuers in low- and middle-income countries.
5. Demonstrating scalability and sustainability for effective drowning prevention measures.
Well-designed studies in these areas would do much to increase and refine our knowledge of practical solutions in locations where the burden is highest. More frequent use of cost data in the context of research involving interventions will allow for better understanding of cost-effectiveness. In turn this can help build the case for prioritizing drowning prevention, and prioritizing different drowning prevention strategies themselves. Finally, a mechanism that facilitates sharing of key findings and ideas among researchers, and prioritization of research studies will do much to ensure that resources are used effectively.
FURTHER RESEARCH
10

40 EXECUTIVE SUMMARY40

GLOBAL REPORT ON DROWNING 41GLOBAL REPORT ON DROWNING 41
SECTION 3
CONCLUSION AND RECOMMENDATIONS TIME TO ACT ON A PREVENTABLE KILLER
Drowning is a leading global killer, particularly among children and young adults. It is preventable but neglected relative to its impact on families, communities and livelihoods.
GLOBAL REPORT ON DROWNING 41GLOBAL REPORT ON DROWNING 41

This report has presented the evidence for a range of proven interventions to prevent drowning that can be implemented at household, community or national level in many of the low- and middle-income settings where they are most needed.
These interventions range from teaching basic swim skills to installing barriers around water, and from providing safe spaces for children such as crèches to learning about safe rescue. Tailored to individual settings and risk groups, countries should also take steps to improve data on drowning mortality and morbidity, and establish a national water safety plan. Such plans can catalyse support and action to reduce drowning deaths, and provide a framework under which multisectoral efforts can be coordinated to carry out these actions.
DROWNING IS A MULTISECTORAL ISSUE
Drowning prevention has much in common with other public health agendas including safe water supply, rural development, disaster risk management and child health. More must be done to maximize these synergies – for example, village-based day care for pre-school children not only provides the early child development benefits associated with day care but also prevents drowning. Likewise, drowning risks could become a more clearly stated consideration of disaster risk management efforts in settings where flood disasters occur.
Given the multisectoral nature of drowning, a global partnership for drowning prevention should be established, serving as a policy and implementation leadership community for the issue of drowning prevention.
In summary, donors, development agencies, governments in high-burden drowning settings and the research and policy communities must prioritize drowning prevention and its integration with other public health agendas.
The fact that drowning has been largely overlooked to date means there are many low-hanging fruit that can provide quick gains in drowning prevention.
Now is the time to act.
RECOMMENDATIONS
All countries should implement proven drowning prevention strategies, tailored to their own circumstances and risk groups
As young children are so frequently the victims of drowning, emphasis should be placed on provision of safe places for pre-school children with close, capable adult supervision, placement of barriers between children and water hazards, and teaching basic swimming, water safety and safe rescue skills to primary school children.
Governments in countries with a high drowning burden must also engage with donors, NGOs, academia and relevant UN agencies (including WHO) to ensure that progress on drowning prevention is effective and sustainable. This includes the continued search for best practices and cost-effective solutions.
All countries should take steps to improve data about drowning
Drowning prevention strategies require data collection on drowning rates and the circumstances surrounding the drowning (in some countries it may be necessary to include establishing a system to collect data about the drowning of migrants, refugees and stateless people during so-called irregular travel or migration). Once interventions are
1
2
42 SECTION 3 | CONCLUSION AND RECOMMENDATIONS

GLOBAL REPORT ON DROWNING 43
All countries should aim to develop a national water safety plan
The plan should be broadly in line with the description of the national plan given in this report (page 36) and may draw inspiration from the national plans referenced in Appendix 1 (see pages 47-48). The national plan should also include the human and financial resources to implement it. The plan should set appropriate targets relevant to the drowning situation in each country, and outline the evidence-based mechanisms that will be used to achieve those targets.
The national plan should be developed either in a process that involves a review of legislation and standards governing water safety and boating regulations and flood disaster risk management measures, or if the strategy already exists, these issues should be reviewed as part of a regular and recurring progress review. Action should be taken to implement enforcement campaigns to ensure the safety of those working or travelling on or around water.
A global partnership for drowning prevention should be established
Given the multisectoral nature of the drowning problem and the relative lack of coordinated engagement to date on this issue, a partnership could do a great deal to catalyse and advance work on drowning prevention. The establishment of a global platform to prevent drowning has been recommended and discussed during the last two World Conferences on Drowning Prevention – a biannual conference organized by the ILS. The aim of the partnership would be to serve as a policy and implementation leadership community on drowning prevention. Objectives of the partnership would include: setting priorities for further development of the drowning prevention field; technical exchange; improvements in gathering drowning mortality and morbidity data; development of guidance for drowning prevention for governments; and raising the profile of drowning prevention in relevant political and public health discussions.
Membership of the partnership should include representation from relevant UN agencies including WHO, IMO, UNICEF and UNISDR; international federations with a focus on swimming and drowning such as ILS; key development assistance agencies; key NGOs and academic institutions engaged in drowning prevention, rural development, disaster preparedness, safe drinking water and child survival issues; public health agencies; and representation from relevant government and industry sectors of a number of core countries with a high drowning burden.
GLOBAL REPORT ON DROWNING 43
implemented, data are also needed to monitor and evaluate how well strategies perform. Countries should implement death registration and/or increase coverage to close to 100% of deaths, including in rural areas, and code deaths using International Classification of Disease (ICD-10) rules. For settings where it will take time to achieve a fully functioning vital registration system, sample vital registration using verbal autopsy in surveys and censuses can be performed. These should use the WHO verbal autopsy instrument that covers drowning. Consideration can also be given to establishing fatal injury surveillance systems in mortuaries and hospitals following WHO guidance.
3
4

APPENDIX 1
PREVENTING DROWNING – FURTHER READING AND RESOURCES This section provides further reading and resources on some of the drowning prevention strategies discussed in this report.
44

INSTALL BARRIERS CONTROLLING ACCESS TO WATER
Product safety standards for barriers are important, particularly when considering how to manufacture them at scale and how they can be used in a wide variety of settings without compromising the essential attributes specified by relevant product safety standards.
The most recent product safety standards for playpens, safety barriers and swimming pool fencing (from Australia, the USA and Europe are:
PLAYPENS
EN 12227:2010, Playpens for domestic use – safety requirements and test methods.
ASTM F406-13, Standard consumer safety specification for non-full-size baby cribs/play yards.
SAFETY BARRIERS (EXPANSION GATES AND EXPANDABLE ENCLOSURES)
EN 1930:2011, Child use and care articles – safety barriers – safety requirements and test methods.
ASTM F1004-12, Standard consumer safety specification for expansion gates and expandable enclosures.
SWIMMING POOL FENCING
AS 1926.1-2012, Swimming pool safety – safety barriers for swimming pools.
For more information on these standards, visit the relevant standard-issuing body:
European Standards www.en-stan dard.eu
AS Standard (Australia) www.standards.org.au
ASTM International (USA) www.astm.org
PROVIDE SAFE PLACES AWAY FROM WATER FOR PRE-SCHOOL CHILDREN, WITH CAPABLE CHILD CARE
VILLAGE-BASED CRÈCHE CASE STUDY, BANGLADESH
As described in Section 2, ‘Provide safe places away from water for pre-school children, with capable child care’, a retrospective cohort analysis in Bangladesh followed a total of 18 596 children with access to village-based crèches for an average of 2.6 years between 2006 and 2010; these were compared to matched controls. The children who participated in the village crèche had an 82% lower chance of drowning than children who did not participate in the crèche.
For more information see Rahman F, Bose S, Linnan L, Rahman A, Mashreky S, Haaland B, Finkelstein E. Cost-effectiveness of an injury and drowning prevention program in Bangladesh. Pediatrics. 2012;130(6).
TEACH SCHOOL-AGE CHILDREN BASIC SWIMMING, WATER SAFETY AND SAFE RESCUE SKILLS
SWIMSAFE BANGLADESH CASE STUDY
SwimSafe is a basic swimming programme (using a well-defined stroke) running in Bangladesh, Thailand and Viet Nam. Section 2 provides strong evidence of the benefits of trained instructors teaching basic swimming and safe rescue to rural children aged 4–12 years in controlled environments to prevent drowning.
This 2006–2010 retrospective cohort study of 79 421 participant children and matched control groups showed a 93% reduction in fatal drowning in participants compared to those in non-attending control groups.
GLOBAL REPORT ON DROWNING 45

SwimSafe Bangladesh: teaches basic swimming, water safety and
safe rescue skills; uses village ponds modified with submerged
platforms for safe training; uses a curriculum developed locally and
certified by the Royal Life Saving Society of Australia;
includes child participants age 3–17 years; is free to child participants; implements child-to-trained instructor ratios
of between 2:1 and 5:1 based on children’s ability, age and other factors such as malnutrition, asthma, seizures, learning or physical disabilities;
is usually delivered in 14 lessons over two weeks;
has already been taught to over 400 000 children.
For more information see Rahman F, Bose S, Linnan L, Rahman A, Mashreky S, Haaland B, Finkelstein E. Cost-effectiveness of an injury and drowning prevention program in Bangladesh. Pediatrics. 2012;130(6).
TRAIN POTENTIAL BYSTANDER RESCUERS IN SAFE RESCUE AND RESUSCITATION
As emphasized in the main text of the report, once drowning begins, seconds count. Immediate and safe rescue, followed by appropriate resuscitation, are both vital to the survival of a drowning victim and their prospects for avoiding disability. Despite the challenges inherent in addressing the provision of training in low- and middle-income settings where the need is greatest, increasing the number of people capable of responding appropriately in a drowning situation is an important priority in drowning prevention.
FURTHER SAFE RESCUE AND RESUSCITATION TRAINING REFERENCES
Turgut A, Turgut T. A study on rescuer drowning and multiple drowning incidents. Journal of Safety Research. 2012; (43)129–132.
Pearn JH, Franklin R. Flinging the squaler. Lifeline rescues for drowning prevention. International Journal of Aquatic Research and Education. 2009;(3) 315–321.
Borse NN, Hyder AA, Streatfield PK, Arifeen SE, Bishai D. Childhood drowning and traditional rescue measures: case study from Matlab, Bangladesh. Archives of Disease in Childhood. 2011;(96) 675–680.
International Life Saving Federation certificates for lifesaver, lifeguard and rescue diver certification: http://www.ilsf.org/certification.
International Life Saving Federation position statements including medical statements on resuscitation: http://www.ilsf.org/about/position-statements.
Mecrow TS, Rahman A, Linnan M, Scarr J, Mashreky SR, Talab A, Rahman F. Children reporting rescuing other children drowning in rural Bangladesh: a descriptive study. Injury Prevention. doi:10.1136/injuryprev-2013-041015.
The lifesaving manual for instructors: safeguarding lives in, on and near water. Royal Life Saving Society UK. August, 2011.
SET AND ENFORCE SAFE BOATING, SHIPPING AND FERRY REGULATIONS
The International Maritime Organization (IMO) is the United Nations body responsible for establishing regulations for international shipping, while Interferry is the main body representing the ferry industry worldwide. IMO and Interferry have together launched an ambitious 10-year action plan related to domestic ferry safety with a view to reducing ferry-related fatalities by 90%.
For more information visit www.interferry.com/ferry_safety_project and www.interferry.com/about/facts.
46 APPENDIX 1

FURTHER SAFE BOATING AND FERRY RESOURCES AND REFERENCES:
Lawson CT, Weisbrod RE. Ferry transport: the realm of responsibility for ferry disasters in developing nations. Journal of Public Transportation. 2005;131.247.19.1.
SMALL OR RECREATIONAL BOATING REGULATION EXAMPLES:
Victorian recreational boating safety handbook. Victoria: Transport Safety Victoria; 2012 (www.transportsafety.vic.gov.au/maritime-safety/recreational-maritime/recreational-boating-safety-handbook, accessed 29 May 2014).
BUILD RESILIENCE AND MANAGE FLOOD RISKS AND OTHER HAZARDS LOCALLY AND NATIONALLY
Emerging evidence suggests that the ability to swim may help people in sudden flooding situations such as tsunamis. This is an important aspect of drowning prevention as flood risk worldwide is increasing. World Meteorological Organization reports that the decade 2001–2010:
was the second wettest since 1901, and 2010 was the wettest year since instrumental records began;
floods were the most frequent extreme events;
storm-deaths declined by 16% and flood deaths by 43%, mainly due to better early warning systems and increased preparedness, despite population increases in disaster-prone areas.
FURTHER FLOODING AND DISASTER RISK REDUCTION RESOURCES AND REFERENCES:
World Health Organization Regional Office for Europe (WHO-EURO) and Public Health England. Floods in the WHO European Region: health effects and their prevention. Copenhagen: WHO-EURO; 2013 (http://www. euro.who.int/__data/assets/pdf_file/0020/ 189020/e96853.pdf, accessed 29 May 2014).
Malilay J. Floods. In: Noji E, ed. The public health consequences of disasters. New York, Oxford University Press; 1997:287–302.
Ahern M, Kovats S. The health impacts of floods. In: Few R, Matthies F, eds. Flood hazards and health: responding to present and future risks. London, Earthscan; 2006:28–53.
Turgut A, Turgut T. Floods and drowning incidents by floods. World Applied Sciences Journal. 2012;16(8): 1158–1162.
The Global Climate 2001– 2010. A decade of climate extremes. Geneva: World Meteorological Organization; 2013 (http://library.wmo.int/pmb_ged/wmo_1119_en.pdf, accessed 29 May 2014).
Developing Early Warning Systems: a checklist. EWC III – Third International Conference on Early Warning, Bonn, Germany 27–29 March 2006 (http://www.unisdr.org/files/608_10340.pdf, accessed 29 May 2014).
Global Assessment Reports on disaster risk reduction. Geneva: UNISDR; 2009, 2011 and 2013.
The United Nations World Water Development Report 4 – Managing water under uncertainty and risk. Geneva: UN; 2012.
DEVELOP A NATIONAL WATER SAFETY PLAN
There is a range of countries with national water safety plans, including Australia, Canada, New Zealand, the Philippines, the Netherlands, the UK and Viet Nam.
The Australian Water Safety Strategy 2012–2015 aims to reduce drowning deaths by 50% by 2020, and has been developed by the Australian Water Safety Council members including Royal Life Saving Society – Australia, Surf Life Saving Australia and AUSTSWIM (www.watersafety.com.au/Portals/0/AWSC%20Stragegy%202012-15/
GLOBAL REPORT ON DROWNING 47

AWSC_Strategy2012_Brochure%20-%20Lowres.pdf).
The Philippines’ plan has been drawn up by the Philippine Drowning Prevention Council – an NGO-led consultative forum comprising strategic water safety and related government agencies who aim to raise key drowning prevention issues with government, industry and local communities (www.philippinelifesaving.org/filecabinet/PDPPlan2010-15Primer.pdf).
In the Netherlands, the policy environment has a strong focus on flood prevention and control. The Netherlands’ National Water Management Centre in Lelystad monitors water flow in the Netherlands and coordinates the day-to-day changes necessary to keep water levels within the country at an optimal and safe level. In cases of potential flood crises, the National Coordinating Centre provides relevant information to decision makers (see www.rijkswaterstaat.nl). In addition, the Netherlands’ Delta programme aims to protect the country from high water and ensure fresh water supply, and while its focus is not on drowning prevention, it is a strong example of how important preventing water-related natural hazards is for some countries (www.deltacommissaris.nl/english/).
New Zealand’s water safety plan is implemented by Water Safety New Zealand (a membership organization comprising boating, marine, fishing, swimming and recreational bodies, and coastguard and police) and aims to lower the country’s drowning toll through leadership, awareness of hazards and how to stay safe around water, as well as toolkits for educators (www.watersafety.org.nz).
The UK launched a drowning prevention strategy in 2013. The strategy is implemented by the National Water Safety Forum, which comprises six specialist advisory groups focusing on safety in relation to beaches, inland water, sea, swimming pools, and on water sports safety information and research. A coordinating group provides a direct link with the national government and the search and rescue sector. The forum’s secretariat is based in the Royal
Society for the Prevention of Accidents and it aims to have a strong voice with government on water safety issues (www.nationalwatersafety.org.uk).
ADDRESS PRIORITY RESEARCH QUESTIONS WITH WELL-DESIGNED STUDIES
For more on relevant research questions and a comprehensive overview of the current knowledge of drowning prevention, rescue and treatment, see Bierens J, editor. Drowning. Heidelberg: Springer Verlag; 2014.
FURTHER DROWNING PREVENTION INTERVENTION REFERENCES:
Hyder AA, Borse N, Blum L, Khan R, El Arifeen S, Baqui AH. Childhood drowning in low- and middle-income countries: Urgent need for intervention trials. Journal of Paediatrics and Child Health. 2008; 44(4): 221–227.
Borse N, Hyder AA, Bishai D, Baker T, Arifeen SE. Potential risk estimation drowning index for children (PREDIC): a pilot study from Matlab, Bangladesh. Accident Analysis & Prevention. 2011;43(6):1901–6.
Brenner RA, Taneja GS, Haynie DL, Trumble AC, Qian C, Klinger RM, Klebanoff MA. Association between swimming lessons and drowning in childhood: a case-control study. Archives of Pediatric & Adolescent Medicine. 2009;Mar;163(3):203–10.
48 APPENDIX 1

GLOBAL REPORT ON DROWNING 49GLOBAL REPORT ON DROWNING 49
APPENDIX 2
DATA

ESTI
MATE
D N
UM
BER
OF
DEA
THS F
RO
M D
RO
WN
ING
, BY S
EX,
AG
E G
RO
UP,
W
HO
REG
ION
AN
D I
NCO
ME
LEVEL
, 201
21
ESTI
MATE
D R
ATE
S O
F D
EATH
S F
RO
M D
RO
WN
ING
, BY S
EX,
AG
E G
RO
UP,
W
HO
REG
ION
AN
D I
NCO
ME
LEVEL
, 201
2,
PER
100 0
00 P
OPULA
TIO
N1,
2
Sou
rce:
WH
O G
loba
l H
ealth
Est
imat
es.
*
Rat
e pe
r 10
0 0
00 liv
e bi
rths
—
Dis
aggr
egat
ed d
ata
on liv
e bi
rths
wer
e no
t av
aila
ble
to e
stim
ate
rate
s by
sex
or
regi
on.
1 E
stim
ates
cov
er IC
D-1
0 c
ateg
orie
s W
65-W
74,
and
th
eref
ore
do n
ot inc
lude
dro
wni
ngs
due
to n
atur
al
disa
ster
s, int
ention
al d
row
ning
s, o
r aq
uatic
tran
spor
t.
2 V
alue
s in
the
‘A
ll ag
es’
colu
mns
are
age
-sta
ndar
dize
d.
The
rem
aini
ng v
alue
s ar
e cr
ude
deat
h ra
tes
per
10
0 0
00 p
opul
atio
n.
YEAR
201
2
REGI
ON
TOTA
L BO
TH
SEXE
SAl
l age
s
MAL
EFE
MAL
E
All a
ges
0-27
da
ys1-
59
mon
ths
5-9
ye
ars
10-1
4 ye
ars
15-2
4 ye
ars
25-4
4 ye
ars
45
year
s+Al
l age
s0-
27
days
1-59
m
onth
s5-
9
year
s10
-14
year
s15
-24
year
s25
-44
year
s45
ye
ars+
WOR
LD37
2,44
1 2
50,3
5389
3 3
7,87
0 2
9,69
0 1
9,60
5 4
2,15
1 5
1,78
7 6
8,35
712
2,08
963
0 2
6,61
4 1
4,77
9 1
0,13
8 1
3,76
3 1
4,77
6 4
1,38
9
HIG
H-I
NCO
ME
COU
NTR
IES
34,4
55 2
6,25
812
891
574
488
2,9
67 7
,161
14,
164
8,1
976
406
172
180
368
1,0
29 6
,036
LOW
- AN
D
MID
DLE-
IN
COM
E
COU
NTR
IES
Afric
an R
egio
n75
,468
50,
650
170
10,
416
8,8
52 5
,066
11,
203
9,6
16 5
,327
24,
819
101
6,8
13 5
,643
3,0
11 3
,447
2,6
79 3
,126
Reg
ion
of th
e Am
eric
as17
,564
14,
539
19 1
,333
793
1,0
23 3
,487
4,2
55 3
,628
3,0
26 1
2 7
8136
937
0 3
9745
164
6
East
ern
Med
iterr
anea
n R
egio
n29
,484
18,
795
111
4,8
91 1
,990
1,3
47 3
,818
3,6
37 3
,001
10,
690
86 4
,333
1,2
22 7
47 1
,324
1,1
27 1
,850
Euro
pean
Reg
ion
11,1
21 8
,781
26 9
64 3
42 3
17 1
,116
2,7
29 3
,286
2,3
4018
617
120
126
208
388
864
Sout
h-Ea
st A
sia
Reg
ion
130,
149
87,
782
385
13,
054
11,
738
6,6
39 1
3,41
8 1
8,54
1 2
4,00
8 4
2,36
827
1 9
,749
4,6
11 4
,068
5,8
58 5
,185
12,
625
Wes
tern
Pac
ific
Reg
ion
73,4
54 4
2,97
8 1
70 6
,308
5,3
78 4
,694
6,0
47 5
,698
14,
683
30,
476
136
3,9
05 2
,633
1,6
29 2
,146
3,8
90 1
6,13
7
YEAR
201
2
REGI
ON
TOTA
L BO
TH
SEXE
SAl
l age
s
MAL
EFE
MAL
E
All a
ges
0-27
da
ys1-
59
mon
ths
5-9
ye
ars
10-1
4 ye
ars
15-2
4 ye
ars
25-4
4 ye
ars
45
year
s+Al
l age
s0-
27
days
1-59
m
onth
s5-
9
year
s10
-14
year
s15
-24
year
s25
-44
year
s45
ye
ars+
WOR
LD5.
2 7
.0
–11
.4
9.3
6.4
6.8
4.9
7.3
3.4
–
8.6
5.0
3.5
2.3
1.5
4.1
HIG
H-I
NCO
ME
COU
NTR
IES
2.3
3.8
–
2.4
1.6
1.4
3.6
3.9
5.8
0.9
–
1.2
0.5
0.5
0.5
0.6
2.1
LOW
- AN
D
MID
DLE-
IN
COM
E
COU
NTR
IES
Afric
an R
egio
n7.
9 1
0.8
–14
.3
14.0
9.
3 12
.6
8.9
9.3
5.0
–
9.6
9.1
5.6
3.9
2.5
4.9
Reg
ion
of th
e Am
eric
as3.
0 5
.1
–5.
12.
9 3.
7 6.
7 5.
0 5.
4 1
.0
–3.
1 1.
4 1.
4 0.
8 0.
5 0.
8
East
ern
Med
iterr
anea
n R
egio
n5.
0 6
.4
–14
.1
6.2
4.4
6.6
4.6
6.0
3.6
–
13.2
4.
0 2.
6 2.
4 1.
4 3.
6
Euro
pean
Reg
ion
4.0
6.6
–
9.3
3.5
3.3
5.0
6.7
8.6
1.7
–
6.3
1.3
1.4
1.0
1.0
1.8
Sout
h-Ea
st A
sia
Reg
ion
7.4
9.8
–
14.4
12
.6
7.2
7.7
6.6
11.6
5
.0
–11
.8
5.4
4.8
3.6
1.9
6.0
Wes
tern
Pac
ific
Reg
ion
4.8
5.6
–
10.5
9.
6 8.
6 4.
2 2.
1 5.
6 3
.9
–7.
5 5.
4 3.
4 1.
6 1.
5 6.
2
50 APPENDIX 2

GLOBAL REPORT ON DROWNING 51
DEA
THS F
RO
M D
RO
WN
ING
1 A
S R
EPO
RTE
D T
O W
HO
BY C
OUN
TRIE
S/A
REA
S
COUN
TRY/
AREA
YEAR
MEA
SURE
BOTH
SEX
ES
COM
BINE
D
MAL
ES
FEM
ALES
NO
TES
ALL
< 1
1–4
5–9
10–1
415
–19
20–2
425
–44
45+
ALL
< 1
1–4
5–9
10–1
415
–19
20–2
425
–44
45+
Alba
nia
2004
No.
9867
03
68
812
1614
310
74
32
08
7a
Rate
3.2
4.4
0.0
2.8
4.2
5.1
5.0
9.4
3.8
3.3
2.0
0.0
7.2
2.9
2.0
1.3
0.0
1.8
1.6
Angu
illa20
12No
.1
10
00
00
00
10
00
00
00
00
Rate
––
––
––
––
––
––
––
––
––
–
Antig
ua
and
Barb
uda
2009
No.
55
10
00
22
00
00
00
00
00
0a
Rate
––
––
––
––
––
––
––
––
––
–
Arge
ntin
a20
12No
.70
456
93
6618
3088
7415
713
313
56
419
79
815
38
Rate
1.7
2.8
0.9
4.8
1.1
1.8
5.1
4.3
2.7
2.4
0.7
1.8
3.1
0.6
0.4
0.6
0.5
0.3
0.6
Arm
enia
2012
No.
6058
03
11
514
1519
20
01
00
00
1a
Rate
1.9
3.8
0.0
3.4
1.0
1.1
4.4
9.9
3.6
4.0
0.1
0.0
0.0
1.2
0.0
0.0
0.0
0.0
0.2
Arub
a20
12No
.7
60
01
00
01
41
00
00
00
01
Rate
––
––
––
––
––
––
––
––
––
–
Aust
ralia
2011
No.
332
246
217
113
1121
7310
886
37
04
46
2240
Rate
1.4
2.1
1.2
2.8
1.5
0.4
1.4
2.5
2.3
2.5
0.7
2.0
1.2
0.0
0.6
0.5
0.7
0.7
0.9
Aust
ria20
12No
.15
598
02
30
26
2164
571
10
00
14
50
Rate
1.3
1.9
0.0
1.2
1.5
0.0
0.8
2.2
1.8
3.5
0.8
2.5
0.6
0.0
0.0
0.0
0.4
0.3
2.4
Azer
baija
n20
07No
.63
430
121
34
56
1220
06
04
12
43
Rate
0.7
1.0
0.0
4.4
0.3
0.7
0.8
1.1
0.5
1.2
0.5
0.0
2.6
0.0
1.0
0.2
0.5
0.3
0.3
Baha
mas
2010
No.
2015
00
00
10
68
50
30
00
00
2
Rate
5.5
8.3
0.0
0.0
0.0
0.0
6.1
0.0
10.8
16.8
3.1
0.0
29.8
0.0
0.0
0.0
0.0
0.0
3.5
Sta
tistic
s ar
e pr
esen
ted
for
coun
trie
s/ar
eas
whe
re the
pro
port
ion
of the
tot
al d
eath
s from
all
caus
es
repo
rted
to
WH
O r
epre
sent
ed a
t le
ast 70
% o
f al
l dea
ths
that
occ
urre
d in
the
res
pect
ive
coun
trie
s/ar
eas.
Sou
rce:
WH
O M
orta
lity
Dat
abas
e as
of
30 A
pril
201
4.
1 D
row
ning
: IC
D-1
0 c
odes
W65–W
74,
V90,
V92,
X71
, X92 a
nd Y
21 a
part
fro
m
coun
trie
s/ar
eas
indi
cate
d by
'b'
, w
here
dat
a w
ere
only
ava
ilabl
e fo
r co
des
W65–W
74.
Not
esa
Dat
a fr
om v
ital
reg
istr
atio
n sy
stem
with
cove
rage
est
imat
ed
at
70–8
4%
. C
ount
ries
witho
ut t
he ‘
a’ n
otat
ion
have
vital
regi
stra
tion
sys
tem
s w
ith
cove
rage
est
imat
ed a
t 85%
or
high
er.
b
Dat
a on
ly a
vaila
ble
for
code
s W
65–W
74
No.
N
umbe
r of
dea
ths
Rat
e N
umbe
r of
dea
ths
per
100 0
00 p
opul
atio
n —
Not
ava
ilabl
e/ap
plic
able
Rat
es a
re n
ot c
ompu
ted
for
coun
trie
s w
ith
popu
lation
bel
ow 2
00 0
00.
Rat
es in
colu
mns
for
bot
h se
xes
com
bine
d, o
r fo
r al
l m
ales
or
all fe
mal
es
colu
mns
, ar
e ag
e-st
anda
rdiz
ed d
eath
rat
es p
er 1
00 0
00.
Deat
hs
where
the a
ge a
nd s
ex
of
the d
ece
ased w
ere
not
know
n w
ere
pr
opor
tion
atel
y re
dist
ribu
ted
acro
ss a
ge g
roup
s an
d se
x ba
sed
on t
he
dist
ribu
tion
of
drow
ning
dea
ths
in t
he p
opul
atio
n. T
he n
umbe
rs o
f de
aths
ha
ve t
here
fore
bee
n ro
unde
d to
the
nea
rest
who
le n
umbe
r. A
ny a
ppar
ent
di
scre
panc
y in
the
tot
al s
ums
is d
ue t
o ro
undi
ng.

52 EXECUTIVE SUMMARY
DEA
THS F
RO
M D
RO
WN
ING
AS R
EPO
RTE
D T
O W
HO
BY C
OUN
TRIE
S/A
REA
S C
ON
TIN
UED
COUN
TRY/
AREA
YEAR
MEA
SURE
BOTH
SEX
ES
COM
BINE
DM
ALES
FE
MAL
ES
NOTE
SAL
L<
11–
45–
910
–14
15–1
9 20
–24
25–4
445
+AL
L<
11–
45–
910
–14
15–1
9 20
–24
25–4
445
+
Bahr
ain
2009
No.
2014
11
21
00
63
60
20
00
13
0
Rate
1.9
2.5
11.7
2.8
4.6
2.7
0.0
0.0
1.6
2.3
1.0
0.0
5.8
0.0
0.0
0.0
2.2
1.7
0.0
Barb
ados
2011
No.
75
00
00
11
12
20
00
00
00
2
Rate
2.3
3.6
0.0
0.0
0.0
0.0
9.5
9.3
2.4
4.1
1.0
0.0
0.0
0.0
0.0
0.0
0.0
0.0
3.6
Bela
rus
2009
No.
837
717
18
2111
4072
261
302
120
05
49
13
2870
bRa
te8.
014
.51.
84.
09.
14.
612
.217
.218
.518
.72.
10.
02.
61.
83.
90.
30.
72.
03.
0
Belg
ium
2010
No.
201
117
03
50
33
2281
841
10
00
06
76
Rate
1.3
1.7
0.0
1.1
1.6
0.0
0.9
0.9
1.5
3.6
1.0
1.5
0.4
0.0
0.0
0.0
0.0
0.4
3.0
Beliz
e20
10No
.28
230
13
11
38
65
02
01
00
11
Rate
10.0
17.0
0.0
6.6
16.1
5.6
6.1
19.7
18.1
26.0
3.2
0.0
13.6
0.0
5.7
0.0
0.0
2.2
4.1
Berm
uda
2010
No.
54
01
00
00
21
10
00
00
00
1
Rate
––
––
––
––
––
––
––
––
––
–
Boliv
ia (P
lurin
a-tio
nal S
tate
of)
2003
No.
8354
311
012
140
113
293
80
46
05
3
Rate
––
––
––
––
––
––
––
––
––
–
Bosn
ia a
nd
Herz
egov
ina
2011
No.
33
00
00
00
03
00
00
00
00
0
Rate
0.0
0.1
0.0
0.0
0.0
0.0
0.0
0.0
0.0
0.4
0.0
0.0
0.0
0.0
0.0
0.0
0.0
0.0
0.0
Braz
il20
11No
.64
8755
7413
300
209
343
728
627
1923
1431
913
1416
694
121
8449
195
190
Rate
3.3
5.7
0.9
4.8
2.4
3.9
8.7
7.3
6.3
5.8
0.9
1.0
2.8
1.1
1.4
1.0
0.6
0.6
0.7
Briti
sh
Virg
in Is
land
s20
09No
.8
80
00
00
24
20
00
00
00
00
Rate
––
––
––
––
––
––
––
––
––
–
Brun
ei
Daru
ssal
am20
11No
.13
110
20
01
24
22
00
00
00
11
Rate
3.2
5.3
0.0
13.0
0.0
0.0
5.2
9.2
4.8
4.8
1.0
0.0
0.0
0.0
0.0
0.0
0.0
1.3
2.6
Bulg
aria
2012
No.
142
107
04
24
48
2461
350
11
20
13
27
Rate
1.7
2.7
0.0
2.8
1.2
2.5
2.2
3.5
2.2
3.9
0.7
0.0
0.7
0.6
1.3
0.0
0.5
0.3
1.4
Cana
da20
11No
.46
335
00
119
819
3497
172
113
13
21
56
2174
Rate
1.2
1.9
0.0
1.4
1.0
0.8
1.7
2.8
2.0
2.4
0.5
0.5
0.4
0.2
0.1
0.5
0.5
0.4
1.0
Caym
an Is
land
s20
10No
.2
20
00
00
01
10
00
00
00
00
Rate
––
––
––
––
––
––
––
––
––
–
Not
esa
Dat
a fr
om v
ital
reg
istr
atio
n sy
stem
with
cove
rage
est
imat
ed
at
70–8
4%
. C
ount
ries
witho
ut t
he ‘
a’ n
otat
ion
have
vital
regi
stra
tion
sys
tem
s w
ith
cove
rage
est
imat
ed a
t 85%
or
high
er.
b
Dat
a on
ly a
vaila
ble
for
code
s W
65–W
74
No.
N
umbe
r of
dea
ths
Rat
e N
umbe
r of
dea
ths
per
100 0
00 p
opul
atio
n —
Not
ava
ilabl
e/ap
plic
able
52 APPENDIX 2

GLOBAL REPORT ON DROWNING 53
COUN
TRY/
AREA
YEAR
MEA
SURE
BOTH
SEX
ES
COM
BINE
DM
ALES
FE
MAL
ES
NOTE
SAL
L<
11–
45–
910
–14
15–1
9 20
–24
25–4
445
+AL
L<
11–
45–
910
–14
15–1
9 20
–24
25–4
445
+
Chile
2011
No.
402
353
116
511
2630
114
150
490
102
43
211
17
Rate
2.3
4.0
0.8
3.2
0.8
1.7
3.5
4.0
4.5
5.7
0.6
0.0
2.1
0.3
0.6
0.4
0.3
0.4
0.6
Colo
mbi
a20
11No
.11
2791
611
103
6464
142
9525
118
621
16
6516
1927
1528
34
Rate
2.4
4.0
2.4
5.6
2.8
2.8
6.4
4.5
3.7
3.5
0.9
1.4
3.7
0.7
0.9
1.3
0.7
0.4
0.6
Cost
a Ri
ca20
12No
.12
411
00
42
78
2137
3114
00
04
02
44
Rate
2.5
4.4
0.0
2.7
1.0
3.4
3.7
9.0
4.9
4.8
0.6
0.0
0.0
0.0
2.0
0.0
0.9
0.6
0.6
Croa
tia20
12No
.13
587
00
12
37
1262
480
00
01
04
43
Rate
2.3
3.3
0.0
0.0
1.0
1.8
2.4
5.3
2.1
6.9
1.2
0.0
0.0
0.0
0.0
0.8
0.0
0.7
4.0
Cuba
2011
No.
262
247
05
511
1621
8610
215
06
10
10
16
Rate
2.2
4.1
0.0
2.1
1.5
3.1
4.2
4.9
5.0
4.8
0.3
0.0
2.7
0.3
0.0
0.3
0.0
0.1
0.3
Cypr
us20
11No
.21
100
10
00
02
711
01
00
00
37
Rate
1.5
1.5
0.0
3.8
0.0
0.0
0.0
0.0
1.1
3.7
1.7
0.0
4.1
0.0
0.0
0.0
0.0
1.8
3.5
Czec
h Re
publ
ic20
12No
.20
915
70
21
15
1144
9352
02
00
13
640
Rate
1.6
2.5
0.0
0.8
0.4
0.4
1.8
3.1
2.6
4.4
0.7
0.0
0.9
0.0
0.0
0.4
0.9
0.4
1.6
Denm
ark
2012
No.
8769
01
00
10
1948
180
00
00
04
14
Rate
1.2
2.0
0.0
0.8
0.0
0.0
0.5
0.0
2.6
4.0
0.4
0.0
0.0
0.0
0.0
0.0
0.0
0.6
1.1
Dom
inic
a20
11No
.6
40
00
10
10
22
10
00
00
01
Rate
––
––
––
––
––
––
––
––
––
–
Ecua
dor
2012
No.
583
475
345
1822
6967
140
111
108
033
1210
66
2021
Rate
3.8
6.2
1.8
6.9
2.2
2.8
9.4
9.5
6.3
6.5
1.3
0.0
5.3
1.6
1.3
0.8
0.9
0.9
1.2
Egyp
t20
11No
.16
1913
435
169
118
184
313
209
258
8727
610
116
3226
2418
2525
Rate
1.8
3.1
0.5
4.6
2.8
4.7
8.2
5.2
2.3
1.0
0.6
1.1
3.3
0.8
0.7
0.7
0.5
0.2
0.3
El S
alva
dor
2011
No.
259
208
13
912
3231
7049
511
56
66
511
11a
Rate
4.2
7.4
1.4
1.2
2.9
3.3
8.7
10.0
9.7
8.8
1.5
1.5
2.1
2.0
1.7
1.7
1.6
1.2
1.5
Esto
nia
2012
No.
5440
00
00
14
1124
140
10
10
02
10
Rate
3.3
5.6
0.0
0.0
0.0
0.0
2.9
8.9
6.0
10.3
1.5
0.0
3.5
0.0
3.3
0.0
0.0
1.1
3.0
Fiji
2011
No.
5543
07
24
35
615
121
21
00
02
5
Rate
6.3
9.7
0.0
19.6
4.8
10.0
7.3
13.0
4.7
15.1
2.8
12.1
6.3
2.7
0.0
0.0
0.0
1.8
5.3
GLOBAL REPORT ON DROWNING 53
DEA
THS F
RO
M D
RO
WN
ING
AS R
EPO
RTE
D T
O W
HO
BY C
OUN
TRIE
S/A
REA
S C
ON
TIN
UED
Not
esa
Dat
a fr
om v
ital
reg
istr
atio
n sy
stem
with
cove
rage
est
imat
ed
at
70–8
4%
. C
ount
ries
witho
ut t
he ‘
a’ n
otat
ion
have
vital
regi
stra
tion
sys
tem
s w
ith
cove
rage
est
imat
ed a
t 85%
or
high
er.
b
Dat
a on
ly a
vaila
ble
for
code
s W
65–W
74
No.
N
umbe
r of
dea
ths
Rat
e N
umbe
r of
dea
ths
per
100 0
00 p
opul
atio
n —
Not
ava
ilabl
e/ap
plic
able

54 EXECUTIVE SUMMARY54 SECTION 3 | CONCLUSION AND RECOMMENDATIONS
COUN
TRY/
AREA
YEAR
MEA
SURE
BOTH
SEX
ES
COM
BINE
DM
ALES
FE
MAL
ES
NOTE
SAL
L<
11–
45–
910
–14
15–1
9 20
–24
25–4
445
+AL
L<
11–
45–
910
–14
15–1
9 20
–24
25–4
445
+
Finl
and
2012
No.
174
132
10
10
36
2794
420
40
00
13
34
Rate
2.4
3.8
3.2
0.0
0.7
0.0
1.8
3.5
3.9
8.0
1.0
0.0
3.4
0.0
0.0
0.0
0.6
0.5
2.5
Fran
ce20
11No
.13
8286
42
198
1027
4016
059
851
83
161
32
343
447
Rate
1.6
2.2
0.5
1.2
0.4
0.5
1.4
2.0
1.9
4.8
1.0
0.8
1.0
0.1
0.2
0.1
0.2
0.5
3.0
Fren
ch G
uian
a20
11No
.15
130
32
31
04
02
00
11
00
00
Rate
5.5
9.7
0.0
27.4
14.6
24.3
8.8
0.0
12.9
0.0
1.4
0.0
0.0
7.6
8.3
0.0
0.0
0.0
0.0
Geor
gia
2012
No.
8663
00
28
97
1521
232
11
00
26
11
Rate
2.0
3.0
0.0
0.0
1.6
6.5
6.0
3.8
2.4
2.8
0.9
7.4
0.9
0.9
0.0
0.0
1.1
0.9
1.1
Germ
any
2012
No.
765
472
27
67
922
8133
829
30
64
41
825
245
Rate
0.6
0.9
0.6
0.5
0.3
0.4
0.4
0.9
0.8
1.7
0.4
0.0
0.4
0.2
0.2
0.1
0.3
0.2
1.1
Gree
ce20
11No
.40
929
70
04
14
1759
212
112
11
10
03
799
Rate
2.5
3.9
0.0
0.0
1.5
0.4
1.4
5.5
3.5
9.0
1.1
1.7
0.5
0.4
0.0
0.0
1.0
0.4
3.7
Gren
ada
2012
No.
33
00
00
00
03
00
00
00
00
0
Rate
––
––
––
––
––
––
––
––
––
–
Guad
elou
pe20
11No
.26
210
00
00
07
145
00
00
00
05
Rate
5.0
9.0
0.0
0.0
0.0
0.0
0.0
0.0
13.1
17.7
1.6
0.0
0.0
0.0
0.0
0.0
0.0
0.0
5.2
Guat
emal
a20
12No
.35
630
71
2116
1645
4898
6249
110
88
24
124
Rate
2.6
4.9
0.5
2.3
1.5
1.7
5.4
7.0
5.9
5.9
0.6
0.5
1.1
0.8
0.8
0.3
0.6
0.6
0.4
Guya
na20
10No
.76
660
52
45
224
2410
01
11
02
41
aRa
te11
.824
.70.
011
.73.
58.
313
.36.
121
.440
.42.
60.
02.
62.
02.
40.
06.
03.
51.
5
Hong
Kon
g SA
R20
11No
.65
360
01
03
26
2329
00
01
00
820
Rate
0.7
0.9
0.0
0.0
0.8
0.0
1.5
1.0
0.7
1.5
0.6
0.0
0.0
0.0
0.7
0.0
0.0
0.6
1.2
Hung
ary
2012
No.
222
168
02
06
1012
4494
540
10
30
18
41
Rate
1.9
3.1
0.0
1.0
0.0
2.4
3.4
3.8
3.0
5.0
0.8
0.0
0.5
0.0
1.3
0.0
0.3
0.6
1.7
Icel
and
2009
No.
86
00
00
00
42
20
00
00
01
1
Rate
2.5
3.7
0.0
0.0
0.0
0.0
0.0
0.0
8.9
3.6
1.2
0.0
0.0
0.0
0.0
0.0
0.0
2.3
1.7
Irela
nd20
10No
.11
275
01
00
45
1946
370
00
02
110
24
Rate
2.3
3.1
0.0
0.7
0.0
0.0
2.9
3.6
2.7
6.3
1.4
0.0
0.0
0.0
0.0
1.5
0.7
1.4
3.1
DEA
THS F
RO
M D
RO
WN
ING
AS R
EPO
RTE
D T
O W
HO
BY C
OUN
TRIE
S/A
REA
S C
ON
TIN
UED
Not
esa
Dat
a fr
om v
ital
reg
istr
atio
n sy
stem
with
cove
rage
est
imat
ed
at
70–8
4%
. C
ount
ries
witho
ut t
he ‘
a’ n
otat
ion
have
vital
regi
stra
tion
sys
tem
s w
ith
cove
rage
est
imat
ed a
t 85%
or
high
er.
b
Dat
a on
ly a
vaila
ble
for
code
s W
65–W
74
No.
N
umbe
r of
dea
ths
Rat
e N
umbe
r of
dea
ths
per
100 0
00 p
opul
atio
n —
Not
ava
ilabl
e/ap
plic
able
54 APPENDIX 2

GLOBAL REPORT ON DROWNING 55GLOBAL REPORT ON DROWNING 55
DEA
THS F
RO
M D
RO
WN
ING
AS R
EPO
RTE
D T
O W
HO
BY C
OUN
TRIE
S/A
REA
S C
ON
TIN
UED
Not
esa
Dat
a fr
om v
ital
reg
istr
atio
n sy
stem
with
cove
rage
est
imat
ed
at
70–8
4%
. C
ount
ries
witho
ut t
he ‘
a’ n
otat
ion
have
vital
regi
stra
tion
sys
tem
s w
ith
cove
rage
est
imat
ed a
t 85%
or
high
er.
b
Dat
a on
ly a
vaila
ble
for
code
s W
65–W
74
No.
N
umbe
r of
dea
ths
Rat
e N
umbe
r of
dea
ths
per
100 0
00 p
opul
atio
n —
Not
ava
ilabl
e/ap
plic
able
COUN
TRY/
AREA
YEAR
MEA
SURE
BOTH
SEX
ES
COM
BINE
DM
ALES
FE
MAL
ES
NOTE
SAL
L<
11–
45–
910
–14
15–1
9 20
–24
25–4
445
+AL
L<
11–
45–
910
–14
15–1
9 20
–24
25–4
445
+
Isra
el20
11No
.45
380
23
31
312
147
01
10
00
23
Rate
0.6
1.0
0.0
0.6
0.8
0.9
0.3
1.0
1.1
1.3
0.2
0.0
0.3
0.3
0.0
0.0
0.0
0.2
0.2
Italy
2010
No.
554
401
07
97
1231
9523
915
30
43
02
414
126
Rate
0.7
1.2
0.0
0.6
0.6
0.5
0.8
2.0
1.1
1.8
0.3
0.0
0.4
0.2
0.0
0.1
0.3
0.2
0.8
Jam
aica
2006
No.
1814
00
12
02
54
40
20
10
01
0a
Rate
0.7
1.2
0.0
0.0
0.7
1.4
0.0
1.9
1.3
1.3
0.3
0.0
1.9
0.0
0.7
0.0
0.0
0.3
0.0
Japa
n20
11No
.89
9948
128
2319
3043
7333
542
8041
871
86
1216
2916
639
49
Rate
3.2
4.1
1.5
1.1
0.7
1.0
1.4
2.1
1.9
14.4
2.4
0.2
0.4
0.2
0.4
0.5
0.9
1.0
11.5
Kaza
khst
an20
12No
.87
273
52
4441
3062
8329
018
213
70
238
1212
838
35b
Rate
5.1
8.9
1.0
6.2
6.0
5.3
9.2
10.3
11.7
9.3
1.6
0.0
3.4
1.2
2.2
1.9
1.0
1.5
1.4
Kirib
ati
2001
No.
00
00
00
00
00
00
00
00
00
0a
Rate
––
––
––
––
––
––
––
––
––
–
Kuw
ait
2011
No.
1814
02
01
00
74
40
21
00
10
0
Rate
0.6
0.9
0.0
1.6
0.0
0.9
0.0
0.0
0.6
1.0
0.3
0.0
1.7
0.8
0.0
0.0
0.7
0.0
0.0
Kyrg
yzst
an20
10No
.35
826
53
4514
815
2496
6093
231
66
84
1719
Rate
6.7
10.3
4.2
18.7
5.4
3.0
5.0
8.0
12.7
12.1
3.3
3.0
13.4
2.4
2.3
2.8
1.3
2.2
3.2
Latv
ia20
12No
.14
811
60
11
06
238
6832
01
10
10
722
Rate
6.0
10.4
0.0
2.2
1.9
0.0
10.7
2.7
13.3
18.3
2.3
0.0
2.3
2.0
0.0
1.9
0.0
2.5
3.9
Lith
uani
a20
12No
.29
122
20
32
48
965
131
690
12
02
110
53
Rate
8.1
13.8
0.0
4.6
2.7
5.2
8.1
7.5
14.9
25.9
3.1
0.0
1.6
2.8
0.0
2.1
0.9
2.2
7.0
Luxe
mbo
urg
2012
No.
21
00
00
00
01
10
00
00
00
1
Rate
0.3
0.3
0.0
0.0
0.0
0.0
0.0
0.0
0.0
1.0
0.3
0.0
0.0
0.0
0.0
0.0
0.0
0.0
0.9
Mal
dive
s20
11No
.14
90
10
11
02
45
00
01
30
10
Rate
4.5
6.1
0.0
7.3
0.0
5.9
5.3
0.0
4.2
13.2
2.6
0.0
0.0
0.0
6.2
17.0
0.0
2.0
0.0
Mal
ta20
11No
.9
70
00
00
12
42
00
00
00
02
Rate
1.6
2.7
0.0
0.0
0.0
0.0
0.0
6.7
3.4
4.4
0.6
0.0
0.0
0.0
0.0
0.0
0.0
0.0
2.0
Mar
tiniq
ue20
11No
.17
150
00
00
16
82
00
00
00
11
Rate
4.0
8.2
0.0
0.0
0.0
0.0
0.0
7.7
14.6
10.3
0.6
0.0
0.0
0.0
0.0
0.0
0.0
1.8
1.0
GLOBAL REPORT ON DROWNING 55

56 EXECUTIVE SUMMARY
DEA
THS F
RO
M D
RO
WN
ING
AS R
EPO
RTE
D T
O W
HO
BY C
OUN
TRIE
S/A
REA
S C
ON
TIN
UED
Not
esa
Dat
a fr
om v
ital
reg
istr
atio
n sy
stem
with
cove
rage
est
imat
ed
at
70–8
4%
. C
ount
ries
witho
ut t
he ‘
a’ n
otat
ion
have
vital
regi
stra
tion
sys
tem
s w
ith
cove
rage
est
imat
ed a
t 85%
or
high
er.
b
Dat
a on
ly a
vaila
ble
for
code
s W
65–W
74
No.
N
umbe
r of
dea
ths
Rat
e N
umbe
r of
dea
ths
per
100 0
00 p
opul
atio
n —
Not
ava
ilabl
e/ap
plic
able
56 APPENDIX 2
COUN
TRY/
AREA
YEAR
MEA
SURE
BOTH
SEX
ES
COM
BINE
DM
ALES
FE
MAL
ES
NOTE
SAL
L<
11–
45–
910
–14
15–1
9 20
–24
25–4
445
+AL
L<
11–
45–
910
–14
15–1
9 20
–24
25–4
445
+
Mau
ritiu
s20
12No
.42
390
00
13
514
163
00
00
00
12
Rate
3.1
5.9
0.0
0.0
0.0
2.1
5.9
9.7
7.3
8.2
0.4
0.0
0.0
0.0
0.0
0.0
0.0
0.5
0.9
May
otte
2011
No.
00
00
00
00
00
00
00
00
00
0
Rate
0.0
0.0
0.0
0.0
0.0
0.0
0.0
0.0
0.0
0.0
0.0
0.0
0.0
0.0
0.0
0.0
0.0
0.0
0.0
Mex
ico
2012
No.
2479
2107
2218
278
110
289
277
633
517
372
1610
629
3142
2268
57
Rate
2.1
3.7
1.9
3.9
1.3
1.8
4.9
5.3
3.7
4.2
0.6
1.5
2.4
0.5
0.5
0.7
0.4
0.4
0.4
Mon
tene
gro
2009
No.
74
00
10
00
12
30
00
00
01
2
Rate
1.1
1.3
0.0
0.0
5.1
0.0
0.0
0.0
1.2
1.8
0.8
0.0
0.0
0.0
0.0
0.0
0.0
1.2
1.6
Mon
tser
rat
2011
No.
11
00
10
00
00
00
00
00
00
0
Rate
––
––
––
––
––
––
––
––
––
–
Neth
erla
nds
2012
No.
215
140
06
22
25
2010
375
02
00
31
663
Rate
1.0
1.3
0.0
1.6
0.4
0.4
0.4
1.0
0.9
2.9
0.6
0.0
0.6
0.0
0.0
0.6
0.2
0.3
1.6
Neth
erla
nds
Antil
les
2000
No.
21
00
00
10
00
10
00
00
00
1
Rate
––
––
––
––
––
––
––
––
––
–
New
Zea
land
2010
No.
7555
03
02
106
1123
201
10
13
03
11
Rate
1.6
2.4
0.0
2.4
0.0
1.3
6.0
3.7
1.9
2.9
0.8
3.2
0.8
0.0
0.7
1.9
0.0
0.5
1.3
Norw
ay20
12No
.89
620
00
14
113
4327
01
00
20
519
Rate
1.4
2.0
0.0
0.0
0.0
0.6
2.4
0.6
1.9
4.3
0.9
0.0
0.8
0.0
0.0
1.3
0.0
0.8
1.8
Oman
2010
No.
4132
08
21
65
91
90
30
22
00
2a
Rate
1.4
1.8
0.0
6.9
1.9
0.9
4.0
2.1
1.3
0.6
0.8
0.0
2.7
0.0
1.7
1.5
0.0
0.0
1.4
Pana
ma
2011
No.
143
117
010
66
1611
3434
261
45
61
14
4
Rate
3.8
6.3
0.0
6.6
3.2
3.3
9.5
6.9
6.0
7.6
1.4
2.8
2.8
2.8
3.5
0.6
0.6
0.7
0.9
Para
guay
2011
No.
148
132
011
316
2116
3826
160
51
32
13
1a
Rate
2.2
4.0
0.0
3.7
0.8
4.5
6.1
5.0
4.3
4.1
0.4
0.0
1.7
0.3
0.9
0.6
0.3
0.3
0.2
Philip
pine
s20
08No
.38
3027
8820
303
280
227
241
239
813
665
1042
1120
016
113
984
4315
724
7
Rate
4.6
6.9
1.8
6.5
4.9
4.3
5.0
5.5
6.7
9.0
2.4
1.0
4.5
3.0
2.8
1.8
1.0
1.3
3.0
Pola
nd20
12No
.10
5988
00
84
1855
7326
745
517
92
20
35
332
132
Rate
2.4
4.2
0.0
1.0
0.4
1.9
4.7
5.2
4.5
6.4
0.7
1.0
0.3
0.0
0.3
0.4
0.2
0.6
1.5

GLOBAL REPORT ON DROWNING 57
DEA
THS F
RO
M D
RO
WN
ING
AS R
EPO
RTE
D T
O W
HO
BY C
OUN
TRIE
S/A
REA
S C
ON
TIN
UED
Not
esa
Dat
a fr
om v
ital
reg
istr
atio
n sy
stem
with
cove
rage
est
imat
ed
at
70–8
4%
. C
ount
ries
witho
ut t
he ‘
a’ n
otat
ion
have
vital
regi
stra
tion
sys
tem
s w
ith
cove
rage
est
imat
ed a
t 85%
or
high
er.
b
Dat
a on
ly a
vaila
ble
for
code
s W
65–W
74
No.
N
umbe
r of
dea
ths
Rat
e N
umbe
r of
dea
ths
per
100 0
00 p
opul
atio
n —
Not
ava
ilabl
e/ap
plic
able
GLOBAL REPORT ON DROWNING 57
COUN
TRY/
AREA
YEAR
MEA
SURE
BOTH
SEX
ES
COM
BINE
DM
ALES
FE
MAL
ES
NOTE
SAL
L<
11–
45–
910
–14
15–1
9 20
–24
25–4
445
+AL
L<
11–
45–
910
–14
15–1
9 20
–24
25–4
445
+
Port
ugal
2012
No.
140
940
50
24
119
6346
01
12
01
239
Rate
1.0
1.5
0.0
2.4
0.0
0.7
1.5
0.3
1.2
2.9
0.5
0.0
0.5
0.4
0.8
0.0
0.4
0.1
1.5
Puer
to R
ico
2010
No.
2926
01
10
16
611
30
00
00
11
1
Rate
0.8
1.4
0.0
1.0
0.8
0.0
0.7
4.2
1.2
1.8
0.2
0.0
0.0
0.0
0.0
0.0
0.7
0.2
0.1
Qata
r20
11No
.22
200
31
10
48
32
01
00
01
00
aRa
te1.
21.
70.
07.
82.
22.
60.
02.
50.
91.
40.
40.
02.
80.
00.
00.
02.
40.
00.
0
Repu
blic
of
Kor
ea20
12No
.15
1811
422
516
2341
6233
765
637
61
38
21
878
275
Rate
2.6
4.1
0.8
0.5
1.4
1.5
2.3
3.6
4.3
7.2
1.2
0.4
0.3
0.7
0.1
0.1
0.5
1.0
2.7
Repu
blic
of
Mol
dova
2012
No.
235
196
03
714
1616
5090
390
33
01
27
23
Rate
6.4
11.1
0.0
3.7
7.3
14.0
12.2
9.4
9.0
16.1
2.0
0.0
4.0
3.3
0.0
0.8
1.2
1.3
3.2
Reun
ion
2011
No.
1914
00
01
10
57
50
20
00
00
3
Rate
2.2
3.4
0.0
0.0
0.0
2.8
2.8
0.0
4.3
5.8
1.1
0.0
6.9
0.0
0.0
0.0
0.0
0.0
2.2
Rodr
igue
s20
12No
.2
20
00
00
01
10
00
00
00
00
Rate
––
––
––
––
––
––
––
––
––
–
Rom
ania
2012
No.
688
557
112
1131
3840
139
285
131
16
610
47
1780
Rate
3.1
5.1
1.0
2.7
2.0
5.6
6.6
5.1
3.9
7.5
1.1
1.1
1.5
1.2
1.9
0.7
0.9
0.5
1.7
Russ
ian
Fe
dera
tion
2010
No.
1198
110
156
1113
621
919
240
482
741
2642
4118
257
7668
9280
103
605
793
b
Rate
7.8
13.9
1.3
4.1
6.1
5.8
9.0
13.1
19.9
17.8
2.4
0.9
2.4
2.0
2.9
1.9
1.7
2.8
2.3
Sain
t Kitt
s
and
Nevi
s20
11No
.3
20
01
00
01
01
00
00
01
00
Rate
––
––
––
––
––
––
––
––
––
–
Sain
t Luc
ia20
12No
.11
90
01
10
01
62
10
00
00
10
Rate
––
––
––
––
––
––
––
––
––
–
Sain
t Pie
rre
an
d M
ique
lon
2010
No.
00
00
00
00
00
00
00
00
00
0
Rate
––
––
––
––
––
––
––
––
––
–
Sain
t Vin
cent
an
d Gr
enad
ines
2012
No.
44
00
00
01
03
00
00
00
00
0
Rate
––
––
––
––
––
––
––
––
––
–
Serb
ia20
12No
.13
789
02
39
38
2142
480
12
22
14
35
Rate
1.3
1.8
0.0
1.0
1.1
3.2
1.0
2.4
1.5
2.3
0.8
0.0
0.5
0.8
0.8
0.7
0.3
0.3
1.7

58 EXECUTIVE SUMMARY
DEA
THS F
RO
M D
RO
WN
ING
AS R
EPO
RTE
D T
O W
HO
BY C
OUN
TRIE
S/A
REA
S C
ON
TIN
UED
Not
esa
Dat
a fr
om v
ital
reg
istr
atio
n sy
stem
with
cove
rage
est
imat
ed
at
70–8
4%
. C
ount
ries
witho
ut t
he ‘
a’ n
otat
ion
have
vital
regi
stra
tion
sys
tem
s w
ith
cove
rage
est
imat
ed a
t 85%
or
high
er.
b
Dat
a on
ly a
vaila
ble
for
code
s W
65–W
74
No.
N
umbe
r of
dea
ths
Rat
e N
umbe
r of
dea
ths
per
100 0
00 p
opul
atio
n —
Not
ava
ilabl
e/ap
plic
able
58 APPENDIX 2
COUN
TRY/
AREA
YEAR
MEA
SURE
BOTH
SEX
ES
COM
BINE
DM
ALES
FE
MAL
ES
NOTE
SAL
L<
11–
45–
910
–14
15–1
9 20
–24
25–4
445
+AL
L<
11–
45–
910
–14
15–1
9 20
–24
25–4
445
+
Seyc
helle
s20
12No
.6
50
01
01
01
21
00
00
10
00
bRa
te–
––
––
––
––
––
––
––
––
––
Sing
apor
e20
11No
.33
250
21
11
14
158
01
00
00
16
aRa
te0.
81.
30.
02.
50.
90.
80.
80.
80.
72.
10.
40.
01.
30.
00.
00.
00.
00.
20.
8
Slov
akia
2010
No.
175
144
13
23
97
4178
310
41
00
03
23
Rate
2.9
4.9
3.2
2.6
1.5
2.1
4.8
3.3
4.7
8.2
1.0
0.0
3.7
0.8
0.0
0.0
0.0
0.4
2.0
Slov
enia
2010
No.
5032
00
10
02
623
180
00
00
01
17
Rate
1.7
2.5
0.0
0.0
2.1
0.0
0.0
3.0
1.9
5.4
0.9
0.0
0.0
0.0
0.0
0.0
0.0
0.3
3.5
Sout
h Af
rica
2010
No.
1434
1115
1016
014
412
611
310
527
818
031
99
9238
4620
1646
51
Rate
2.7
4.3
1.7
7.2
5.7
5.3
4.5
4.0
3.7
3.9
1.2
1.6
4.2
1.5
2.0
0.8
0.6
0.6
0.8
Spai
n20
12No
.57
944
73
96
110
1410
929
513
22
52
01
124
97
Rate
0.9
1.5
1.2
0.9
0.5
0.1
0.9
1.1
1.4
3.1
0.4
0.8
0.5
0.2
0.0
0.1
0.1
0.3
0.9
Sri L
anka
2006
No.
932
716
426
1933
8873
214
259
216
313
138
912
5810
0a
Rate
4.7
7.2
2.1
3.6
2.2
3.9
10.2
8.0
7.1
10.0
2.2
1.6
1.9
1.6
1.0
1.1
1.3
1.9
3.5
Surin
ame
2009
No.
3326
02
02
43
96
70
21
20
02
0
Rate
6.2
10.0
0.0
9.9
0.0
7.9
18.0
12.8
11.4
10.1
2.5
0.0
10.4
3.9
8.1
0.0
0.0
2.7
0.0
Swed
en20
12No
.17
512
60
12
10
725
9049
00
10
00
1038
Rate
1.4
2.0
0.0
0.4
0.7
0.4
0.0
2.1
2.0
4.4
0.8
0.0
0.0
0.4
0.0
0.0
0.0
0.8
1.7
Switz
erla
nd20
10No
.10
269
03
00
52
1445
330
00
01
04
28
Rate
1.0
1.4
0.0
1.9
0.0
0.0
2.1
0.8
1.2
2.7
0.5
0.0
0.0
0.0
0.0
0.4
0.0
0.4
1.5
Thai
land
2006
No.
4684
3578
535
844
717
517
016
411
1311
4611
067
151
194
145
4528
161
374
aRa
te7.
311
.21.
219
.618
.06.
76.
46.
210
.612
.53.
61.
78.
78.
25.
81.
81.
11.
53.
6
The
form
er Y
u-go
slav
Rep
ublic
of
Mac
edon
ia20
10No
.37
240
01
15
02
1513
01
00
00
111
Rate
1.5
2.1
0.0
0.0
1.6
1.5
6.2
0.0
0.6
4.0
0.9
0.0
2.2
0.0
0.0
0.0
0.0
0.3
2.7
Trin
idad
an
d To
bago
2008
No.
5444
12
20
65
1810
100
30
10
21
3
Rate
4.1
6.5
9.8
5.2
4.5
0.0
10.8
7.6
9.0
5.3
1.6
0.0
8.1
0.0
2.2
0.0
3.1
0.5
1.4

GLOBAL REPORT ON DROWNING 59
DEA
THS F
RO
M D
RO
WN
ING
AS R
EPO
RTE
D T
O W
HO
BY C
OUN
TRIE
S/A
REA
S C
ON
TIN
UED
Not
esa
Dat
a fr
om v
ital
reg
istr
atio
n sy
stem
with
cove
rage
est
imat
ed
at
70–8
4%
. C
ount
ries
witho
ut t
he ‘
a’ n
otat
ion
have
vital
regi
stra
tion
sys
tem
s w
ith
cove
rage
est
imat
ed a
t 85%
or
high
er.
b
Dat
a on
ly a
vaila
ble
for
code
s W
65–W
74
No.
N
umbe
r of
dea
ths
Rat
e N
umbe
r of
dea
ths
per
100 0
00 p
opul
atio
n —
Not
ava
ilabl
e/ap
plic
able
GLOBAL REPORT ON DROWNING 59
COUN
TRY/
AREA
YEAR
MEA
SURE
BOTH
SEX
ES
COM
BINE
DM
ALES
FE
MAL
ES
NOTE
SAL
L<
11–
45–
910
–14
15–1
9 20
–24
25–4
445
+AL
L<
11–
45–
910
–14
15–1
9 20
–24
25–4
445
+
Turk
ey20
11No
.18
715
51
1616
2233
1630
2132
111
32
21
48
aRa
te0.
30.
40.
20.
60.
50.
71.
00.
50.
30.
20.
10.
20.
50.
10.
10.
10.
00.
00.
1
Turk
s an
d Ca
icos
Isla
nds
2009
No.
182
00
00
10
01
160
00
00
00
16
Rate
––
––
––
––
––
––
––
––
––
–
Ukra
ine
2012
No.
2713
2303
238
5030
8615
982
411
1341
02
1813
2623
1193
224
bRa
te5.
59.
80.
83.
74.
63.
06.
89.
412
.114
.21.
60.
81.
91.
32.
71.
90.
71.
41.
9
Unite
d Ki
ngdo
m20
10No
.57
843
73
84
625
3411
224
514
10
40
31
732
94
Rate
0.8
1.2
0.7
0.5
0.2
0.3
1.2
1.5
1.3
2.0
0.4
0.0
0.3
0.0
0.2
0.1
0.3
0.4
0.7
Unite
d St
ates
of
Am
eric
a20
10No
.48
1236
8734
311
106
9729
736
697
914
9511
2525
159
3727
3361
233
550
Rate
1.5
2.4
1.6
3.7
1.0
0.9
2.6
3.3
2.3
2.6
0.7
1.3
2.0
0.4
0.3
0.3
0.6
0.6
0.8
Urug
uay
2010
No.
137
101
02
24
189
2144
360
22
24
06
20
Rate
3.9
6.0
0.0
2.0
1.6
3.0
13.4
7.2
4.7
8.4
1.9
0.0
2.1
1.6
1.6
3.1
0.0
1.3
3.0
Uzbe
kist
an20
05No
.10
5371
00
214
7456
3935
188
104
343
418
235
3714
1337
21a
Rate
4.0
5.6
0.0
20.4
5.1
3.4
2.5
2.7
5.1
5.0
2.5
1.6
18.4
2.5
2.3
0.9
1.0
1.0
0.9
Vene
zuel
a
(Bol
ivar
ian
Repu
blic
of)
2009
No.
645
539
1168
3227
9481
154
7210
67
4017
1210
49
7
Rate
2.1
3.6
3.6
5.7
2.2
1.9
6.8
6.0
3.7
2.3
0.7
2.4
3.5
1.2
0.9
0.7
0.3
0.2
0.2
Virg
in Is
land
s (U
SA)
2010
No.
42
00
00
10
01
20
00
00
00
2
Rate
––
––
––
––
––
––
––
––
––
–

60 EXECUTIVE SUMMARY
Made possible by funding from
Bloomberg Philanthropies
Photography creditsCover: Getty Images/iStock/D. Freund PhotographyPage ii: WHO/A. KariPage vi: Getty Images/iStock/GremlinPage viii: Getty Images/iStock/B. HadyniakPage x: Getty Images/iStock/SkynavinPage 2: Getty Images/iStock/Peeterv Page 4: Getty Images/iStock/G. Delmotte PhotographyPage 8: WHO/SEARO/R. KumarPage 11: Getty Images/iStock/MathessPage 13: Getty Images/StockbytePage 14: Getty Images/iStock/PeskyMonkeyPage 16: Getty Images/iStock/EnviromanticPage 17: Jonathan Guevarra Page 20: Getty Images/iStock/M&H SheppardPage 21: Getty Images/iStock/EPSTOCKPage 23: WHO/WPROPage 24, top: Getty Images/iStock/LokibahoPage 24, bottom: Aminur RahmanPage 27: Getty Images/iStock/Motionteam Photo PressPage 29: Getty Images/iStock/D. Freund Photography Page 31: Getty Images/iStock/MeinzahnPage 32: Getty Images/iStock/TurhanyalcinPage 34: Getty Images/iStock/RuchosPage 35: Getty Images/iStock/B. HadyniakPage 37: Getty Images/iStock/Hottest Tea Page 38: Getty Images/Moment Open/Shibu BhattacharjeePage 40: Getty Images/iStock/Tina BaxterInside Cover: Getty Images/Moment Open/Yasir Arafat
Design and graphicsAHOY Studios, ahoystudios.com


ISBN 978 92 4 156478 6
WORLD HEALTH ORGANIZATIONDEPARTMENT FOR MANAGEMENT OF NCDS, DISABILITY, VIOLENCE AND INJURY PREVENTION (NVI)
20 AVENUE APPIA | 1211 GENEVA 27 | SWITZERLAND | PHONE +41 22 791 2881WWW.WHO.INT/VIOLENCE_INJURY_PREVENTION