global trends shaping tomorrow’s omnichannel … trends shaping tomorrow’s omnichannel supply...
TRANSCRIPT
Global Trends Shaping Tomorrow’s Omnichannel Supply Chain
2
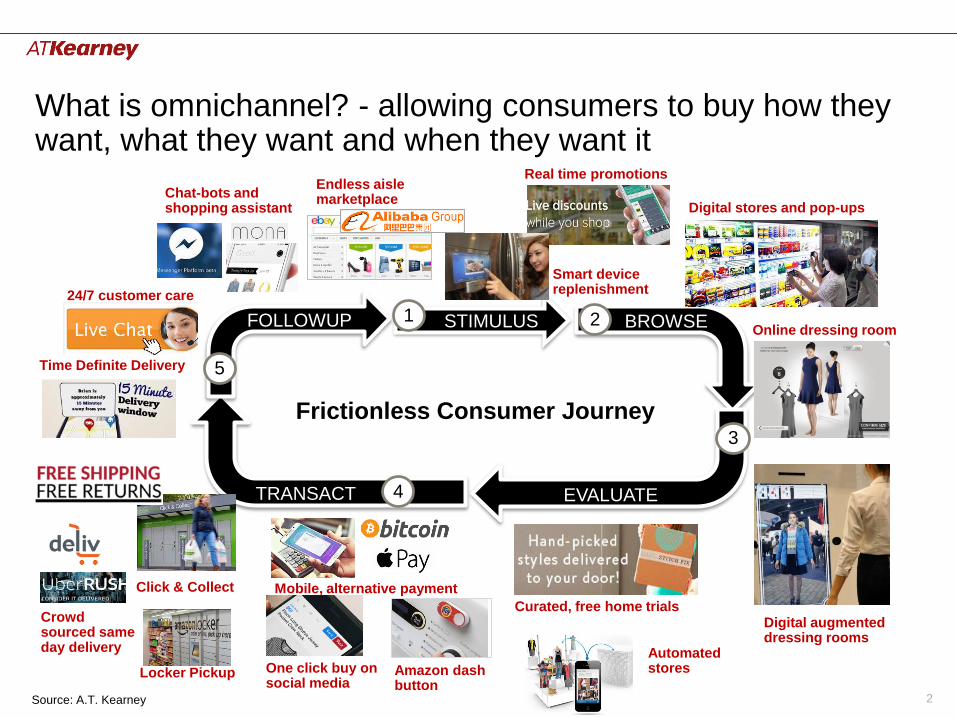
What is omnichannel? - allowing consumers to buy how they want, what they want and when they want it
Source: A.T. Kearney
TRANSACT
FOLLOWUP BROWSESTIMULUS
EVALUATE
Frictionless Consumer Journey
4
5
21
3
Digital stores and pop-ups
Curated, free home trials
One click buy on social media
Amazon dash button
Click & Collect
Locker Pickup
Time Definite Delivery
Real time promotions
Digital augmented dressing rooms
Mobile, alternative payment
Online dressing room
24/7 customer care
Endless aisle marketplace
Automated stores
Crowd sourced same day delivery
Chat-bots and shopping assistant
Smart device replenishment
3
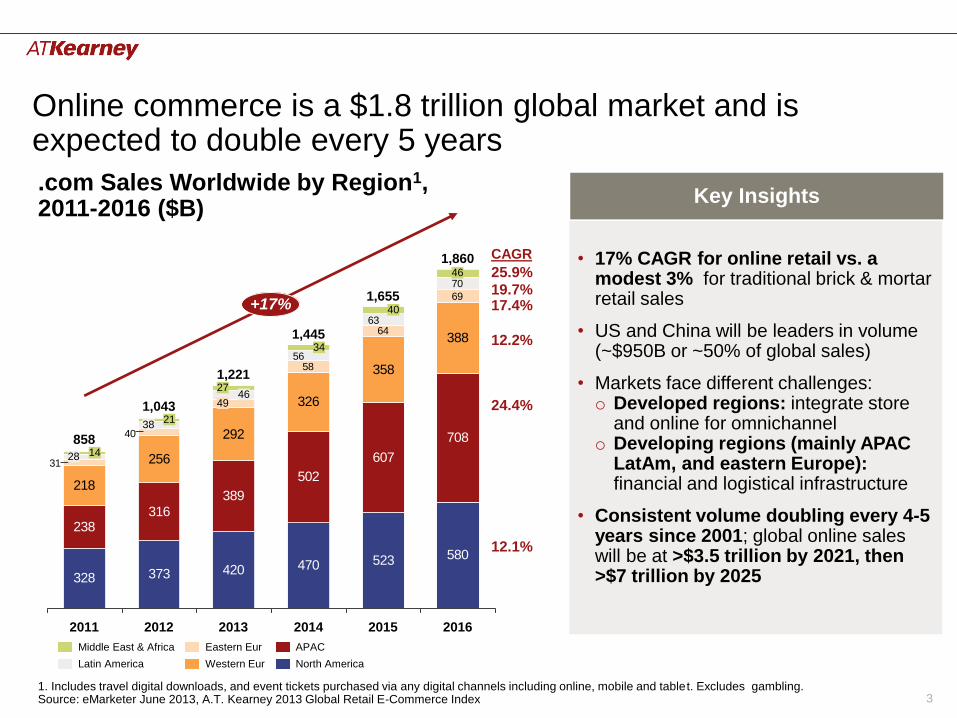
Online commerce is a $1.8 trillion global market and is expected to double every 5 years
.com Sales Worldwide by Region1, 2011-2016 ($B)
1. Includes travel digital downloads, and event tickets purchased via any digital channels including online, mobile and tablet. Excludes gambling.Source: eMarketer June 2013, A.T. Kearney 2013 Global Retail E-Commerce Index
328 373 420 470 523 580
238316
389
502
607
708
218
256
292
326
358
388
58
64
69
70
40
31
63
56
3821
2011
40
2014
34
2013
1,221
+17%
2016
1,860
14
1,445
46
2015
1,655
4946
27
2012
1,043
858
28
Western Eur
Eastern Eur
Latin America
Middle East & Africa APAC
North America
25.9%
19.7%17.4%
12.2%
12.1%
CAGR
24.4%
Key Insights
• 17% CAGR for online retail vs. a modest 3% for traditional brick & mortar retail sales
• US and China will be leaders in volume (~$950B or ~50% of global sales)
• Markets face different challenges:o Developed regions: integrate store
and online for omnichannelo Developing regions (mainly APAC
LatAm, and eastern Europe):financial and logistical infrastructure
• Consistent volume doubling every 4-5 years since 2001; global online sales will be at >$3.5 trillion by 2021, then >$7 trillion by 2025

4
Consumer expectations rapidly changing
Key purchasing criteria
Relative importance
Comments
Assortment • Assortment and being able to find right
product is a key purchasing criteria in all categories
Convenience • The convenience and time saving aspect of
online shopping is gaining importance in the mindset of online shoppers
Price • Price (total cost to buy) ranks high across all
shopper segments
Financing/
payment
• Options for financing and payments are of high importance and new methods are launched, complexity of card payments increasing, validation with secure id is necessary
Easiness to
navigate
• Easiness to navigate and compare products and prices is of high importance
Security • Security and safe payment options perceived
as hygienic factor for most consumers, i.e. no longer key differentiator for most consumers
Source: Nets E- handelsundersökelsen, CDON roadshow report, A.T. Kearney
Online shopper behavior shifts
Critical for consumers across all markets
More relevant for driving adoption in developing markets

5
Supply chain and fulfillment is critical for omnichannel success
More Direct Impact on Consumer Experience
Missed cross-dock scheduling or delay in LTL replenishment = increased likelihood of shelf Out of Stock
Delayed online order fulfillment from warehouse fulfillment = 100% unhappy customer
Brick & Mortar
Omni-channel
More Impact on Profit
Source: A.T. Kearney; GfK FutureBuy
Higher Consumer Expectations

6
Flexible Fulfillment Networks
Global trends shaping supply chain as firms pursue breakthrough omnichannel
Rise of Marketplace
Strategic Bet in Same Day Delivery
Ambidextrous Role of Stores
Blurring of Manufacturer and Retailer Value Chain
Source: A.T. Kearney
Service‒ Assortment
‒ Service
‒ Convenience
Efficiency
Best
Today
Competitive Frontier Tomorrow
1
2
3
4
5

7
SellDistributeDesign
• Define offering specifications from demand
• Design / enhance products
• Produce new products
• Bundle products into end consumer batches
• Distribute to points of purchase and/or consumption
• Display products for consumer discovery and trials
• Offer vehicle for consumers to make purchases
• Ensure order fulfillment
The traditional value chain is increasingly blurring under omnichannel
Blurring of Capabilities and Roles in Omni-channel Setting
Source Make Deliver
Retailers
Manufacturers
1
Source: A.T. Kearney

8
Manufacturers across sectors are pursuing forward value chain integration
Depth of Offering
Omni-Channel Value Chain Integration Curve
Level 1 Level 2 Level 3 Level 4 Level 5
Research
Shop
Service / Omni
• Online/mobile product search
• Side by side feature comparisons
• Online memberships
• High resolution specs/photos (3D)
• Product narration
• User feedbacks and reviews
• Smart recommend
• User communities
• Buy online for
direct delivery
• 1-click and/or
mobile-
payment
• Store pick-up
• Global shipping
• Store fulfill with
last mile deliveryBuy / Fulfill
• Subscriptions
• Segmented assortment by channel
• Product sampling for VIP customers
• Online customization
• Retail location recommend
• Customized order management
• No hassle
returns
• One click live
customer service
• Omni-channel
integration
1
Source: A.T. Kearney
9
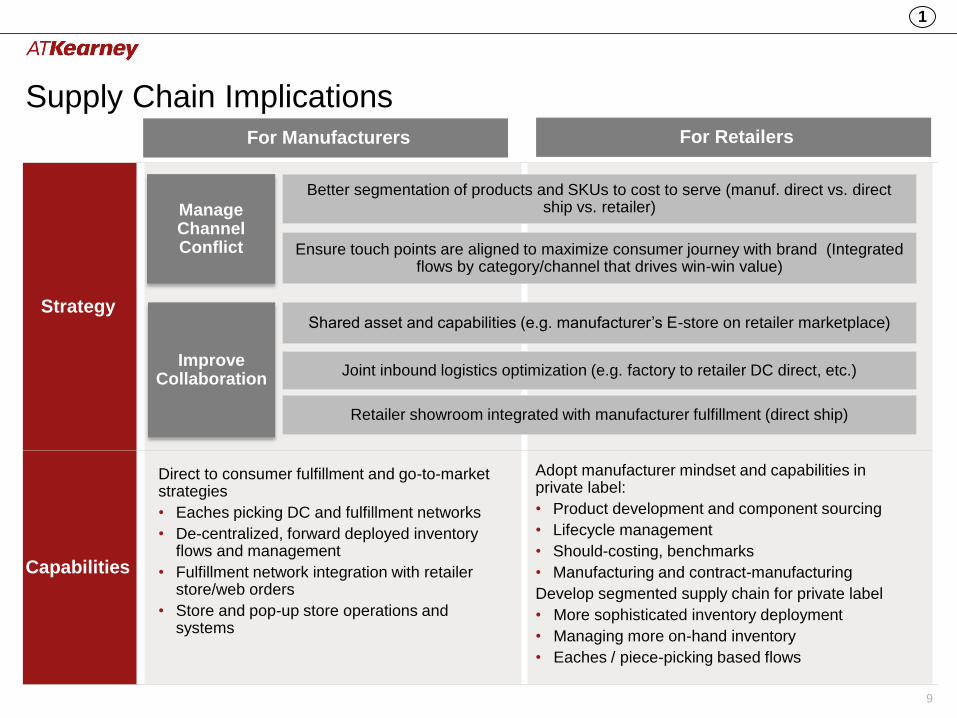
Supply Chain Implications
Strategy
Capabilities
For Manufacturers For Retailers
Manage Channel Conflict
Improve Collaboration
Better segmentation of products and SKUs to cost to serve (manuf. direct vs. direct ship vs. retailer)
Ensure touch points are aligned to maximize consumer journey with brand (Integrated flows by category/channel that drives win-win value)
Shared asset and capabilities (e.g. manufacturer’s E-store on retailer marketplace)
Joint inbound logistics optimization (e.g. factory to retailer DC direct, etc.)
Retailer showroom integrated with manufacturer fulfillment (direct ship)
Adopt manufacturer mindset and capabilities in private label:
• Product development and component sourcing
• Lifecycle management
• Should-costing, benchmarks
• Manufacturing and contract-manufacturing
Develop segmented supply chain for private label
• More sophisticated inventory deployment
• Managing more on-hand inventory
• Eaches / piece-picking based flows
Direct to consumer fulfillment and go-to-market strategies
• Eaches picking DC and fulfillment networks
• De-centralized, forward deployed inventory flows and management
• Fulfillment network integration with retailer store/web orders
• Store and pop-up store operations and systems
1

10
Birth of the Market Place
The concept of Market Places have been around since the “Classified Ads” in the Sunday paper
Digital Market Places have existed for over 20 years
On-line retailers quickly discovered the power of the Market Place led by Amazon and eBay
2

11
Marketplaces: A key growth platform / channel for E-commerce
Source: A.T. Kearney
2
The Top 3
• Marketplace growth as outpaced traditional e-Commerce growth
• Lower cost, lower risk way to sell to new market
• Endless aisle, long tail marketing
Alibaba• $11B USD in Single Day’s sales (Chinese equiv. of
Cyber Monday) in 2015 • On pace to surpass Walmart in gross merchant
value by 2017Amazon• Marketplace sales growing at twice the pace of
overall e-Commerce

12
Supply Chain Implications
Strategy
• Marketplaces are key consideration in almost every e-commerce company
• Can be a significant compliment to standard e-commerce sales; used by many U.S. and European retailers to expand in emerging markets
• With lower lead-time expectations vis-à-vis new product assortment and pricing in Asia, marketplaces are a low risk alternative – rapidly becoming primary e-Commerce channel in China
• Great opportunity to introduce niche products and go after niche consumers
• Emerging market locations find marketplaces to be a low risk opportunity
Capabilities
• Channel risk management (quality, imitations, lead times are risk-points for consumers)
• Integrated cost and flow modeling logic (decide between: holding inventory, cross-docking orders, and direct flow)
• Technology integration with vendor OMS
• Technology and supply chain organizational DNA, not just traditional retailing
2

13
Retailer DC
Manufacturer DC
Retailer Store
Converted / Dark Store
Home or Office
Lockers
Store for
Pickup
Movement of goods from the last inventory point to the point of consumer
chosen access in 24 hours
1 Day from Order to Delivery
What is the Last Mile? Same Day Delivery?
3
Source: A.T. Kearney

14
2014 2015 2016 2017 2018
US Same Day Delivery Forecast
in 20 Cities
Value of
merchandise
Same Day in 22
cities ($B)
Source: BI Intelligence; AT Kearney
Demand for Same Day still developing
• US Same Day demand still nascent - ~2% of online orders (~$0.6-$0.9B market)
• Significant CAGR (over 150%) in urban areas
• Retailers starting to pilot but demand is uncertain
• Primarily driven by B2C .com retailers (e.g. Alibaba, JD.com)
• UK as the most penetrated Same Day market…
• …account for 8-10% of retail parcel deliveries in 2014 (~280MM BP)
0.280.24
0.200.17
2011 2012 2013 2014
UK Same Day – Carrier
Delivery Market (Billions –
BP)
Source: Mintel; AT Kearney
Same Day Penetration MoreLess
3

15
Several Same Day supply chain models emerging
Retailer
Managed
3PL Managed
(Owned)
3PL Managed
(Crowdsource)
Marketplace
(Crowdsource)
Marketplace
(Managed)
Each type has its own structural pros and cons in terms of…
Cost Adoption Scale Flexibility Control Innovation
Source: A.T. Kearney
3
Partial list
… … … … …

16
Many retailers (and manufacturers) are making strategic bets in Same Day
US
• Offered across 11 metro areas (~25% of population area)
• $5.99 (Prime); $10+ $.99/add’l item(non-Prime)
• 500K-1M SKUs
UK
• Same day click & collect
• Order before 11AM/ready by 4pm; order by 7:45pm/ready next 8-10AM
• Free (Prime); $BP 4.99 (non Prime)
• LeveragingConnectGroup news distributor partner (500+ stores / pick-up locations today)
US
• Offered across major US cities
• $5-6 (basket >$99); $15 (basket<$99)
• Order by noon-1pm (mon-sat)
China
• Same day delivery across 40+ cities
• Piloting 3 hour delivery in 6 major cities
• Owned network of 7 DCs, 97 warehouse and 715+ pick-up stations
• In-house real-time tracking and routing technology platform
Retailer Managed 3PL - Crowdsourced
Marketplace - Crowdsourced
US
• 6 US metro areas
• $95 annual subscription or $5/order (consumer) + commission from retailer
• Strategic value sharing / conflict beyond fulfillment (consumer intel)
Source: Financial Times; Guardian; Mintel; Amazon; RILA; AT Kearney
3

17
Supply Chain Implications
3
Strategy
Capabilities
• Define clear, fact based approach to activating Last Mile
‒ Establish understanding into “should-cost” / “should-impact” drivers (e.g. cost drivers for crowdsource model, trigger point managing Uber like courier risks, etc.)
‒ Define clear inflection points between investing internal Same Day vs. 3PL managed vs. crowdsourced models (e.g. value of absolute performance vs. differentiation? First mover or Fast follow?)
• In-market product availability – ensure upstream supply chain footprint and systems can
support inventory replenishment processes and one-pool inventory visibility
• Ensure Same Day requirements linked to omnichannel consumer promise and broader supply chain strategy at the category level
• Determine which categories are candidates for same day delivery: (grocery, mobile devices, specialty products, high margin products)
• Pilot and experiment with different Same Day models, do not dismiss models pre-maturely
• Determine the reason for Same Day: drive sales, competitor requirements, marketing play/ excitement
18
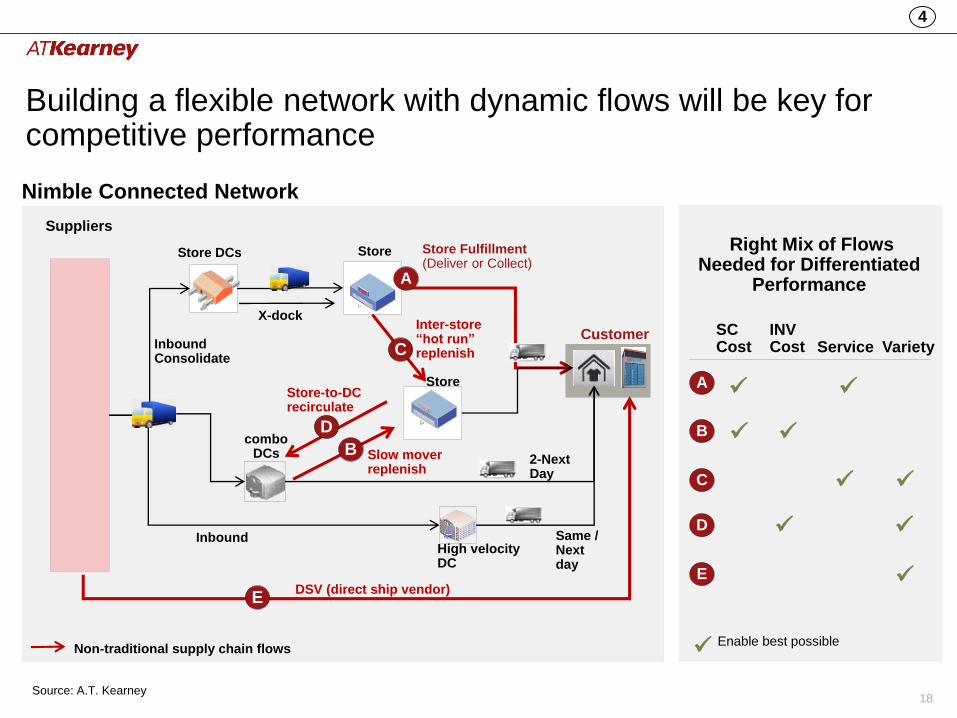
Building a flexible network with dynamic flows will be key for competitive performance
Store DCs
combo DCs
Store
Customer
Suppliers
Inter-store “hot run” replenish
High velocity DC
Slow mover replenish
Store
DSV (direct ship vendor)
Right Mix of Flows Needed for Differentiated
Performance
SC Cost Service Variety
INV Cost
A
B
C
D
E
E
B
C
X-dock
D
Store-to-DC recirculate
Nimble Connected Network
Same / Next day
2-Next Day
Store Fulfillment (Deliver or Collect)
A
Non-traditional supply chain flows Enable best possible
Inbound Consolidate
Inbound
4
Source: A.T. Kearney

19
Lead Time
Pick/Pack
Cost
.com
Volume
Assortment
(Capacity)
Store or Mini-
Hub Picking
Store
Converted
Warehouse
High Velocity
Eaches
Warehouse
Low Velocity
Eaches
Warehouse
Same/Next Day Same/Next Day Next – 2 Day 2 – 3 Days
Low
(2-5K SKUs)
Low
(5-10K SKUs)
Medium-High
(15-50K SKUs)
High
(50-200K SKUs)
Med-High
($1-2/unit)
Low-Med
($1-2/unit)
Low
($0.4-1/unit US)
Med
($0.4-1.3/unit US)
<1MM units/year <5MM units/year >5 MM units / year >5 MM units/year
Nature of “In-Scope”
Demand
Low Low Med-High CapEx
Med-High
4
Source: A.T. Kearney
Getting the right DC and picking mix requires product flow segmentation and analysis

20
3PLs and supplier direct ship as part of overall fulfillment ecosystem
VOLUME >25K orders/day 1-25K orders/day <0.5K orders/day
PEAKLow Seasonal
peak
Moderate
Seasonality Highly Seasonable
SKU TYPEFast Moving
SKUs
Fast + Medium
Moving SKUsLong Tail SKUs
EXPERIENCE
Extensive In-
House
Fulfillment
Experience
Developing In-
House ExperienceNew Category
AFFINITYHigh x-Category
Affinity
Medium x-Category
Affinity
Low x-Category
Affinity
In-House Operations 3PL Partnership Supplier Direct Ship
Optimize cost vs.
service
Minimize over-
investment
Invest with demand,
not ahead of it
Grow and
experiment long tail
assortments
Disciplined learning
IllustrativeCategory Profile
4
Source: A.T. Kearney
Effective future networks must also appropriately leverage partners for flexibility and learning

21
Supply Chain Implications
Strategy
Capabilities
LogisticsTechnology Organization
• Priority
– Geographic inventory planning
– Store to store transportation
– Distributed order management
• Future
– Inbound freight optimization
– Dynamic order sourcing
– 3rd party logistics integration
• Priority
– Centralized center for supply chain decision making
– Integrated, customer-centric performance metrics
• Future
– Omnichannel culture
– New employee capabilities
• Priority
– Real time inventory visibility “one pool”
– POS (demand signal) integration with OM, Replenishment
– Visible and accurate cost to serve
– Dynamic channel decisions (direct vs. 3PL vs. DSV)
• Future
– Common item file
– Local delivery TMS
DC Fulfillment
• Priority
– Right level of automated material handling (voice, pick to light, Goods to Man)
– WMS with flexible batch and wave picks
– Conveyance for multiple flows (reverse, x-dock, expedited)
• Future Capabilities
– Product customization and personalization
Iterative Design
Rapid Analytics
• Faster modeling and more predictive analytics
– Collaboration with Merchandising, Finance, Sales on key modeling assumption and inputs
– Embed “what-if” simulation capabilities
– Embed predictive analytics (forecasting, replenishment)
• Iterative refresh of supply chain design and strategy as part of annual planning cycle
– Compress planning cycle (next generation supply chain is next 1-2 years)
– Feedback and update from field experiments and pilots
4

22
Stores will continue to play a key role in an omnichannel future
In-store preference by age across the shopping cycle
Survey Insights
• Stores still preferred across all stages of the shopping cycle –differ by age group
• Two third of consumer who purchase online use a store right before or after transaction
• 53% of consumers used both stores and online in their shopping journey
5
Source: A.T. Kearney

23
E-commerce pureplays also see the need for stores
U.S. Store count for notable click-to-brick retailers
• Direct to consumer, e-biz launched 2010
• 500% AGR between 2010-11 alone; voted most innovative company by Fast Company in 2015
• Opened 8 stores between 2013–14
Show-room
Click & collect
• Average sales $3K / sq. ft. (higher than Tiffany -$3K, Best Buy $1.2K)
• Started as online store in 2007
• Opened 7 “guideshop” stores
Showroom and experience center
No inventory; orders placed online for Next Day delivery
• Pilot in NY stores how accretive growth for online orders
• Target 30 stores by 2016
• Piloting brick & mortar book-stores
• Free Next day lockers click & collect
Returns processing
• Manhattan mini-warehouse for Same Day, click & collect
5
Source: A.T. Kearney

24
Future stores will be ambidextrous, combining the right mix of Consumer Experience and Local Fulfillment
Consumer Experience Local Fulfillment
Product TrialAllow shoppers to touch and feel products
Treasure HuntIncubate exclusive or little known brands
exclusively
MerchantainmentProvide an exciting environment to
engage consumers in-store
Relationship ManagementEnhanced level of personalized service
Click and Collect (In-Store / Drive-Thru)
Pick, Pack and Ship (Same Day)
Inter-Network Transfers
Returns
Getting the right balance will be key for retailers
5
Source: A.T. Kearney

25
Supply Chain Implication: select the right store footprint and capacity
Pick the right stores and fulfillment solution to optimize cost and minimize in-store disruptions …
… while ensuring the necessary assortment and lead time promise
• Model Output Opens
22 stores…
• Of which 5 are in the
NextDayZone for Sally
x• Only 3 (66%) of the
Stores near Sally have
the SKU (mirroring)
Sally’s Order is
comprised completely
of SKUs that are both
“Online / Store
SKUs”
“Sally”Products A+B
x
12
3
4 • Each Store has 55%
chance of having INV…
60% X 92%=
55%
• But three stores have
a 91% chance
5
6
1-(1-55%)^3=
91%
91% chance
the unit will
be fulfilled
and
delivered
Next Day
Illustrative• Define the right
customer service level needs :
‒ Store vs. com SKU overlap
‒ # of stores needed to meet service level coverage
Rigorous store fulfillment network modeling is crucial to understand the “best achievable” cost vs. service vs. working capital trade-off
• Pick the right stores (proximity to demand vs. in-store disruption)
• Select right op-model
‒ Labor processes
‒ POS solution
Store eligibility:
• Location, proximity to .com demand
• Minimum sq. ft.
• In-store traffic/sales threshold
In-store fulfillment model:
• Pick from shelf vs. back-room converted DC
• Cart vs. automation
• Store WMS capabilities
• In store-labor inventory handling, pick/pack approach
5
Source: A.T. Kearney

26
Supply Chain Implication: Ensure seamless inventory and order management
Product A Product B Product C
SKU Type Store+Online SKU Store+Online SKU Store-Only SKU
Inventory “Watermark” 10 Units 10 Units
NAQuantity-On-Hand 15 Units 5 Units
QOH >= Watermark? Yes No
Required
“Watermark
Inventory”
Quantity on
Hand
• Ensuring appropriate on-hand (Watermark) reserved for in-store customers only• Defining the optimal
INV level to meet both in-store and .com demand needs
Store Alpha
Store Beta
• Clear segmentation of in-store only vs. store/.com SKUs based on local demand
Getting the above right will be key for delivering the right service at the right cost
Illustration – Defining the right store level inventory to fulfill in-store and .com orders
• Ensure real time visibility to drop order to right store (e.g Store Beta does not have sufficient on-hand, drop to Store Alpha instead)
• Key system enablers: real-time common inventory pool; cross-channel forecasting & allocation
5
Source: A.T. Kearney

27
Supply Chain Implication: define the right KPIs and incentives that maximize total omnichannel sales and profit
x
Metrics Impact of Changing Role on Store Metrics
Traditional Store Metrics
• Same store sales
• Sales per square feet
• Inventory turnover
• Customers per day/week
• Items per customer
Store seem unprofitable, but could be:
• Pick-up point for online sales
• Showroom for inspiration and online/mobile sales
• Distribution center for other location high sales
Potential New Metrics (Measured across channels)
• Region / zone sales
• Speed to fulfillment
• Foot traffic levels
• Brand / customer loyalty
• In stock %, and inventory levels per product
• Out-of-stock %
• Order fulfillments cost
New role within larger converged channel experience:
• Determine role of store and design metrics that measure performance across all channels
• Employ technology and inventory tracking to ensure products can be researched, purchased and delivered across channels
• Optimize networks based on role of the store (e.g. distribution center, showroom…etc.)
Defining consumer oriented KPIs key for successful execution at all levels

28
Thank you – please reach out to continue the dialog
Michael Hu
www.linkedin.com/in/mhuspace
@mhu_snowcrash

29
Additional Insights
Best Practices in Strategic Multichannel Fulfillment
Is Your Supply Chain Ready for the Omnichannel Revolution?
Heavy Lifting Required: A Large Format Home Delivery Breakthrough
Global Retail E-Commerce Keeps on Clicking
Brick and Mortar is the Foundation of Omnichannel Retailing
Creating an
Omnichannel
Supply Chain
for Branded
Manufacturers

30
Americas Atlanta
Bogotá
Calgary
Chicago
Dallas
Detroit
Houston
Mexico City
New York
Palo Alto
San Francisco
São Paulo
Toronto
Washington, D.C.
Asia Pacific Bangkok
Beijing
Hong Kong
Jakarta
Kuala Lumpur
Melbourne
Mumbai
New Delhi
Seoul
Shanghai
Singapore
Sydney
Taipei
Tokyo
Europe Amsterdam
Berlin
Brussels
Bucharest
Budapest
Copenhagen
Düsseldorf
Frankfurt
Helsinki
Istanbul
Kiev
Lisbon
Ljubljana
London
Madrid
Milan
Moscow
Munich
Oslo
Paris
Prague
Rome
Stockholm
Stuttgart
Vienna
Warsaw
Zurich
Middle East
and Africa
Abu Dhabi
Doha
Dubai
JohannesburgManama
Riyadh
A.T. Kearney is a leading global management consulting firm with offices in more than 40 countries. Since
1926, we have been trusted advisors to the world's foremost organizations. A.T. Kearney is a partner-owned
firm, committed to helping clients achieve immediate impact and growing advantage on their most mission-
critical issues. For more information, visit www.atkearney.com.