trends shaping the future of freight
TRANSCRIPT

TRENDS SHAPING THE
FUTURE OF FREIGHT
FREIGHT MATTERS webinar seriesMarch 29, 2017

Webinar Housekeeping• Submit a question via the
Questions box on your GoTo control panel.
• After the presentation, as time permits, our EPA presenter will answer questions submitted via the Questions box.
• Please complete the survey at the end of today’s webinar. Your feedback is important to us!
2

Webinar Housekeeping
The presentation slides and recording will be available at:
http://www.epa.gov/smartway/smartway-webinars-events(select the “Past Webinars/Events” tab)
3

SmartWay home page
4

5

Denise KearnsEnvironmental Protection SpecialistU.S. Environmental Protection Agency
Denise is a key member of EPA’s communications team that supports the agency’s SmartWay program, a public-private partnership that since 2004 has reduced fuel use by over 170 million barrels of oil, lowered fuel costs by almost $25 billion, and achieved significant reductions in carbon, NOX and particulate.
6

7
TODAY’S TOPICS
● Emergence of clean freight & efficiency in the U.S.
● Current trends in freight transportation
● Supply chain logistics and the e-commerce BOOM!
● Green retail in an era of change

8
• Transportation consumes roughly 2/3 of all petroleum-based fuel use & emits almost 1/3 of all carbon and other harmful emissions in the U.S.
• Freight sector accounts for over 25% of all fuel consumed and air emissions from transportation
• For trucking companies, fuel is second high operational cost
• Freight sector is the fastest growing source of transportation emissions globally
U.S. transportation energy use & emissions

9
U.S. leadership in clean freight & efficiency
• NEW EQUIPMENT- Emissions and fuel
efficiency standards formedium and heavy duty trucks
• ‘LEGACY FLEET’- Clean diesel grant, loan
& community programs
• EQUIPMENT, TECHNOLOGY, COLLABORATION, SUPPLY CHAIN
10
SmartWay, transportation efficiency, collaboration and clean air
• Improve U.S. freight efficiency and competitiveness• Highlight industry efforts to improve sustainability• Provide a standardized benchmarking and
performance assessment system• Facilitate collaboration between freight carriers, 3PLs
and shippers• Address trends, future opportunities for freight
sustainability

Bob CostelloChief Economist & Senior Vice PresidentAmerican Trucking Associations (ATA)
As chief economist for ATA, Bob manages ATA's collection, analysis and dissemination of trucking economic information, regularly producing several reports about trucking economic activity, an annual freight transportation Forecast, driver wage studies, weekly diesel fuel price and economic reports and a yearly trucking almanac.
Bob is often cited in the news media as an expert on trucking economics, including the Wall Street Journal, Business Week, CNBC, FOX Business Channel and National Public Radio.

Source: U.S. Freight Transportation Forecast to 2027, Eno Foundation, ATA
Trucking’s Importance to the Economy Has Surged Over the Decades
Truck
Billions of Tons
Rail

Distribution of Tonnage by Mode: 2015
Source: U.S. Freight Transportation Forecast to 2027
TL, 49.2%
LTL, 1.4%
Private, 49.4%
2015 Truck Tonnage Only
TL34.9%
LTL1.0%
Private35.0%Rail Carload
11.8%
Rail Intermodal1.3%
Air0.1%
Water5.3%
Pipeline10.5%
Total Trucking: 70.1%

Fact: In 2015, the top 20 for-hire TL carriers accounted for just 11% of total TL industry revenue.
Sources: U.S. Freight Transportation Forecast to 2027; American Trucking Trends
Tonnage Moved (2015)
Trucking Is a Diversified Industry
Large Business 3%
Small Business
97%
TL, 49.2%
LTL, 1.4%
Private, 49.4%
Small Carriers Dominate the
Industry
Distribution of Carriers by Power Units Operated

Sources: FMCSA, AAR, ATA
586,114
575
Motor Carriers* Rails**0
100,000
200,000
300,000
400,000
500,000
600,000
700,000
Number of For-Hire Firms
Trucking is Ultra Competitive, Leading to Small Margins
Motor Carriers Rails0%
5%
10%
15%
20%
25%
< 5%
> 20%
Operating Margins
*There are over 500,000 private fleets as well, some which are beginning to do some for-hire (back hauls).
**There are 7 Class I railroads and the remaining are short-lines.

Trucks vs Trains
More Fiction Than Fact

Total Increase in Tonnage from 2015 to 2027
Source: U.S. Freight Transportation Forecast to 2027
All Modes of Freight Transportation Will Grow

Sources: ATA & U.S. Freight Transportation Forecast to 2027
Tonnage Growth 2015 to 2027 & Market Share in 2027
(Baseline Forecast)

Sources: ATA & U.S. Freight Transportation Forecast to 2027
Tonnage Growth 2015 to 2027 & Market Share in 2027
(Alternative Forecast #1)

Sources: ATA & U.S. Freight Transportation Forecast to 2027
Tonnage Growth 2015 to 2027 & Market Share in 2027
(Alternative Forecast #2)

2015 Competitive Freight Among Truck and Rail Tonnage
Billions of Tons
Note: Maximum competitive freight is 1.2billion tons in a total market (truck and railonly) of 12.6 billion tons, or less than 10%.Competitive freight includes all freighttraveling at least 500 miles, but excludes coaltonnage. There is a significant amount of timedefinite freight in this category that really isn’tcompetitive, but it is included. So in reality,the competitive market is even smaller thansuggested here.
Source: ATA Analysis based on Commodity Flow Survey (US Census Bureau) data and US Freight Transportation Forecast to 2027
Non-Competitive Truck, 9.8
Competitive Truck Freight ,
0.7
Competitive Rail Freight ,
0.5
Non-Competitive
Rail, 1.6
FACT: Trucks and Trains Compete on a Very Limited Basis
Recent Trends Impacting the Industry

Growth in Truckload Loads vs Real GDP
6.2%
0.9%
2.6%
1.1%
0.1%
1.7%
4.3%
2.6%2.1%
2.6%
1.6%
2.3%
0%
1%
2%
3%
4%
5%
6%
7%
8%
Avg 1995-1999 Avg 2000 - 2007 Avg 2010 - 2014 2015 2016 2017
TL LoadsReal GDP
It is now difficult for loads to grow as fast as GDP for a host of reasons, including:- Miniaturization of freight (products and packaging)- Services are a growing part of our economy, and we don’t put services in trailers- We are buying more “experiences”, which generate less freight
Source: ATA

Dry Van Average Length-Of-Haul is Down
Source: ATA
796 miles

25
Patrick Browne serves as Director of Global Sustainability for UPS, a global leader in logistics, offering a broad range of solutions including the transportation of packages and freight. He is responsible for managing various sustainability initiatives and strategies’ working with cross-functional teams from various business units within the company. Patrick has been managing UPS’s sustainability programs since 2008, which includes calculating and reporting UPS’s global GHG inventory and reductions. Patrick joined UPS 28 years ago and has held various assignments throughout the company.
Patrick is active with many agencies and organizations focused on advancing sustainability practices around the world. He resides in Atlanta Georgia with his wife.
Patrick BrowneGlobal Sustainability DirectorUPS

Supply Chain Logistics & the e-commerce Boom
March, 2017
Patrick Browne – Director, Global Sustainability

Global Trends Impacting Supply Chain Logistics
27
Climate Change GlobalTrade
Urbanization e-commerce

28
More Residential Deliveries
MoreStops
More Miles,
Fuel and Emissions

29

30

31

32

Thank you

34
Carla Stickler Senior Analyst Carrier Relations and SolutionsHome Depot Supply Chain
With over 9 years of experience in privately owned and global multi-billion dollar corporations , Carla has developed an in depth knowledge of integrating transportation sourcing solutions and process improvement strategies across various Supply Chain platforms. In her current role at The Home Depot, she also serves as Mentor for the EPA to ‘coach’ new suppliers on the SmartWay® Program.
35
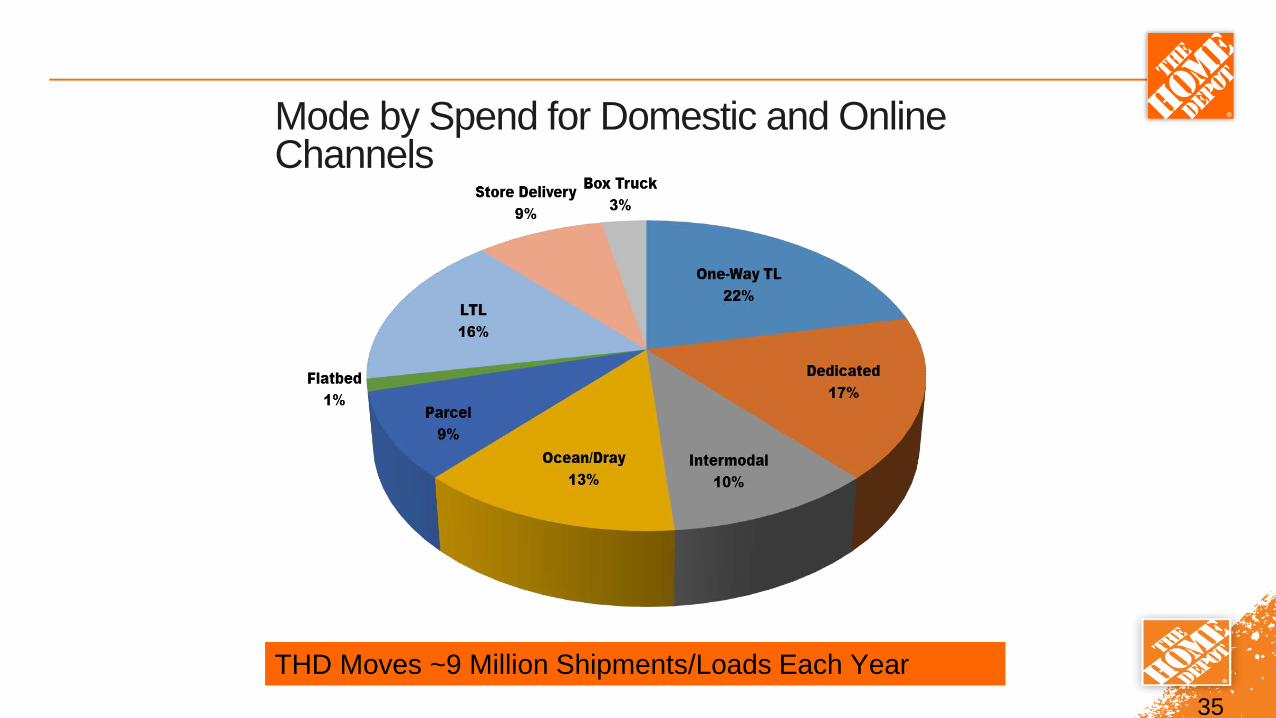
THD Moves ~9 Million Shipments/Loads Each Year
Mode by Spend for Domestic and Online Channels
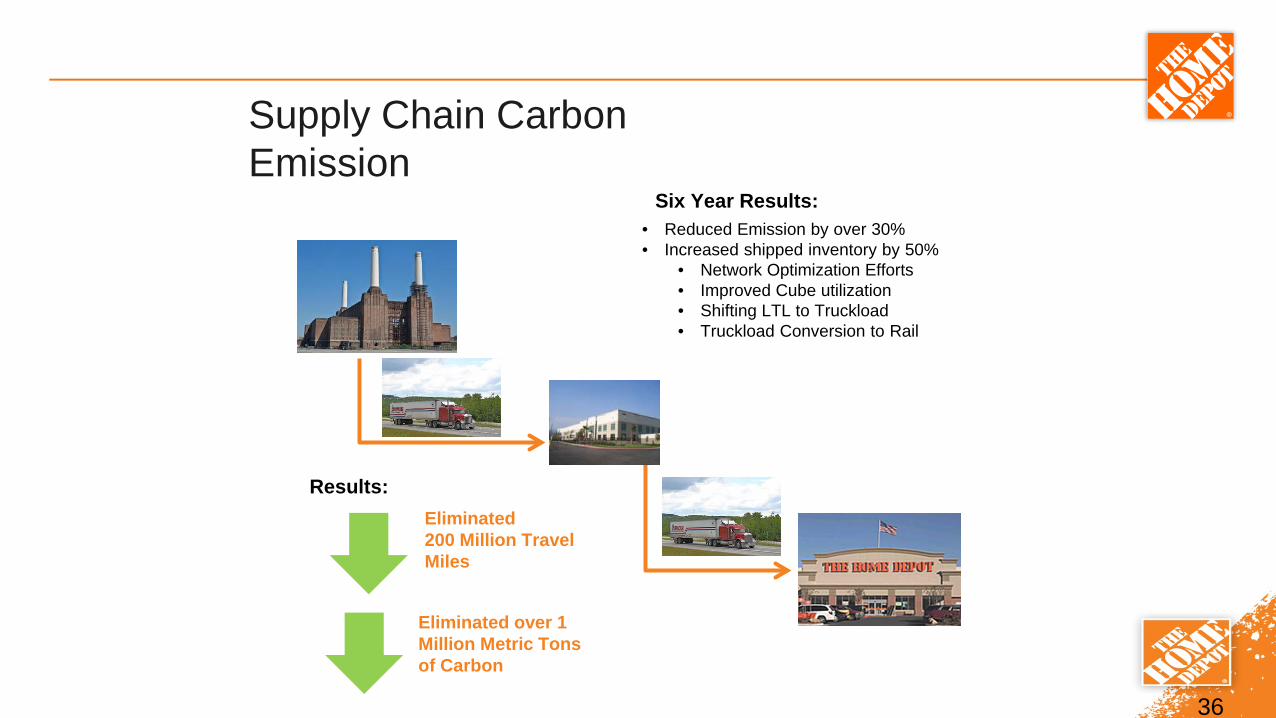
Supply Chain Carbon Emission
• Reduced Emission by over 30%• Increased shipped inventory by 50%
• Network Optimization Efforts• Improved Cube utilization• Shifting LTL to Truckload• Truckload Conversion to Rail
Eliminated over 1 Million Metric Tons of Carbon
Eliminated 200 Million Travel Miles
Results:
Six Year Results:
36
37
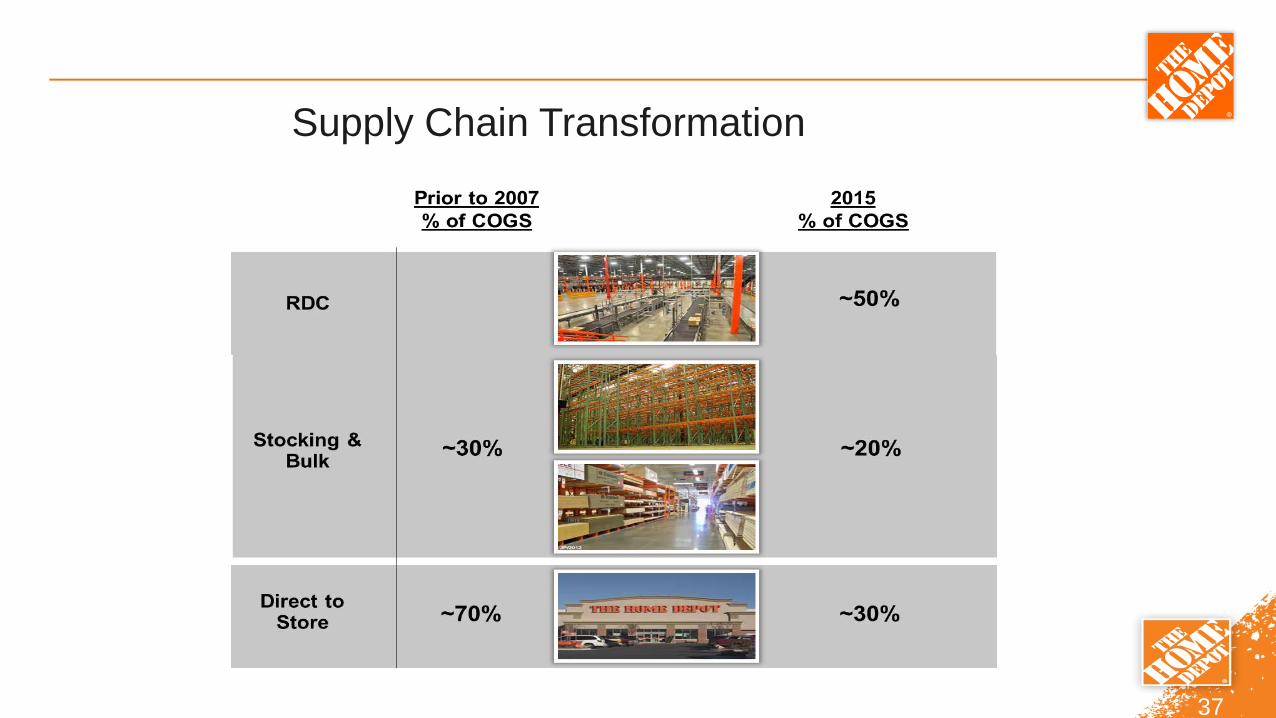
Supply Chain Transformation

Synchronize Flow and Manual Floor Load
38
Full TruckFull
Truck

Transportation Modal Shifts
2014 22K truckloads to Intermodal Rail Inbound Freight Consolidation - LTL to Truckload Removed 22 million miles of truck travel
2015 5K truckloads to Intermodal Rail Removed 4.8 million miles of truck travel
2016 Multi-Stop Truckload from Vendors Removed 18 million miles of truck travel
39

Direct Fulfillment-Online
40
DF DC Network

SmartWay®
EPA’s SmartWay® Excellence Award in 2016, 4th year in a row!
41
SmartWay® Partner since 2004
THD has won SmartWay® Excellence Award in 2009, 2013, 2014, 2015, and 2016
Score our carriers based on compliance to SmartWay® program requirements
Serving as a Mentor for the EPA to ‘coach’ new supplier on the SmartWay® Program

Questions?
42