global value chains and export sophistication in latin america
TRANSCRIPT

Munich Personal RePEc Archive
Global Value Chains and Export
Sophistication in Latin America
Manuel, Flores and Marcel, Vaillant
Departamento de Economía FCS-UdelaR
January 2011
Online at https://mpra.ub.uni-muenchen.de/47310/
MPRA Paper No. 47310, posted 01 Jun 2013 13:39 UTC

32Volume 15
January-June 2011
Nº
Inter-American Development Bank
Integration and Trade Sector
Institute for the Integration of Latin America and the Caribbean
@journalE-Biannual Publication

Nº 32 // Volume 15 // January-June 2011
RNP: 926191 ISSN: 1995-9532
Publication property of the Institute for the Integration of Latin America and the Caribbean, Inter-American Development Bank (IDB-INTAL). All rights reserved.
Steering CommitteeRicardo Carciofi
Antoni Estevadeordal
Editorial CommitteeGala Gómez Minujín
Erika Francescon Juan Martin
Christian Volpe
Coordination-EditingSusana M. FilippaJulieta S. Tarquini
Institute for the Integration of Latin America and the Caribbean
Esmeralda 130, 16th FloorC1035ABD Buenos Aires, Argentina
Tel: (54 11) 4323-2350 Fax: (54 11) 4323-2365
e-mail: [email protected]://www.iadb.org/intal
Ideas and opinions expressed in the articles published in this Journal are those of the authors and do not necessarily reflect the official policies and views of IDB-INTAL. Quotations from the published articles are allowed as long as the source is acknowledged. Where quotations are used, a copy of the publication will be greatly appreciated.
CONTENTS
TRADE AND THE INTERNATIONAL ORGANIZATION OF PRODUCTION:PROSPECTS FOR LATIN AMERICA AND THE CARIBBEAN 1
Juan Blyde and Christian Volpe Martincus
ARTICLES 5
International Fragmentation of Production: Its Effects on the Labour Market 7
Sascha O. Becker and Karolina Ekholm
Regional Production Sharing Networks and Hub-Ness in Latin America and East Asia: A Long-Term Perspective 17
Lurong Chen and Philippe De Lombaerde
Global Value Chains and Export Sophistication in Latin America 35
Manuel Flores and Marcel Vaillant
Global Value Chains in the Services Sector: Business Strategies and Latin American Insertion 49
Andrés López, Andrés Niembro and Daniela Ramos

INTERVIEWS 61
Panel Interviews about Global Value Chains
Javier Martínez Álvarez (TENARIS) 63
Daniel Herrero (TOYOTA) 67
Jorge E. Sequeira Picado (PROCOMER) 71
STATISTICS 77
BOOKS AND ARTICLES REVIEWS 87
Power and Plenty Trade, War, and the World Economy in the Second Millennium 89
Ricardo Carciofi
El procedimiento de opinión consultiva en el Protocolo de Olivos sobre resolución de Controversias 93
Luis Fernando Castillo Argañarás
Unclogging the Arteries: The Impact of Transport Costs on Latin-American and the Caribbean Trade 95
María M. Supervielle

@ journalNº 32 // Volume 15 // January-June 2011
Institu
te fo
r the In
tegra
tion o
f Latin
Am
eric
a a
nd th
e C
arib
bean (ID
B-IN
TA
L). A
ll rights re
serv
ed.
35
GLOBAL VALUE CHAINS AND
EXPORT SOPHISTICATION IN LATIN AMERICA
MANUEL FLORES
Graduate in Economics, Universidad de la República, Uruguay; and Master candidate in International Economics. Researcher-professor (2nd year) Economics Department, School of Social Sciences, Universidad de la República.
MARCEL VAILLANT
Doctor in Economics UFSIA University (Antwerpen, Belgium). Professor of International Trade, Department of Economics, School of Social Sciences, Universidad de la República, Uruguay. Researcher (level III) for Sistema
Nacional de Investigadores de Uruguay.
The process of globalization has wrought a major change in the international economy, and the scope of feasible trade between countries has broadened. Global value chains (GVCs) combine participation by a large number of suppliers across the world in the production of modern manufactured goods characterized by an acceleration of technical progress. Unlike other developing countries, the Latin American countries have not played a leading role in this dynamic, with consistently low levels of export sophistication. This paper evaluates the level of Latin America’s export sophistication from a dynamic and comparative perspective, using a modern product sophistication indicator. Its results confirm the starting hypothesis, but reveal different situations and trajectories. An order according to levels of export sophistication was established in the countries selected: Mexico, Brazil, Argentina, Colombia, Costa Rica, Uruguay, and Peru. The work takes in the dimension of the dynamic of the export specialization pattern by product type (e.g. capital goods, primary inputs, processed inputs, consumer goods) in the period 2000-2007. In products with permanent specialization, which channel the bulk of exports and reflect the pattern of specialization, Mexico and Brazil are always around the Latin American average for all types of goods. Mexico reaches levels of sophistication similar to the OECD average in capital goods, processed inputs, and consumer goods, but with notably lower levels of sophistication in primary inputs. Brazil is below Mexico except in primary inputs, where it has an average similar to the OECD countries. In the products that describe the dynamics (i.e. that lose and gain specialization), the level of sophistication is always higher than goods with permanent specialization. The order within the countries analyzed does not hold and, in some cases, even has almost the reverse pattern. In all cases, the countries most notable for their levels of sophistication in goods that gain specialization are Peru, Uruguay, Costa Rica, and Colombia. In other words, in the margin, there may be evidence that these countries are participating in a recent process of export modernization, particularly in processed intermediate goods.

Manuel Flores and Marcel VaillantIn
stit
ute
for
the I
nte
gra
tion o
f Lati
n A
meri
ca a
nd t
he C
ari
bbean (
IDB-I
NTA
L).
All
rig
hts
rese
rved.
36
INTRODUCTION
The process of globalization has, in recent decades, wrought a dramatic change in the international economy. One of the sources of this new dynamic
is the swift process of technical change in the circulation of information and in the reduction of transport costs in general. There has been a significant increase in the levels of trade, and broadening of the basket of economic activities (goods and services) traded at the level of the international economy. Furthermore, the mobility of factors is also important, although this has an asymmetric pattern concentrated in capital (physical and financial) and in labor with a high human capital endowment. From the specialization point of view, this phenomenon is expressed in the process of fragmentation of production at the planetary level. The various stages making up the production of a given amount of economic activity —whether in the production of goods and/or services— have been distributed across the planet through numerous national jurisdictions in a vast array of organizational forms or modes of governance that are known, among other names, as global value chains (GVCs). This fragmentation of production is the modality that characterizes the internationalization of the production processes in many modern manufactured goods, but it has been spreading to a varied group of economic activities, notably the service sector.
Unlike other regions (particularly Southeast Asia), Latin America has not played a leading role in this recent dynamic. The Latin American economies, which display low levels of export quality (commodities with low levels of change, low unit value, and low differentiation), might be able to modify this pattern if dynamically inserted in GVCs.
This work aims to contribute to the analysis of some Latin American countries’ insertion in the process in recent years. As there are so few precedents in terms of quantitative approaches to the phenomenon, we have turned to the empirical identification of two stylized facts peculiar to insertion in GVCs: the emergence of new products in the export baskets and the presence among them of intermediate products. In addition, a measure of the products’ sophistication is used to incorporate a notion of quality in the different subbaskets identified.
After this introduction, the work is structured in five sections. The Second Section, which defines the phenomenon of GVCs, illustrates the fundamental trends in terms of trade structure and discusses the main literature of international trade that has identified it (Baldwin, 2006a & 2006b). The Third Section links GVCs to the structure of exports and analyzes the dynamic effects of specialization, which suggest that economies’ capacity for growth is bound up with the quality of the products they export (their technology density). The Fourth Section presents and discusses the results, and the last highlights the major results.
NEW WAVES OF GLOBALIZATION AND GVCS
The increased intensity of international trade is associated with the broadening of the scope of feasible trade at the international level. Trade
specialization first began with a wave of fragmentation, signaling the separation between production and consumption in national markets. This opened up opportunities for trading and its resulting mutual benefits. The first type of international trading was based on a kind of trade determined by the differences between countries, both in the technology they use to produce and in the allocation of production factors. The essential principle is that of comparative advantages (different comparative costs in non-trade conditions), characterized by a pronounced interindustrial trade pattern: countries sell very different types of goods than the ones they buy.
In the last two decades of last century, new phenomena emerged in international trade and new grounds for specialization were identified. The change is primarily grounded in technologies characterized by increasing returns to scale, which encourage specialization and trade in other areas and directions, and make it necessary to consider aspects such as non-competitive market structures, product differentiation, and the existence of trade costs. This last dimension is where another pronounced trend is processed, consisting of a sharp drop in trade costs that stimulated a new geography in the production of manufactured goods on a global scale.
Trade costs, strictly speaking, include transport costs, costs associated with adaptation to access to different

@ journalNº 32 // Volume 15 // January-June 2011
Global Value Chains and Export Sophistication in Latin AmericaIn
stitute
for th
e In
tegra
tion o
f Latin
Am
eric
a a
nd th
e C
arib
bean (ID
B-IN
TA
L). A
ll rights re
serv
ed.
37
markets (including distribution costs), and the cost of enforcing trade policy. Various different factors have combined to make a significant reduction in trade costs possible, most notably the processes of cargo unitization and increase in the scale of transport, standardization of production processes on a global scale, and trade liberalization. The lower the trade costs, the more relevant small differences become in production costs between different origins as determinants in the countries’ capacity to place global activities.
The combination of the above trends underpinned the development of GVCs, which combine participation by a large number of suppliers across the world in the production of modern technology-intensive manufactured goods. The greater buoyancy of trade associated with this new wave of specialization is intraindustrial in nature (close substitute goods in production and/or consumption are traded), both horizontally and —primarily— vertically. High growth in trade in intermediate goods is the most prominent stylized fact in the evolution of late-twentieth-century trade.
A new trend in international trade incorporating new patterns of specialization has taken hold during the last decade. Although the process has been under way for longer, it has only come to maturity in the last few years, when the wave of technical progress has again played a central role. There are two complementary levels of change fuelling the so-called new reasons for specialization: there has been intense development of information technologies and universalization of computer networks; simultaneously telecommunications costs have fallen drastically. Production that was traditionally not internationally traded can now feasibly be turned into a globally-traded commodity. The impact of this is felt especially keenly in services.
Trade in services was traditionally confined to the headings of “travel” and “tourism” (consumers move and purchase services from suppliers from elsewhere in the world) and to services associated with the international transport of goods. In recent years, in association with this new wave of fragmentation in global economic activity, other commercial services have grown, most notably corporate services. In other words, fragmentation not only occurs within the plant producing the goods, but also within the
management structure that produces corporate services. This phenomenon has been called building the “global office”.1
Two bodies of original ideas in economics converge in the new division of labor unfolding at the scale of the international economy: on the one hand, the link between division of labor and productivity as discussed by Adam Smith; on the other, the Ricardian determinants of countries’ productive and commercial specialization, which, in modern parlance, is based on relative productivities in producing goods or performing tasks.
In conventional models of international trade based on comparative advantages, movements of goods and factors of production are considered as substitutes (the effects of the movement of factors is analogous to those of the movement of products to which these factors have been applied). Taking into account the new reasons for trade, the current trends include a high degree of complementarity between the movement of factors and trade, particularly with trade in intermediate goods and task trade. However, the enhanced mobility of factors of production —a typical feature of globalization— follows an asymmetric pattern almost exclusively affecting physical capital through foreign direct investment (FDI), financial capital, and highly skilled workers.
To summarize, the distinctive feature of the current wave of globalization is the widespread increase in the degree of internationalization of economic activity. Figure 1 shows growth in trade in “other commercial services” and “intermediate goods” over the last three decades. This growth was faster than that of general trade in goods, which grew sixfold during the reference period, with trade in inputs and parts growing tenfold and that of other commercial services (including corporate services), fourteenfold. These components associated with the process of fragmentation of economic activity stood out as the most dynamic sectors in international trade: whereas in 1980 they represented 14% of world trade (goods and services), by 2009 they accounted for a quarter.
1 Another term for the process is “task trade”. A set of tasks needs to be performed for the production of a certain good or service. The new technologies allow these tasks to be relocated internationally and to enjoy the advantages of specialization.

Manuel Flores and Marcel VaillantIn
stit
ute
for
the I
nte
gra
tion o
f Lati
n A
meri
ca a
nd t
he C
ari
bbean (
IDB-I
NTA
L).
All
rig
hts
rese
rved.
38
The new international division of labor involves a reduction of the importance of the sectors specializing solely in import substitution (Baldwin, 2006a). It is difficult today to find sectors solely aligned to domestic market conditions without, at the same time, being linked to external conditions (either importing and/or exporting), and the global sectors that emerge are at the same time importing and exporting. The above set of changes, therefore, has a substantial impact on the political economy of trade policy.
This phenomenon has been clearly expressed in the international crisis and post-crisis periods. The economic crisis, which fundamentally played itself out in the industrialized economies, raised new question marks over the risk of increased protectionism and a possible process of “deglobalization”. In such an event, the structural changes seen at the level of international trade specialization could slow or even reverse. However, as the global structure of economic activity registers such high levels of interdependence, this is extremely difficult to alter. Fragmentation and
specialization -based strategies enable companies to maintain their global competitiveness, and any reversions would involve declines in their productivity and their capacity to penetrate global markets. A reversion would, therefore, have an impact on demand and employment levels contrary to the desired one. In a recent work for the World Bank, Cattaneo, Gereffi, & Staritz (2010) have argued that trade has withstood the crisis rather well and GVCs are partially responsible for this result.2
2 According to Cattaneo, Gereffi, & Staritz (2010), the redeployment and localization of world production that has emerged over the past 20 years are so far-reaching in their scope that they withstood the tests and temptations of protectionism. World production is now geographically dispersed, organized by networks and chains with companies of global size and reach that structure the process. There seems to be no turning back from the phenomenon.
Source: UNCOMTRADE and WTO.
F i g u r e 1
EVOLUTION OF GOODS AND OTHER COMMERCIAL SERVICES GLOBAL EXPORTS
1980=100 indexes
Goods Inputs & parts Other commecial services
19
80
19
82
19
84
19
86
19
88
19
90
19
92
19
94
19
96
19
98
20
00
20
02
20
04
20
06
20
08
1800
1600
1400
1200
1000
800
600
400
200
0

@ journalNº 32 // Volume 15 // January-June 2011
Global Value Chains and Export Sophistication in Latin AmericaIn
stitute
for th
e In
tegra
tion o
f Latin
Am
eric
a a
nd th
e C
arib
bean (ID
B-IN
TA
L). A
ll rights re
serv
ed.
39
COMPARATIVE ADVANTAGES, EXPORT
SOPHISTICATION, AND GVCS
For its empirical approach to the phenomenon of GVCs, this work uses the UNCOMTRADE database for annual FOB exports by country of
origin for the period 2000-2007. Countries registering no information in one of the eight years have been eliminated, leaving a total sample of 121 countries. In terms of products, we used the 2002 6-digit Harmonized System (HS) classification, and we applied the criterion of maintaining those products for which trade was registered in one or other year of the period analyzed (4,913 products of the existing 5,224). This produces a database with 594,473 observations.
We chose three types of countries for the analysis and presentation of the results: (i) selected developed countries (Germany, the Benelux countries, South Korea, United States, and Japan); (ii) Brazil, Russia, India, and China (BRIC), i.e. new emerging countries with large markets; and (iii) selected Latin American countries (Argentina, Brazil, Colombia, Costa Rica, Mexico, Peru, and Uruguay).
EVOLUTION OF TRADE BY COMPARATIVE ADVANTAGE
Figure 2a and Figure 2b represents the evolution of trade in the 4,913 products across the 121 countries. There are three types of situations for country-product combinations in each year: the good is not exported in that country; it is exported, but without revealed comparative advantage (RCA); or it is exported with RCA. As Figure 2a shows, the number of products in each situation considered remains stable, with approximately 47% of products not exported, 42% of products exported without RCA, and just the remaining 11% of products in the HS exported with RCA each year. While the value of trade has risen steadily over the past few years, as shown in Figure 2b, the proportion of the value of exports with RCA is stable, at around 81%.
If the data by country is analyzed, we can see that, the weight of exports with advantage in the more developed countries is lower, at three-quarters of the total, whereas in the developing countries, this percentage is usually above 90%, at least in the smaller countries. Table 1 sets out the percentages for the selected countries and, as can be seen, there are no major changes in the period under consideration.
F i g u r e 2 a
Source: Based on trade data from UNCOMTRADE.
EVOLUTION OF INTERNATIONAL TRADE WITH AND WITHOUT RCA
Number of products
EVOLUTION OF INTERNATIONAL TRADE WITH AND WITHOUT RCA
Value of imports
Not Exported Exported without RCA Exported with RCA
2000 2001 2002 2003 2004 2005 2006 2007
300,000
250,000
200,000
150,000
100,000
50,000
0
F i g u r e 2 b
Exported without RCA Exported with RCA
US
$ M
illons
2000 2001 2002 2003 2004 2005 2006 2007
12000.0
10000.0
8000.0
6000.0
4000.0
2000.0
0

Manuel Flores and Marcel VaillantIn
stit
ute
for
the I
nte
gra
tion o
f Lati
n A
meri
ca a
nd t
he C
ari
bbean (
IDB-I
NTA
L).
All
rig
hts
rese
rved.
40
EVOLUTION OF EXPORT SOPHISTICATION
A methodology has recently been developed that provides an indicator of the levels of product sophistication and overcomes the critiques of previous proposals that registered a high degree of endogeneity.3 The only information used to calculate it is a country-product grid each cell of which indicates whether the country (column) has RCA in the product (row).
An economy with low levels of sophistication is an economy that specializes in few products (i.e. it lacks the capacity to produce most goods) that many countries, also with low levels of sophistication, specialize in. This is what in common parlance is called a “banana republic”: specialization in a product that many other similar economies specialize exclusively in. A highly sophisticated economy is the opposite: there is specialization in many products that other also highly sophisticated countries specialize in. The method of reflections implements this idea. The Annex Figure presents the resultant ranking from the calculation of the indicator of levels of export sophistication for the
3 The new indicator is known as the level of products sophistication of the “method or reflections” (Hausmann & Hidalgo, 2009).
121 countries considered in each year of the period 2000-2007.4
As can be seen, the countries of the region display relative stability in export sophistication. Among the selected countries, Costa Rica and, to a lesser extent, Colombia have achieved clearer improvement whereas Argentina and, to a lesser extent, Brazil have lost sophistication. This, together with the decline in the Indian and Russian baskets, accounts for a simplification of three of the BRICs’ export baskets. The evolution of China’s exports contrasts with this pattern, being characterized by a marked improvement.
In the developed countries, there is the usual stability in their relative position, with the exception of South Korea, which belongs to the group of countries with greatest export sophistication. 2007 was notable for the progress that several of the region’s countries (e.g. Uruguay, Costa Rica, Colombia, Peru, and Argentina) made, despite a fall in all cases over the previous years.
If this evolution were analyzed by clustering countries, Argentina’s decline would have moved it
4 For a detailed description of the methodology, see Flores & Vaillant (2011).
Country 2000 2007 Country 2000 2007
Developed Latin American
Germany 75.4 77.0 Mexico 81.7 81.8
Benelux countries 76.4 77.9 Brazil 81.3 83.7
South Korea 84.5 84.1 Argentina 85.6 84.9
United States 74.9 74.1 Colombia 91.8 91.1
Japan 86.0 82.5 Costa Rica 94.9 93.9
BRIC (exc. Brazil) Uruguay 92.3 92.3
China 81.0 84.1 Peru 93.7 93.8
India 88.3 84.9
Russia 91.2 91.3
T a b l e 1
EXPORT COMPOSITION CONSIDERING RCA
% of total exports for selected countries, 2000 & 2007
Source: Based on trade data from UNCOMTRADE.
@ journalNº 32 // Volume 15 // January-June 2011
Global Value Chains and Export Sophistication in Latin AmericaIn
stitute
for th
e In
tegra
tion o
f Latin
Am
eric
a a
nd th
e C
arib
bean (ID
B-IN
TA
L). A
ll rights re
serv
ed.
41
from the best-positioned group in the region (along with Mexico and Brazil) to the top of the group with medium sophistication (along with Colombia, Costa Rica, Uruguay, and Chile). Peru remained stable throughout the period, and, alongside Bolivia and Ecuador, formed part of the group with least export sophistication in the South American region.5
EVALUATING THE CHANGES
For the purposes of this work, we wish to investigate the dynamics through which countries have acquired advantages in certain products in the period analyzed. While the indicator of the method of reflections considers exports with RCA, and brings together products exported without RCA and products not exported under a single category, we propose here to differentiate the latter two situations.
As a way of incorporating a dynamic view, the analysis is divided into in an initial subperiod (2000-2003) and a final subperiod (2004-2007). Four possible scenarios for product-country observation are identified in each subperiod, paying attention to a dominance criterion in each four-year group: no dominant behavior (ND); dominance of periods of no exportation (NE); dominance of periods of export with no RCA (NA); and dominance of periods of export with RCA (A).6 With these elements, it is possible to simply appreciate the relevance of the different evolutionary patterns of countries’ export structures: both the stable behavior across subperiods and the changes that reflect a country’s situations of gain or loss of specialization in a product.
As shown in Table 2, observations corresponding to country-product cases of no exportation stand at 45.2% in the initial period, and 38.4% maintains this feature in the final period (stable not exported). For exports without RCA, the figure is 36.9% in the initial period, 31.1% of which maintain the characteristic. Finally, the cases of export with RCA were 9.5% in the initial period and 7.2% maintained such a condition.
5 It should be remembered that Venezuela is one of the countries that have been excluded due to a lack of information for 2007 in the UNCOMTRADE database.
6 The dominance criterion in the four years of the subperiod considers dominant any situation arising in a number of years strictly higher than any of the possible alternative situations.
The weight of stable cases (exports in 2004-2007 faced a situation similar to that of 2000-2003) reaches 78% (values highlighted in the diagonal of each panel). These products channeled 88% of the value of world trade in the initial period and 86.5% of it in the final period.7 However, Table 2’s interest does not lie in stable situations, but in its description of the changing situation.
Table 2 (Panel A) shows that the largest number of products that change situation do so either from a situation of non-dominance (ND) to being exported without advantage (NA), or from not being exported (NE) to a non-dominant (ND) behavior or to being exported without advantage (NA). Panels B and C measure the value coverage of exports in the initial and final subperiods. The table allows us to see the distribution of different types of traffic identified, the importance of which can be quantified either in the initial or final period. It is interesting to compare the distribution of importance in the initial classification as measured by exports in the initial period against the distribution in the final period as measured by exports in the final period (values highlighted in bold in Panels B and C).
Table 2 identifies 16 patterns in the export specialization dynamic. Five categories can be identified in order to simplify the variable and consider the most relevant patterns: those that have an advantage in the initial and final periods (A,A); those that acquire some degree of specialization (NE,A), (ND,A), (NA,A), plus (NE,NA) and (ND,NA); those that lose specialization (A,NE), (A,ND), (A,NA), plus (NA,ND) and (NA,NE); those exported without specialization (NA,NA) plus (ND,ND); (NE,ND), (ND;NE); and last those that are never exported (NE,NE).
Table 3 presents the five patterns of the dynamic and products are further distinguished by type of good (capital goods, primary inputs, processed inputs, and consumer goods).8
7 These figures do not coincide exactly with the ones presented above because, in this case, the products have been classified in light of the situation prevailing in each subperiod; in the four years comprising it as a whole, however, there may arise non-dominant situations. So, for example, the value of positive trade seen in products classified as non-exported corresponds to exports in a year of products that register no exports in most years of the subperiod.
8 We have used the classification by broad economic categories (BEC).

Manuel Flores and Marcel VaillantIn
stit
ute
for
the I
nte
gra
tion o
f Lati
n A
meri
ca a
nd t
he C
ari
bbean (
IDB-I
NTA
L).
All
rig
hts
rese
rved.
42
70% of world trade is in products where the countries’ advantages remain stable in the period. The weight of this situation for capital goods is lower (62%), which is perhaps an indicator that the pace of technical progress is faster in these types of goods. It is also apparent that almost 10% of trade in 2007 was in products where the countries recently acquired specialization (these products accounted for less than 5% of world exports in 2000). Among the types of goods comprising this set of dynamic products, primary inputs stand out, representing 18% of exports of products where there is a gain in specialization when they are worth just 8.7% of the value of total exports.
Figure 3 evaluates the level of sophistication by type of good and dynamic.9 The highest degree of
9 The level of sophistication was measured at iteration 10 from indicator Kp (Hausmann & HIdalgo, 2009), and the order was then taken to percentiles. The averages of the percentiles by type of good and pattern of dynamic are presented. This simple average of the levels of sophistication can be seen to have an extremely high correlation (99.1%) with the country index used in Section Comparative Advantages, Export Sophistication, and GVCs. Using the sophistication of each product has the advantage of allowing us to work with subbaskets of the group of products exported by each country.
A) Distribution of total of products situations
Ini \ Fin NE ND NA A Total
No Exportation (NE) 38.4 3.3 3.2 0.3 45.2
No Dominance (ND) 2.7 1.4 3.4 0.8 8.4
No Advantage (NA) 1.8 2.6 31.1 1.4 36.9
Advantage (A) 0.2 0.7 1.4 7.2 9.5
Total 43.2 8.1 39.0 9.7 100.0
B) Distribution of products in exports in 2000-2003
Ini \ Fin NE ND NA A Total
No Exportation (NE) 0.03 0.00 0.07 0.08 0.20
No Dominance (ND) 0.15 0.34 1.84 2.04 4.37
No Advantage (NA) 0.03 1.06 15.42 1.58 18.09
Advantage (A) 0.15 2.17 2.78 72.24 77.35
Total 0.4 3.6 20.1 75.9 100.0
C) Distribution of products in exports in 2004-2007
Ini \ Fin NE ND NA A Total
No Exportation (NE) 0.02 0.05 0.17 0.49 0.7
No Dominance (ND) 0.01 0.31 1.37 3.41 5.1
No Advantage (NA) 0.01 1.82 15.00 3.41 20.2
Advantage (A) 0.02 1.38 1.32 71.21 73.9
Total 0.06 3.56 17.86 78.52 100.0
T a b l e 2
EVOLUTION OF EXPORTS BY SITUATION BETWEEN 2000-2003 & 2004-2007
% of total products and of world export value
Source: Based on data from UNCOMTRADE.

@ journalNº 32 // Volume 15 // January-June 2011
Global Value Chains and Export Sophistication in Latin AmericaIn
stitute
for th
e In
tegra
tion o
f Latin
Am
eric
a a
nd th
e C
arib
bean (ID
B-IN
TA
L). A
ll rights re
serv
ed.
43
A) Proportion of number of products exported in 2007
(NE,NE) No Spec.Specialization
(V,V) TotalLose Gain
Capital goods 0,6 9,7 1,0 2,2 1,5 14,9
Primary inputs 0,3 3,0 0,5 1,0 1,0 5,8
Processed inputs 2,3 30,1 3,5 7,6 6,4 49,9
Consumer goods 1,1 17,7 2,2 4,3 4,1 29,3
Total 4,4 60,5 7,1 15,1 12,9 100,0
B) Proportion of value of exports in 2007
(NE,NE) No Spec.Specialization
(V,V) TotalLose Gain
Capital goods 0,0 3,9 1,1 2,6 12,5 20,1
Primary inputs 0,0 1,1 0,3 1,7 5,6 8,7
Processed inputs 0,0 7,6 2,3 3,6 34,8 48,2
Consumer goods 0,0 3,6 1,0 1,8 16,7 23,0
Total 0,1 16,2 4,7 9,5 69,6 100,0
T a b l e 3
DYNAMICS OF EXPORTS AND TYPE OF GOOD
As %
Source: Based on data from UNCOMTRADE.
sophistication is seen in capital goods, followed by processed inputs, then consumer goods, and last, primary goods. Product-country combinations that acquire advantage at the global level do so by increasing levels of sophistication in relation to the group of products permanently exported with an advantage.
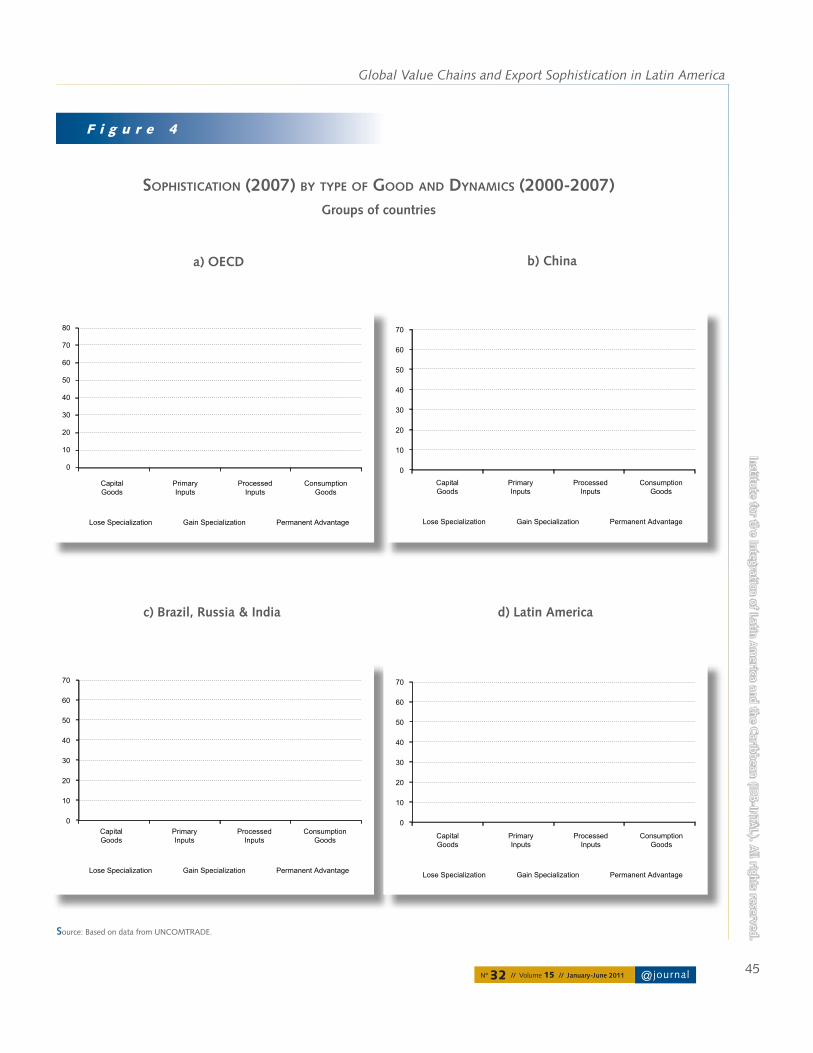
Figure 4 shows the same structure, but in four regions: OECD (excluding Mexico and Chile); China; BRIC (excluding China), and Latin America (excluding Brazil). It is worth noting that the order by type of good holds good across all country clusters (capital, processed goods, consumption, and intermediate goods). In products with advantage, the OECD countries and China are undifferentiated in levels of sophistication. Whereas the OECD is somewhat better-off in terms of capital goods, China has higher levels of sophistication in primary products and consumption. They are extremely alike in terms of processed products. The other three BRIC countries always register lower levels of sophistication
than China, and Latin America (excluding Brazil) always shows lower figures than the other regions.
In terms of the dynamic, products where specialization is acquired have a similar level of sophistication across country clusters in all types of goods. This implies that the difference of sophistication among new and permanent products will have precisely the opposite order to the level of sophistication by region and type of good. Latin America is the region with the lowest levels of sophistication, but where new products with advantage have a major difference with the traditional pattern.
The situation in Latin America is heterogeneous, as noted in previous sections. In products with permanent specialization, which channel the bulk of exports and reflect the pattern of specialization, Mexico and Brazil are always above the Latin American average in all types of goods (Figure 5). Mexico reaches levels of sophistication similar to the OECD average in capital

Manuel Flores and Marcel VaillantIn
stit
ute
for
the I
nte
gra
tion o
f Lati
n A
meri
ca a
nd t
he C
ari
bbean (
IDB-I
NTA
L).
All
rig
hts
rese
rved.
44
goods, processed inputs, and consumer goods, and has notably lower levels of sophistication in primary products (Figure 4 and Figure 5). Brazil is below Mexico except in primary goods, where it registers an average similar to the OECD countries.
Keeping the spotlight on products with permanent specialization, the order registered in intermediate processed goods is the same as the global order (i.e. the average of sophistication of the basket of products). In this type of inputs, third place in terms of sophistication is held by Argentina, followed by Colombia, Costa Rica, Uruguay, and Peru. This order has variants in the other types of goods, however. In capital goods, third place is held by Costa Rica, and Uruguay is in last place. In primary goods, Uruguay comes second, very close to Brazil and ahead of Mexico, while Peru comes
last. Finally, in consumer goods, third place is held by Colombia, while Argentina and Peru come second to last and last respectively.
In products that describe the dynamic (i.e. that lose and gain specialization), the levels of sophistication are always higher than goods with permanent specialization. The order among the countries analyzed does not hold good and is even almost the reverse in some cases (see Figure 5 for capital goods in cases that gain specialization). In every case, the countries that stand out for their levels of sophistication in goods that gain specialization are Peru, Uruguay, Costa Rica, and Colombia. In other words, there is evidence in the margin that these countries are participating in a recent modernization process in their export baskets, particularly, in intermediate processed goods.
F i g u r e 3
Note: Includes all 121 countries and 4913 products.
Source: Based on data from UNCOMTRADE.
SOPHISTICATION (2007) BY TYPE OF GOOD AND DYNAMICS (2000-2007)
Total global exports
Lose Specialization Gain Specialization Permanent Advantage
Capital Goods Primary Inputs Processed Inputs Consumption Goods
70
60
50
40
30
20
10
0
@ journalNº 32 // Volume 15 // January-June 2011
Global Value Chains and Export Sophistication in Latin AmericaIn
stitute
for th
e In
tegra
tion o
f Latin
Am
eric
a a
nd th
e C
arib
bean (ID
B-IN
TA
L). A
ll rights re
serv
ed.
45
F i g u r e 4
Source: Based on data from UNCOMTRADE.
SOPHISTICATION (2007) BY TYPE OF GOOD AND DYNAMICS (2000-2007)
Groups of countries
Lose Specialization Gain Specialization Permanent Advantage
70
60
50
40
30
20
10
0
CapitalGoods
PrimaryInputs
ProcessedInputs
ConsumptionGoods
Lose Specialization Gain Specialization Permanent Advantage
CapitalGoods
PrimaryInputs
ProcessedInputs
ConsumptionGoods
80
70
60
50
40
30
20
10
0
a) OECD
c) Brazil, Russia & India
b) China
d) Latin America
Lose Specialization Gain Specialization Permanent Advantage
70
60
50
40
30
20
10
0
CapitalGoods
PrimaryInputs
ProcessedInputs
ConsumptionGoods
Lose Specialization Gain Specialization Permanent Advantage
70
60
50
40
30
20
10
0
CapitalGoods
PrimaryInputs
ProcessedInputs
ConsumptionGoods

Manuel Flores and Marcel VaillantIn
stit
ute
for
the I
nte
gra
tion o
f Lati
n A
meri
ca a
nd t
he C
ari
bbean (
IDB-I
NTA
L).
All
rig
hts
rese
rved.
46
CONCLUSIONS
80% of the value of world exports is accounted for by exporting countries with a comparative advantage. Developing countries tend to have
an even higher proportion of exports, which allows us to speculate that they have greater stability in their patterns of specialization.
The pattern of specialization is evaluated in terms of the performance displayed by the countries in their levels of export sophistication (estimated by the method of reflections). The Latin American countries do not do well in this indicator, which shows a low level of exports sophistication. A group of countries was selected that show relatively stable evolution in these indicators over the period considered, allowing us to differentiate cases such as Brazil, which is close to the lower OECD levels, and Peru, which has the lowest levels of sophistication in the region. Though minor, the changes show that Costa Rica in first place and Colombia in second show an improvement, whereas Argentina, and to a lesser extent Brazil, lose export sophistication.
The mode in which the region’s economies are inserted in GVCs can be a determinant both in their recent developments and their prospects of modifying their role as exporters of goods with low levels of change, low unit value, and low differentiation (commodities). The development of GVCs is associated with relocation of production and is reflected in participating countries’ beginning to export new products, which therefore requires the incorporation of a vision of the dynamic of the pattern of specialization. According to the methodology set forth in this work, the weight of new products accounted for 10% of world trade in 2007. Given that a strict criterion is being applied that takes into consideration new sectors, such as those emerging between 2004 and 2007, the importance of the phenomenon in the reference period is plain to see.
To round off the analysis, a third perspective is incorporated by product type (capital goods, primary inputs, processed inputs, and consumer goods), which captures a second fact: the fragmentation of production. It is interesting here to analyze processed inputs and, possibly, primary inputs among the new
F i g u r e 5
Source: Based on data from UNCOMTRADE.
SOPHISTICATION (2007) BY TYPE OF GOOD AND DYNAMICS (2000-2007)
Selected countries in Latin America
Lose Specialization Gain Specialization Permanent Advantage
ME
X
BR
A
AR
G
CO
L
CR
I
UR
Y
PE
R
ME
X
BR
A
AR
G
CO
L
CR
I
UR
Y
PE
R
ME
X
BR
A
AR
G
CO
L
CR
I
UR
Y
PE
R
ME
X
BR
A
AR
G
CO
L
CR
I
UR
Y
PE
R
Capital Goods Primary Inputs Processed Inputs Consumption Goods
80
70
60
50
40
30
20
10
0
@ journalNº 32 // Volume 15 // January-June 2011
Global Value Chains and Export Sophistication in Latin AmericaIn
stitute
for th
e In
tegra
tion o
f Latin
Am
eric
a a
nd th
e C
arib
bean (ID
B-IN
TA
L). A
ll rights re
serv
ed.
47
products being traded. Trade in primary inputs in the countries selected accounts for a significant percentage of the group of products in which the countries have recently gained specialization.
The final analysis was done by crossing the dynamic of the pattern of specialization (lose, gain, and maintain specialization with advantage) and the type of product, and the level of sophistication of each of these twelve subbaskets was evaluated.
In the case of products with advantage, China reaches levels of sophistication similar to the OECD average across all categories, followed by BRIC, and Latin America (whose performance is similar to the rest of the world). The order of levels of sophistication by product type is similar across all regions: capital goods, processed inputs, consumer goods, and, last, primary inputs.
The results show that product-country combinations acquire advantage by increasing levels of sophistication in relation to the group of products permanently exported with advantage. This can be seen in both world trade and the different regions analyzed.
Significant heterogeneity among the Latin American cases selected is seen when we look at the sophistication of the subbasket of products exported with permanent advantage. This order confirms the above order at the global level.
However, the products in which specialization is acquired have a similar level of sophistication across clusters of countries in all types of goods, and the same is seen across the Latin American countries. This implies that the difference in sophistication between new and permanent products will have exactly the opposite order to levels of sophistication by region and type of good. Latin America is the region with the lowest sophistication, but where new products with advantage are more differentiated from the traditional pattern. The countries that stand out most for their levels of sophistication in goods that gain specialization are Peru, Uruguay, Costa Rica, and Colombia. In other words, there is evidence in the margin that these countries are participating in a recent modernization of their export baskets, particularly where intermediate processed goods are concerned.u
REFERENCES
BALDWIN, R. 2006a. “Globalization: The Great Unbundling(s). Paper prepared for the Secretariat of the Economic
Council under the EU Presidency of Finland.
-----. 2006b. “Offshoring and Globalisation: What is New about the New Paradigm?” Mimeo. Geneva:
Graduate Institute.
CATTANEO, O., G. GEREFFI, & C. STARITZ. 2010. Global Value Chains in a Postcrisis World. Washington, DC: The
World Bank.
FLORES, M. & M. VAILLANT. 2011. “Cadenas globales de valor y sofisticación de la canasta de exportación en
América Latina”. Documento de Trabajo del Departamento de Economía - UdelaR, 7. Montevideo.
HAUSMANN, R., J. HWANG & D. RODRIK. 2007. “What you exports Matters”, Journal of Economic Growth, 12(1),
pp, 1-25.
HAUSMANN, R. & C. HIDALGO. 2009. “The Building Blocks of Economic Complexity”, PNAS, 106(26), pp 10575-10575.
HIDALGO, C. A., B. KLINGER, A. L. BARABÁSI & R. HAUSMANN. 2007. “The Product Space Conditions the Development
of Nations”, Science, 317(5837), pp, 482-487.
HIRSCHMAN, A. 1958. The Strategy of Economic Development. New Haven, Conn.: Yale Press.
KRUGMAN, P. 1988. “La nueva teoría del comercio internacional y los países menos desarrollados”, El Trimestre Económico, LV(217). January-March.

Manuel Flores and Marcel VaillantIn
stit
ute
for
the I
nte
gra
tion o
f Lati
n A
meri
ca a
nd t
he C
ari
bbean (
IDB-I
NTA
L).
All
rig
hts
rese
rved.
48
A n n e x F i g u r e
Source: Based on trade data from UNCOMTRADE.
EXPORT SOPHISTICATION - REFLEX METHOD (KC,18
)
2000 – 2007
JPN JPN JPN JPN JPN JPN JPN JPNCHE CHE CHE CHE CHE CHE CHE CHEDEU DEU DEU DEU DEU DEU DEU DEUSWE SWE SWE
SWESWE
SWE SWE
SWEFIN FIN FINFIN
FINFIN FIN FINGBR GBR GBR
GBR
GBR
GBRGBR
GBR
USA USA USA USAUSA
USA
USA
USA
AUTAUT
AUT
AUT AUT
AUT AUTAUT
MSR
MSR
MSRMSR
MSR
MSR
MSR
MSR
SGPSGP
SGP
SGP
SGP
SGPSGP
SGP
TWN
TWNTWN
TWNTWN
TWN TWN
TWNFRA
FRA FRAFRA FRA FRA FRA
FRAKOR
KOR KOR
KOR
KORKOR KOR
KOR
BLX
BLX
BLXBLX
BLXBLX BLX
BLX
CZE
CZECZE
CZECZE
CZE
CZE
CZE
IRL IRL IRLIRL
IRL
IRL
IRL
IRL
RUS
RUS
RUSRUS
RUS
RUS RUS RUS
NLD NLDNLD
NLD
NLDNLD NLD NLDCAN
CAN
CAN CAN
CAN
CAN
CAN
CAN
NOR
NOR
NOR
NOR NOR
NOR
NOR
NOR
SVN
SVNSVN
SVN
SVNSVN SVN
SVN
ITA
ITA ITAITA
ITA ITAITA
ITA
ARM
ARM
ARM
ARM
ARM
ARM
ARM
ARM
ISR
ISR
ISR
ISR
ISR ISR
ISRISR
DNK
DNK
DNK
DNKDNK
DNK
DNK
DNK
UKRUKR
UKR
UKR
UKRUKR UKR
UKR
HKG
HKG
HKG HKG
HKG HKG HKGHKG
ESP
ESP
ESP
ESP ESP ESP ESP
ESPHUNHUN
HUNHUN
HUN
HUN
HUNHUN
SVK
SVKSVK
SVKSVK
SVK
SVK
SVK
BHS
BHS
BHS
BHSBHS
BHS
BHS
BHS
MEX
MEX
MEX
MEX
MEX
MEX
MEX
MEX
MYS
MYS
MYS MYS
MYSMYS
MYS
MYS
BRA
BRA
BRA
BRA
BRA BRA
BRA
BRA
CHN
CHN
CHN
CHN
CHN
CHN
CHNCHN
SAU
SAU
SAU
SAU
SAU
SAUSAU
SAU
MLTMLT
MLT
MLT
MLT
MLT
MLT MLT
POL
POL POLPOL POL
POL
POL
POL
BLR
BLR
BLR
BLRBLR
BLR
BLRBLR
CPV
CPV
CPVCPV
CPV
CPV
CPV
CPV
MYT MYT
MYT
MYT
MYT
MYT
MYT
MYT
GEO
GEO
GEO
GEO
GEO
GEO
GEO
GEO
INDIND
IND
INDIND
IND
IND
IND
JOR
JOR
JOR
JOR
JOR JOR
JOR
JOR
NZL
NZL
NZL
NZL
NZL
NZL
NZLNZL
ZAFZAF
ZAFZAF
ZAF
ZAFZAF
ZAF
ARG
ARG
ARG
ARG
ARG
ARG
ARG
ARG
EST
ESTEST
ESTEST
EST
EST
EST
HRV
HRVHRV
HRVHRV
HRVHRV
HRV
LVA
LVA
LVA LVA
LVA
LVA
LVA
LVA
AUS
AUS
AUSAUS
AUSAUS
AUS
AUS
LTU
LTU
LTULTU
LTU
LTU LTU
LTU
ROMROM
ROM
ROM ROM
ROM
ROM
ROM
BRB
BRB
BRB
BRB
BRB
BRB
BRB
BRB
PYF
PYF
PYF
PYF
PYF
PYF
PYF
PYF
THA
THA
THA
THA
THATHA
THA
THA
KAZKAZ
KAZ
KAZKAZ
KAZ
KAZ
KAZ
PRT
PRT
PRTPRT PRT
PRT PRT
PRT
BGR
BGR
BGR
BGRBGR
BGR BGR
BGR
ISL
ISL
ISL ISL
ISL
ISL
ISL
ISL
TUR
TURTUR
TURTUR
TUR
TUR
TUR
AZEAZE
AZEAZE
AZEAZE
AZE
AZE
CHL
CHL
CHL
CHL
CHL
CHL CHL
CHL
COL COL
COL
COL COL
COL
COL
COL
GRC
GRC
GRC GRC
GRC GRCGRC
GRC
URY
URY
URY
URY
URY URY
URY
URY
IDN
IDN
IDN
IDN
IDN
IDN
IDN
IDN
MKD MKD
MKD MKD
MKD MKD
MKD
MKD
CYPCYP
CYP CYP
CYP
CYP CYP
CYP
KGZ
KGZKGZ
KGZ
KGZ
KGZ
KGZ
KGZ
PHL
PHL
PHL
PHL
PHL
PHLPHL
PHL
BHR
BHR
BHR
BHR
BHR
BHR
BHR
BHR
MDAMDA MDA
MDA
MDA
MDA
MDA
MDA
DZA
DZA
DZA DZA
DZA
DZA
DZA
DZA
KNA
KNA
KNA
KNA
KNA
KNA
KNAKNA
CRI
CRI
CRI
CRI
CRI
CRI
CRI
CRI
EGY
EGY
EGY
EGY
EGY
EGY
EGY
EGY
SLV
SLV
SLVSLV
SLV
SLVSLV
SLV
COM
COM
COM
COM
COM
COM
COM
COM
SWZ SWZ
SWZ SWZSWZ
SWZ
SWZ SWZ
TTO
TTO
TTO
TTO
TTOTTO
TTO
TTO
BWA
BWA
BWA
BWABWA
BWA
BWA
BWA
OMN
OMN
OMN OMN
OMN
OMN
OMN
OMN
TUN
TUN TUN
TUN
TUN
TUNTUN
TUN
GTM
GTM
GTM
GTM
GTM
GTM
GTMGTM
NCL
NCLNCL
NCL
NCL
NCL
NCL
NCL
ALB
ALB
ALB
ALB
ALB
ALB
ALB
ALB
QAT
QAT
QAT
QAT
QAT
QAT
QAT
QATKEN
KEN
KENKEN KEN
KENKEN
KEN
MUS
MUS MUS
MUS
MUSMUS
MUS
MUS
SEN
SENSEN
SENSEN
SEN
SEN
SEN
BOL
BOLBOL BOL
BOL
BOL
BOL
BOL
NAM
NAM
NAMNAM
NAM
NAM
NAM
NAMPER
PER
PER
PER
PER PER
PER
PER
GRL
GRL
GRL
GRL
GRL
GRL
GRL
GRL
JAM
JAM
JAM
JAM
JAM JAM
JAM
JAM
MAR
MAR
MAR
MARMAR
MAR
MAR
MAR
ZMB
ZMB
ZMB ZMB
ZMB
ZMB
ZMB
ZMBPRY
PRYPRY
PRY
PRY
PRY
PRY
PRY
PAN
PAN
PAN
PAN
PAN
PANPAN
PAN
CIV
CIV CIV
CIV
CIV
CIV
CIVCIV
MDG
MDG
MDG
MDG
MDG
MDG
MDGMDG
GMB
GMB GMB
GMB
GMB
GMBGMB
GMB
NIC
NIC
NIC
NIC
NIC
NIC
NIC
NIC
HND
HND
HNDHND
HND
HND HND
HND
MLI
MLI
MLI
MLI
MLI
MLI
MLI MLI
MNG
MNG
MNG
MNG
MNG
MNGMNG
MNG
NER
NER
NER
NER NER
NER
NER NER
DMA
DMA DMA
DMADMA
DMA
DMA
DMA
ECU
ECU
ECU
ECU
ECU
ECU
ECU
ECU
MOZ
MOZ
MOZ
MOZ
MOZ
MOZ
MOZ
MOZ
MWIMWI
MWIMWI
MWI
MWI
MWI
MWI
SYC
SYC
SYC
SYC
SYC
SYC
SYC
SYC
UGA
UGAUGA
UGA
UGA UGAUGA
UGA
TZA TZA
TZATZA
TZA
TZATZA
TZA
BLZ
BLZBLZ
BLZ
BLZ
BLZ BLZ
BLZ
GUY
GUY
GUYGUY
GUY
GUY
GUY
GUY
STP
STP
STP
STP
STP
STP
STP
STP
BDI
BDI
BDI
BDI
BDI
BDI
BDI
BDI
MDV
MDV MDV MDV
MDV
MDV
MDVMDV
ETH
ETHETH
ETH
ETHETH ETH
ETH
2000 2001 2002 2003 2004 2005 2006 2007