global wheat outlook
TRANSCRIPT

Global Wheat
Outlook
February 2014
1

3
Feeding The World
Population By 2050
9.6 Billion
WHEAT FEEDS THE WORLD
Planning and investment
in global agriculture
has become
critically
important The rate of technology
development and adoption
continues to accelerate Food Price Index, FAO 2014.
Food Prices are Trending Upward
0
50
100
150
200
'61 '65 '70 '75 '80 '85 '90 '95 '00 '05 '10 '14
Deflated Price Index Index (2002-2004=100) An extra
billion
tonnes of
cereals will
be needed
by 2030 FAO, 2002. World agriculture 2030:
Main findings
The caloric needs of the planet
are expected to soar by 50% in
the next 40 years Feeding The World
Population By 2050
9.6 Billion

4
Presentation Outline 4
Global Wheat Outlook
Wheat Market Attractiveness
Technology Developments for Wheat
Value Capture Challenges & Opportunities

5 5
GLOBAL WHEAT OUTLOOK
“WHEAT – MEETING
THE DEMANDS”

6
Sub-Saharan Africa is cause for serious concern, because the number of
chronically undernourished people will only decrease from 194 to 183 million.
An extra
billion
tonnes of
cereals will
be needed
by 2030
FAO, 2002. World agriculture 2030:
Main findings
Cereals prices have
risen by an average of
6% per year since 2000
2014 2000
FAO Cereals Price Index
1 in 8 people in the world
(868 million) are undernourished
The world needs wheat

7 World cereal markets expected to stay tight amid rising
production
0
100
200
300
400
500
600
1800
1900
2000
2100
2200
2300
2400
2500
Mill
ion T
onnes
Mill
ion T
onnes
Stocks (right axis) Production (left axis) Utilization (left axis)
Source: FAO “World Food Situation”, Jun. 2014
8
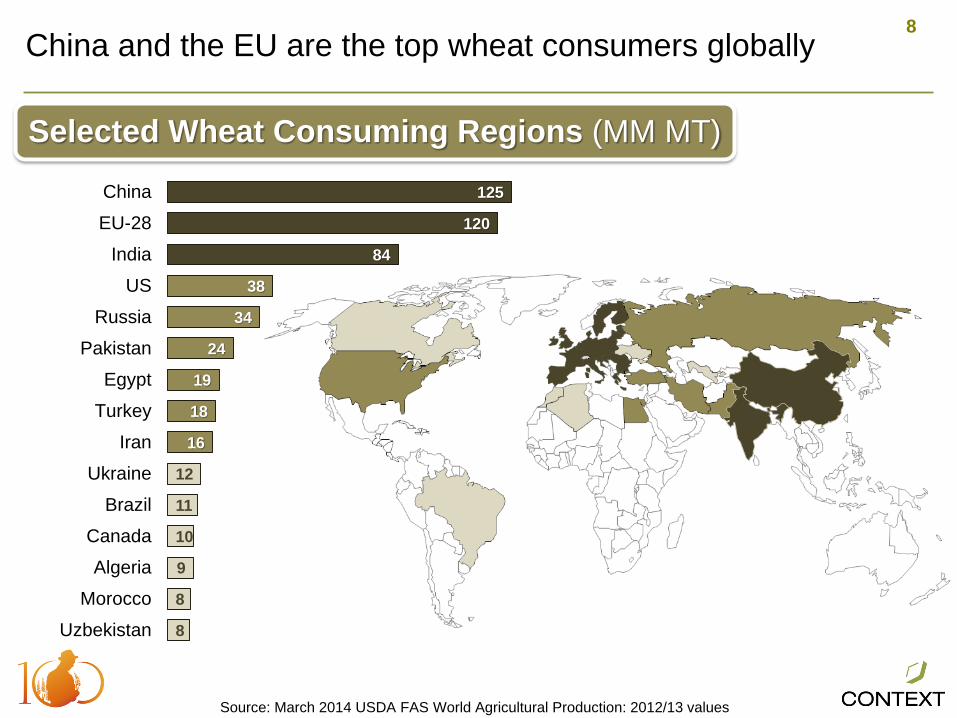
China and the EU are the top wheat consumers globally
Selected Wheat Consuming Regions (MM MT)
Source: March 2014 USDA FAS World Agricultural Production: 2012/13 values
125
120
84
38
34
24
19
18
16
12
11
10
9
8
8
China
EU-28
India
US
Russia
Pakistan
Egypt
Turkey
Iran
Ukraine
Brazil
Canada
Algeria
Morocco
Uzbekistan
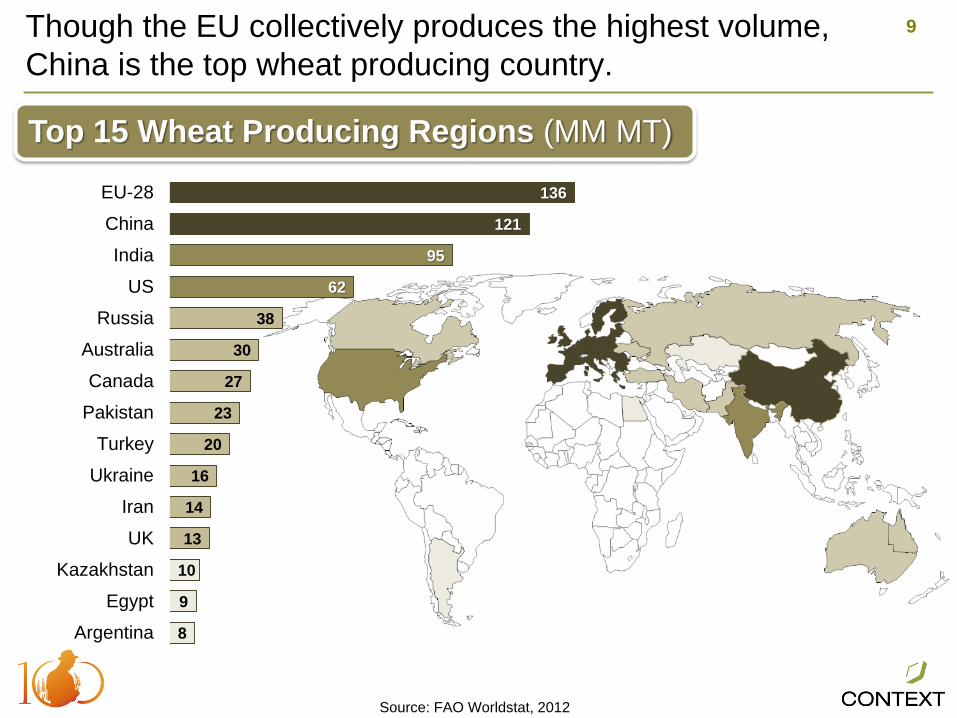
9 Though the EU collectively produces the highest volume,
China is the top wheat producing country.
Top 15 Wheat Producing Regions (MM MT)
Source: FAO Worldstat, 2012
8
9
10
13
14
16
20
23
27
30
38
62
95
121
136
Argentina
Egypt
Kazakhstan
UK
Iran
Ukraine
Turkey
Pakistan
Canada
Australia
Russia
US
India
China
EU-28

11 11
GLOBAL WHEAT OUTLOOK
“ATTRACTIVE
COMMERCIAL WHEAT
MARKETS”

12
Regions were divided into categories of attractiveness
Attractiveness
Indicators:
Productivity
Commercial Support
Technology Adoption
>100,000
>50,000 <100,000
>10,000 <50,000
>1,000 <10,000
<1,000
1,000 Metric Tons
Source: USDA FAS 2014 Estimates
Production Volume

13
Portions of North and South America are highly attractive
North America
South America
Argentina
Productivity
Yield/ha
Technology
Adoption
Commercial
Support
US
Multinational Support
Potential Growth with technology
Argentina
Productivity trending up
>100,000
>50,000 <100,000
>10,000 <50,000
>1,000 <10,000
<1,000
1000 Metric Tons
United States

14
Productivity
Yield/ha
Technology
Adoption
Commercial
Support
Europe and Russia are both high producers
Europe
Former Soviet
Union
EU
Multinational Support
High productivity
Subsidies
Russia
High growth potential
>100,000
>50,000 <100,000
>10,000 <50,000
>1,000 <10,000
<1,000
1000 Metric Tons Russia
Europe: UK, France,
Germany,
Switzerland

15
Productivity
Yield/ha
Technology
Adoption
Commercial
Support
India and China should be attractive markets in the longer-
term
East Asia
Both are growing to meet
populations’ needs
Technology adoption could follow
success in cotton
India
China
Africa
Africa /
Southwest Asia
>100,000
>50,000 <100,000
>10,000 <50,000
>1,000 <10,000
<1,000
1000 Metric Tons

16 16
GLOBAL WHEAT OUTLOOK
“TECHNOLOGY
DEVELOPMENT IN
WHEAT”

17 Technological advancements could pave the way for
continuous improvement
Technology
Possibilities
Hybrids
MAB
Yield +
Stress
Traits
Input
Traits
CP
Enhance-
ments

18 Collaborations will lead to enhanced breeding and
technology development
Acquisitions
Wheat Breeding,
Yield , Drought Tolerance, NUE
Drought Tolerance
Various Crop Improvements
Exchange of Germplasm & Tech.
Water Efficiency, &
JV to develop wheat technologie
Ukrainian breeding Co.’s
SORT and EUROSORT.
Collaborations
2010
Selected
Collaboration
Announcements
2013
Selected
Collaboration
Announcements
Collaborations
Wheat Breeding: Environmental Stress
Hybrid Wheat Research
Drought Tolerant Tech. in Wheat Frontier Agri-
Science Inc.
Increase Productivity
General Crop Improvements
Heat Tolerant Wheat Varieties (2012)
Develop New Wheat Varieties

19
2013 2014 2015 2016 2017 2018 2019 Later
Commercialization Date
Source: Annual Organizational Reports via company websites
19
Technology Development Highlights
R&D Company Trait
Monsanto Herbicide Tolerance
Monsanto Enhanced Yield + Stress Tol.
Monsanto + BASF Enhanced Yield + Stress Tol.
BASF + MPBCRC Fusarium & Drought Tol.
Arcadia BioSciences + Mahyco WUE, NUE and Salt Tolerance
Arcadia BioSciences + Vilmorin WUE and NUE
Arcadia BioSciences + Targeted Growth Herbicide Tolerance
Arcadia BioSciences + CSIRO Increased Yield and NUE
CSIRO Drought Tol. and Virus Res.
Syngenta Fusarium Resistance
Syngenta (deVGen) Insect Resistance
DuPont Pioneer Hi-Bred Increase Yield, & Fungal Res
Several technologies are being developed in wheat
over the next decade

20
Continuous investment in crop protection products in cereals,
along with a push into plant health, will create / provide a huge
opportunity for growth in wheat value.
CP Technology
Over 20 new compounds / combinations
entered the Cereals Market from 2010 to 2013
Crop protection products continue to be developed for the
Cereals market
AI Co. Class Launch
Bixafen Bayer Fungicide 2011
Fluxapyroxad BASF Fungicide 2012
Sulfoxaflor DAS Insecticide 2013
Examples Only

21 21
GLOBAL WHEAT OUTLOOK
“HOW VALUE WILL BE
CAPTURED”

22
Companies are spending money on R&D
Overall Seed & Traits
R&D Trend
Wheat Seed & Traits
R&D Trend
23
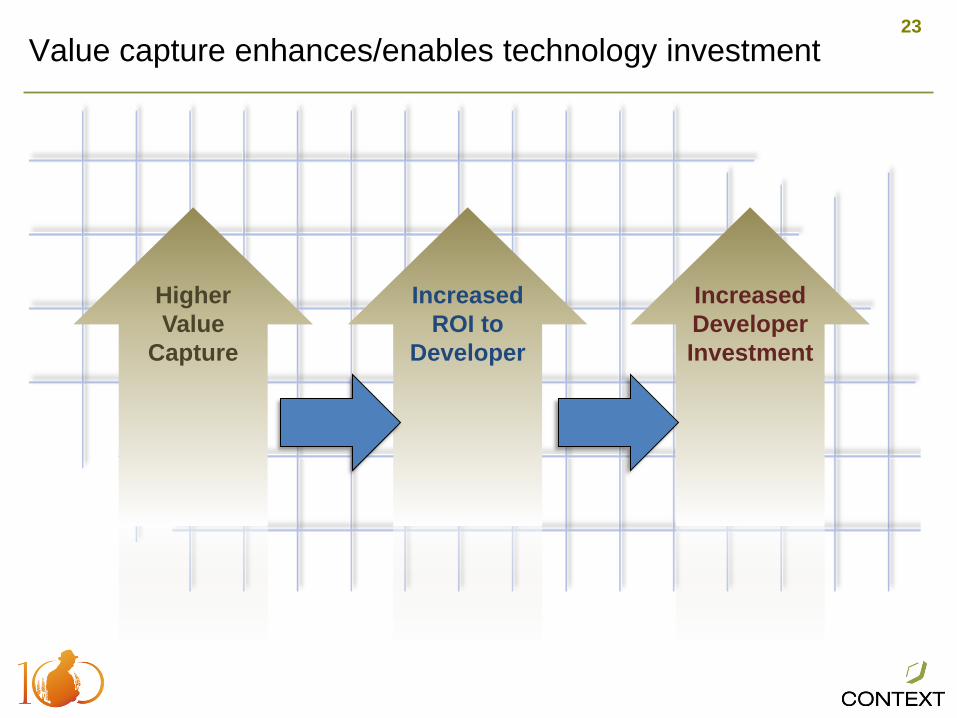
Value capture enhances/enables technology investment
Higher
Value
Capture
Increased
ROI to
Developer
Increased
Developer
Investment

24
Little value is captured in wheat seed
In several major wheat producing countries less than
5% of wheat seed is proprietary.
Source: GfK Global Seed Market Database
0% to 5%
6% to 20%
21% to 35%
36% to 50%
51% to 100%

25
How do the mechanisms prevent
saved seed and enhance value
capture?
• Provide a specific mechanism
to prevent saved seed OR pay
for technology improvement
• Incentive for grower to buy
new seed
• Patent and license protection
Any likely value capture mechanisms will likely revolve
around hybrid seed, new traits and/or new systems
Value Capture
Mechanisms
Hybrid Seed
New Systems
Traits

26
SUMMARY
1. Wheat acreage AND value will trend up
2. Not all markets are equally attractive
3. Advanced wheat technologies are being developed
1.Value capture systems are essential to
achieving the full potential of Wheat as a crop
Value ≥ Volume

27
WHEAT FEEDS THE WORLD
– bringing productivity to new places
– initiating where nothing was
– improving what is in place to provide better
– building infrastructure to make the most out of the crop
– employing the best tools and tactics of manual labor to and through precision technologies
27
It all
comes
down to
productivity.

28
For Further
Information,
Please Contact:
THE CONTEXT NETWORK
4601 Westown Pkwy, Suite 220
West Des Moines, IA 50266
Phone: 515/225-2204
Fax: 515/225-0039
www.contextnet.com
Tray Thomas: 515-988-6601
Context Multi-Client Reports
THANK YOU