globalization, country risks, and trade in tourism
TRANSCRIPT

sustainability
Article
Globalization, Country Risks, and Trade in TourismServices: Evidence from China
Wenwen Zhang and Yi-Bin Chiu *
School of Business Administration, Southwestern University of Finance and Economics, Chengdu 611130, China;[email protected]* Correspondence: [email protected]
Received: 20 June 2020; Accepted: 19 July 2020; Published: 21 July 2020�����������������
Abstract: This study applies the autoregressive distributed lag (ARDL) model to examine the impactsof globalization and country risks on China’s tourism service trade over the period 1984–2015.The results reveal that in the long run, globalization has a significant negative impact on tourismservice exports and tourism service trade balances, while a significant positive impact on tourismservice imports. In the short run, globalization has a significant negative impact on tourism serviceimports, while a significant positive impact on tourism service exports and trade balances. Countrystability could roughly mitigate these negative and positive impacts of globalization on tourismservice trade in both the short and long run. Moreover, the speed of adjustment from the short run tolong run equilibrium path is relatively fast. These results are important for China’s policy makerswhen formulating a strategy for the development of tourism service trade.
Keywords: globalization; country risks; tourism service trade; ARDL
1. Introduction
Tourism has become one of the most important industries in the world and its economic impactsare vital for many countries [1,2]. Generally, the development of tourism is considered to positivelycontribute to economic growth [3,4]. In fact, the World Travel and Tourism Council predicts that thedirect contribution of tourism to GDP will maintain an annual growth rate of 3.8% over the next decade.
International tourism constitutes one of the most significant global trade flows [5] as an increasein international tourism can lead to greater international trade in terms of import demand for foreigngoods and services as well as an increase in earnings through exports [6]. In recent years, tourism hasbeen the most important sector in the service trade, accounting for about 25% of total internationaltrade in services and ranking first in the world. China’s trade scale and status in the internationaltourism market have been remarkable in recent years. The tourism service trade accounts for a highproportion of China’s service trade (25.3% in 2008 and 35.1% in 2015), representing an important sourceof the country’s service trade income [7]. Before 2008, China’s tourism service trade, as one of thetrades in service that exhibits a surplus in China, partly offset its trade deficit for many years, playingan important role in increasing foreign exchange income and balancing international payments [8].However, China entered a deficit period of tourism foreign exchange income in 2009 and this deficithas continued to grow [7]. According to the Yearbook of China Tourism Statistics, the deficit in 2014grew to US$113.6 billion, accounting for 57.7% of the service trade deficit. The tourism trade deficit hassomewhat alleviated relations between China and other countries, but a long-term deficit will harmthe interests of the country [8].
Globalization is a comprehensive political, economic, and social phenomenon [9,10] and isconsidered a determining factor that affects the growth of the tourism industry [11,12]. It is wellrecognized that globalization could provide favorable opportunities for the development of international
Sustainability 2020, 12, 5869; doi:10.3390/su12145869 www.mdpi.com/journal/sustainability

Sustainability 2020, 12, 5869 2 of 24
tourism by motivating more international integration of society and economy [13–15]. Jin et al. [16]claim that tourism development in destinations could be assisted by way of political, social, and culturalexchanges between the generating and destination countries. Economic globalization could decreasebarriers that impede the international flow of tourism goods and services. Political globalizationcould enhance the connections between countries and increase liberalization of the tourism servicetrade. Trade liberalization has allowed new technologies to be exploited in globalized markets ona worldwide scale [5]. With the development of transportation and information technology, socialglobalization could decrease the tourists’ search cost and make it more feasible and convenient totravel internationally.
Every coin has two sides. Globalization will stimulate competitiveness and create a more complexenvironment for the tourism industry by facilitating market entry of several stakeholders [13], and couldbring some negative effects. Globalization may exacerbate the uneven development of tourism amongcountries and make developing countries more dependent on developed countries [12]. Some studiesalso point out that in the context of globalization, the rapid development of international tourismmay bring about environmental degradation [17,18]. As tourism activities increase, tourism servicesconsumed by international visitors, such as transportation, accommodation, catering, entertainment,and so on, will induce more energy consumption and more pollution, e.g., air and surface waterpollution, noise pollution, and soil pollution, etc. However, it should be noted that a skillful touristmanagement that aimed at serving tourists does not affect natural values and that tourism in thenaturally values areas has recently become more and more popular [19].
The country risks, which refer to the external environment uncertainties, also influence passengers’decision-making. Ever since the 911 terrorist attacks in 2001, risks have become an increasinglyimportant consideration when choosing travel destinations. If the perceived level of risk for visitors istoo high, then they will avoid international travel [16,20,21] or travel to those countries with lowerrisks [22]. Especially in the context of globalization, the tourism service trade becomes more sensitiveto country risks [11,23]. One typical example is how the global spread of the Novel Coronavirus(COVID-19) has heavily affected international travel and tourism service demand [24,25]. The WorldTourism Organization [26] estimates that the outbreak of COVID-19 could lead to a 20–30% drop ininternational tourist arrivals compared to 2019. In China alone, the downfall of international touristarrivals is as much as 10.9% [27]. Some studies propose that COVID-19 will trigger the transformationof the tourism industry on a global scale [28–30], indicating the important role that country risks playin tourism trade under globalization.
The contributions and purposes of this study are as follows. First, existing studies have seldomincorporated globalization into an empirical analysis of tourism’s impacts. To the best of our knowledge,no empirical study has paid attention to the impacts of globalization on tourism service trade, includingfor China. As Hjalager [31] notes, it is worth conceptualizing globalization further from differentmanifestations and to carry out empirical studies of its impacts on tourism service trade. Therefore,our study incorporates globalization into the empirical analysis framework and analyzes the impactsof globalization on China’s tourism service trade.
Second, most of the existing literature has only explored the effects of a certain manifestationof globalization on tourism development by using a single indicator, which cannot provide acomprehensive analysis. To fill this gap, our study adopts multifaceted globalization indices, i.e.,an overall index of globalization as well as sub-indices (i.e., economic, social, and political globalization),which enables us to identify which globalization index plays a more important role in China’s tourismservice trade.
Third, country risks have not been taken seriously in the literature of tourism service trade andtherefore, this study considers the impacts of country risks when analyzing the relationship betweenglobalization and China’s tourism service trade. Moreover, as the indicators adopted by existingliterature did not measure country risks well, in order to improve the situation, we adopted the political

Sustainability 2020, 12, 5869 3 of 24
risk index and composite risk index retrieved from the International Country Risk Guide (ICRG) tomeasure country risks comprehensively.
The rest of the paper is organized as follows. Section 2 briefly reviews the relevant literature.Section 3 discusses the econometric methods. Sections 4 and 5 presents the data specification and theempirical results, respectively. Section 6 outlines the conclusions and some implications.
2. Literature Review
The existing studies have analyzed many determinants of tourism service trade and concludethat history, economy, politics, socio-culture, and attractiveness of a destination are important factorsthat affect tourism service trade [32–35]. Similarly, studies about China’s tourism service trade alsoconceptually mention these influencing factors [7,8,36].
Globalization may also be an important factor influencing tourism service trade, and regionalismis a representative opposite factor against globalization. Regionalism is leading to the establishmentof discrete and increasingly powerful groups of countries that may form regional protectionbastions against certain forces of globalization, while globalization is removing economic barriersbetween countries [37]. By studying the case of Bhutan, Nyaupane and Timothy [38] propose thattourists could be treated unequally under regionalism. Henderson [39] uses the example of theIndonesia–Malaysia–Singapore Growth Triangle and concludes that the impact of regionalism ontourism development remains uncertain. Dredge and Jenkins [40] found that through regionalism, somecountries aim to establish strong and attractive tourism destination identities in order to counterbalancethe homogenizing influences of globalization.
As for globalization, it has still not been discussed widely in tourism research. Early studiesonly considered certain manifestations, with exploring the impact of international hotel chains [41,42],commodity chains [43], and airlines [44] on tourism development. Hjalager [31] distinguishes fourstages and different manifestations of the tourism industry’s globalization and shows that it isundergoing an irrevocable process like many other business systems. Some studies examine theeconomic impacts of tourism within the macroeconomic context of globalization in the form ofincreasing trade liberalization [5,45]. Sugiyarto, Blake, and Sinclair [45] use a computable generalequilibrium model of the Indonesian economy and find that tourism growth expands the positiveeffects of globalization and reduces its adverse effects, such as increasing production, improvingwelfare, and reducing the adverse effects on government deficits and trade balances. On the otherhand, some studies address the important effects of globalization in the context of tourism, includingeconomic development (economic globalization), institutional development, the spread of technicalknowledge, the development of new markets and products, environmental and sociocultural changes(social globalization), etc. [13–15,46]. The finding of Hidayati [1] supports the notion of the positiveeffect of globalization regarding the economic growth contribution of tourism. However, Ivanovand Webster [10] find that there is no correlation between globalization and the average per capitaeconomic growth contribution of tourism. Furthermore, by using a sample of 133 countries, Javid andKatircioglu [23] found that economic, social, and political globalization exert a significantly positiveimpact on tourist arrivals, tourism receipts, and tourism expenditures.
Throughout the tourism-related research, country risks have not been taken seriously, yet theresearch conducted by Sequeira and Nunes [47] is more prominent. The results of Sequeira andNunes [47] suggest that country risks are an important determinant of a country’s tourism developmentand policy makers should be aware of the important role of country risks in tourism. Through a casestudy of the evolution of tourism in the Maldives, Scheyvens [48] proposes that issues of power andpolitics are crucial to the sustainable development of tourism. Eilat and Einav [49] show a negativecorrelation between political risks and bilateral visitor flows. Yap and Saha [50] argue that politicalstability plays an important role in determining destination choices for tourists and discuss politicalinstability as well as the impact of terrorism and corruption on tourism development. Joshi et al. [51]point out that international tourism income is more sensitive to favorable tourism laws and regulations,
Sustainability 2020, 12, 5869 4 of 24
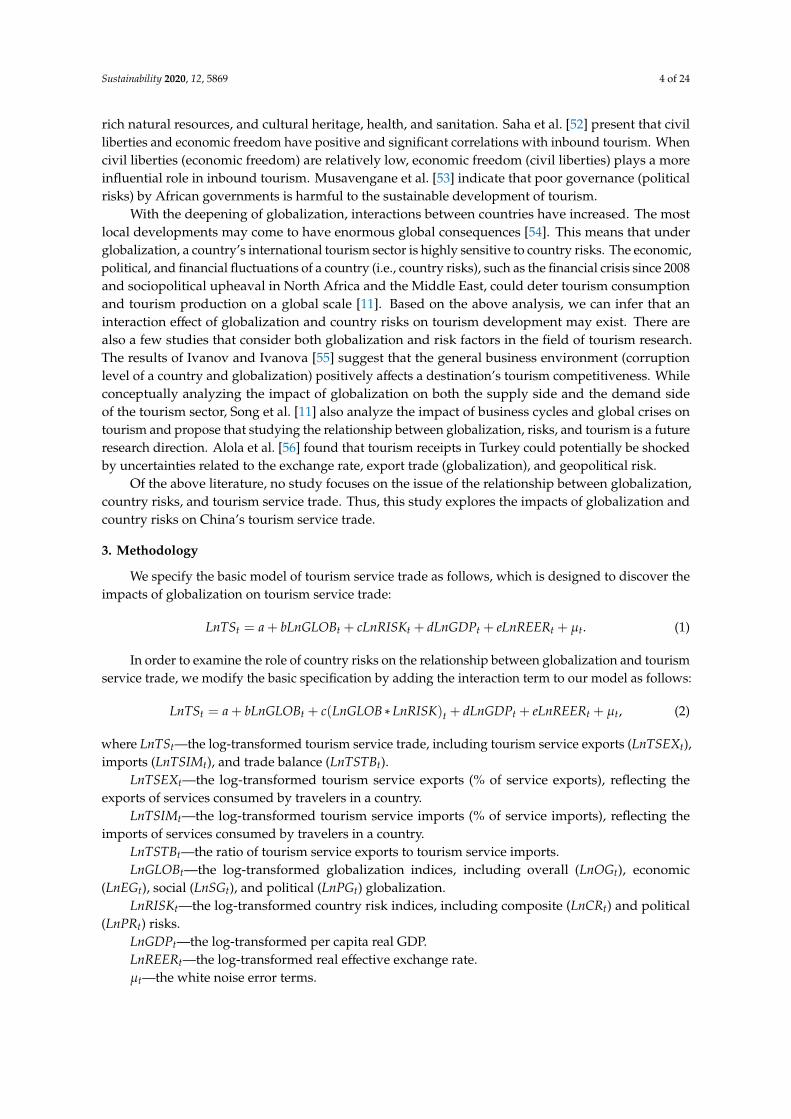
rich natural resources, and cultural heritage, health, and sanitation. Saha et al. [52] present that civilliberties and economic freedom have positive and significant correlations with inbound tourism. Whencivil liberties (economic freedom) are relatively low, economic freedom (civil liberties) plays a moreinfluential role in inbound tourism. Musavengane et al. [53] indicate that poor governance (politicalrisks) by African governments is harmful to the sustainable development of tourism.
With the deepening of globalization, interactions between countries have increased. The mostlocal developments may come to have enormous global consequences [54]. This means that underglobalization, a country’s international tourism sector is highly sensitive to country risks. The economic,political, and financial fluctuations of a country (i.e., country risks), such as the financial crisis since 2008and sociopolitical upheaval in North Africa and the Middle East, could deter tourism consumptionand tourism production on a global scale [11]. Based on the above analysis, we can infer that aninteraction effect of globalization and country risks on tourism development may exist. There arealso a few studies that consider both globalization and risk factors in the field of tourism research.The results of Ivanov and Ivanova [55] suggest that the general business environment (corruptionlevel of a country and globalization) positively affects a destination’s tourism competitiveness. Whileconceptually analyzing the impact of globalization on both the supply side and the demand sideof the tourism sector, Song et al. [11] also analyze the impact of business cycles and global crises ontourism and propose that studying the relationship between globalization, risks, and tourism is a futureresearch direction. Alola et al. [56] found that tourism receipts in Turkey could potentially be shockedby uncertainties related to the exchange rate, export trade (globalization), and geopolitical risk.
Of the above literature, no study focuses on the issue of the relationship between globalization,country risks, and tourism service trade. Thus, this study explores the impacts of globalization andcountry risks on China’s tourism service trade.
3. Methodology
We specify the basic model of tourism service trade as follows, which is designed to discover theimpacts of globalization on tourism service trade:
LnTSt = a + bLnGLOBt + cLnRISKt + dLnGDPt + eLnREERt + µt. (1)
In order to examine the role of country risks on the relationship between globalization and tourismservice trade, we modify the basic specification by adding the interaction term to our model as follows:
LnTSt = a + bLnGLOBt + c(LnGLOB ∗ LnRISK)t + dLnGDPt + eLnREERt + µt, (2)
where LnTSt—the log-transformed tourism service trade, including tourism service exports (LnTSEXt),imports (LnTSIMt), and trade balance (LnTSTBt).
LnTSEXt—the log-transformed tourism service exports (% of service exports), reflecting theexports of services consumed by travelers in a country.
LnTSIMt—the log-transformed tourism service imports (% of service imports), reflecting theimports of services consumed by travelers in a country.
LnTSTBt—the ratio of tourism service exports to tourism service imports.LnGLOBt—the log-transformed globalization indices, including overall (LnOGt), economic
(LnEGt), social (LnSGt), and political (LnPGt) globalization.LnRISKt—the log-transformed country risk indices, including composite (LnCRt) and political
(LnPRt) risks.LnGDPt—the log-transformed per capita real GDP.LnREERt—the log-transformed real effective exchange rate.µt—the white noise error terms.

Sustainability 2020, 12, 5869 5 of 24
Based on the autoregressive distributed lag (ARDL) approach proposed by Pesaran et al. [57],we can reformulate the empirical model as the following Unrestricted Error Correction Model (UECM),containing long-term and short-term information.
DLnTSt = δ0 + δ1LnTSt−1 + δ2LnGLOBt−1 + δ3LnRISKt−1 + δ4LnGDPt−1
+δ5LnREERt−1 +m∑
i=1biDLnTSt−i +
m∑i=0
ciDLnGLOBt−i
+m∑
i=0diDLnRISKt−i +
m∑i=0
eiDLnGDPt−i +m∑
i=0fiDLnREERt−i + εt
, (3)
DLnTSt = δ0 + δ1LnTSt−1 + δ2LnGLOBt−1 + δ3(LnGLOB ∗ LnRISK)t−1
+δ4LnGDPt−1 + δ5LnREERt−1 +n∑
i=1biDLnTSt−i +
n∑i=0
ciDLnGLOBt−i
+n∑
i=0diD(LnGLOB ∗ LnRISK)t−i +
n∑i=0
eiDLnGDPt−i
+n∑
i=0fiDLnREERt−i + εt
, (4)
where D is the first difference operators.To examine whether tourism service trade and other independent variables are cointegrated,
this study applied a bounds test based on the F-statistics. We denote the F-statistic of the test,which we normalized on the dependent variables, by f (.). The null hypothesis of no cointegration(H0 : δ1 = δ2 = δ3 = δ4 = δ5 = 0) was tested against the alternative hypothesis of (H1 : δ1 , 0,δ2 , 0, δ3 , 0, δ4 , 0, δ5 , 0) by using the F-test. Pesaran et al. [57] tabulate two sets of new criticalvalues; one set assumes all variables are I(1), i.e., upper bound critical values and another one assumesall variables are I(0), i.e., lower bound critical values. If the calculated F-statistic becomes greaterthan the I(1), then the null of no cointegration is rejected, indicating that a longer-term relation exists.Contrarily, co-integration does not exist if the F-statistic is less than I(0). Thus, no decision can be madewhen the F-statistic is between I(0) and I(1).
We lastly obtained the short-run dynamic parameters by estimating an error correction modelassociated with the long-run estimates. The vector error correction model is specified as follows:
DLnTSt = a +m∑
i=1biDLnTSt−i +
m∑i=0
ciDLnGLOBt−i +m∑
i=0diDLnRISKt−i
+m∑
i=0eiDLnGDPt−i +
m∑i=0
fiDLnREERt−i + γECTt−1 +ωt
(5)
DLnTSt = a +n∑
i=1biDLnTSt−i +
n∑i=0
ciDLnGLOBt−i
+n∑
i=0diD(LnGLOB ∗ LnRISK)t−i +
n∑i=0
eiDLnGDPt−i
+n∑
i=0fiDLnREERt−i + γECTt−1 +ωt
(6)
where bi, ci, di, ei, and fi are the short-run dynamic coefficients of the model’s convergence toequilibrium and γ is the speed of adjustment.
4. Data Specification
This study uses annual time-series data covering the period from 1984 to 2015. We take the data fortourism service exports (TSEX), tourism service imports (TSIM), tourism service trade balance (TSTB),real GDP per capita (GDP, constant 2010 US$), and real effective exchange rate (REER, 2010 = 100)from the World Bank’s World Development Indicators (WDI) database.
The globalization indices are from the Konjunkturforschungsstelle (KOF) database of the SwissEconomic Institute, which is developed by Dreher [9] and updated in Dreher et al. [58]. The KOF

Sustainability 2020, 12, 5869 6 of 24
globalization index comprises an overall globalization index (OG) and three separate componentindices for economic (EG), social (SG), and political (PG) globalization. The overall globalization indexwas obtained by a weighted average of 36%, 37%, and 27% of the economic, social, and politicalglobalization indices, respectively. All globalization indices ranged from 0 to 100. Higher values ofindices denoted greater levels of globalization for the country.
We adopted the ICRG risk data constructed by the PRS Group. The ICRG risk indices denote acountry’s political stability, the ability to finance its official, commercial, and trade debt obligations,and its economic strengths and weaknesses on a comparable basis. We selected political risk index(PR) and composite risk index (CR) to measure country risks. Political risk index and composite riskindex both were scored from 0 to 100. A higher risk rating implied a lower country risk faced by thecountry. All variables were taken in natural logarithmic form.
Tables 1 and 2 report the descriptive statistics and correlations of the variables. Table 1 shows thaton average, the ratio of China’s tourism service exports to its service exports and the ratio of China’stourism service imports to its service imports were, respectively, 29.96% and 23.34% during the period1982–2015. On average, during this period, China seems to have little tourism service trade surplus.However, after 2009, China’s tourism service imports rapidly increase and its increasing speed is fasterthan tourism service exports (see Figure 1). This leads to a continuous and rapid expansion of tourismservice trade deficits. The tourism service trade deficits enlarge from US$4 billion in 2009 to US$205billion in 2015, which could be because the living standards and qualities of Chinese people improveas China’s economy grows, thus raising the demand for outbound tourism. According to Pearson’scorrelation in Table 2, globalization has significantly negative effects on tourism service exports andpositive effects on tourism service imports, suggesting that globalization has restricted the exports ofChina’s tourism service, while it has promoted its imports. Moreover, there is a significantly negativerelationship between globalization and tourism service trade balances.
Table 1. Descriptive statistics of variables in levels over the period 1984–2015.
Variable Obs Mean Std. Dev. Min Max
LnTSEX 32 3.40 0.28 2.98 3.90LnTSIM 32 3.15 0.51 1.66 4.05LnTSTB 32 0.25 0.70 −1.02 1.83LnOG 32 3.84 0.32 3.20 4.13LnEG 32 3.77 0.18 3.33 3.99LnSG 32 3.45 0.65 2.18 4.01LnPG 32 4.20 0.26 3.70 4.44LnCR 32 4.28 0.09 4.05 4.39LnPR 32 4.17 0.07 4.03 4.32
LnGDP 32 7.48 0.80 6.18 8.78LnREER 32 4.28 0.09 4.05 4.39
Notes: Std. Dev., Max., and Min. are the abbreviations for standard deviation, maximum, and minimum, respectively.All variables are in natural logarithms.
Sustainability 2020, 12, x FOR PEER REVIEW 7 of 26
grows, thus raising the demand for outbound tourism. According to Pearson’s correlation in Table 2, globalization has significantly negative effects on tourism service exports and positive effects on tourism service imports, suggesting that globalization has restricted the exports of China’s tourism service, while it has promoted its imports. Moreover, there is a significantly negative relationship between globalization and tourism service trade balances.
Figure 1. Travel service exports and travel service imports for China, 1984–2015.
Table 1. Descriptive statistics of variables in levels over the period 1984–2015.
Variable Obs Mean Std. Dev. Min Max LnTSEX 32 3.40 0.28 2.98 3.90 LnTSIM 32 3.15 0.51 1.66 4.05 LnTSTB 32 0.25 0.70 −1.02 1.83 LnOG 32 3.84 0.32 3.20 4.13 LnEG 32 3.77 0.18 3.33 3.99 LnSG 32 3.45 0.65 2.18 4.01 LnPG 32 4.20 0.26 3.70 4.44 LnCR 32 4.28 0.09 4.05 4.39 LnPR 32 4.17 0.07 4.03 4.32
LnGDP 32 7.48 0.80 6.18 8.78 LnREER 32 4.28 0.09 4.05 4.39
Notes: Std. Dev., Max., and Min. are the abbreviations for standard deviation, maximum, and minimum, respectively. All variables are in natural logarithms.
050
100
150
200
250
Billio
n U
S do
llars
1984
1985
198619
8719
8819
8919
9019
9119
9219
9319
9419
9519
9619
9719
9819
9920
0020
0120
0220
0320
0420
0520
0620
0720
0820
0920
1020
1120
1220
1320
1420
15
Year
Travel service exports Travel service imports
Figure 1. Travel service exports and travel service imports for China, 1984–2015.

Sustainability 2020, 12, 5869 7 of 24
Table 2. Pearson’s coefficients of the correlation matrix for variables.
LnTSEX LnTSIM LnTSTB LnOG LnEG LnSG LnPG LnGDP LnREER LnCR LnPR
LnTSEX 1.000
LnTSIM −0.533 ***(0.002) 1.000
LnTSTB 0.784 ***(0.000)
−0.943 ***(0.000) 1.000
LnOG −0.408 **(0.021)
0.828 ***(0.000)
−0.767 ***(0.000) 1.000
LnEG −0.342 *(0.056)
0.832 ***(0.0000)
−0.744 ***(0.000)
0.975 ***(0.000) 1.0000
LnSG −0.450 ***(0.0097)
0.822 ***(0.000)
−0.780 ***(0.000)
0.996 ***(0.000)
0.961 ***(0.000) 1.000
LnPG −0.343 *(0.055)
0.796 ***(0.000)
−0.719 ***(0.000)
0.986 ***(0.000)
0.950 ***(0.000)
0.975 ***(0.000) 1.000
LnGDP −0.405 **(0.021)
0.809 ***(0.000)
−0.753 ***(0.000)
0.912 ***(0.000)
0.882 ***(0.000)
0.900 ***(0.000)
0.891 ***(0.000) 1.000
LnREER −0.210(0.248)
−0.334 *(0.061)
0.163(0.373)
−0.484 ***(0.005)
−0.542 ***(0.001)
−0.466 ***(0.007)
−0.521 ***(0.002)
−0.191(0.294) 1.000
LnCR −0.197(0.280)
0.607 ***(0.000)
−0.522 ***(0.002)
0.747 ***(0.000)
0.696 ***(0.000)
0.735 ***(0.000)
0.758 ***(0.000)
0.657 ***(0.000)
−0.328 *(0.067) 1.000
LnPR 0.425 **(0.015)
−0.152(0.406)
0.278(0.123)
−0.020(0.915)
−0.028(0.881)
−0.040(0.829)
0.029(0.877)
−0.189(0.302)
−0.322 *(0.072)
0.550 ***(0.001) 1.000
Notes: P-values are in parentheses. ***, **, and * indicate the 1%, 5%, and 10% significance levels, respectively. All variables are in natural logarithms.

Sustainability 2020, 12, 5869 8 of 24
5. Empirical Results
5.1. Unit Root Test and ARDL Bounds Tests
In time-series analysis, the variables must be tested for stationarity before estimating therelationship between the variables. For this purpose, we adopted the ADF tests [59] and thePhillips-Perron test [60]. The results in Table 3 show that some variables are stationary in levels, I(0),while others are stationary in differences, I(1). This suggests that traditional cointegration technology,i.e., Johonsen’s cointegration approach [61] which asks that all variables should be I(1), would not besuitable. However, the ARDL approach does not require prior information on the time-series variables’orders of integration, i.e., irrespective of I(0) or I(1). Thus, we use the ARDL model herein. Accordingto the results of the bounds tests in Table 4, all F-statistics are greater than the critical value of I(1) atthe 10% significant level. Therefore, the conclusion is reached that a cointegrating relationship existsbetween the examined variables.
Table 3. ADF and PP unit root tests for variables.
VariablesADF Test PP Test
Model withConstant
Model with Constantand Trend
Model withConstant
Model with Constantand Trend
Variables in levelLnTSEX −2.11 (0) −2.47 (0) −2.21 −2.47LnTSIM −0.95 (3) −1.92 (3) −2.75 * −3.90 **LnTSTB −1.87 (0) −2.48 (1) −2.00 −2.70LnOG −2.47 (0) −0.89 (0) −3.26 ** −0.44LnEG −3.62 ** (3) −1.79 (3) −5.66 *** −2.76LnSG −2.07 (0) −1.03 (0) −2.49 −0.77LnPG −1.88 (0) −1.25 (0) −2.07 −1.23LnCR −1.82 (0) −2.50 (0) −1.76 −2.56LnPR −2.22 (0) −2.25 (0) −2.29 −2.31
LnGDP 0.38 (4) −4.69 *** (3) −0.05 −1.63LnREER −3.46 ** (0) −2.86 (0) −3.41 ** −3.98 **
Variables in differenceDLnTSEX −5.46 *** (0) −5.40 *** (0) −5.48 *** −5.41 ***DLnTSIM −5.10 *** (2) −4.96 *** (2) −9.72 *** −8.90 ***DLnTSTB −5.07 *** (0) −4.97 *** (0) −5.34 *** −5.23 ***DLnOG −4.92 *** (0) −6.20 *** (4) −4.92 *** −9.12 ***DLnEG −4.57 *** (1) −5.36 *** (2) −4.74 *** −6.76 ***DLnSG −5.26 *** (0) −4.72 *** (4) −5.26 *** −7.64 ***DLnPG −4.83 *** (0) −5.55 *** (4) −4.82 *** −5.92 ***DLnCR −4.12 *** (2) −4.14 ** (2) −8.10 *** −9.00 ***DLnPR −5.74 *** (0) −4.14 ** (2) −6.47 *** −7.22 ***
DLnGDP −3.58 ** (1) −3.45 * (1) −2.92 * −2.88DLnREER −4.30 *** (0) −5.04 *** (0) −4.22 *** −7.90 ***
Note: The lags of models are in parentheses. ***, **, and * indicate the 1%, 5%, and 10% significance levels, respectively.
5.2. Estimation of the ARDL Models
Table 5 presents the estimated results of tourism service export models for the long run. The resultsshow a long-run negative relationship between globalization (overall index as well as sub-indices)and tourism service exports. The coefficients of political risks are positive, indicating that a morestable political environment could facilitate the freedom of tourism trade between China and othercountries [13] and provide a safe travel condition for foreign tourists, which could further promotetourism service exports. Except for the model with economic globalization, the positive coefficients ofinteraction effects indicate that stable environments create conditions to mitigate the adverse impactsof globalization.
As for control variables, GDP has a positive impact on tourism service exports, which is consistentwith previous findings [62,63]. Moreover, higher real effective exchange rates lead to fewer tourismservice exports [64].

Sustainability 2020, 12, 5869 9 of 24
Tables 6 and 7 show the short-run results for tourism service exports. We note that the sum of thecoefficients of globalization is positive. Except for political globalization, the sum of the coefficientsof the interaction term is negative, indicating that a stable environment could mitigate the positiveimpacts of globalization. The coefficients of the error-correction term are significantly negative at the1% level, which confirms the long-run relationship between the variables. For all equations, the longesttime for the deviation to return to the long-run equilibrium is one year and the shortest time is aboutfour months, implying that the speeds of adjustment to equilibrium after a shock are quite fast.
Table 8 presents the estimated results of the tourism service imports models for the long run,for which globalization has significantly positive effects on tourism service imports. The coefficients ofcountry risks are significantly negative and the positive effects of globalization even diminish withcountry stability. These indicate that as country risks decrease, China’s tourism service imports willdecline. The reason for this may be that a more stable government and environment could encourageinvestments in the tourism sector [65], improving the quality of tourism services and products toattract more domestic tourists, and thus decrease tourism service imports.

Sustainability 2020, 12, 5869 10 of 24
Table 4. Autoregressive distributed lag (ARDL) bound test.
Estimated ModelF-Statistic
OG EG SG PG
LnTSEXt = f (LnGLOBt, LnCRt, LnGDPt, LnREERt) 4.80 *** 7.96 *** 3.97 ** 7.52 ***LnTSEXt = f (LnGLOBt, LnPRt, LnGDPt, LnREERt) 6.37 *** 7.68 *** 3.78 ** 4.66 ***LnTSIMt = f (LnGLOBt, LnCRt, LnGDPt, LnREERt) 12.69 *** 12.98 *** 6.46 *** 4.35 **LnTSIMt = f (LnGLOBt, LnPRt, LnGDPt, LnREERt,) 5.63 *** 16.23 *** 10.08 *** 7.12 ***LnTSTBt = f (LnGLOBt, LnCRt, LnGDPt, LnREERt) 3.81 ** 4.49 *** 3.88 ** 6.89 ***LnTSTBt = f (LnGLOBt, LnPRt, LnGDPt, LnREERt,) 4.58 *** 7.69 *** 3.69 ** 4.49 ***
LnTSEXt = f (LnGLOB, LnGLOBt*LnCRt, LnGDPt, LnREERt) 3.90 ** 9.17 *** 23.36 *** 3.68 **LnTSEXt = f (LnGLOB, LnGLOBt*LnPRt, LnGDPt, LnREERt) 5.02 *** 3.35 ** 4.77 *** 4.55 ***LnTSIMt = f (LnGLOBt, LnGLOBt*LnCRt, LnGDPt, LnREERt) 12.82 *** 13.41 *** 8.19 *** 5.25 ***LnTSIMt = f (LnGLOBt, LnGLOBt*LnPRt, LnGDPt, LnREERt) 15.69 *** 4.01 ** 11.81 *** 7.59 ***LnTSTBt = f (LnGLOBt, LnGLOBt*LnCRt, LnGDPt, LnREERt) 4.16 ** 6.67 *** 4.04 ** 7.67 ***LnTSTBt = f (LnGLOBt, LnGLOBt*LnPRt, LnGDPt, LnREERt) 3.39 * 7.19 *** 3.64 ** 6.29 ***
Critical value
10% 5% 1%
I(0) I(1) I(0) I(1) I(0) I(1)2.20 3.09 2.56 3.49 3.29 4.37
Note: ***, **, and * indicate the 1%, 5%, and 10% significance levels, respectively.

Sustainability 2020, 12, 5869 11 of 24
Table 5. The long-run estimated results for tourism service exports.
GlobalizationVariables Overall Globalization Economic Globalization Social Globalization Political Globalization
Panel A: Consider composite risk in the models
LnGLOB −1.95 ***(0.58)
−8.04 **(2.29)
−0.95(0.93)
2.97 **(1.32)
−0.89 ***(0.26)
−5.90 ***(0.78)
−2.60 **(0.96)
−5.15 *(2.14)
LnCR −0.23(0.97)
−3.29 ***(0.95)
−0.25(1.20)
−3.10 ***(0.87)
LnGLOB*LnCR 0.92 *(0.37)
−0.89 ***(0.20)
1.04 ***(0.16)
0.06(0.31)
LnGDP 0.58 ***(0.16)
0.98 ***(0.18)
0.13(0.14)
0.10(0.12)
0.56 ***(0.13)
0.63 ***(0.04)
0.91 ***(0.29)
1.32 **(0.29)
LnREER −1.40 **(0.49)
−1.82 **(0.50)
−0.83 *(0.46)
−0.72 *(0.34)
−2.13 ***(0.40)
−1.05 ***(0.16)
−2.73 ***(0.87)
−3.81 **(0.89)
Constant 13.37 ***(3.53)
20.13 ***(3.70)
22.71 ***(3.61)
7.91 **(3.12)
13.08 **(5.52)
8.33 ***(0.76)
32.72 ***(6.01)
31.55 ***(6.40)
Panel B: Consider political risk in the models
LnGLOB −2.41 ***(0.31)
−5.23 ***(1.10)
−3.76 ***(1.02)
0.36(1.21)
−1.01(0.55)
−4.75 **(1.31)
−4.82 ***(0.86)
−5.12 ***(1.24)
LnPR 0.69(0.61)
2.25(1.51)
3.04(2.17)
−1.86(1.23)
LnGLOB*LnPR 0.54 **(0.21)
−0.61 **(0.25)
0.82 **(0.28)
0.29(0.22)
LnGDP 0.74 ***(0.11)
0.86 ***(0.13)
0.44(0.25)
0.09(0.16)
0.28(0.50)
0.68 ***(0.13)
1.29 ***(0.27)
1.09 ***(0.27)
LnREER −1.64 ***(0.34)
−1.25 **(0.45)
−0.29(0.50)
−1.25 **(0.53)
0.77(1.89)
−1.06 **(0.38)
−4.34 ***(0.89)
−2.62 ***(0.66)
Constant 11.36 ***(3.22)
13.95 ***(2.48)
5.72(4.70)
15.68 ***(4.05)
−11.58(10.13)
7.97 ***(1.61)
41.28 ***(8.80)
23.61 ***(4.46)
Notes: Standard errors are in parentheses. ***, **, and * indicate that the parameters are significant at the 1%, 5%, and 10% levels, respectively.

Sustainability 2020, 12, 5869 12 of 24
Table 6. The estimated results of the error-correction model for tourism service exports by the ARDL model when considering the composite risk.
VariablesOverall Globalization Economic Globalization Social Globalization Political Globalization
ARDL(3,2,3,3,2)
ARDL(3,3,4,4,4)
ARDL(3,3,3,3,2)
ARDL(3,1,3,3,2)
ARDL(1,0,3,0,3)
ARDL(5,3,3,3,3)
ARDL(1,0,2,3,0)
ARDL(4,4,3,4,4)
D(LnGLOB)t−0.46(0.65)
−11.64 ***(1.91)
−0.26(0.53)
2.32 **(0.77)
−3.88 ***(0.54)
−5.78 **(1.35)
D(LnGLOB)t−12.95 ***(0.89)
8.86 ***(1.93)
0.567(0.51)
3.34 ***(0.57)
8.70 **(2.18)
D(LnGLOB)t−27.79 ***(1.51)
−2.40 ***(0.52)
4.67 ***(0.43)
2.95 *(1.24)
D(LnGLOB)t−38.58 ***(1.49)
D(LnCR)t0.50
(0.69)−2.26 ***
(0.60)−1.09 *(0.59)
−0.45(0.59)
D(LnCR)t−11.38 *(0.74)
0.57(0.57)
0.52(0.58)
3.88 ***(0.76)
D(LnCR)t−2−1.67 **(0.70)
−2.17 ***(0.58)
−2.13 ***(0.65)
D(LnGLOB*LnCR)t1.49 ***(0.31)
−0.60 ***(0.09)
0.60 ***(0.12)
0.46(0.27)
D(LnGLOB*LnCR)t−1−0.26(0.21)
0.10(0.09)
−0.35 **(0.11)
−0.67 *(0.29)
D(LnGLOB*LnCR)t−2−1.35 ***
(0.23)−0.60 ***
(0.09)−0.98 ***
(0.08)0.44
(0.29)
D(LnGLOB*LnCR)t−30.37 **(0.10)
ECT(−1) −1.97 ***(0.30)
−2.92 ***(0.43)
−1.45 ***(0.17)
−1.41 ***(0.16)
−1.00 ***(0.180)
−2.68 ***(0.16)
−0.97 ***(0.13)
−2.37 ***(0.34)
Notes: Standard errors are in parentheses. ***, **, and * indicate that the parameters are significant at the 1%, 5%, and 10% levels, respectively. To save space, we only report the short-runcoefficients of globalization, country risks, and ECT (−1).

Sustainability 2020, 12, 5869 13 of 24
Table 7. The estimated results of the error-correction model for tourism service exports by the ARDL model when considering the political risk.
VariablesOverall Globalization Economic Globalization Social Globalization Political Globalization
ARDL(3,2,3,3,2)
ARDL(3,3,4,4,4)
ARDL(3,4,3,4,1)
ARDL(3,0,3,3,2)
ARDL(3,4,4,1,4)
ARDL(3,3,3,4,4)
ARDL(1,3,2,3,2)
ARDL(1,1,2,0,0)
D(LnGLOB)t−0.85(0.56)
−4.80 ***(0.83)
−3.09 ***(0.64)
−1.68 ***(0.25)
−1.93 **(0.72)
−3.23 ***(0.64)
−2.13 ***(0.62)
D(LnGLOB)t−14.19 ***(0.84)
4.50 **(1.14)
4.91 ***(0.75)
2.52 **(0.93)
1.79 **(0.63)
D(LnGLOB)t−24.07 ***(0.85)
−2.52 ***(0.52)
1.80 **(0.83)
D(LnGLOB)t−32.80 ***(0.64)
D(LnPR)t0.76
(0.49)1.12 **(0.48)
−0.12(0.56)
−2.17 **(0.93)
D(LnPR)t−10.42
(0.50)−2.45 ***
(0.60)1.66 **(0.51)
2.44 ***(0.58)
D(LnPR)t−2−2.19 ***
(0.63)−1.67 ***
(0.49)−1.73 **(0.56)
D(LnPR)t−31.88 ***(0.44)
D(LnGLOB*LnPR)t0.33
(0.17)−0.32 *(0.15)
−0.05(0.16)
0.17(0.11)
D(LnGLOB*LnPR)t−1−0.02(0.12)
0.16(0.12)
−0.44 *(0.19)
0.27 ***(0.08)
D(LnGLOB*LnPR)t−2−0.68 ***
(0.14)−0.47 ***
(0.13)−1.17 ***
(0.20)
D(LnGLOB*LnPR)t−30.30 **(0.09)
ECT(−1) −2.30 ***(0.31)
−2.32 ***(0.39)
−1.45 ***(0.17)
−1.25 ***(0.24)
−1.01 ***(0.16)
−2.25 ***(0.31)
−1.24 ***(0.20)
−0.75 ***(0.13)
Notes: Standard errors are in parentheses. ***, **, and * indicate that the parameters are significant at the 1%, 5%, and 10% levels, respectively. To save space, we only report the short-runcoefficients of globalization, country risks, and ECT (−1).

Sustainability 2020, 12, 5869 14 of 24
Table 8. The long-run estimated results for tourism service imports.
GlobalizationVariables Overall Globalization Economic Globalization Social Globalization Political Globalization
Panel A: Consider composite risk in the models
LnGLOB 4.46 **(0.97)
9.24 **(2.02)
5.47 ***(0.93)
11.05 **(1.94)
−2.02(1.59)
5.29 *(2.33)
4.17 ***(0.85)
6.33 ***(1.10)
LnCR −5.70 **(1.48)
−5.29 **(1.36)
12.10 *(6.72)
−1.78 *(0.80)
LnGLOB*LnCR −1.27 **(0.30)
−1.35 **(0.31)
−0.97(0.46)
−0.44 **(0.16)
LnGDP −0.60 *(0.23)
−0.47 *(0.20)
−0.01(0.14)
0.02(0.13)
1.04(0.78)
−0.09(0.19)
−0.71 **(0.24)
−0.80 ***(0.18)
LnREER 0.98(0.51)
0.80(0.46)
−0.33(0.59)
−0.46(0.52)
0.61(1.55)
0.28(0.55)
1.92 **(0.70)
2.22 ***(0.55)
Constant 10.62 *(3.71)
−11.21 *(3.92)
7.81(4.83)
−13.58 **(4.01)
−49.06 *(24.34)
−0.80(3.03)
−9.75 *(4.62)
−19.25 ***(3.85)
Panel B: Consider political risk in the models
LnGLOB 3.38 **(1.24)
4.52 **(1.19)
2.21 *(0.91)
−2.93(2.67)
0.66 ***(0.15)
3.38 **(0.90)
3.76 ***(0.37)
5.82 ***(0.59)
LnPR −3.30(2.27)
−0.81(2.45)
−2.21 *(0.92)
−2.22 ***(0.54)
LnGLOB*LnPR −0.63 **(0.20)
0.45(0.45)
−0.65 **(0.19)
−0.51 ***(0.12)
LnGDP −0.10(0.43)
−0.19(0.18)
0.002(0.184)
0.71 *(0.34)
0.04(0.11)
0.003(0.14)
−0.80 ***(0.11)
−0.79 ***(0.11)
LnREER 1.40(1.48)
−0.14(0.28)
0.55(1.14)
−1.01(1.05)
−0.47(0.27)
−0.54 *(0.23)
1.81 ***(0.38)
1.79 ***(0.37)
Constant −2.63(12.09)
−1.59(1.80)
−3.82(13.23)
7.67(8.83)
12.46 **(3.57)
3.77 **(1.16)
−5.34(3.77)
−14.38 ***(2.45)
Notes: Standard errors are in parentheses. ***, **, and * indicate that the parameters are significant at the 1%, 5%, and 10% levels, respectively.

Sustainability 2020, 12, 5869 15 of 24
The results present that tourism service imports are inversely associated with GDP. The reason forthis may be that the travel channel has become an important route for Chinese household capital flight inrecent years, even as genuine travel consumption has also increased rapidly [66]. In addition, the resultsillustrate that the tourism service imports increase along with RMB appreciation, which enhances therelative purchasing power and stimulates outbound tourism [67].
Tables 9 and 10 report the short-term results for tourism service imports. The sum of the coefficientsof globalization is negative. The results of the sum of the coefficients of the interaction term indicatethat country stability could mitigate the negative impacts of overall, economic, and social globalizationon tourism service imports, while enhance the negative impacts of political globalization on tourismservice imports. The error-correction term also has a negative coefficient and is highly significant forall equations. The longest time for the deviation to return to the long-run equilibrium is about twoyears and the shortest time is six months, implying that the speeds of adjustment to equilibrium after ashock are relatively fast.
Table 11 presents the estimated results of tourism service trade balance models for the long run.The estimated coefficients are significantly negative for globalization, indicating that globalizationexpands the gap between tourism service imports and exports in China. Through the aforementionedanalysis, we can see that greater globalization leads to fewer tourism service exports, but more tourismservice imports, and therefore, the deepening of globalization will intensify the trade deficit of China’stourism services. A more stable environment also intensifies the trade deficit of tourism services butcan mitigate the effects of globalization on tourism services trade balances. Moreover, the resultssuggest that an increase in real GDP and a depreciation could improve the tourism service tradedeficit [67,68].
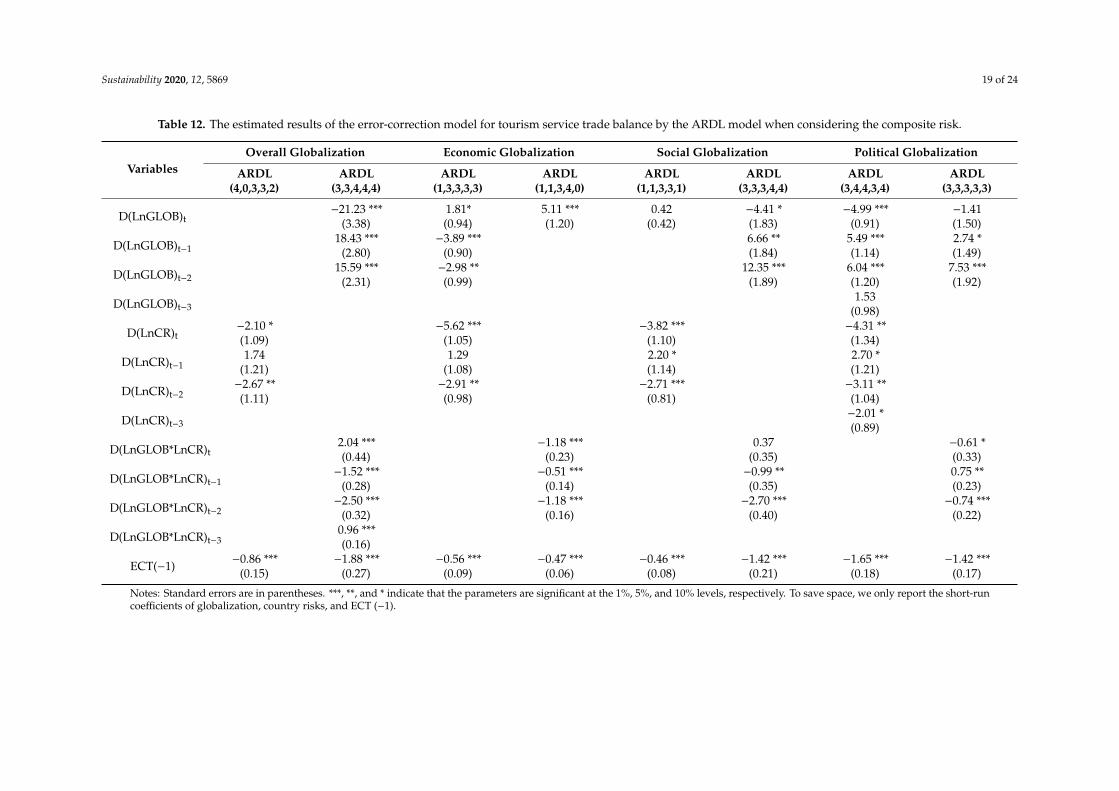
Tables 12 and 13 show the short-term relationships between tourism service trade balancesand the determinants. The sum of the coefficients of globalization is roughly positive. The sum ofthe coefficients of country risks (or interaction term) is negative, which suggests that country riskindices not only have a negative impact on tourism service trade balances, but also on the relationshipbetween globalization and tourism service trade balances. The coefficient of the error-correction termis significantly negative at the 1% level for all equations. The longest time for the deviation to return tothe long-run equilibrium is more than two years and the shortest time is four months.

Sustainability 2020, 12, 5869 16 of 24
Table 9. The estimated results of the error-correction model for tourism service imports by the ARDL model when considering the composite risk.
VariablesOverall Globalization Economic Globalization Social Globalization Political Globalization
ARDL(4,4,4,4,4)
ARDL(4,4,4,4,4)
ARDL(4,4,4,4,4)
ARDL(4,4,4,4,4)
ARDL(1,0,3,2,0)
ARDL(4,4,4,4,3)
ARDL(3,3,3,3,3)
ARDL(2,3,3,3,3)
D(LnGLOB)t2.02 **(0.29)
2.80 **(0.64)
0.38(0.26)
2.83 **(0.73)
−1.29(0.76)
0.52(0.57)
−5.91 ***(1.29)
D(LnGLOB)t−1−4.58 ***
(0.35)−12.92 ***
(0.84)−6.81 ***
(0.55)−13.29 ***
(0.90)−9.53 ***
(0.88)−6.68 ***
(1.28)−4.26 **(1.41)
D(LnGLOB)t−2−2.32 ***
(0.34)−9.90 ***
(0.73)−3.97 ***
(0.38)−11.47 ***
(0.68)−8.13 ***
(0.79)−3.17 **(1.14)
D(LnGLOB)t−3−2.15 ***
(0.32)−5.18 ***
(0.58)−3.13 ***
(0.30)−8.65 ***
(0.75)−3.58 ***
(0.63)
D(LnCR)t−0.66(0.41)
−1.38 *(0.47)
4.15 ***(0.63)
−1.05(1.15)
D(LnCR)t−17.92 ***(0.52)
5.45 ***(0.38)
1.09 **(0.41)
−0.87(0.72)
D(LnCR)t−27.38 ***(0.47)
6.69 ***(0.46)
1.70 ***(0.46)
1.30 *(0.64)
D(LnCR)t−32.71 ***(0.33)
4.61 ***(0.44)
D(LnGLOB*LnCR)t−0.27 *(0.11)
−0.53 **(0.13)
0.30(0.16)
−0.38(0.26)
D(LnGLOB*LnCR)t−11.90 ***(0.13)
1.38 ***(0.10)
1.87 ***(0.18)
−0.31 *(0.16)
D(LnGLOB*LnCR)t−21.79 ***(0.12)
1.72 ***(0.12)
1.77 ***(0.17)
0.29 *(0.14)
D(LnGLOB*LnCR)t−30.74 ***(0.09)
1.27 ***(0.12)
0.77 ***(0.14)
ECT(−1) −1.63 ***(0.11)
−1.84 ***(0.13)
−1.38 ***(0.10)
−1.54 ***(0.11)
−0.28 ***(0.04)
−1.57 ***(0.15)
−1.76 ***(0.28)
−1.80 ***(0.26)
Notes: Standard errors are in parentheses. ***, **, and * indicate that the parameters are significant at the 1%, 5%, and 10% levels, respectively. To save space, we only report the short-runcoefficients of globalization, country risks, and ECT (−1).

Sustainability 2020, 12, 5869 17 of 24
Table 10. The estimated results of the error-correction model for tourism service imports by the ARDL model when considering the political risk.
VariablesOverall Globalization Economic Globalization Social Globalization Political Globalization
ARDL(3,3,4,4,4)
ARDL(4,4,4,4,3)
ARDL(4,4,4,4,3)
ARDL(3,0,2,2,2)
ARDL(4,3,4,4,3)
ARDL(4,4,4,4,3)
ARDL(1,3,3,3,2)
ARDL(1,3,3,3,2)
D(LnGLOB)t2.82 ***(0.51)
1.64 **(0.44)
0.68 **(0.23)
0.36 **(0.12)
0.27(0.48)
−0.42(0.43)
2.29 ***(0.65)
D(LnGLOB)t−12.04 ***(0.42)
−7.18 ***(0.49)
0.32(0.25)
−0.36 **(0.11)
−6.02 ***(0.52)
−7.60 ***(1.11)
−7.44 ***(1.12)
D(LnGLOB)t−22.19 ***(0.50)
−5.54 ***(0.53)
−1.93 ***(0.27)
0.28*(0.11)
−5.94 ***(0.57)
−1.80 **(0.74)
−3.44 ***(1.02)
D(LnGLOB)t−3−3.64 ***
(0.39)−1.16 **(0.26)
D(LnPR)t3.01 ***(0.64)
3.95 ***(0.30)
0.63(0.38)
−2.87 ***(0.54)
D(LnPR)t−15.34 ***(0.60)
5.35 ***(0.37)
4.33 ***(0.41)
0.03(0.38)
D(LnPR)t−23.94 ***(0.49)
4.45 ***(0.35)
5.11 ***(0.51)
1.88 ***(0.51)
D(LnPR)t−31.13 **(0.36)
1.28 ***(0.20)
2.51 ***(0.34)
D(LnGLOB*LnPR)t−0.08(0.09)
0.50 ***(0.12)
0.01(0.10)
−0.66 ***(0.20)
D(LnGLOB*LnPR)t−11.28 ***(0.10)
0.19 *(0.10)
1.27 ***(0.11)
0.001(0.09)
D(LnGLOB*LnPR)t−21.32 ***(0.10)
1.44 ***(0.13)
0.41 ***(0.11)
D(LnGLOB*LnPR)t−30.59 ***(0.07)
0.73 ***(0.09)
ECT(−1) −0.62 ***(0.08)
−1.97 ***(0.14)
−1.40 ***(0.09)
−0.59 ***(0.10)
−1.63 ***(0.15)
−1.99 ***(0.16)
−1.88 ***(0.24)
−1.85 ***(0.23)
Notes: Standard errors are in parentheses. ***, **, and * indicate that the parameters are significant at the 1%, 5%, and 10% levels, respectively. To save space, we only report the short-runcoefficients of globalization, country risks, and ECT (−1).

Sustainability 2020, 12, 5869 18 of 24
Table 11. The long-run estimated results for tourism service trade balance.
GlobalizationVariables Overall Globalization Economic Globalization Social Globalization Political Globalization
Panel A: Consider composite risk in the models
LnGLOB −0.01(2.04)
−26.25 ***(5.93)
8.16(5.08)
19.07 **(8.04)
2.93(2.11)
−13.76 *(5.74)
−8.05 ***(1.75)
−6.54 **(2.25)
LnCR −3.23(3.59)
−14.09 ***(4.43)
−16.75 **(7.77)
−1.33(1.82)
LnGLOB*LnCR 3.50 **(0.90)
−2.96 **(1.01)
2.50 *(1.14)
−0.15(0.30)
LnGDP −0.39(0.57)
1.98 **(0.47)
−1.08(0.69)
−1.72 **(0.79)
−1.50(1.10)
0.68(0.42)
1.78 **(0.47)
1.62 ***(0.42)
LnREER 0.77(1.93)
−2.59 **(0.99)
0.36(2.03)
2.70(1.78)
1.88(2.76)
−1.02(1.30)
−5.63 **(1.44)
−4.98 ***(1.31)
Constant 11.30(14.94)
41.22 ***(9.19)
32.87 *(16.13)
−27.26(17.38)
58.98 **(23.39)
10.14(6.77)
51.21 ***(8.82)
40.05 ***(8.91)
Panel B: Consider political risk in the models
LnGLOB −5.15 ***(1.01)
−11.07 **(2.22)
−2.73 *(1.19)
4.92 ***(1.37)
−1.92 **(0.59)
−0.39(2.27)
−8.62 **(2.02)
−8.69 ***(1.50)
LnPR 5.04 **(1.96)
−3.05(1.97)
6.18 *(3.17)
−1.20(2.36)
LnGLOB*LnPR 1.36 **(0.39)
−1.45 ***(0.22)
−0.09(0.47)
0.06(0.30)
LnGDP 0.80 *(0.36)
1.26 **(0.32)
−0.49(0.28)
−0.89 ***(0.18)
0.39(0.44)
0.08(0.41)
1.71 *(0.64)
2.04 ***(0.29)
LnREER −0.12(1.04)
−0.98(0.62)
−0.14(0.72)
0.21(0.43)
1.16(1.21)
0.58(1.14)
−5.35 *(1.98)
−6.14 ***(0.96)
Constant −7.05(8.86)
15.45 **(3.36)
25.40 ***(7.23)
7.60 **(2.98)
−27.72 *(13.84)
−2.29(5.00)
52.04 **(17.37)
47.88 ***(6.33)
Notes: Standard errors are in parentheses. ***, **, and * indicate that the parameters are significant at the 1%, 5%, and 10% levels, respectively.
Sustainability 2020, 12, 5869 19 of 24
Table 12. The estimated results of the error-correction model for tourism service trade balance by the ARDL model when considering the composite risk.
VariablesOverall Globalization Economic Globalization Social Globalization Political Globalization
ARDL(4,0,3,3,2)
ARDL(3,3,4,4,4)
ARDL(1,3,3,3,3)
ARDL(1,1,3,4,0)
ARDL(1,1,3,3,1)
ARDL(3,3,3,4,4)
ARDL(3,4,4,3,4)
ARDL(3,3,3,3,3)
D(LnGLOB)t−21.23 ***
(3.38)1.81*(0.94)
5.11 ***(1.20)
0.42(0.42)
−4.41 *(1.83)
−4.99 ***(0.91)
−1.41(1.50)
D(LnGLOB)t−118.43 ***
(2.80)−3.89 ***
(0.90)6.66 **(1.84)
5.49 ***(1.14)
2.74 *(1.49)
D(LnGLOB)t−215.59 ***
(2.31)−2.98 **(0.99)
12.35 ***(1.89)
6.04 ***(1.20)
7.53 ***(1.92)
D(LnGLOB)t−31.53
(0.98)
D(LnCR)t−2.10 *(1.09)
−5.62 ***(1.05)
−3.82 ***(1.10)
−4.31 **(1.34)
D(LnCR)t−11.74
(1.21)1.29
(1.08)2.20 *(1.14)
2.70 *(1.21)
D(LnCR)t−2−2.67 **(1.11)
−2.91 **(0.98)
−2.71 ***(0.81)
−3.11 **(1.04)
D(LnCR)t−3−2.01 *(0.89)
D(LnGLOB*LnCR)t2.04 ***(0.44)
−1.18 ***(0.23)
0.37(0.35)
−0.61 *(0.33)
D(LnGLOB*LnCR)t−1−1.52 ***
(0.28)−0.51 ***
(0.14)−0.99 **(0.35)
0.75 **(0.23)
D(LnGLOB*LnCR)t−2−2.50 ***
(0.32)−1.18 ***
(0.16)−2.70 ***
(0.40)−0.74 ***
(0.22)
D(LnGLOB*LnCR)t−30.96 ***(0.16)
ECT(−1) −0.86 ***(0.15)
−1.88 ***(0.27)
−0.56 ***(0.09)
−0.47 ***(0.06)
−0.46 ***(0.08)
−1.42 ***(0.21)
−1.65 ***(0.18)
−1.42 ***(0.17)
Notes: Standard errors are in parentheses. ***, **, and * indicate that the parameters are significant at the 1%, 5%, and 10% levels, respectively. To save space, we only report the short-runcoefficients of globalization, country risks, and ECT (−1).

Sustainability 2020, 12, 5869 20 of 24
Table 13. The estimated results of the error-correction model for tourism service trade balance by the ARDL model when considering the political risk.
VariablesOverall Globalization Economic Globalization Social Globalization Political Globalization
ARDL(3,2,3,4,4)
ARDL(4,4,4,4,4)
ARDL(4,3,4,4,0)
ARDL(4,0,4,4,0)
ARDL(3,2,3,4,4)
ARDL(3,0,2,3,1)
ARDL(4,4,4,3,4)
ARDL(1,3,3,3,2)
D(LnGLOB)t−5.73 ***
(0.98)−9.25 ***
(1.51)−1.25(0.88)
−2.19 ***(0.48)
−6.78 ***(1.22)
−2.48 **(1.10)
D(LnGLOB)t−13.45 **(1.06)
16.38 ***(2.50)
0.04(0.74)
1.01 **(0.43)
4.61 **(1.35)
4.96 ***(1.40)
D(LnGLOB)t−215.90 ***
(2.55)−4.50 ***
(0.86)4.11 **(1.39)
4.02 **(1.45)
D(LnGLOB)t−37.52 **(1.75)
2.80 *(1.04)
D(LnPR)t−0.46(0.97)
−5.35 ***(0.95)
−0.30(1.06)
−2.59 *(1.08)
D(LnPR)t−1−1.67 *(0.82)
−3.54 ***(0.87)
−2.01 *(0.96)
2.24 *(1.02)
D(LnPR)t−2−6.05 ***
(1.00)−5.54 ***
(0.89)−6.02 ***
(1.17)−2.50 *(1.03)
D(LnPR)t−3−1.41 **(0.58)
−1.43(0.90)
D(LnGLOB*LnPR)t0.48
(0.26)−1.77 ***
(0.23)0.20 *(0.11)
−0.12(0.21)
D(LnGLOB*LnPR)t−1−1.38 **(0.30)
−0.59 ***(0.14)
0.50 ***(0.11)
0.57 ***(0.16)
D(LnGLOB*LnPR)t−2−1.85 ***
(0.25)−1.35 ***
(0.18)−0.36 *(0.18)
D(LnGLOB*LnPR)t−3−0.58 *(0.22)
−0.34 **(0.13)
ECT(−1) −1.39 ***(0.20)
−2.97 ***(0.40)
−1.46 ***(0.17)
−1.47 ***(0.19)
−1.20 ***(0.20)
−0.99 ***(0.18)
−1.51 ***(0.19)
−1.36 ***(0.19)
Notes: Standard errors are in parentheses. ***, **, and * indicate that the parameters are significant at the 1%, 5%, and 10% levels, respectively. To save space, we only report the short-runcoefficients of globalization, country risks, and ECT (−1).

Sustainability 2020, 12, 5869 21 of 24
5.3. The CUSUM and CUSUMSQ Tests of Stability
We applied the cumulative sum (CUSUM) of recursive residuals and the CUSUM of square(CUSUMSQ) tests to assess parameter stability. The test results show that plots of the CUSUM andCUSUMSQ statistics fall inside the critical bands of the 5% confidence intervals of parameter stability,indicating the absence of any instability of these coefficients. To save space, this study does not reportthe results of CUSUM and CUSUMSQ tests.
6. Discussion and Implication
Tourism and its associated economic repercussions have taken place within a wider context ofglobalization of the world economy [44]. It is thus logical to consider tourism as a main component inthe process of globalization [14], but trade in tourism services and the benefits of free trade in theseservices are topics that have received less attention in international economics. This study looks toprovide an empirical explanation for the relationships between tourism service trade, globalization,and country risks in China by using the ARDL model.
In the long run, we find that globalization has negative effects on the exports of tourism service trade,but positive effects on its imports, thus exacerbating the tourism service trade imbalances. The positiveimpact of globalization on tourism service imports found in our study is roughly consistent with thefindings of Javid and Katircioglu [23] for a sample of 133 countries and of Ivanov and Webster [10]for 167 countries. However, both of them also found a positive impact of globalization on tourismservice exports, which is completely opposite to our findings. This indicates that compared withother countries, the impact of globalization on China’s tourism service trade has certain characteristics.The auses for this may be as follows. First, with the development of information and communicationstechnology (social globalization), tourists could easily gather information on destinations, products,and services, which expands their choices [69,70]. The international competitiveness of China’s tourismservice trade is low [8]. Tourism infrastructure, products, and services of the country cannot meet theneeds of the international tourism market, thus inhibiting the exports of tourism service trade.
Second, the globalization of liberalization of trade (economic globalization) creates new marketsand new sources of competition for the tourism industry [15]. Some countries provide characteristictourism services and products to expand the market. For instance, South Korea specifically attractshigh-end Chinese female consumers through department stores, shopping outlets, and some famousattractions [8]. Furthermore, some countries also have succeeded in attracting Chinese tourists byadopting clear tourism development policies, such as easier visa facilitation (political globalization),shopping tax exemption (economic globalization), the opening of air rights, low-cost routes (socialglobalization), etc. [71]. Therefore, the choice of a large number of Chinese tourists to travel abroadincreases the country’s tourism service trade imports.
Some implications did arise from our findings. In the area of policy, knowledge of the factsherein can assist regulators and policy makers in determining and executing suitable effective policies.First, the government should promote sound economic policies and good governance, which canhelp build buffers against the adverse effects of globalization on tourism service exports and tradebalances. Second, the government should fully exploit the advantages of tourism resources and builda multinational boutique tourism route system. Third, the government should continue to promoteeasier visa facilitation and a tax refund policy for shopping by foreign tourists. Fourth, in respect ofsocial globalization, the government should also strengthen online interactive marketing and buildan “Internet +” overseas tourism promotion system. Fifth, in terms of country risks, the governmentneeds to maintain the stability of country environments since the role of country risks in moderatingthe relationship between globalization and tourism service trade is important. At the same time, theyshould improve their ability to quickly deal with earth-shattering events such as COVID-19, so as toensure the sustainable development of tourism service trade after being shocked.
The limitation of this study is that we adopted aggregated data, which could not consider thedifferences between the effects for the individual tourism services trading partners, bringing about

Sustainability 2020, 12, 5869 22 of 24
aggregation bias. In the future, we could adopt disaggregated data, i.e., the bilateral tourism servicestrade, to explore the effects of globalization on the bilateral tourism services trade (i.e., export, import,and trade balance) for China and other individual countries.
Author Contributions: Formal analysis, writing—review & editing, W.Z. and Y.-B.C.; conceptualization, datacuration, supervision, and validation, Y.-B.C.; methodology, writing—original draft preparation, W.Z. All authorshave read and agreed to the published version of the manuscript.
Funding: This research was supported by the National Natural Science Foundation of China (grantnumber 71771188).
Conflicts of Interest: The authors declare no conflict of interest.
References
1. Hidayati, F. Tourism and economic growth: The role of globalization. J. Public Adm. Stud. 2018, 2, 16–20.2. Lin, V.S.; Yang, Y.; Li, G. Where can tourism-led growth and economy-driven tourism growth occur.
J. Travel Res. 2019, 58, 760–773. [CrossRef]3. Narayan, P.K.; Narayan, S.; Prasad, A.; Prasad, B.C. Tourism and economic growth: A panel data analysis for
Pacific Island countries. Tour. Econ. 2010, 16, 169–183. [CrossRef]4. Tang, C.F.; Tan, E.C. Does tourism effectively stimulate Malaysia’s economic growth. Tour. Manag. 2015, 46,
158–163. [CrossRef]5. Fayed, H.; Fletcher, J. Report: Globalization of economic activity: Issues for tourism. Tour. Econ. 2002, 8,
207–230. [CrossRef]6. Kumar, M.; Prashar, S.; Jana, R.K. Does international tourism spur international trade and output. Evidence
from wavelet analysis. Tour. Econ. 2019, 25, 22–33. [CrossRef]7. Li, Y. Difficulties and Countermeasures to Improving of Inbound Tourism in China. In Proceedings
of the 4th International Conference on Education Reform and Modern Management, Phuket, Thailand,6–7 August 2017.
8. Guo, C.; Liao, C. Research on the Deficit of China’s Tourism Service Trade and Countermeasures. Am. J. Ind.Bus. Manag. 2017, 7, 170–178. [CrossRef]
9. Dreher, A. Does globalization affect growth. Evidence from a new index of globalization. Appl. Econ. 2006,38, 1091–1110. [CrossRef]
10. Ivanov, S.H.; Webster, C. Tourism’s impact on growth: The role of globalisation. Ann. Tour. Res. 2013, 41,231–236. [CrossRef]
11. Song, H.; Li, G.; Cao, Z. Tourism and Economic Globalization: An emerging research agenda. J. Travel Res.2018, 57, 999–1011. [CrossRef]
12. Chiu, Y.-B.; Zhang, W.; Ding, K. Does globalization influence inbound tourism. Evidence from a dynamicpanel threshold analysis. J. Travel Res. 2020. [CrossRef]
13. Hociung, I.G.; Frâncu, L.G. Globalization-tourism-communication, competitiveness triangle on the marketaffected by the economic crisis. Theor. Appl. Econ. 2012, 19, 133–146.
14. Mustafa, M.H. Tourism and globalization in the Arab world. Int. J. Bus. Soc. Sci. 2010, 1, 37–48.15. Dwyer, L. Globalization of tourism: Drivers and outcomes. Tour. Recreat Res. 2015, 40, 326–339. [CrossRef]16. Jin, X.; Qu, M.; Bao, J. Impact of crisis events on Chinese outbound tourist flow: A framework for post-events
growth. Tour. Manag. 2019, 74, 334–344. [CrossRef]17. Brahmasrene, T.; Lee, J.W. Assessing the dynamic impact of tourism, industrialization, urbanization, and
globalization on growth and environment in Southeast Asia. Int. J. Sustain. Dev. World Ecol. 2017, 24,362–371. [CrossRef]
18. Saint Akadiri, S.; Lasisi, T.T.; Uzuner, G.; Akadiri, A.C. Examining the impact of globalization in theenvironmental Kuznets curve hypothesis: The case of tourist destination states. Environ. Sci. Pollut. Res.2019, 26, 12605–12615. [CrossRef]
19. Kulczyk-Dynowska, A.; Bal-Domanska, B. The National parks in the context of tourist function developmentin territorially linked municipalities in poland. Sustainability 2019, 11, 1996. [CrossRef]
20. Floyd, M.F.; Pennington-Gray, L. Profiling risk perceptions of tourists. Ann. Tour. Res. 2004, 31, 1051–1054.[CrossRef]
Sustainability 2020, 12, 5869 23 of 24
21. Wang, J.; Liu-Lastres, B.; Ritchie, B.W.; Pan, D.Z. Risk reduction and adventure tourism safety: An extensionof the risk perception attitude framework (RPAF). Tour. Manag. 2019, 74, 247–257. [CrossRef]
22. Drakos, K.; Kutan, A.M. Regional Effects of Terrorism on Tourism in Three Mediterranean Countries.J. Confl. Resolut. 2003, 47, 621–641. [CrossRef]
23. Javid, E.; Katircioglu, S. The globalization indicators-tourism development nexus: A dynamic panel-dataanalysis. Asia Pac. J. Tour. Res. 2017, 22, 1194–1205. [CrossRef]
24. Bakar, N.A.; Rosbi, S. Effect of Coronavirus disease (COVID-19) to tourism industry. Int. J. Adv. Eng. Res. Sci.2020, 7, 189–193. [CrossRef]
25. Chang, C.L.; McAleer, M.; Ramos, V. A charter for sustainable tourism after COVID-19. Sustainability 2020,12, 3671. [CrossRef]
26. World Tourism Organization. Impact Assessment of the COVID-19 Outbreak on International Tourism; WorldTourism Organization: Madrid, Spain, 2020.
27. Moore, M. APAC: COVID-19 Impact on Tourist Arrivals by Country or Region; Statista: Hamburg, Germany, 2020.Available online: https://www.statista.com/statistics/1103147/apac-covid-19-impact-on-tourist-arrivals-by-country/ (accessed on 10 June 2020).
28. Cheer, J.M. Human flourishing, tourism transformation and COVID-19: A conceptual touchstone. Tour. Geogr.2020. [CrossRef]
29. Gössling, S.; Scott, D.; Hall, C.M. Pandemics, tourism and global change: A rapid assessment of COVID-19.J. Sustain. Tour. 2020. [CrossRef]
30. Hall, C.M.; Scott, D.; Gössling, S. Pandemics, transformations and tourism: Be careful what you wish for.Tour. Geogr. 2020. [CrossRef]
31. Hjalager, A.M. Stages in the economic globalization of tourism. Ann. Tour. Res. 2007, 34, 437–457. [CrossRef]32. Prideaux, B. Factors affecting bilateral tourism flows. Ann. Tour. Res. 2005, 32, 780–801. [CrossRef]33. Vietze, C. Cultural effects on inbound tourism into the USA: A gravity approach. Tour. Econ. 2012, 18,
121–138. [CrossRef]34. Kim, S.S.; Prideaux, B.; Timothy, D. Factors affecting bilateral Chinese and Japanese travel. Ann. Tour. Res.
2016, 61, 80–95.35. Harb, G.; Bassil, C. Gravity analysis of tourism flows and the ‘multilateral resistance to tourism’.
Curr. Issues Tour. 2020, 23, 666–678. [CrossRef]36. Dai, B.; Jiang, Y.; Yang, L.; Ma, Y. China’s outbound tourism–Stages, policies and choices. Tour. Manag. 2017,
58, 253–258. [CrossRef]37. Read, R. The implications of increasing globalization and regionalism for the economic growth of small
island states. World Dev. 2004, 32, 365–378. [CrossRef]38. Nyaupane, G.P.; Timothy, D.J. Power, regionalism and tourism policy in Bhutan. Ann. Tour. Res. 2010, 37,
969–988. [CrossRef]39. Henderson, J.C. Regionlisation and tourism: The Indonesia-Malaysia-Singapore growth triangle.
Curr. Issues Tour. 2001, 4, 78–93. [CrossRef]40. Dredge, D.; Jenkins, J. Destination place identity and regional tourism policy. Tour. Geogr. 2003, 5, 383–407.
[CrossRef]41. Johnson, C.; Vanetti, M. Locational strategies of international hotel chains. Ann. Tour. Res. 2005, 32, 1077–1099.
[CrossRef]42. Rogerson, J.M. Unpacking the growth of hotel chains in Africa: Enterprises and patterns. Mediterr. J. Soc. Sci.
2014, 5, 135–146. [CrossRef]43. Clancy, M. Global commodity chains and tourism: Past research and future directions. In Political Economy of
Tourism: A Critical Perspective; Routledge: London, UK, 2010; pp. 99–116.44. Rey, B.; Myro, R.L.; Galera, A. Effect of low-cost airlines on tourism in Spain. A dynamic panel data model.
J. Air Transp. Manag. 2011, 17, 163–167. [CrossRef]45. Sugiyarto, G.; Blake, A.; Sinclair, M.T. Tourism and globalization: Economic impact in Indonesia.
Ann. Tour. Res. 2003, 30, 683–701. [CrossRef]46. Stezhko, N.; Oliinyk, Y.; Polishchuk, L.; Tyshchuk, I.; Parfinenko, A.; Markhonos, S. International Tourism in
the System of Modern Globalization Processes. Int. J. Manag. 2020, 11, 97–106.47. Sequeira, T.; Nunes, P.M. Does tourism influence economic growth. A dynamic panel data approach.
Econ. Rec. 2008, 84, 223–236. [CrossRef]

Sustainability 2020, 12, 5869 24 of 24
48. Scheyvens, R. The challenge of sustainable tourism development in the Maldives: Understanding the socialand political dimensions of sustainability. Asia Pac. Viewp. 2011, 52, 148–164. [CrossRef]
49. Eilat, Y.; Einav, L. Determinants of international tourism: A three-dimensional panel data analysis. Appl. Econ.2004, 36, 1315–1327. [CrossRef]
50. Yap, G.; Saha, S. Do political instability, terrorism, and corruption have deterring effects on tourismdevelopment even in the presence of UNESCO heritage. A cross-country panel estimate. Tour. Anal. 2013,18, 587–599. [CrossRef]
51. Joshi, O.; Poudyal, N.C.; Larson, L.R. The influence of sociopolitical, natural, and cultural factors on internationaltourism growth: A cross-country panel analysis. Environ. Dev. Sustain. 2017, 19, 825–838. [CrossRef]
52. Saha, S.; Su, J.-J.; Campbell, N. Does Political and Economic Freedom Matter for Inbound Tourism?A Cross-National Panel Data Estimation. J. Travel Res. 2017, 56, 221–234. [CrossRef]
53. Musavengane, R.; Siakwah, P.; Leonard, L. The nexus between tourism and urban risk: Towards inclusive,safe, resilient and sustainable outdoor tourism in African cities. J. Outdoor Recreat. Tour. 2020, 29, 100254.[CrossRef]
54. Held, D.; McGrew, A.; Goldblatt, D.; Perraton, J. Global Transformations: Politics, Economics and Culture;Stanford University Press: Stanford, CA, USA, 2000.
55. Ivanov, S.H.; Ivanova, M.G. Do hotel chains improve destination’s competitiveness. Tour. Manag. Perspect.2016, 19, 74–79. [CrossRef]
56. Alola, U.V.; Cop, S.; Alola, A.A. The spillover effects of tourism receipts, political risk, real exchange rate,and trade indicators in Turkey. Int. J. Tour. Res. 2019, 21, 813–823. [CrossRef]
57. Pesaran, M.H.; Shin, Y.; Smith, R. Bounds testing approaches to the analysis of level relationships. Appl. Econom.2001, 16, 289–326. [CrossRef]
58. Dreher, A.; Gaston, N.; Martens, P. Measuring Globalization-Gauging Its Consequences; Springer: New York, NY,USA, 2008.
59. Dickey, D.A.; Fuller, W.A. Distribution of the estimation for autoregressive time series with a unit root. J. Am.Stat. Assoc. 1979, 74, 427–431.
60. Phillips, P.C.B.; Perron, P. Testing for a Unit root in Time Series Regression. Biometrika 1988, 75, 335–346. [CrossRef]61. Johansen, S.; Juselius, K. Maximum likelihood estimation and inference on cointegration with applications to
the demand for money. Oxf. Bull. Econ. Stat. 1990, 52, 161–210. [CrossRef]62. Berrittella, M.; Bigano, A.; Roson, R.; Tol, R.S. A general equilibrium analysis of climate change impacts on
tourism. Tour. Manag. 2006, 27, 913–924. [CrossRef]63. Massidda, C.; Mattana, P. A SVECM analysis of the relationship between international tourism arrivals, GDP
and trade in Italy. J. Travel Res. 2013, 52, 93–105. [CrossRef]64. Dritsakis, N. Tourism as a long-run economic growth factor: An empirical investigation for Greece using
causality analysis. Tour. Econ. 2004, 10, 305–316. [CrossRef]65. Kunst, I. The role of the government in promoting tourism investment in selected Mediterranean
countries-implications for the Republic of Croatia. Tour. Hosp. Manag. 2011, 17, 115–130.66. Wong, A. China’s Current Account: External Rebalancing or Capital Flight. Int. Financ. Discuss. Pap. 2017.
[CrossRef]67. Kwack, S.Y.; Ahn, C.Y.; Lee, Y.S.; Yang, D.Y. Consistent estimates of world trade elasticities and an application
to the effects of Chinese Yuan (RMB) appreciation. J. Asian Econ. 2007, 18, 314–330. [CrossRef]68. Dogru, T.; Isik, C.; Sirakaya-Turk, E. The balance of trade and exchange rates: Theory and contemporary
evidence from tourism. Tour. Manag. 2019, 74, 12–23. [CrossRef]69. Zheng, X.; Magnini, V.P.; Fesenmaier, D.R. Information technology and consumer behavior in travel and
tourism: Insights from travel planning using the internet. J. Retail. Consum. Serv. 2015, 22, 244–249.70. Zheng, X. From digitization to the age of acceleration: On information technology and tourism.
Tour. Manag. Perspect. 2018, 25, 147–150.71. Zhao, R.J. Analysis on the causes and countermeasures of China’s tourism trade deficit. Chongqing Soc. Sci.
2016, 4, 19–25.
© 2020 by the authors. Licensee MDPI, Basel, Switzerland. This article is an open accessarticle distributed under the terms and conditions of the Creative Commons Attribution(CC BY) license (http://creativecommons.org/licenses/by/4.0/).