globant and big data on aws
TRANSCRIPT
Big Data at Globant
Success Cases in AWS
Sabina A. Schneider

What is Big Data?

What is Data Science?
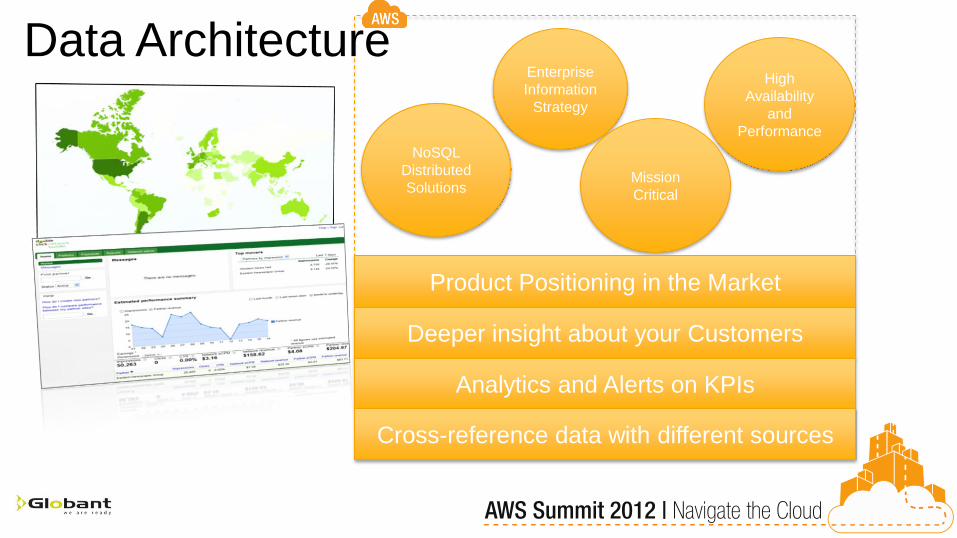
Data Architecture Enterprise
Information
Strategy
High
Availability
and
Performance
Mission
Critical
NoSQL
Distributed
Solutions
Product Positioning in the Market
Deeper insight about your Customers
Analytics and Alerts on KPIs
Cross-reference data with different sources

Core Technologies

BigData Ecosystem

Third Party
Integration
Elastic Load Balancer
Web Client
Mobile Devices
BigData – storage and processing
Web Client
Analytics
Dashboard
Web App
Mobile Devices in the cars
Auto scaling singly
Storm Real Time processing
Hadoop
Pig Trends
NoSQL DB EMR Cluster S3 Bucket Cloudfront
Web App
Web App
Scalable Architecture in the Cloud

Metamarkets has
developed a web-based
analytics console that
supports drill-downs and
roll-ups of high dimensional
data sets (real-time
bidding), comprising billions
of events, in real-time.
Data store collects 10 GB
of information every day,
and has over 15 TB.
Reports using Hadoop and
Hive on AWS Infrastructure.
The 40-instance cluster can
scan, filter, and aggregate 1
billion rows in 950
milliseconds.
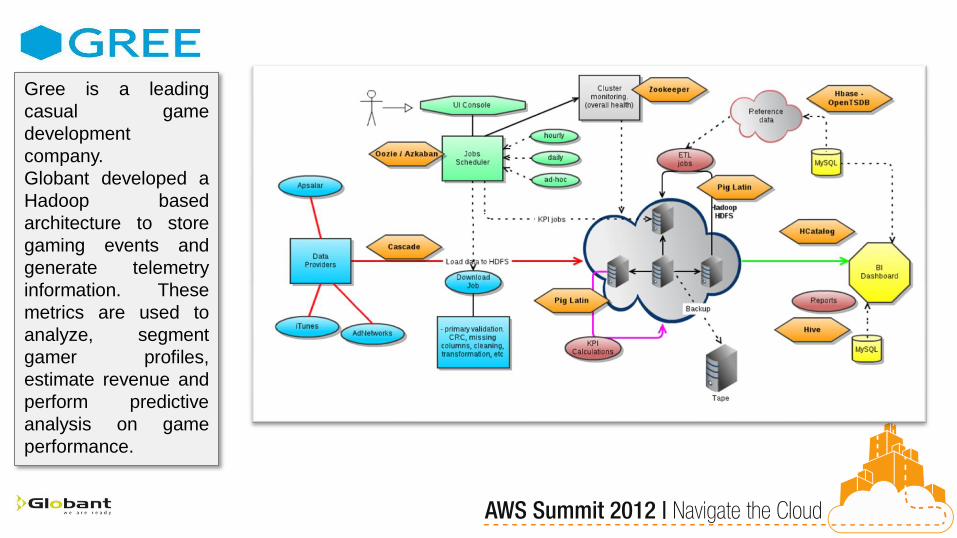
Gree is a leading
casual game
development
company.
Globant developed a
Hadoop based
architecture to store
gaming events and
generate telemetry
information. These
metrics are used to
analyze, segment
gamer profiles,
estimate revenue and
perform predictive
analysis on game
performance.
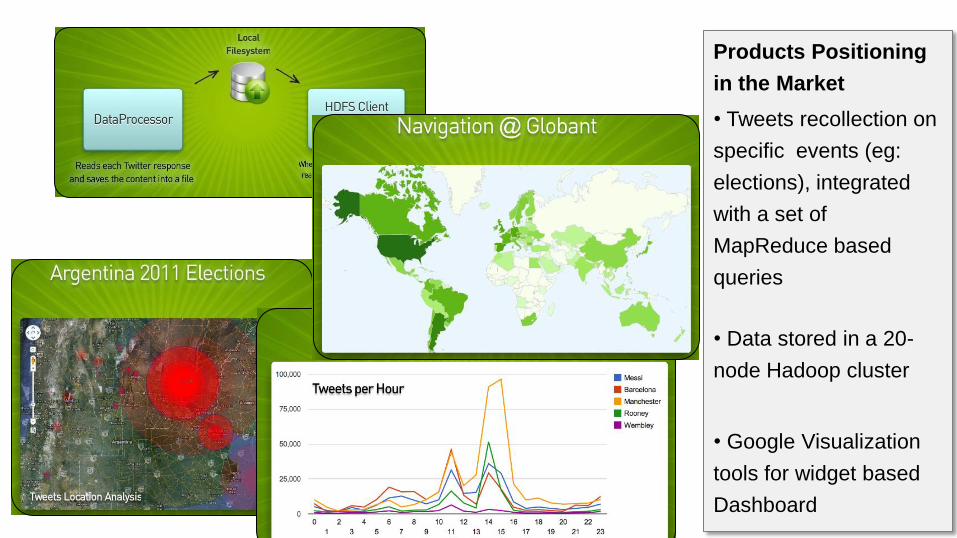
Products Positioning
in the Market
• Tweets recollection on
specific events (eg:
elections), integrated
with a set of
MapReduce based
queries
• Data stored in a 20-
node Hadoop cluster
• Google Visualization
tools for widget based
Dashboard

What?
• Innovation to the Financial Market
• Sentiment Analytics to what’s happening now and what can happen next in the
Market
• Predictions one week in advance according to comments on Tweeter
Challenges
• Aggresive Real Time analysis on Social Networks
• Dashboarding comparing with real values from Yahoo Finances
• Sentiment Analysis and Languague filtering
• Analytics Predictions

Data Science
Sophisticated
Mathematical
algorithm
Statistical
Algorithm
Predictions on KPIs
Predictions on Metrics
Classification
Clustering
Recommend
ation

Moneygram Transaction Scoring Analysis of Moneygram historical transactional data labeled as Fraudulent/Non Fraudulent
• 8 years of transactional data to analyze
Training using Support Vector Machines of historical data
• Classification achieved by using only a subset of data using soft margins (by use of slack
variables) to construct dividing hyperplane
• Possible use of kernel principal components to preprocess data and reduce dimensionality of
training dataset
• Avoid high computation times (sparse solution)
Benefits
• Detect fraudulent transactions with a higher level of accuracy
• Increase in customer service satisfaction (less false-positives)

Shopping cart suggestion engine Generate suggestions based on client shopping history
• Cluster a large dataset representing clients' shopping history using
unsupervised learning algorithms.
• Use information from new/existing client to classify into the clusterized
shopping history from ALL clients.
• Generate suggestions based on the cluster's shopping preferences
• Use of Hadoop and Mahout for clustering and posterior classification
• Metadata word clustering using Solr
• Content management and information sorting/ categorization classified by location.
Enhance the performance at a view level.
• Indexing of jwt content coming from different sources (internal and external) developed
with Solr on Lucene. Integration with myJwt.com: internal social network.
• organize the content storage: service running in the Cloud that receives content,
generate different assets (snapshot, thumbnails), extract metadata to be
centralized in one place
• myIdeas: collect ideas from different creative designers from different location
and share a bonus between the bright ideas
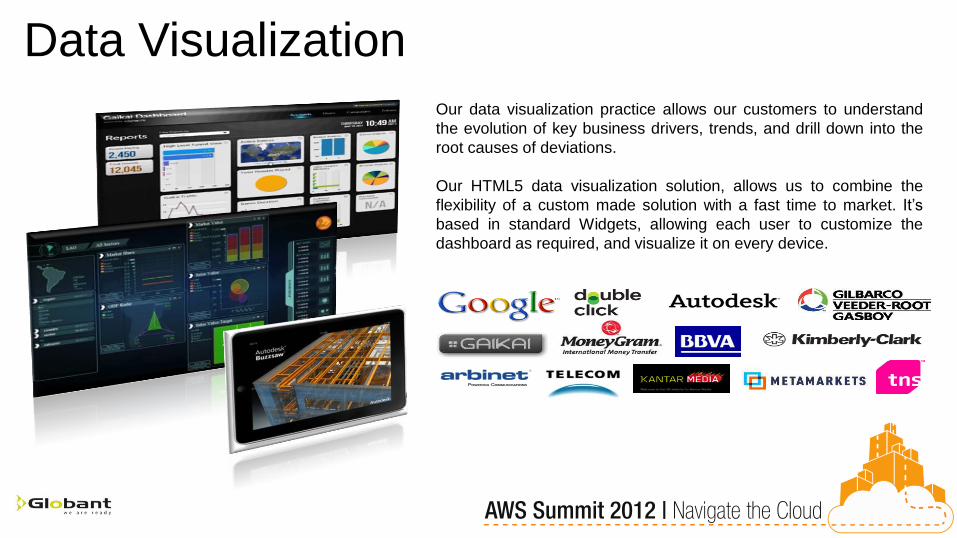
Our data visualization practice allows our customers to understand
the evolution of key business drivers, trends, and drill down into the
root causes of deviations.
Our HTML5 data visualization solution, allows us to combine the
flexibility of a custom made solution with a fast time to market. It’s
based in standard Widgets, allowing each user to customize the
dashboard as required, and visualize it on every device.
Data Visualization

Big Data Visualization Framework

Cloud server Browser User input
Video streaming


Kantar Media manages TV Advertisement displayed on DirecTV US.
We developed the addressable advertisement reporting solution, used by advertisers to plan and analyze the
performance of addressable advertisement.
Advertisement displayed on TV is customized to each user profile. The solution allows obtaining reliable
measurements from TV, analyzes the structure of the audience that has watched each advertisement, and
allows evaluating the ROI of the marketing campaign.


Touch screen based
scorecard, used by
the top management
to analyze and
compare results from
different countries
and products.

Thank you!