globe specialty metals - the global investment banking firm · 750,000 tons consumed by silicones...
TRANSCRIPT
Globe Specialty Metals
August 2014

1
Silicon – Product Line & End Markets
Silicon
99% Si content 75% Si alloyed with Fe 50% Si alloyed with
Fe, Mg & rare earths
New product development & expanding uses driven by R&D (e.g. electric cars, semiconductors)
Silicon Metal
53% of Revenue
Silicon Alloys
47% of Revenue
Note: Revenue percentages exclude 49% of the joint ventures owned by Dow Corning

2
GSM: The Leader in Silicon – Well Positioned for Further Growth
The lowest cost silicon producer and one of the world’s largest
• Owner of 100% of merchant capacity in North America (6 N.A. smelters). Other producer is Dow Corning, producing for internal consumption
• Leading global silicon alloys producer
Global reach with 13 facilities in 6 countries – U.S., Canada, Argentina, Poland, China, and South Africa
Strong, flexible balance sheet – designed for growth
Built and run by entrepreneurs with strong and proven M&A and operational backgrounds and unique investment approach
3
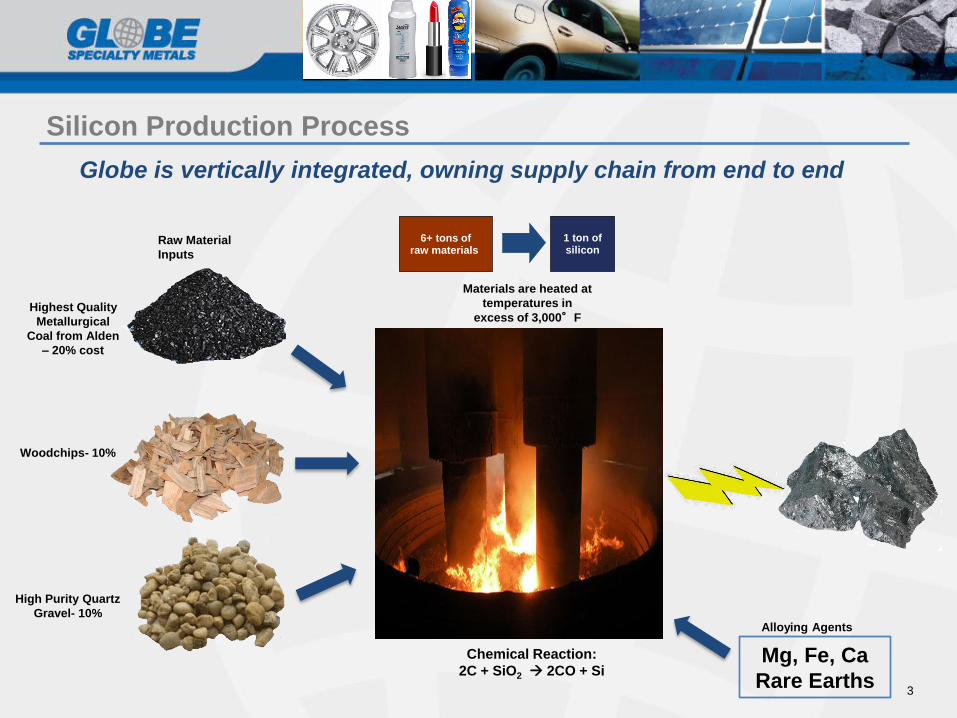
Silicon Production Process
Raw Material
Inputs
Highest Quality
Metallurgical
Coal from Alden
– 20% cost
Woodchips- 10%
High Purity Quartz
Gravel- 10%
Materials are heated at
temperatures in
excess of 3,000°F
6+ tons of raw materials
1 ton of silicon
Chemical Reaction:
2C + SiO2 2CO + Si
Globe is vertically integrated, owning supply chain from end to end
Alloying Agents
Mg, Fe, Ca
Rare Earths

4
North America81%
Asia/Other4%
Europe11%
South America4%
Well-Diversified Business in Growing Markets
Revenue Mix End-markets
Customers – Minimal Concentration
Note: All data exclude the 49% of the joint ventures owned by Dow Corning Data represents fiscal year 2013 results
Revenue by region
Silicon, 53%
Silicon Alloys, 47%
11%
6%
4%
3% 2% 2%
2% 2%
2% 2%
Other 58%
Aluminum20%
Silicones15%
Polysilicon10%
Other16%
Steel16%
Foundry Alloys21%

5
2004 2005 2006 2007 2008 2009 2010 2011 2012 2013 Acquisition of Selma, AL Alloy, WV Mendoza, Camargo, Yonvey, Core Metals, Alden, KY Becancour, Siltech,
Assets Niagara, NY AS&G, AL Argentina Brazil China AL Canada South Africa
Beverly, OH Alloy Power San Luis, MPM, IN
Argentina
Divestiture of Alloy Power Camargo
Assets Alloy - 49%
Estimated
Replacement Cost $2,275
Acquisition Price $404
Divestiture Price (295)
Total Net Investment $109
Multiple of
Net Investment
Total Replacement Cost less Divestitures: $1,980 18.2x
Total Enterprise Value Today: $1,541 14.1x
Continuing Growth through Key, Strategic, Timely & Accretive Acquisitions
$ in millions
Note: Management estimates using replacement value of $90M for a standard sized furnace

6
Global Production Footprint

7
Silicon End Markets: Silicones (50% of Silicon metal market)
750,000 tons consumed by silicones industry
GDP + 4% growth – NA silicones facilities running at full capacity
Note: % of sales figures represent industry estimates of western world consumption For additional detail on silicones end markets, visit www.silicones.eu
Paint
Grout Sealants
Cables
Tires
Weather stripping
Coatings
Dashboard
Caulking Shampoo Cosmetics

8
0
5,000
10,000
15,000
20,000
25,000
30,000
35,000
40,000
45,000
50,000
55,000
2003 2004 2005 2006 2007 2008 2009 2010 2011 2012 2013 2014E 2015E
2.0% 2.1%
3.9%
4.5%
7.1%
6.4%6.9%
7.8%
8.8%
10.4%
13.0%
0.0%
2.0%
4.0%
6.0%
8.0%
10.0%
12.0%
14.0%
1970 1975 1980 1985 1990 1995 2000 2005 2010 2015E 2020E
Silicon End Markets: Aluminum (40% of Silicon metal market) Silicon metal is required in aluminum as a strengthener and alloying agent to improve
castability and minimize shrinking and cracking
Significant growth expected in silicon-intensive aluminum wheels to meet EPA regulations for the trucking industry (aluminum wheels average 7.5% silicon content by weight)
Aluminum provides a lighter weight alternative to steel
Aluminum demand has increased at a 5%+ CAGR for the past 20 years
North American light vehicle aluminum content as a percent of curb weight
Source: Ducker Worldwide Note: Based on 3,600 lbs of curb weight
Global primary aluminum demand (000s tons)
Source: Bloomberg and Street research
343 pounds
77 pounds
Approx. 10kg of silicon metal per car
~500 pounds
9
-
100,000
200,000
300,000
400,000
500,000
600,000
700,000
800,000
0
10,000
20,000
30,000
40,000
50,000
60,000
70,000
2000 2001 2002 2003 2004 2005 2006 2007 2008 2009 2010 2011 2012 2013 2014E 2015E 2016E
2008 Estimates (Photon) Actual MW 2012 Estimates MW
Actual Silicon (tons) 2012 Estimates Silicon (Tons)
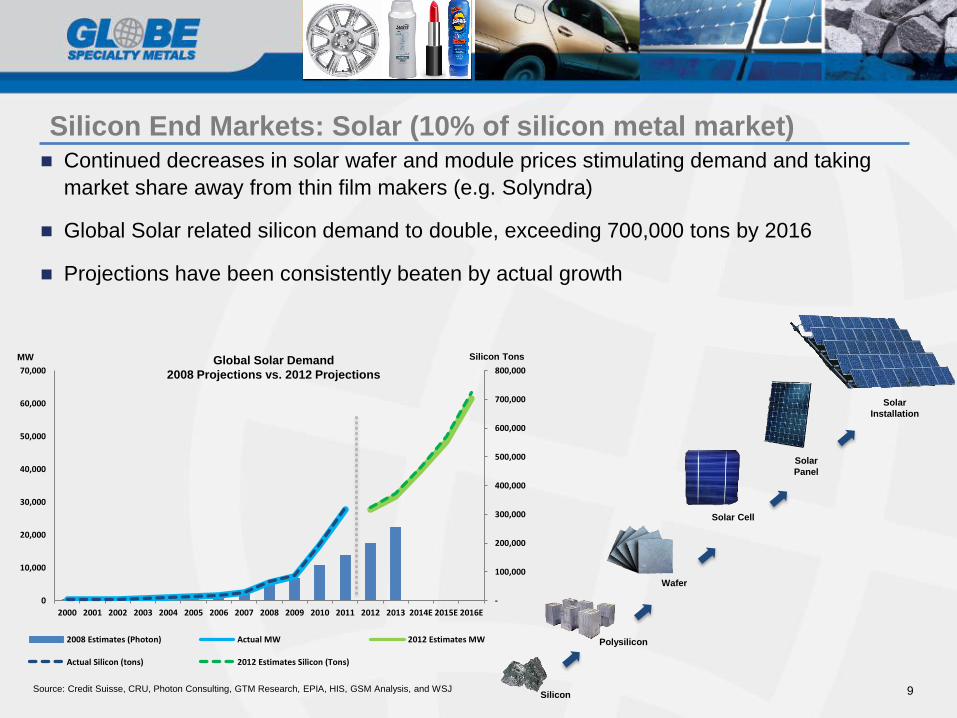
Silicon End Markets: Solar (10% of silicon metal market) Continued decreases in solar wafer and module prices stimulating demand and taking
market share away from thin film makers (e.g. Solyndra)
Global Solar related silicon demand to double, exceeding 700,000 tons by 2016
Projections have been consistently beaten by actual growth
Source: Credit Suisse, CRU, Photon Consulting, GTM Research, EPIA, HIS, GSM Analysis, and WSJ
Global Solar Demand
2008 Projections vs. 2012 Projections
MW Silicon Tons
Silicon
Polysilicon
Wafer
Solar Cell
Solar
Panel
Solar
Installation

10
Silicon End Markets: Semiconductors
Silane gas is an essential material used in the production of semi-conductors and LCD display panels
The three strongest demand areas for semiconductors will be NAND flash, logic application specific integrated circuits, and microprocessors
NAND and ASIC demand will be driven by media tablets and smartphones
Microprocessor growth will be driven by demand for computers, tablets, and smart phone devices
$200
$250
$300
$350
$400
2011 2012 2013 2014 2015 2016
Semiconductor Revenue ($ in Bn)
Source: IHS

11
Silicon Alloys End Markets: Steel (electrical steel)
Ferrosilicon (FeSi)
Calcium Silicon (CaSi)
Steel
Only 6 producers in Western World
~18% global market share and ~50% U.S. share
High grade specifications
Requires technical know-how
Used in production of carbon steels, stainless steels and other steel alloys
Technical expertise
Just-in-time delivery
1 of 2 U.S. producers
~50% U.S. capacity and ~40% North American capacity
Commodity Specialty

12
Ductile Iron Castings Ductile Iron Pipe
Magnesium Ferrosilicon (MgFeSi)
Foundry
Used in applications where strength and formability are required
− Automotive components
Often sole supplier
Water transmission
~50% share of the magnesium ferrosilicon market in the Americas and 20% in the Western World
Silicon Alloys End Markets: Foundry Products

13
Silicon End Markets: New Applications & Products
Example: Silicon anode Lithium-ion battery
Greater energy storage capabilities
Allows for smaller sizes batteries for electronic devices and electric cars
Energy storage for renewable energy sources

14
Silica Fume End Markets: Construction, Oil & Gas, Refractory
Collected in bag houses – sold to concrete, oil well and refractory end markets
Key benefits of silica fume:
• Physical strength of concrete up to 20,000 psi
• Very low permeability to water and chloride intrusion of cement
• Extremely high electrical resistivity (up to 100x greater than ordinary concrete)
• Increased resistance to chemical attack from acids, nitrates and sulfates
New applications have significantly added to demand and increases in price
GSM’s Silica Fume Used in:
Key Component in Hydraulic Fracturing Process Construction
(One World Trade Center-NYC)
Infrastructure/public works
(Panama Canal Expansion)
Oil Wells Refractory

15
New Capacity Pre-requisites
1. Capital cost, lead time, and permitting obstacles of green field construction
2. Technology and operational expertise
3. Power (35% of cost) – requires stable, long-term supply of low cost electricity.
4. Raw materials (40% of cost) – requires access to high purity, low cost raw materials
6+ tons of
raw materials 1 ton of silicon
Raw materials are emerging as the most critical differentiator – Globe owns its entire supply chain
The gas/energy revolution in the US should, in the near term, reduce energy costs & increase demand for its products

16
Globe’s Supply Chain has Key Logistical Advantages
Globe is vertically integrated--Owns its supply chain from end to end

17
Substantial Leverage to Price
Costs are stable and facilities are some of the most efficient in the world
Each 1¢/lb ($22/mt) increase in silicon & silicon alloys price leads to ~$5.3
million more in EBITDA at full capacity
0
50
100
150
200
250
300
350
400
450
500
$1.25$1.00
$1.35$1.10
$1.45$1.20
$1.55$1.30
$1.65$1.40
$1.75$1.50
$1.85$1.60
$1.95$1.70
EBITDA, $m
Incremental EBITDA
Silicon Metal PricingSilicon-Based Alloys Pricing

18
0
500
1,000
1,500
2,000
2,500
3,000
2005 2006 2007 2008 2009 2010 2011 2012 2013 2014E 2015E 2016E 2017E 2018E
Western World China & CIS
Global Silicon Consumption to Grow ~6% by 2018
Source: CRU
kMT
19
Third Party Low Ash Coal Sales
Only significant North American supplier of specialty low ash
metallurgical coal used in the production of SiM and specialty FeSi
Leverage coal assets to supply ultra special low ash coal to other silicon metal producers at a premium price
Best quality low ash coal in the world for silicon production — management estimates coal improves furnace efficiency up to 10%
Other currently available alternatives are Charcoal & Colombian coal
• Charcoal – more expensive and supply constrained
• Colombian coal – not as reactive with quartz - lower efficiency
20
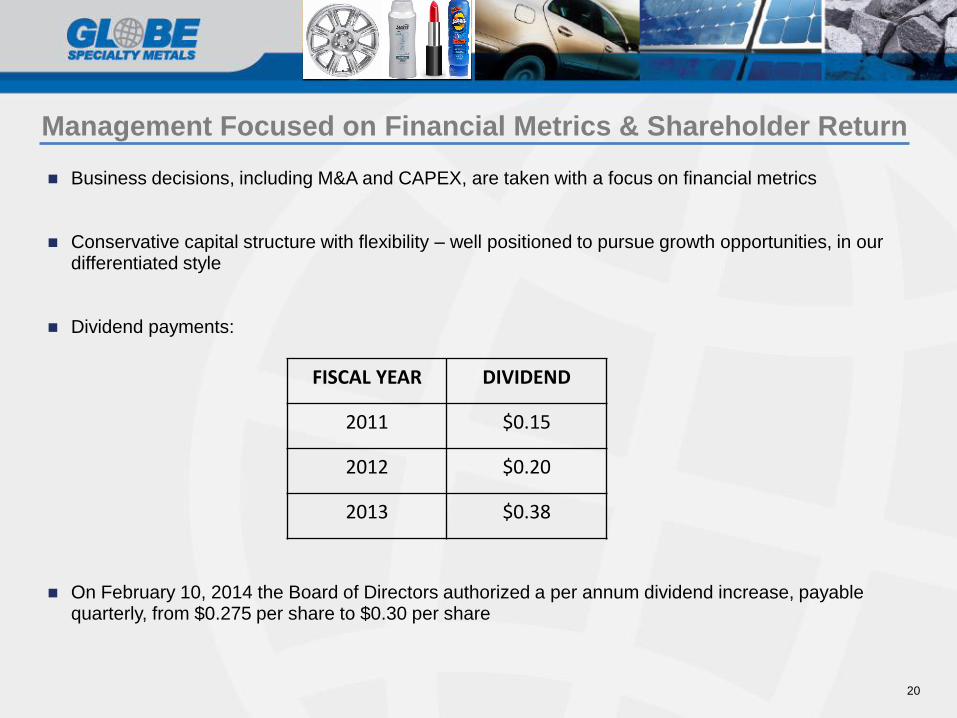
Management Focused on Financial Metrics & Shareholder Return
Business decisions, including M&A and CAPEX, are taken with a focus on financial metrics
Conservative capital structure with flexibility – well positioned to pursue growth opportunities, in our differentiated style
Dividend payments:
On February 10, 2014 the Board of Directors authorized a per annum dividend increase, payable quarterly, from $0.275 per share to $0.30 per share
FISCAL YEAR DIVIDEND
2011 $0.15
2012 $0.20
2013 $0.38
21
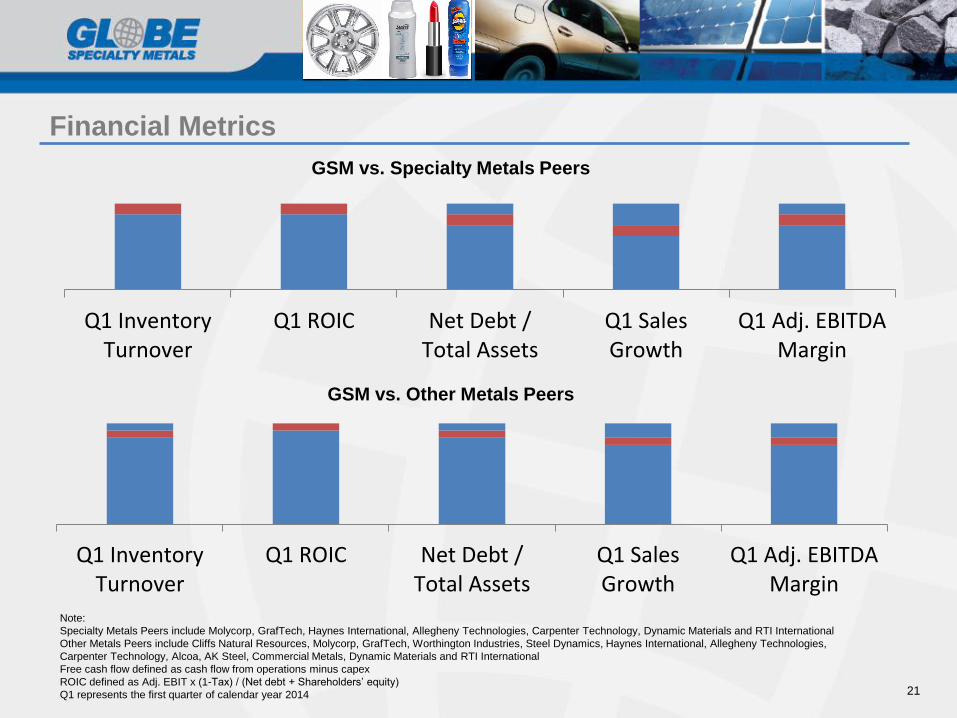
Financial Metrics
Q1 InventoryTurnover
Q1 ROIC Net Debt /Total Assets
Q1 SalesGrowth
Q1 Adj. EBITDAMargin
GSM vs. Specialty Metals Peers
Q1 InventoryTurnover
Q1 ROIC Net Debt /Total Assets
Q1 SalesGrowth
Q1 Adj. EBITDAMargin
GSM vs. Other Metals Peers
Note:
Specialty Metals Peers include Molycorp, GrafTech, Haynes International, Allegheny Technologies, Carpenter Technology, Dynamic Materials and RTI International
Other Metals Peers include Cliffs Natural Resources, Molycorp, GrafTech, Worthington Industries, Steel Dynamics, Haynes International, Allegheny Technologies,
Carpenter Technology, Alcoa, AK Steel, Commercial Metals, Dynamic Materials and RTI International
Free cash flow defined as cash flow from operations minus capex
ROIC defined as Adj. EBIT x (1-Tax) / (Net debt + Shareholders’ equity)
Q1 represents the first quarter of calendar year 2014

22
Globe’s Strategy & Roadmap
Global uncertainty
Shorter Cycles
Less forward visibility
Necessity of discipline
Increased risk of mis-timing and over paying for investments
Environment
Continue cyclical trough acquisitions at low costs
Patience
Discipline
High return investments
Globe’s Strategy
Faster Growth & Higher Returns

23
Highlights
Diverse and strong end markets
Leading cost position—with room for further improvements
• Vertical integration
• New capacity pre-requisites
Strong balance sheet
Significant access to deal flow at opportune time
Substantial leverage to price
Shareholder friendly
Strong entrepreneurial management team with:
• Strong M&A and operational track record
• Focus on financial metrics which drives decision making
• Significant investment in company

APPENDIX
25
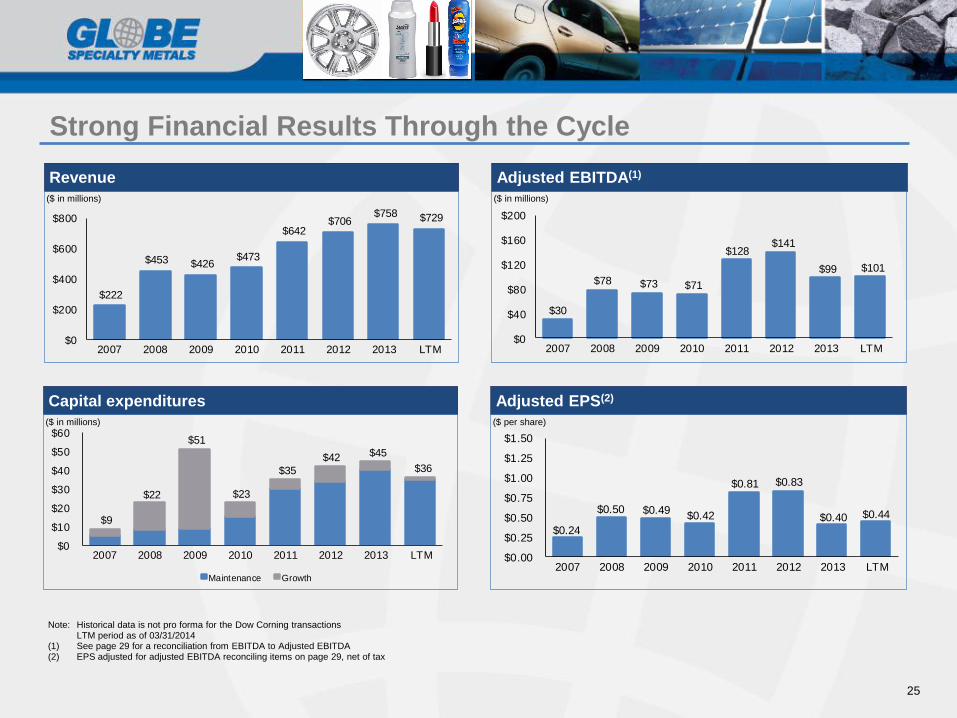
Strong Financial Results Through the Cycle
Adjusted EBITDA(1)
($ in millions)
Revenue
($ in millions)
Note: Historical data is not pro forma for the Dow Corning transactions LTM period as of 03/31/2014 (1) See page 29 for a reconciliation from EBITDA to Adjusted EBITDA (2) EPS adjusted for adjusted EBITDA reconciling items on page 29, net of tax
Adjusted EPS(2)
($ per share)
Capital expenditures
($ in millions)
$222
$453 $426 $473
$642 $706
$758 $729
$0
$200
$400
$600
$800
2007 2008 2009 2010 2011 2012 2013 LTM
$30
$78 $73 $71
$128 $141
$99 $101
$0
$40
$80
$120
$160
$200
2007 2008 2009 2010 2011 2012 2013 LTM
$9
$22
$51
$23
$35
$42 $45
$36
$0
$10
$20
$30
$40
$50
$60
2007 2008 2009 2010 2011 2012 2013 LTM
Maintenance Growth
$0.24
$0.50 $0.49 $0.42
$0.81 $0.83
$0.40 $0.44
$0.00
$0.25
$0.50
$0.75
$1.00
$1.25
$1.50
2007 2008 2009 2010 2011 2012 2013 LTM

26
Management Team
Alan Kestenbaum, Executive Chairman
Founded GSM through the roll-up of global silicon assets and subsequently led GSM through it’s IPO on NASDAQ and several key acquisition
and divestitures
Over 20 years' experience in metals trading, distribution, finance and manufacturing
Founded leading international metals trader, Marco International, in 1985 and led its expansion into China and former Soviet Union
Managed a series of successful metals private equity transactions
Began his career in metals with Glencore and Philip Brothers in New York
Joseph Ragan, Chief Financial Officer
Joined GSM in 2013
CFO of Boart Longyear 2008-2013
Prior roles include: CFO, GTSI Corp; Interim CFO for several underperforming companies; CFO, US Operations of Winstar Communications;
Vice President, PSEG Global; Subsidiary CFO, The AES Corporation; Consultant, Deloitte & Touche; Military Intelligence Officer, US Army
Jeff Bradley, Chief Executive Officer
30 years experience in the metals industry
Joined GSM in 2008
Prior roles include: CEO – Claymont Steel (former public company); Vice President and General Manager – Worthington Industries
27
Board of Directors
GSM’s Board of Directors is comprised of seasoned executives with strong management, metals,
finance and international experience
Alan Kestenbaum (Executive Chairman)
Stuart Eizenstat
− Partner, Covington & Burling LLP; Former Deputy Secretary of the United States Department of the Treasury; International Advisory Board Member of Coca-Cola, Board Member of UPS
Franklin Lavin
− Chairman of the Public Affairs practice for Asia-Pacific at Edelman; Former Managing Director and Chief Operating Officer of Cushman & Wakefield Investors Asia; Former Under Secretary for International Trade at the United States Department of Commerce
Donald Barger, Jr.
− Former Chief Financial Officer at YRC Worldwide, Worthington Industries and Hillenbrand Industries; Board Member and Audit Chair of Gardner Denver and Quanex
Alan Schriber
− Former Chair of the Public Utilities Commission of Ohio and professor of economics
Bruce Crockett
− Chairman Invesco Mutual Funds Group and Board Member of the Investment Company Institute; former President and CEO of COMSTAT Corporation
28
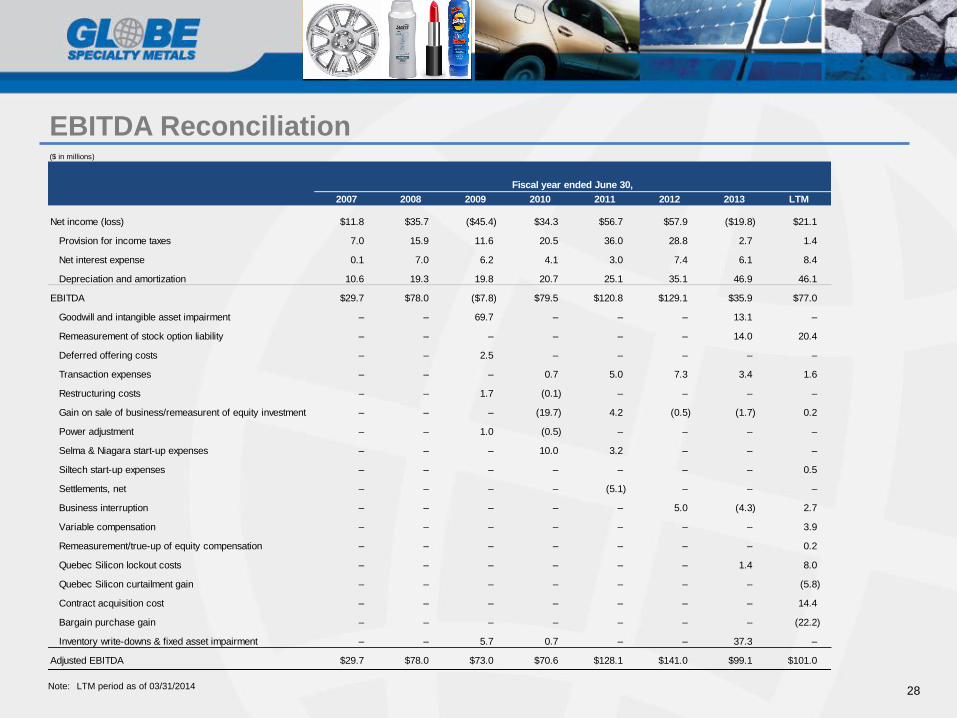
EBITDA Reconciliation
($ in millions)
Fiscal year ended June 30,
2007 2008 2009 2010 2011 2012 2013 LTM
Net income (loss) $11.8 $35.7 ($45.4) $34.3 $56.7 $57.9 ($19.8) $21.1
Provision for income taxes 7.0 15.9 11.6 20.5 36.0 28.8 2.7 1.4
Net interest expense 0.1 7.0 6.2 4.1 3.0 7.4 6.1 8.4
Depreciation and amortization 10.6 19.3 19.8 20.7 25.1 35.1 46.9 46.1
EBITDA $29.7 $78.0 ($7.8) $79.5 $120.8 $129.1 $35.9 $77.0
Goodwill and intangible asset impairment – – 69.7 – – – 13.1 –
Remeasurement of stock option liability – – – – – – 14.0 20.4
Deferred offering costs – – 2.5 – – – – –
Transaction expenses – – – 0.7 5.0 7.3 3.4 1.6
Restructuring costs – – 1.7 (0.1) – – – –
Gain on sale of business/remeasurent of equity investment – – – (19.7) 4.2 (0.5) (1.7) 0.2
Power adjustment – – 1.0 (0.5) – – – –
Selma & Niagara start-up expenses – – – 10.0 3.2 – – –
Siltech start-up expenses – – – – – – – 0.5
Settlements, net – – – – (5.1) – – –
Business interruption – – – – – 5.0 (4.3) 2.7
Variable compensation – – – – – – – 3.9
Remeasurement/true-up of equity compensation – – – – – – – 0.2
Quebec Silicon lockout costs – – – – – – 1.4 8.0
Quebec Silicon curtailment gain – – – – – – – (5.8)
Contract acquisition cost – – – – – – – 14.4
Bargain purchase gain – – – – – – – (22.2)
Inventory write-downs & fixed asset impairment – – 5.7 0.7 – – 37.3 –
Adjusted EBITDA $29.7 $78.0 $73.0 $70.6 $128.1 $141.0 $99.1 $101.0
Note: LTM period as of 03/31/2014