glycated albumin 7
DESCRIPTION
glycated albumin and diabetesTRANSCRIPT

1 Tabaci Street, Craiova, Romania, 200642; Tel: 0040740243654
corresponding author e-mail: [email protected]
GLYCATED ALBUMIN – MORE THAN THE MISSING LINK IN THE EVALUATION OF DIABETES CONTROL
Ilie-Robert Dinu , Eugen Moţa University of Medicine and Pharmacy Craiova
received: April 09, 2014 accepted: April 29, 2014
available online: June 15, 2014
Abstract
Diabetes mellitus represents a major public health problem in the world and glycemic control is very important in subjects with diabetes. Glycation of many proteins is increased in subjects with diabetes compared with persons without diabetes. Glycated albumin (GA) has emerged as a possible glycation index for intermediate-term diabetes control. There is evidence that GA can be considered a better parameter than glycated haemoglobin in many conditions including pregnancy, chronic kidney disease, liver diseases and anemia. Several reports indicate that GA plays a role in the pathogeny of diabetes complications, mainly in diabetic nephropathy and retinopathy. There are several limitations for using GA including the lack of standardization in the laboratories. Several studies are needed in order to understand the place of GA in the pathogeny of diabetes complications and the role in assessing the metabolic control. key words: glycated albumin, glycated hemoglobin, diabetes, complications
Introduction Diabetes mellitus represents a major public
health problem in the world with an increasing prevalence and important medical and social consequences. According to the sixth edition of the IDF Atlas, there are 382 million people with diabetes in the world and the number will rise to 592 million by 2035 [1]. Glycemic control is very important in subjects with diabetes. Many large trials have indicated that strict glycemic control can reduce the risk of development of complications in diabetic patients [2,3].
It is known that glycation of many proteins is increased in subjects with diabetes compared with persons without diabetes. Some of the glycated proteins are used for the evaluation of diabetes control and some of them are suggested
to be involved both in the development but also in the progression of chronic diabetes complications [4]. From all of the glycated proteins, the glycated hemoglobin (HbA1c) is used as the gold standard index of glycemic control in clinics and in study design. In the last years, the glycated albumin (GA) has emerged as a possible glycation index for evaluation of intermediate-term diabetes control. This review focuses on the role of the GA in the assessment of metabolic control, the methods for its measurement and its possible role in diabetes complications.
The glycation of albumin Most of the proteins in the human body can
be glycated. Glucose molecules can join to
© 2014 ILEX PUBLISHING HOUSE, Bucharest, Roumania
http://www.jrdiabet.ro Rom J Diabetes Nutr Metab Dis. 21(2):137-150
doi: 10.2478/rjdnmd-2014-0019
UnauthenticatedDownload Date | 2/16/15 12:20 PM

138 Romanian Journal of Diabetes Nutrition & Metabolic Diseases / Vol. 21 / no. 2 / 2014
protein molecules to form stable ketoamines through glycation, a non-enzymatic mechanism. The high content of lysine and arginine in the primary structure of albumin makes this protein a potential target for glycation. GA is a ketoamine formed via a non-enzymatic glycation reaction of serum albumin [5].
Albumin is one of the most abundant proteins in blood plasma. It is produced in hepatocytes and it constitutes about half of the blood serum protein. It is soluble and monomeric. The albumin reference range in blood is 3.4 to 5.4 g/dL. The serum half-life of albumin is approximately 20 days and its molecular mass is 67 kDa. Approximately 10% of the albumin in normal human serum is modified by nonenzymatic glycosylation, primarily at the epsilon-amino group of lysine residue 525 [6].
Glycation and oxidation are the most common major non-enzymatic mechanisms.
Non-enzymatic glycation, also called Maillard reaction, is a process in which glucose reacts spontaneously with amine containing molecules, such as proteins. The reaction proceeds through many stages; initially, glucosylamines (Schiff bases) are formed, then fructosamines (Amadori compounds), and aminoaldoses (Heyns compounds) and ultimately it leads to the formation of irreversible glycation end products. They include crosslinks, aromatic heterocycles, and other oxidized compounds, that are generally named advanced glycation end products (AGEs). The concentration levels of these products are very elevated in diabetes, and several data from numerous studies suggest that non-enzymatic glycation and AGE formation is important in the etiology of diabetes complications [7].
The glycation of hemoglobin and the formation of glycated hemoglobin are represented in Figure 1.
Figure 1. Non-enzymatic glycation of hemoglobin (adapted from [8]).
The glycation of albumin implies a slow, non-enzymatic reaction initially when glucose or its derivatives are attached to free amine groups of albumin, leading to formation of stable ketoamine (Figure 2).
Methods for the measurement of GA There are several methods used in the
isolation and quantification of GA. They include (a) enzymatic assay, (b) high-performance liquid chromatography (HPLC) and affinity
UnauthenticatedDownload Date | 2/16/15 12:20 PM

Romanian Journal of Diabetes Nutrition & Metabolic Diseases / Vol. 21 / no. 2 / 2014 139
chromatography, (c) immunoassay, including quantification by radio-immunoassay, (d) enzyme-linked immunosorbent assay (ELISA),
(e) enzyme-linked boronate immunoassay (ELBIA), (f) colorimetry, and (g) electrochemical [9].
Figure 2. Non-enzymatic glycation of albumin (adapted from [4]).
In the United States, most of the laboratories use affinity chromatography and state reference values for GA in the range of 0.6–3.0%. Few laboratories perform an enzymatic assay indicating a GA reference range of 11–16%. Almost half the scientific and clinical reports regarding GA measurement in the last decades indicate normal GA values of 2.6% or lower, consistent with the majority of reference laboratories. Almost a quarter of these reports indicate normal values in the range of 5–9%. Other reports indicate normal values between 10–20%, in line with the enzymatic reference determination. Overall, typical GA values for subjects with diabetes are 2–5 times above the normal values for a given reporting method [9].
Monoclonal isolation associated with ELISA but also immunonephelemetry (turbidimetric) and gel electrophoresis with bromcresol green (BCG) showed GA values in a lower range of reported values. Other assays have replaced the thiobarbituric acid (TBA) method including nitroblue tetrazolium and 2-keto-glucose with hydrazine. Improvement of BCG has led to the Hitachi automated BCG-dye binding analyzer and it indicates results in agreement with another reported method for the quantification of nonglycated human serum albumin using lateral
chromatography and immunofluorescence [9,10].
Recently, a user friendly, automated enzymatic assay (Lucica GA-L kit, Asahi Kasei Pharma, Tokyo, Japan) for determining GA has been developed. It can be used with automated general biochemical analyzers, and the kit reagents are liquid, making prior preparation unnecessary. Because both serum and plasma samples can be used, GA can be analyzed along with other parameters such as glucose, cholesterol and triglycerides, without requiring a separate blood collection. A separate sample of whole blood is required for HbA1c. Also, the assay is stable even for samples stored for a long period of time (frozen for 19–23 years). Moreover, this assay offers reproductivity and specificity. This assay has correlated very highly (r = 0.99) with values for GA obtained by the HPLC assay [7,11].
GA in the screening for diabetes Because of the increasing prevalence of
diabetes in the world, new methods for the screening of diabetes are necessary. Nowadays only blood glucose levels and recently introduced criteria of HbA1c are used for the diagnosis of diabetes. In order to test the utility
UnauthenticatedDownload Date | 2/16/15 12:20 PM

140 Romanian Journal of Diabetes Nutrition & Metabolic Diseases / Vol. 21 / no. 2 / 2014
of GA for diagnosing diabetes, a community-based population study was done in Japan - the Kyushu and Okinawa Population Study (KOPS) [12]. The study indicated that GA levels did not differ by sex, while HbA1c levels were significantly higher in men than in women. The Atherosclerosis Risk in Communities (ARIC) study in the United States also showed significant differences between sex in HbA1c, but no such significant difference in GA [13]. Thus, when evaluating GA one does not have to take gender into account.
The ARIC study demonstrated that GA was strongly associated with the subsequent risk of diabetes, and the association remained significant after adjustment for fasting glucose or HbA1c level [13]. KOPS, based on a community population of healthy Japanese participants with no history of diabetes, showed that a GA level of
15.5% is best for discriminating patients with diabetes from those without diabetes. This cut-off value had a sensitivity of 83.3% and a specificity of 83.3% in a receiver operating characteristic (ROC) analysis where the area under the ROC curve was 0.91 [12]. According to the KOPS findings, fasting plasma glucose concentrations of 100 mg/dL (5.56 mmol/L), 110 mg/dL (6.11 mmol/L), and 126 mg/dL (7.00 mmol/L) corresponded to HbA1c (National Glycohemoglobin Standardization Program: NGSP) and GA levels of 5.6% (38 mmol/mol), 5.9% (41 mmol/mol) and 6.3% (45 mmol/mol), and 15.0%, 15.7% and 16.9%, respectively (Table 1). The GA:HbA1c (NGSP) ratio was 2.68. These data indicate that GA is a useful marker for the screening of diabetes in a routine medical evaluation [7].
Table 1. Correspondence of the hemoglobin A1c (HbA1c), glycated albumin (GA), and fasting plasma glucose (FPG) levels in the participants from the KOPS study (adapted from [7]).
FPG 100 mg/dL 110 mg/dL 126 mg/dL 5.56 mmol/L 6.11 mmol/L 7.00 mmol/L
HbA1c (%) (NGSP) 5.6 5.9 6.3 GA (%) 15.0 15.7 16.9
Ma et al. assessed the validity of GA in
screening of subjects with undiagnosed diabetes in a Chinese population. They also determined the role of the combination of FPG and GA in enhancing the efficacy of diabetes screening [14]. The authors concluded that GA is a highly sensitive and convenient test for diabetes screening and a GA value of 17.1%, the optimal cut-off point in these subjects, identified a very high proportion of potentially diabetic individuals. Moreover, the dual criteria of FPG ≥ 6.1mmol/L and GA ≥ 17.1% increased the sensitivity of diabetes screening and it would avoid the majority of oral glucose tolerance tests. [14].
GA in assessing the glycemic control Diabetes monitoring is generally managed
by combining daily self-monitoring of blood glucose (SMBG) measurements with physician-assessed HbA1c levels every 3–6 months. Many reports have indicated the utility of A1C as a long-term glycemic index. The half-life of the red blood cells containing hemoglobin is approximately 120 days and the relative quantity of glycated hemoglobin in a patient’s blood indicates the average glycemic value over a period of a few months. The use of A1c test as a gold standard happened because it has been shown to predict the risk of developing diabetes complications [9].
UnauthenticatedDownload Date | 2/16/15 12:20 PM

Romanian Journal of Diabetes Nutrition & Metabolic Diseases / Vol. 21 / no. 2 / 2014 141
The use of short-term indicators of glycemic control for people with diabetes is no longer limited to the assessment of glucose in blood, plasma, serum, or other body fluids. Serum 1,5-anhydroglucitol (1,5-AG) is known as a nonprotein marker for monitoring short-term glycemic control and it has been used for more than a decade in Japan under the name GlycoMark™. It could reflect glucose’s competitive inhibition of the reabsorption of 1,5-AG in the kidney tubule and it represents diabetic status over a 24 hours period [15]. In a study that included subjects with type 1 and type 2 diabetes showing good to moderate control, 1,5-AG was able to reflect postprandial glycemic excursions better than either A1C or the intermediate indicator, fructosamine (FA). Nevertheless, it is not recommended for monitoring gestational diabetes, because of the instability of renal hemodynamics during pregnancy. Another marker for short-term control is apolipoprotein B, a component of low-density lipoproteins (LDLs), that also becomes glycated. This protein is very important because of its involvement in atherogenesis. The half-life of circulating LDLs is 3–5 days, so the glycated LDL level reflects mean glycemia over the preceding week [9].
In the last 15–20 years, many reports have indicated the use of serum protein indicators, specifically FA and GA, as a method to evaluate glycemic status over 2–4 weeks, reflecting the half-lives of these molecules in serum. Fructosamine represents the sum of all ketoamine linkages that result from the glycation of circulating serum proteins and the name comes from the chemical similarity to fructose. The measurement of FA was easily automated and this assay was relatively inexpensive to perform. FA measurement remains popular in some countries outside the United States [16]. The experience gathered with FA testing has
indicated the potential benefit of an intermediate index to retrospectively evaluate changes in diet and metabolic control and to allow a rapid evaluation of changes in medication dosages [9].
Several authors indicated that the concentration of GA in serum, having a half-life of 12–19 days, would represent an excellent index of recent ambient glycemia [17]. Albumin can be easily measured in the blood and it would fill the time gap between SMBG and A1C at approximately 1 month.
Changes in Short-Term Glycemic Status Several studies have shown that GA is a
better marker than HbA1c for monitoring short-term variations of glycemic control during treatment, for patients with type 1 and type 2 diabetes [18]. Thus, GA measurement can play an important role in guiding the control of glycemia, serving as an intermediate-term index. Studies based on self-monitoring of blood glucose and continuous glucose monitoring have found GA levels to better reflect glycemic fluctuation [19].
Numerous data indicate that postprandial glucose level is a better predictor than HbA1c of diabetic retinopathy in type-2 diabetes [20]. Postprandial hyperglycemia is generally caused by inadequate endogenous insulin secretion [21]. Even among patients with similar HbA1c levels, GA reflects adequately postprandial hyperglycemia [19]. In addition, GA levels are reported to be better correlated than HbA1c with the severity of cardiovascular disease, and better indicate glycemic fluctuations [9]. The measurement of GA has great merit in terms of glycemic control, especially for postprandial hyperglycemia and glycemic fluctuation.
Since the half-life of albumin is shorter than that of erythrocytes, GA changes more rapidly in cases where the status of glycemic control is modified during short term [22]. To evaluate the
UnauthenticatedDownload Date | 2/16/15 12:20 PM

142 Romanian Journal of Diabetes Nutrition & Metabolic Diseases / Vol. 21 / no. 2 / 2014
usefulness of GA, intensive insulin therapy was performed as the initial treatment in 8 patients with type 2 diabetes mellitus with poor glycemic control [23]. It was noted only a mild decrease in averaged HbA1C from 10.9% to 10.0%, while averaged GA decreased markedly from 35.6% to 25.0%. The changes of HbA1C and GA during 2 weeks were -0.9% and -10.6%, respectively, and the decrease of GA was approximately 10 times greater than that of HbA1C. When glycemic control changes shortly due to the start or change of diabetes treatment, GA is a more suitable index of glycemic control than HbA1C [4].
On the other hand, GA increases prior to HbA1C when glycemic control status worsens during short term. Therefore in such conditions, GA allows to detect at an earlier stage the worsening of glycemic control. It is known that HbA1C remains normal or only mildly elevated at the diagnosis of fulminant type 1 diabetes mellitus in which pancreatic β cells are rapidly destroyed, resulting in an increase in plasma glucose and ketoacidosis in the very short term. Koga and Kasayama examined HbA1C and GA at diagnosis in patients with fulminant type 1 diabetes mellitus [4]. Due to the increase of plasma glucose during very short term, the extent of the elevation of GA was larger than that of HbA1C at the diagnosis of fulminant type 1 diabetes mellitus. As a result, the GA/HbA1C ratio was significantly higher in patients with fulminant type 1 diabetes mellitus at diagnosis than those with untreated type 2 diabetes mellitus. When a GA/HbA1C ratio ≥ 3.2 is regarded as a cutoff value, the sensitivity and specificity of differentiating fulminant type 1 diabetes mellitus at diagnosis from untreated type 2 diabetes mellitus were 97% and 98%, respectively [4]. Therefore, the authors suggested that a high GA/HbA1C ratio is helpful for diagnosing fulminant type 1 diabetes mellitus.
Evaluation of Postprandial Hyperglycemia Several epidemiological studies have shown
that postload hyperglycemia becomes a risk factor for cardiovascular diseases. The DECODE study [24] or Funagata study [25] revealed that postload plasma glucose in the glucose tolerance test is a more potent risk factor for cardiovascular events than fasting plasma glucose. Furthermore, it has been reported that administration of the α glucosidase inhibitor acarbose to patients with impaired glucose tolerance or diabetes mellitus was associated with cardiovascular risk reduction (STOP-NIDDM trial) [26].
HbA1C is considered primarily to be an index which reflects the mean plasma glucose levels. Several recent reports suggested that GA is an index which more strongly reflects postprandial plasma glucose rather than mean plasma glucose. In general, plasma glucose fluctuates over a greater range in patients with type 1 diabetes mellitus compared with patients with type 2 diabetes mellitus. In view of this phenomenon, in patients with type 1 diabetes mellitus and those with type 2 diabetes mellitus who show no difference in HbA1C value, the GA value is significantly higher in the former. The authors speculated that GA may more strongly reflect postprandial plasma glucose and range of plasma glucose fluctuations than HbA1C [4].
When relationship between HbA1C and GA was examined in patients with type 2 diabetes mellitus, GA/HbA1C ratio was significantly higher in subjects receiving insulin treatment than in patients receiving diet therapy or oral hypoglycemic drugs [27]. Insulin secretion determined by the homeostasis model assessment pancreatic β–cell function (HOMA-%β) was significantly lower in the patients receiving insulin treatment than that in the
UnauthenticatedDownload Date | 2/16/15 12:20 PM

Romanian Journal of Diabetes Nutrition & Metabolic Diseases / Vol. 21 / no. 2 / 2014 143
patients not receiving insulin treatment. There was a significant inverse correlation in GA/HbA1C ratio and HOMA-%β, reflecting decreased endogenous insulin secretion involved in increased value of the GA/HbA1C ratio. Thus, it was suggested that a decrease in the insulin secretion increases the glycemic excursion, causing increase of the GA/HbA1C ratio.
Recently, plasma glucose levels throughout the day can be measured by means of the continuous glucose monitor (CGM) system. A study on the relationship between the CGM system data and the index of glycemic control was reported. Among the patients with diabetes mellitus showing poor glycemic control, GA indicated a more potent relationship with differences of plasma glucose levels and plasma glucose fluctuation index than HbA1C and 1,5-AG [28].
GA in monitoring glycemic excursions during pregnancy Women with pre-gestational diabetes but
also their fetuses are at very high risk of developing complications compared with the pregnant women without diabetes, including spontaneous abortion, hypertensive disorders and preterm labor. Women with gestational diabetes mellitus (GDM) also can develop similar complications, usually not of the same magnitude. Gestational diabetes mellitus represents ~90% of cases of pregnancies complicated by diabetes, with potentially long-reaching consequences that include high risk of subsequently developing type 2 diabetes for both mother and child [29].
In pregnant women displaying diabetes mellitus and those with gestational diabetes, intensive glycemic control during pregnancy is needed to lower the associated risks. Phelps et al. [30] showed biphasic changes in HbA1C levels during pregnancy, with HbA1C levels lowest at gestational week 24. One of the
reasons why HbA1C decreases from the first trimester to the second trimester of pregnancy is considered to be the decrease in plasma glucose levels, but the reason why HbA1C increases again from the second trimester to the third trimester is unknown. Sanaka, et al. [31] reported that HbA1C increases from the second trimester to the third trimester of pregnancy in non-diabetic cases, whereas GA does not vary much during this period. Therefore, it was suggested that HbA1C might exhibit high values independent of plasma glucose levels from the second trimester to the third trimester during pregnancy.
It is known that iron demand is increased and iron deficiency often occurs in the third trimester of pregnancy. Transferrin saturation and serum ferritin decreased from the second trimester to the third trimester of pregnancy, and thus most women became iron deficient in the third trimester. Since HbA1C showed significant inverse correlations with these values, it can be concluded that the increase of HbA1C in the third trimester of pregnancy was caused by iron deficiency [32]. In pregnant women with diabetes mellitus, HbA1C increased and transferrin saturation and serum ferritin decreased from the second trimester to the third trimester of pregnancy, while GA showed no significant change. Since HbA1C again showed a significant inverse correlation with transferrin saturation, it was concluded that, in pregnant women with diabetes mellitus, HbA1C increases due to iron deficiency in the third trimester [33]. Moreover, a long period of time is needed to modify the HbA1c value. These findings suggest that HbA1C is not an appropriate index of glycemic control during pregnancy. Meanwhile, GA is not affected by iron deficiency and has the advantage of reflecting the short-term status of glycemic control, and is thus considered to be a preferable index of glycemic control during
UnauthenticatedDownload Date | 2/16/15 12:20 PM

144 Romanian Journal of Diabetes Nutrition & Metabolic Diseases / Vol. 21 / no. 2 / 2014
pregnancy. Since the threshold of reabsorption of glucose decreases in renal tubules, resulting in renal glycosuria during pregnancy, serum 1,5-AG indicates a low value [34]. Therefore, serum 1,5-AG is inadequate as an index of glycemic control during pregnancy.
GA and Chronic Kidney Disease (CKD) Unlike the randomized interventional studies
in the general population without established CKD, no data exist in established diabetic CKD concerning the impact of tight glycemic control on future morbidity and mortality. Data on the effect of long-term glycemic control are very limited and whether tight glucose regulation is beneficial and correlates with the risk of death or hospitalization in diabetic patients with ESRD (End Stage Renal Disease) remains controversial [35]. There is some evidence from observational studies that good glycemic control, assessed using glycated hemoglobin (HbA1c) as a marker, prevents progression of nephropathy, reduces morbidity and improves survival in patients with advanced CKD and in people requiring haemodialysis (HD) [36]. More recently, Drechsler et al. [37] demonstrated in the post hoc analysis of a four-dimensional study in diabetic HD patients a 2-fold increase in the risk of sudden death in the group with poor glycaemic control (HbA1c > 8%) compared to a good glycemic-controlled group (HbA1c ≤ 6%). However, risk of myocardial infarction and mortality (excluding sudden death) did not differ between groups.
While HbA1c has proven to be a reliable prognostic marker in the general diabetic population, it may not be valid in patients with diabetes and CKD. Whether HbA1c corresponds to the same mean glucose concentrations in people with ESRD is debated [38]. Several features present in CKD have a significant impact on HbA1c concentrations and its values
may be falsely low. Besides glucose, HbA1c is influenced by other factors including hemoglobin, the lifespan of the red blood cells (RBCs), recombinant human erythropoietin (rHuEpo), the uraemic environment and blood transfusions. In patients with CKD, and particularly those on HD, the RBC lifespan is significantly reduced with 20–50% [39]. The subsequent increased rate of hemoglobin turnover leads to decreased exposure time to ambient glucose that in turn lowers the extent of non-enzymatic binding of glucose to hemoglobin. This results in reduced value for HbA1c. Thus, in subjects with CKD and a shortened RBC lifespan, lower HbA1c levels are observed than would be expected from measured glucose control [40].
Furthermore, when erythropoietin is administered to patients with renal anemia, HbA1C shows even lower values because lifespan of erythrocytes is shortened [38]. Meanwhile, it has been reported that GA is a useful index of glycemic control in hemodialysis patients with diabetes because GA is not affected by renal anemia [38]. Additionally, in the examination of patients with diabetes mellitus receiving peritoneal dialysis, it was shown that GA reflects properly the status of glycemic control whereas HbA1C does not [41].
Iron deficiency elevates the level of HbA1c independently of glucose and hemoglobin levels [42]. However, once treatment is initiated with iron supplementation, HbA1c concentrations decrease significantly as a result of the production of immature cells. In CKD, an increased amount of carbamylated hemoglobin is formed under uraemic conditions. This acquired form of hemoglobin interferes with some HbA1c assays (only charge-dependent assays), predominantly by incomplete separation of the carbamylated hemoglobin fraction, resulting in an overestimation of HbA1c values. The
UnauthenticatedDownload Date | 2/16/15 12:20 PM

Romanian Journal of Diabetes Nutrition & Metabolic Diseases / Vol. 21 / no. 2 / 2014 145
interference is significant when urea levels exceed 30mmol/L [43]. Moreover, other hemoglobin modifications occur due to various molecules that accumulate in CKD such as advanced glycation end-products, which may bind to hemoglobin and causing more potential interference [43].
In contrast, in patients with diabetic nephropathy (stage III or IV) presenting marked proteinuria, it should be noted that GA shows a lower value relative to plasma glucose levels as a result of the increased turnover of albumin metabolism. Observations of 98 hemodialysis patients with diabetes mellitus for 11 years indicated that the prognosis in the group with a GA value ≥29.0% at the start of hemodialysis was significantly poorer than that in the group with a GA value <29.0% [44].
These results show that glycemic control status in hemodialysis patients with diabetes is also involved in their prognosis, and that glycemic control status should be judged by GA, not by HbA1C.
GA and anemia HbA1C presents lower values in relation to
glycemia in patients with hemolytic anemia, because lifespan of erythrocytes is shortened in these patients. On the other hand, patients with iron deficiency anemia present higher HbA1C values relative to plasma glucose levels [45]. HbA1C also shows higher levels in relation to glycemia even in iron deficient state without anemia [46]. Iron deficiency anemia is the most frequently seen anemia.
Since approximately one half of premenopausal women are in iron deficient status, a great number of premenopausal women present high HbA1C values relative to plasma glucose levels [45]. On the other hand, when patients with iron deficiency anemia are treated with iron supplements, HbA1C decreases
because lifespan of erythrocytes shortens [47]. In contrast, GA is not influenced by these conditions, and thus GA is a preferable index of glycemic control in premenopausal women who frequently suffer from iron deficiency anemia [47].
GA and chronic liver diseases Liver is a pivotal organ regulating plasma
glucose levels and glucose metabolic abnormalities occur frequently in patients with chronic liver diseases, such as chronic hepatitis and liver cirrhosis. In patients with liver disease, about 70-90% are diagnosed with impaired glucose tolerance and 30-60% of them have diabetes mellitus [48]. It is important to achieve and keep a good glycemic control because chronic liver disease (CLD) patients with poor glycemic control have been shown to exhibit a poor prognosis [4].
HbA1C is apparently lower in relation to glycemia because of the shortened half-life of erythrocytes [49] caused by the hypersplenism in these patients. On the contrary, GA and fructosamine levels are apparently higher in relation to glycemia in these patients because of prolonged half-life of serum albumin originating from reduced synthesis of albumin in vivo [50]. Therefore, it is difficult to monitor glycemic control status accurately in patients with liver disease, because none of the known markers reflects it precisely. Several authors investigated the relationship between plasma glucose levels and glycemic control markers in these CLD patients [50]. In comparison with HbA1C estimated from the mean plasma glucose levels [53], measured HbA1C showed lower values while GA/3 (GA indicates approximately 3 times the value of HbA1C, thus the HbA1C value can be predicted from GA/3) showed higher values in CLD patients. The discrepancy between HbA1C or GA/3 and estimated HbA1C
UnauthenticatedDownload Date | 2/16/15 12:20 PM
146 Romanian Journal of Diabetes Nutrition & Metabolic Diseases / Vol. 21 / no. 2 / 2014
increased when hepatic function decreased. Instead, HbA1C calculated as the mean of HbA1C and GA/3 was found closely matched with HbA1C estimated from the mean plasma glucose levels. Therefore, calculated HbA1C is useful as an index of glycemic control in these patients [4].
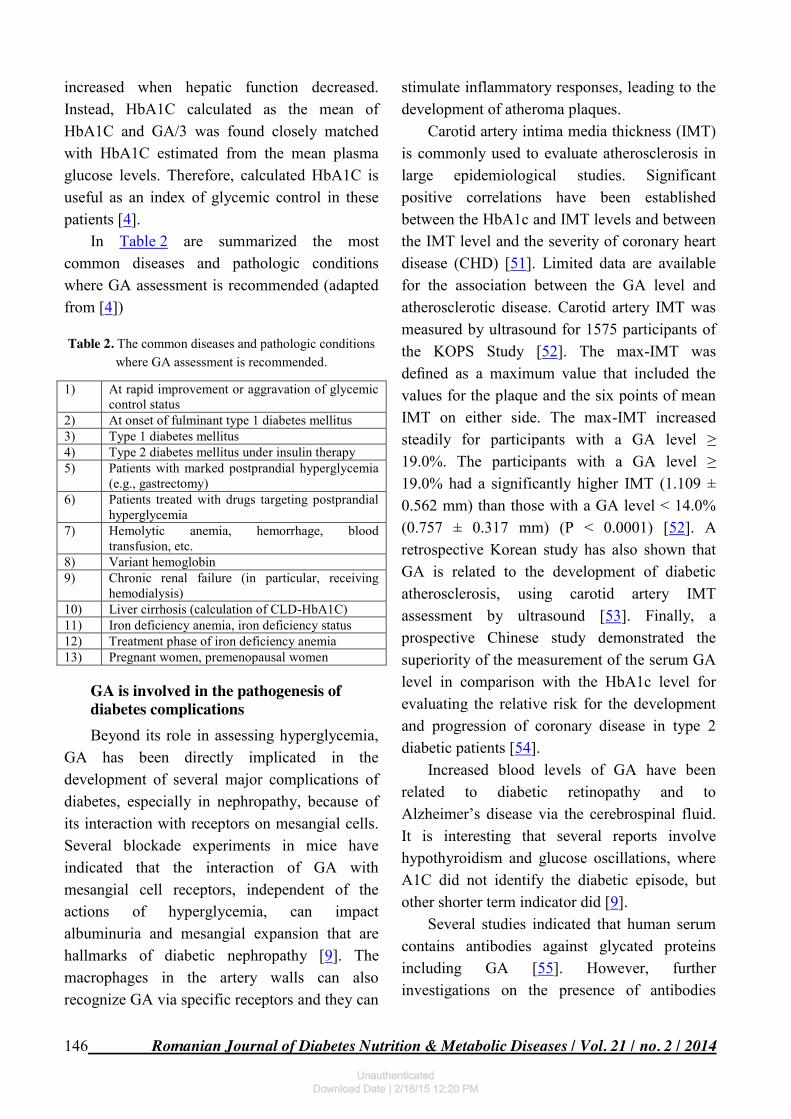
In Table 2 are summarized the most common diseases and pathologic conditions where GA assessment is recommended (adapted from [4])
Table 2. The common diseases and pathologic conditions where GA assessment is recommended.
1) At rapid improvement or aggravation of glycemic control status
2) At onset of fulminant type 1 diabetes mellitus 3) Type 1 diabetes mellitus 4) Type 2 diabetes mellitus under insulin therapy 5) Patients with marked postprandial hyperglycemia
(e.g., gastrectomy) 6) Patients treated with drugs targeting postprandial
hyperglycemia 7) Hemolytic anemia, hemorrhage, blood
transfusion, etc. 8) Variant hemoglobin 9) Chronic renal failure (in particular, receiving
hemodialysis) 10) Liver cirrhosis (calculation of CLD-HbA1C) 11) Iron deficiency anemia, iron deficiency status 12) Treatment phase of iron deficiency anemia 13) Pregnant women, premenopausal women
GA is involved in the pathogenesis of diabetes complications Beyond its role in assessing hyperglycemia,
GA has been directly implicated in the development of several major complications of diabetes, especially in nephropathy, because of its interaction with receptors on mesangial cells. Several blockade experiments in mice have indicated that the interaction of GA with mesangial cell receptors, independent of the actions of hyperglycemia, can impact albuminuria and mesangial expansion that are hallmarks of diabetic nephropathy [9]. The macrophages in the artery walls can also recognize GA via specific receptors and they can
stimulate inflammatory responses, leading to the development of atheroma plaques.
Carotid artery intima media thickness (IMT) is commonly used to evaluate atherosclerosis in large epidemiological studies. Significant positive correlations have been established between the HbA1c and IMT levels and between the IMT level and the severity of coronary heart disease (CHD) [51]. Limited data are available for the association between the GA level and atherosclerotic disease. Carotid artery IMT was measured by ultrasound for 1575 participants of the KOPS Study [52]. The max-IMT was defined as a maximum value that included the values for the plaque and the six points of mean IMT on either side. The max-IMT increased steadily for participants with a GA level ≥ 19.0%. The participants with a GA level ≥ 19.0% had a significantly higher IMT (1.109 ± 0.562 mm) than those with a GA level < 14.0% (0.757 ± 0.317 mm) (P < 0.0001) [52]. A retrospective Korean study has also shown that GA is related to the development of diabetic atherosclerosis, using carotid artery IMT assessment by ultrasound [53]. Finally, a prospective Chinese study demonstrated the superiority of the measurement of the serum GA level in comparison with the HbA1c level for evaluating the relative risk for the development and progression of coronary disease in type 2 diabetic patients [54].
Increased blood levels of GA have been related to diabetic retinopathy and to Alzheimer’s disease via the cerebrospinal fluid. It is interesting that several reports involve hypothyroidism and glucose oscillations, where A1C did not identify the diabetic episode, but other shorter term indicator did [9].
Several studies indicated that human serum contains antibodies against glycated proteins including GA [55]. However, further investigations on the presence of antibodies
UnauthenticatedDownload Date | 2/16/15 12:20 PM

Romanian Journal of Diabetes Nutrition & Metabolic Diseases / Vol. 21 / no. 2 / 2014 147
against glycated proteins are needed in diabetes patients with or without diabetic complications. If characterized, these antibodies would be very useful in early diagnosis of the disease.
Other studies correlated the levels of GA or the GA/HbA1c ratio with the progression of liver fibrosis in hepatitis B virus- or hepatitis C virus-positive [56,57].
Limitations of GA The GA level is significantly correlated with
HbA1c level (NGSP). However, some discrepancies exist between the levels of HbA1c and GA in certain pathologic disease states including anemia, chronic liver diseases, and nephrotic syndrome. Although GA is not influenced by anemia and variant hemoglobin, it is influenced in patients with disorders of albumin metabolism. GA shows lower values in relation to glycemia in patients with nephrotic syndrome, hyperthyroidism [58], and glucocorticoid administration in which albumin metabolism increases. Meanwhile, GA presents higher values relative to plasma glucose levels in patients with liver cirrhosis and hypothyroidism in which albumin metabolism decreases [58].
In obese subjects, GA values were found to be lower in relation to glycemia [59]. It is known that chronic micro-inflammation is generated by inflammatory cytokines secreted from adipocytes in obese subjects, and a significant positive correlation was noted between BMI and high sensitive C-reactive protein. Moreover, a significant inverse correlation between high sensitive C-reactive protein and GA was observed [59]. Based on these results, Koga et al. proposed the theory that chronic micro-inflammation increases albumin catabolism in obese subjects, and, as a result of the shortened half life of albumin, GA decreases relative to plasma glucose levels [59]. It has been shown that GA was lower in relation to plasma glucose
levels in smokers, hyperuricemic patients, hypertriglyceridemia and men with nonalcoholic fatty liver disease (NAFLD) with high alanine aminotransferase (ALT) levels in whom chronic inflammation is evoked [4].
GA is significantly lower in infants than adults. GA levels in infants significantly increase with age [60]. This can be explained by the fact that the plasma glucose level of infants is lower than that of adults, and that higher albumin metabolism is associated with a lower GA levels.
Despite the ongoing debates about the interpretation of HbA1c, there is no consensus on a suitable cut-off value for HbA1c across different racial or ethnic populations. In the ARIC study, differences between the African-American and the Caucasian population in GA, fructosamine, and 1,5-AG levels parallel the differences in HbA1c among both non-diabetic and diabetic subjects [61]. The findings may imply a similarity between GA and HbA1c on racial and ethnic differences.
Future perspectives There are few studies regarding GA
although the last years brought to light the numerous roles of GA in the pathogeny of diabetes complications and its usefulness in evaluating the metabolic control. Many studies have to be done in order to establish the cut-off values and a standardized method for its evaluation before endorsing it as powerful tool in the hand of clinicians.
Conclusions GA represents a useful parameter for the
evaluation of glycemic control for a medium period of time, almost a month. It represents the missing link between SMBG and HbA1c is supposed to have also implications in the pathogenesis of the complications of diabetes mellitus. Due to its properties, it appears to be a
UnauthenticatedDownload Date | 2/16/15 12:20 PM

148 Romanian Journal of Diabetes Nutrition & Metabolic Diseases / Vol. 21 / no. 2 / 2014
better indicator for metabolic control in several conditions such as pregnancy, chronic kidney disease, anemia and liver disease. Numerous
studies are requested in order to fully understand this molecule and its role in evaluating and worsening diabetes.
REFERENCES 1. International Diabetes Federation. IDF
Diabetes Atlas, 6th edn. Brussels, Belgium: International Diabetes Federation, 2013. http://www.idf.org/ diabetesatlas.
2. The Diabetes Control and Complications Trial Research Group. The effect of intensive treatment of diabetes on the development and progression of long term complications in insulin dependent diabetes mellitus. N Eng J Med 329: 977-86, 1993.
3. UK prospective Diabetes Group. Intensive blood glucose control with sulphonylurea or insulin compared with conventional treatment and risk of complications in patients with type 2 diabetes (UKPDS 33). Lancet 352: 837-53, 1998.
4. Koga M, Kasayama S. Clinical impact of glycated albumin as another glycemic control marker. Endocr J 57: 751-762, 2010.
5. Kim KJ, Lee BW. The roles of glycated albumin as intermediate glycation index and pathogenic protein. Diab Metab J 36: 98–107, 2012.
6. Mukherjee B, Patra S, Das AK. Glycated albumin and glycated hemoglobin- A comparison. Int J of Biomed Res 4: 381–386, 2013.
7. Furusyo N, Hayashi J. Glycated albumin and diabetes mellitus. Biochem Biophys Acta 1830: 5509–5514, 2013.
8. Hinzmann R, Schlaeger C, Tran CT. What do we need beyond hemoglobin A1c to get the complete picture of glycemia in people with diabetes? Int J Med Sci 9: 665-681, 2012.
9. Roohk HV, Zaidi AR. A review of glycated albumin as an intermediate glycation index for controlling diabetes. J Diabetes Sci Technol 2: 1114–1121, 2008.
10. Choi S, Choi EY, Kim DJ et al. A rapid, simple measurement of human albumin in whole blood using a fluorescence immunoassay (I). Clin Chim Acta 339: 147–156, 2004.
11. Kohzuma T, Koga M. Lucica GA-L glycated albumin assay kit: a new diagnostic test for diabetes mellitus, Mol Diagn Ther 14: 49–51, 2010.
12. Furusyo N, Koga T, Ai M et al. Utility of glycated albumin for the diagnosis of diabetes mellitus in a Japanese population study: results from the Kyushu and Okinawa Population Study (KOPS), Diabetologia 54: 3028–3036, 2011.
13. Selvin E, Francis LM, Ballantyne CM et al. Nontraditional markers of glycemia: associations with microvascular conditions, Diabetes Care 34: 960–967, 2011.
14. Ma XJ, Pan JM, Bao YQ et al. Combined assessment of glycated albumin and fasting plasma glucose improves the detection of diabetes in Chinese subjects. Clin Exp Pharmacol Physiol 37: 974–979, 2010.
15. Dungan KM, Buse JB, Largay J et al. 1,5-anhydroglucitol and postprandial hyperglycemia as measured by continuous glucose monitoring system in moderately controlled patients with diabetes. Diabetes Care 29: 1214–1219, 2006.
16. Carter AW, Borchardt N, Cooney M et al. Dual-test monitoring of hyperglycemia using daily glucose and weekly fructosamine values. Diabetes Technol Ther 3: 399–403, 2001.
17. Cohen MP, Clements RS. Measuring glycated proteins: clinical and methodological aspects. Diabetes Technol Ther 1: 57–70, 1999.
18. Yoshiuchi K, Matsuhisa M, Katakami N et al. Glycated albumin is a better indicator for glucose excursion than glycated hemoglobin in type 1 and type 2 diabetes. Endocr J 55: 503–507, 2008.
19. Suwa T, Ohta A, Matsui T et al. Relationship between clinical markers of glycemia and glucose excursion evaluated by continuous glucose monitoring (CGM), Endocr J 57: 135–140, 2010.
20. Shiraiwa T, Kaneto H, Miyatsuka T et al. Postprandial hyperglycemia is a better predictor of the progression of diabetic retinopathy than HbA1c in Japanese type 2 diabetic patients, Diabetes Care 28: 2806–2807, 2005.
21. Jones AG, Besser RE, Shields BM et al. Assessment of endogenous insulin secretion in insulin
UnauthenticatedDownload Date | 2/16/15 12:20 PM

Romanian Journal of Diabetes Nutrition & Metabolic Diseases / Vol. 21 / no. 2 / 2014 149
treated diabetes predicts postprandial glucose and treatment response to prandial insulin, BMC Endocr Disord 12: 6, 2012.
22. Takahashi S, Uchino H, Shimizu T et al. Comparison of glycated albumin (GA) and glycated hemoglobin (HbA1C) in type 2 diabetic patients: usefulness of GA for evaluation of short-term changes in glycemic control. Endocr J 54: 139-144, 2007.
23. Kohzuma T, Koga M. Lucica GA-L glycated albumin assay kit: A new diagnostic test for diabetes mellitus. Mol Diagn Ther 14: 49-51, 2010.
24. The DECODE study group. Glucose tolerance and mortality: comparison of WHO and American Diabetes Association diagnostic criteria. Lancet 354: 617-621, 1999.
25. Tominaga M, Eguchi H, Manaka H et al. Impaired glucose tolerance is a risk factor for cardiovascular disease, but not impaired fasting glucose. The Funagata Diabetes Study. Diabetes Care 22: 920-924, 1999.
26. Chiasson JL, Josse RG, Gomis R et al. STOP-NIDDM Trial Research Group. Acarbose treatment and the risk of cardiovascular disease and hypertension in patients with impaired glucose tolerance: the STOP-NIDDM trial. JAMA 290: 486-494, 2003.
27. Koga M, Murai J, Saito H et al. Glycated albumin and glycated hemoglobin are differently influenced by endogeneous insulin secretion in patients with type 2 diabetes mellitus. Diabetes Care 33: 270-272, 2010.
28. Suwa T, Ohta A, Matsui T et al. Relationship between clinical markers of glycemia and glucose excursion evaluated by continuous glucose monitoring (CGM). Endocr J 57: 135-140, 2010.
29. Seshiah V, Balaji V, Srinivasan A et al. Comparison of Glycated Albumin (GA) and Glycosylated Hemoglobin (A1C) in monitoring glycemic excursions during pregnancy. Open J Obstet Gynecol 3: 47-50, 2013.
30. Phelps RL, Honig GR, Green D et al. Biphasic changes in haemoglobin A1c concentrations during normal human pregnancy. Am J Obstet Gynecol 147: 651-653, 1983.
31. Sanaka M. Management of pregnant patients with diabetes mellitus. Diabetes J 34: 127-135, 2006.
32. Hashimoto K, Noguchi S, Morimoto Y et al. A1C but not serum glycated albumin is elevated in late
pregnancy owing to iron deficiency. Diabetes Care 31: 1945-1948, 2008.
33. Hashimoto K, Osugi T, Noguchi S et al. A1C but not serum glycated albumin is elevated because of iron deficiency in late pregnancy in diabetic women. Diabetes Care 33: 509-511, 2010.
34. Tetsuo M, Hamada T, Yoshimatsu K et al. Serum levels of 1,5-anhydro-Dglucitol during the normal and diabetic pregnancy and puerperium. Acta Obstet Gynecol Scand 69: 479-485, 1990.
35. Okada T, Nakao T, Matsumoto H et al. Association between markers of glycemic control, cardiovascular complications and survival in type 2 diabetic patients with end-stage renal disease. Intern Med 46: 807–814, 2007.
36. Kalantar-Zadeh K, Kopple JD, Regidor DL et al. A1C and survival in maintenance hemodialysis patients. Diabetes Care 30: 1049–1055, 2007.
37. Drechsler C, Krane V, Ritz E et al. Glycemic control and cardiovascular events in diabetic hemodialysis patients. Circulation 120: 2421–2428, 2009.
38. Peacock T, Shihabi Z, Bleyer A et al. Comparison of glycated albumin and hemoglobin A1c levels in diabetic subjects on hemodialysis. Kidney Int 73: 1062–1068, 2008.
39. Vos FE, Schollum JB, Coulter CV et al. Red blood cell survival in patients on long-term dialysis. Am J Kidney Dis 58: 591–598, 2011.
40. Vos FE, Schollum JB, Walker RJ. Glycated albumin is the preferred marker for assessing glycemic control in advanced chronic kidney disease. NDT Plus 4: 368–375, 2011.
41. Freedman BI, Shenoy RN, Planer JA et al. Comparison of glycated albumin and hemoglobin A1c concentrations in diabetic subjects on peritoneal and hemodialysis. Perit Dial Int 30: 72-79, 2010.
42. Kim C, Bullard KM, Herman WH et al. Association between iron deficiency and A1C Levels among adults without diabetes in the National Health and Nutrition Examination Survey, 1999-2006. Diabetes Care 33: 780–785, 2010.
43. Weykamp CW, Penders TJ, Siebelder CW et al. Interference of carbamylated and acetylated hemoglobins in assays of glycohemoglobin by HPLC, electrophoresis, affinity chromatography, and enzyme immunoassay. Clin Chem 39: 138–142, 1993.
UnauthenticatedDownload Date | 2/16/15 12:20 PM

150 Romanian Journal of Diabetes Nutrition & Metabolic Diseases / Vol. 21 / no. 2 / 2014
44. Fukuoka K, Nakao K, Morimoto H et al. Glycated albumin levels predict long-term survival in diabetic patients undergoing haemodialysis. Nephrology 13: 278-283, 2008.
45. Kim C, Bullard KM, Herman WH et al. Association between iron deficiency and A1C Levels among adults without diabetes in the National Health and Nutrition Examination Survey, 1999-2006. Diabetes Care 33: 780-785, 2010.
46. Koga M, Morita S, Saito H et al. Association of erythrocyte indices with glycated haemoglobin in pre-menopausal women. Diabetic Med 24: 843-847, 2007.
47. Koga M, Murai J, Saito H et al. Usefullness of glycated albumin as a glycemic control marker after iron treatment for diabetic patients with iron deficiency anemia. J Jpn Diab Soc 52: 341-345, 2009.
48. Kingston ME, Ali MA, Atiyeh M et al. Diabetes mellitus in chronic active hepatitis and cirrhosis. Gastroenterology 87: 688-694, 1984.
49. Nomura Y, Nanjo K, Miyano M et al. Hemoglobin A1 in cirrhosis of the liver. Diabetes Res 11: 177-180, 1989.
50. Bando Y, Tachibana Y, Fukuoka K et al. Clinical study of long-term glycemic control makers in patients with chronic liver disease. J Jpn Diab Soc 40: 17-24, 1997.
51. Bobbert T, Mai K, Fischer-Rosinsky A et al. A1C is associated with intima-media thickness in individuals with normal glucose tolerance. Diabetes Care 33: 203–204, 2010.
52. Furusyo N, Koga T, Ai M et al. Plasma glycated albumin level and atherosclerosis: results from the Kyushu and Okinawa Population Study (KOPS). Int J Cardiol 167: 2066-2072, 2013.
53. Song SO, Kim KJ, Lee BW et al. Serum glycated albumin predicts the progression of carotid
arterial atherosclerosis. Atherosclerosis 225: 450–455, 2012.
54. Pu LJ, Lu L, Shen WF et al. Increased serum glycated albumin level is associated with the presence and severity of coronary artery disease in type 2 diabetic patients. Circ J 71: 1067–1073, 2007.
55. Ansari NA, Dash D. Amadori glycated proteins: role in production of autoantibodies in diabetes mellitus and effect of inhibitors on non-enzymatic glycation. Aging Dis 4: 50–56, 2013.
56. Enomoto H, Aizawa N, Nakamura H et al. An increased ratio of glycated albumin to HbA1c is associated with the degree of liver fibrosis in hepatitis B virus-positive patients. Gastroenterol Res Pract 2014: 351396, 2014.
57. Aizawa N, Enomoto H, Imanishi H et al. Elevation of the glycated albuminto glycated hemoglobin ratio during the progression of hepatitis C virus related liver fibrosis. World J Hepatol 4: 11–17, 2012.
58. Koga M, Murai J, Saito H et al. Effect of thyroid hormone on serum glycated albumin levels: Study on non-diabetic subjects. Diabetes Res Clin Pract 84: 163-167, 2009.
59. Koga M, Otsuki M, Matsumoto S et al. Negative association of obesity and its related chronic inflammation with serum glycated albumin but not glycated hemoglobin levels. Clin Chim Acta 378: 48-52, 2007.
60. Suzuki S, Koga M, Niizeki N et al. Glycated albumin is lower in infants than in adults and correlated with both age and serum albumin. Pediatr Diabetes 14: 25–30, 2013.
61. Selvin E, Steffes MW, Ballantyne CM et al. Racial differences in glycemic markers: a cross-sectional analysis of community-based data. Ann Intern Med 154: 303–309, 2011.
UnauthenticatedDownload Date | 2/16/15 12:20 PM