glycine and the hydrogen bond: toward a model for solvation
TRANSCRIPT

Retrospective Theses and Dissertations Iowa State University Capstones, Theses andDissertations
1995
Glycine and the hydrogen bond: toward a modelfor solvationJan Halborg JensenIowa State University
Follow this and additional works at: https://lib.dr.iastate.edu/rtd
Part of the Physical Chemistry Commons
This Dissertation is brought to you for free and open access by the Iowa State University Capstones, Theses and Dissertations at Iowa State UniversityDigital Repository. It has been accepted for inclusion in Retrospective Theses and Dissertations by an authorized administrator of Iowa State UniversityDigital Repository. For more information, please contact [email protected].
Recommended CitationJensen, Jan Halborg, "Glycine and the hydrogen bond: toward a model for solvation " (1995). Retrospective Theses and Dissertations.11006.https://lib.dr.iastate.edu/rtd/11006

INFORMATION TO USERS
This manuscript has been reproduced from the microfilm master. UMI
filTTT; the text directly from the original or copy submitted. Thus, some
thesis and dissertation copies are in typewriter face, while others may
be from any type of computer printer.
The quality of this reproduction is dependent upon the quality of the copy submitted. Broken or indistinct print, colored or poor quality illustrations and photographs, print bleedthrough, substandard margins, and improper aligmnent can adversely affect reproduction,
In the unlikely event that the author did not send UMI a complete
manuscript and there are missing pages, these will be noted. Also, if
imauthorized copyright material had to be removed, a note will indicate
the deletion.
Oversize materials (e.g., maps, drawings, charts) are reproduced by
sectioning the original, beginning at the upper left-hand comer and
continuing &om left to right in equal sections with small overlaps. Each
original is also photographed in one exposure and is included in
reduced form at the back of the book.
Photographs included in the original manuscript have been reproduced xerographically in this copy. Higher quality 6" x 9" black and white
photographic prints are available for aity photographs or illustrations
appearing in this copy for an additional charge. Contact UMI directly
to order.
A Bell & Howell Information Company 300 North Zeeb Road. Ann Arbor, Ml 48106-1346 USA
313/761-4700 800/521-0600


Glycine and the hydrogen bond: Toward a model for solvation
by
Jan Halborg Jensen
A Dissertation Submitted to the
Graduate Faculty in Partial Fulfillment of the
Requirements for the Degree of
DOCTOR OF PHILOSOPHY
Department: Chemistry Major; Physical Chemistry
Approved: Members of the Committee;
In Charge of Major Work
For the Graduate Colle^
For thWVIaior Department
Iowa State University Ames, Iowa
1995
Signature was redacted for privacy.
Signature was redacted for privacy.
Signature was redacted for privacy.
Signature was redacted for privacy.
Signature was redacted for privacy.
Signature was redacted for privacy.
Signature was redacted for privacy.

UMI Number: 9606613
DMI Microform 9606613
Copyright 1995, by UMI Company. All rights reserved.
This microform edition is protected against unauthorized
copying under Title 17, United States Code.
UMI 300 North Zeeb Road
Ann Arbor, MI 48103

ii
To my parents Anker and Karen-Marie, and to my wife Maja
"Without theory there are no questions;
without questions, no learning.
Hence, without theory there is no learning."
W. Edwards Deming
"It should also be recalled that when we talk of 'life' on other planets we are frequently
referring to amino acids, which are never very gregarious, even at parties."
Woody Allen

iii
TABLE OF CONTENTS
ACKNOWLEDGMENTS vi
ABSTRACT vii
CHAPTER L GENERAL INTRODUCTION 1
I. General Overview 1
II. Dissertation Organization 1
III. Theoretical Background 2
References 5
CHAPTER 2. AS/iV/7/0 LOCALIZED CHARGE DISTRIBUTIONS: THEORY AND A DETAILED ANALYSIS OF THE WATER DIMER-HYDROGEN BOND 6
Abstract 6
I. Introduction 6
n. Theory 8
ni. A Detailed Analysis Of The Water Dimer-Hydrogen Bond 20
rV. Summary 33
V. Appendix: Further Details 35
Acknowledgments 41
References 41
CHAPTER 3. AN EFFECTIVE FRAGMENT METHOD FOR MODELING INTERMOLECULAR HYDROGEN BONDING EFFECTS ON QUANTUM MECHANICAL CALCULATIONS 68
Abstract 68
Introduction 69
Philosophy Behind The EfT Method 69
Constructing An Effective Fragment 72
Locating Stationary Points 78

iv
Applications 79
Conclusions and Future Directions 84
Acknowledgments 84
Literature Cited 84
CHAPTER 4. AN APPROXIMATE FORMULA FOR THE INTERMOLECULAR PAULI REPULSION BETWEEN CLOSED SHELL MOLECULES 93
Abstract 93
I. Introduction 93
II. Computational Methodology 95
III. Theory and Applications 95
rV. Conclusions and Future Directions 107
V. Appendix 108
References 109
CHAPTER 5. THE CONFORMATIONAL POTENTIAL ENERGY SURFACE OF GLYCmE: A THEORETICAL STUDY 114
Abstract 114
Introduction 114
Computational Methods 116
Results and Discussion 118
Conclusions 130
Acknowledgments 131
References 131
CHAPTER 6. THE UNCATALYZED PEPTIDE BOND FORMATION IN THE GAS PHASE 147
Abstract 147
I. Introduction 147

V
II. Computational Approach 151
III. Results And Discussion 154
IV. Conclusions 166
Acknowledgments 168
References 168
CHAPTER 7. ON THE NUMBER OF WATER MOLECULES NECESSARY TO STABILIZE THE GLYCINE ZWITTERION 191
Abstract 191
I. Introduction 191
n. Computational Methodology 193
III. Results 197
IV. Analysis 210
V. Summary 216
Acknowledgments 218
References 218
CHAPTERS. CONCLUSIONS 238

vi
ACKNOWLEDGMENTS
I must start by thanking my parents. This Ph.D. dissertation is a direct resuh of the
unwavering support and encouragment they have given me since I first showed an interest in
science.
Of course, not a page in this dissertation could have been written without the
guidance of Mark Gordon. I would like to thank him for being a such caring advisor and a
such a good friend. He is a teacher in the truest sense of the word. I would also like to thank
the members of his research group; especially Mike Schmidt for much help and many, many,
many discussions.
Finally, I must thank my wife Maja for all her love.

vii
ABSTRACT
The research presented in this dissertation covers two main areas. One area is the
development of a model aimed at understanding the hydrogen bond. The other area is the
study of the chemistry of the amino acid glycine. In both cases the underlying theor>' used is
ab initio electronic structure theory. The study of hydrogen bonding specifically entails: 1) a
detailed analysis of the water dimer-hydrogen bond using the theory of ab initio localized
charge distributions; 2) the modeling of the hydrogen bond using the effective fragment
potential method; 3) the modeling of the exchange repulsion component of the hydrogen
bond interaction energy. The specific areas of glycine chemistry studied are; 1) the
conformational potential energy surface of neutral glycine; 2) the gas phase uncatalyzed
peptide bond formation between two glycine molecules; 3) the number of water molecules
necessary to stabilize the glycine zwitterion.

1
CHAPTER 1. GENERAL INTRODUCTION
I. General Overview
One of the emerging frontiers in ab initio quantum chemistr)' is the study of
molecular solvation effects. The research presented in this dissertation can be viewed as an
initial exploration of the very outskirts of this frontier. One problem that is addressed is the
computational expense of including solvent molecules. More approximate, and hence
computationally cheaper, methods of including solvent molecules can be devised if solute-
solvent and solvent-solvent interactions are understood. If the solvent in question is water,
this means a detailed understanding of the hydrogen bond. Once such large calculations are
made possible, other theoretical tools are needed to interpret the often complex results.
Clearly, the effect on solvation of a chemical system can only be studied by direct
comparision to its corresponding in vacuo behavior. It also seems sensible to bridge the gas
phase and bulk solvation environments with intermediate states, the so called
"microsolvated" states, in which the solute and a small number of solvent molecules are
considered explicitly.
II. Dissertation Organization
This dissertation has two main parts: understanding and modeling the hydrogen bond
(chapters 2-4) and the chemistry of the amino acid glycine (chapters 5-7). Chapter 2
represents a very detailed energy analysis of the water dimer hydrogen bond. Chapter 3
introduces the Effective Fragment Potential (EFP) method for modeling hydrogen bonds and
presents applications to the water dimer and water-formamide. The theoretically most
complex part of the EFP theory, the exchange repulsion energy, is improved upon in chapter
4. The glycine part of the dissertation begins with a study of the conformational potential
energy surface of gas phase glycine (chapter 5). Chapter 6 explores how gas phase glycine

2
can dimerize to form glycylglycine. Finally, the zwitterion-neutral equilibrium of glycine is
studied in the presence of zero, one, and two water molecules (chapter 7).
Chapters 2-7 represent papers that either have been or will be published in peer
refereed journals or books. These papers are preceeded by this, introductory, chapter where
theory common to all the papers is very briefly reviewed. The dissertation ends with a
presentation of the overall conclusions (chapter 8).
III. Theoretical Background
All calculations reported on in this dissertation are based on Hartree-Fock electronic
structure theory' augmented by M0ller-Plesset perturbation theory,2-3 and some studies make
use of the theory of localized molecular orbitals."^ In this sections these three theories are
briefly reviewed.
A. Hartree-Fock Theory
Human kind has yet to find an exact solution to the equations governing three or more
interacting particles moving relative to one another. Therefore it is only possible to solve the
Schrodinger equation^ (here in its time-independent form),
= ( 1 )
for two-particle systems. For most chemical applications the Schrodinger equation can be
solved separately for electrons and atomic nuclei (the Bom-Oppenheimer approximation^),
and so any one-electron problem can be solved exactly within this approximation. Hartree-
Fock theory makes use of this fact by approximating a N-electron system (e.g. a molecule
with N electrons) as N one-electron systems. Thus the Schrodinger equation is recast as N
Hartree-Fock equations, ̂
F{i)\i/{i) = £,!//(/) i = 1,2,.... A^. (2)

3
Here, y/ii) is a one-electron wacefunction commonly referred to as an orbital, and F(i) is the
effective one-electron Fock operator which replaces the Hamiltonian of eq (1). The Fock
operator differs from the true Hamiltonian in that the instantaneous electron-electron
repulsion is replaced by an average field. This field, and thus the Fock operator, is a function
of the orbitals and eq (2) must therefore be solved iteratively.
Molecules come in all shapes and sizes and determining the optimum mathematical
form for each orbital on an individual basis is much too cumbersome. Therefore each
molecular orbital is usually expressed as a linear combination of atomic orbitals (the LCAO
approximation!),
= (3)
The atomic orbitals Xn can be determined from atomic calculations once and stored, and only
the expansion coefficients are left to be determined. A complete (infinite) basis set
converges to the correct Hartree-Fock result, eq (2).
B. M0ller-Plesset Perturbation Theory
Compared to the Bom-Oppenheimer approximation the molecular orbital
approximation outlined above is rather crude, but most chemical phenomena can be modeled
qualitatively using Hartree-Fock Theory. For quantitative agreement with experiment it is
necessary to go beyond the average electron-electron repulsion and explicitly correlate the
electronic motions. Most electron correlation methods are based on the idea that a true N-
electron wavefunction can be written as a linear combination of approximate A^-electron
functions, in analogy with eq (3) for one-electron functions. An effective way of determining
the expansion coeffecients is through pertubation theory where the Hartree-Fock
wavefunction is used to generate the approximate A^-electron function expansion set. In this

4
dissertation the perturbation expansion is usually caried to second-order (MP2-) and
sometimes to fourth-order (MP43).
C. Localized Molecular Orbitals
The molecular orbitals obtained by solving the Hartree-Fock equations tend to be
delocalized over the entire molecule and do not conform to the notion of electron pairs
locahzed in bonds, lone-pairs and inner shells7 Indeed, such delocalization is required by
the symmetry of a molecule. However, these canonical orbitals are not unique, since any
unitary transformation among the set of doubly occupied orbitals yields the same total
electron probability density and therefore the same properties, including the molecular
energy. The same is true for the singly occupied subspace. While there is an infinite number
of such unitary transformations, a particularly useful and well-defined transformation is that
which converts the canonical orbitals into orbitals that are maximally localized. The basic
concept for transforming to such localized molecular orbitals was suggested by Lennard-
Jones and Pople,8 and a practical method for obtaining the most localized orbitals was
proposed by Edmiston and Ruedenberg.4 The latter authors noted that the total energy within
the Hartree-Fock scheme may be written as a sum of one- and two-electron terms.
and that (£,) and (£2) are separately invariant to any unitary transformation of the canonical
orbitals. The two-electron term can be further subdivided as
(£) = (£,) + (£3) (4)
(£•,) = C-X = C'-X' + D (5)
where C and X, the total Coulomb and exchange terms, respectively, are each also invariant
to any unitary transformation of the canonical orbitals. If we define D as the sum of all intra-

5
orbital repulsions, then C and X' are the net inter-orbital Coulombic and exchange
repulsions, respectively. Since C, X', and D do change when a unitary transformation is
applied to the canonical orbitals, one can seek that transformation T which maximizes D (or
equivalently minimizes C'-X')- The resulting orbitals \|/ = (pT are referred to as the energy
localized molecular orbitals. These orbitals do indeed look like bond, lone pair and inner
shell orbitals. As such, they conform more closely to a chemist's view of molecular
electronic structure^ than do the delocalized canonical orbitals.
References
1. Roothan, C. C. J. Rev. Mod. Phys. 1951, 23, 69; and references therein.
2. (a) M0ller, C.; Plesset, M.S. Phys. Rev. 1934, 64, 618. (b) Pople, J. A.; Binkley, J. S.; Seeger, R. Int. J. Quantum Chem.; Quantum Chem. Symp. 1978,10, \.
3. (a) Krishnan, R.; Pople, J. A. Int. J. Quantum Chem. 1978,14, 9\. (b) Krishnan, R.; Frisch, M. J.; Pople, J. A. J. Chem. Phys. 1980, 72, 4244.
4. (a) Edmiston, C.; Ruedenberg, K. Rev. Mod. Phys. 1963, 35, 457. (b) Boys, S. F. Quantum Science of Atoms, Molecules, and Solids (P.O. Lowdin, Ed.), Academic Press, New York, 1966, p. 253.
5. (a) Schiodinger, E. Ann. Physik 1926, 79, 361. (h) Schiodinger, E. Ann. Physik 1926, 79, 489. (c) Schrodinger, E. Ann. Physik 1926, 80, 437. (d) Schrodinger, E. Ann. Physik 1926, 81, 109.
6. Bom, M.; Oppenheimer, J. R. Ann. Physik 1927, 84, 457.
7. Lewis, G. N. J. Amer. Chem. Soc. 1916, 38, 762. (b) Langmuir, I. J. Amer. Chem. Soc. 1919, 41, 868. (c) Gillespie, R. J.; Nyholm, R. S. Quart. Rev. 1957,11, 339.
8. Hurley, A. C.; Lennard-Jones, J. E.; Pople, J. A. Proc. Roy. Soc. (London). 1953, A220, 446.

6
CHAPTER 2. AB INITIO LOCALIZED CHARGE DISTRIBUTIONS: THEORY
AND A DETAILED ANALYSIS OF THE WATER DIMER-HYDROGEN BOND
A paper published in and reprinted witii permission from
Journal of Physical Chemistry 1995, 99, 8091-8107
Copyright 1995 American Chemical Society
Jan H. Jensen and Mark S. Gordon
Abstract
The method of localized charge distributions, originally implemented for
semiempirical molecular orbital (MO) theory, is re-introduced and implemented for ab initio
self consistent field-MO theory. This theory is then used in conjunction with localized
second-order M0ller-Plesset (MP2) pair energies to analyze the hydrogen bond in the water
dimer. It is found that this hydrogen bond can be explained as the competition between the
intra-vi&iQx electronic kinetic energy pressure and the //i/er-water potential energy suction.
I. Introduction
"Current progress towards better quantum chemical calculations is
leading to increasingly complex wavefunctions, making it more and more
difficult to relate them to qualitative ideas about chemical binding. Thus a
need arises for conceptual interpretations which are appropriate for such
wavefunctions and at the same time allow for the development of a
corresponding physical and chemical intuition."^

7
While this was written nearly a quarter of a century ago, it is certainly no less true today.
The method of localized charge distributions^ addresses this need for conceptual
interpretations by decomposing wave functions and properties of the wave functions into
components on which most chemical intuition is fundamentally based: inner shells, bonds,
and lone pairs. Although these components were originally devised as conceptual tools for
the interpretation of molecular structure, they have a strong theoretical footing in quantum
mechanics through the theory of equivalent orbitals^ and subsequently localized molecular
orbitals (LMOs).'^ However, a similar partitioning of the molecular energy and one-electron
properties into contributions from such components proves difficult since the terms involving
the nuclei are not easily assigned. The central idea behind the concept of localized charge
distributions (LCDs) is to assign part of a nuclear charge to a particular LMO that is
predominantly associated with that nucleus. This "local" nuclear charge (or charges) and the
LMO respectively constitute the nuclear and electronic part of an electrically neutral LCD.
This idea appears to date back at least as far as 1951 when Lennard-Jones and Pople^
considered hydrogen bonding in water. In 1958 Parks and Parr made use of the concept in
their theory of Separated Electron Pairs.^ Pritchard and Kem^ used the LCD approach to
define bond dipole and quadrupole moments about a decade later. The implementation of the
theory of LCDs presented in this paper was originally formulated in 1971 by England and
Gordon^ and implemented for semiempirical INDO theory. Numerous applications and
extensions followed in later years and some are listed in reference 8. For example, Amos and
Crispin^(^) used LCDs to derive parameters for classical intermolecular interaction formulae
and Tomasi and co-workers^C^) partitioned molecular electrostatic potentials into LCD
components.
In this paper we present the implementation of this method for ab initio SCF MO
theory (RHP and high-spin ROHF). First, the underlying theory will be introduced and cases
for which the nuclear partitioning is not obvious will be discussed. Second, a compatible

8
representation of the correlation energy is presented. Finally, these two methods are used to
analyze the hydrogen bond in the water dimer. In addition to being a most important
chemical phenomenon, hydrogen bond formation is easily analyzed using LCDs since no
covalent bonds are broken or formed. Many energy decomposition schemes^ have been
applied to hydrogen bonded systems. Virtually all decompose the total energy into
components such as Coulomb interaction, polarization, exchange repulsion, charge transfer
and electron density deformation. The approach taken in this paper is rather different in that
it highlights the interplay between the electronic kinetic energy and the potential energy.
II. Theory
A. The Theory of Localized Charge Distributions
1. Nuclear Charge Partitioning. A localized charge distribution (LCD) consists of a
localized molecular orbital (LMO, y/i) plus its assigned local nuclear charge distribution
[Z/(A) for all atoms A]. A charge distribution of a neutral molecule consisting of 2N electrons
in N orbitals and M nuclei, can be partitioned into N neutral LCDs by setting
Zi(A) = 2 if y/i is an inner-shell or a lone-pair LMO predominantly
localized on atom A, (1)
= 1 if y/i is a bond LMO predominantly localized on atom A,
and its bonded partner,
= 0 otherwise.
The total nuclear charge on a given atom (A) must be preserved.
iz,(A) = Z,, / = 1
(2)

9
where Z/\ is the nuclear charge on atom A. Consider the BH molecule as an example.
Localizing the electronic wave function yields three doubly occupied LMOs: an inner-shell, a
lone pair, and a bond orbital. The first two are predominantly localized on one atom (B),
whereas the bond orbital is localized on both atoms (B and H). These three orbitals can now
be used to define their corresponding localized nuclear charge distributions: inner-shell and
lone-pair LMOs are assigned +2 charges positioned at the one atom on which they are
localized, whereas the bond LMOs are assigned -f-1 charges on each of the rwo atoms on
which they are localized:
These three types of localized charge distributions can be used to describe most, but not all,
molecules. What follows are five examples of molecules with other types of LMOs and
some suggestions about how to assign nuclear charges to them to form LCDs. In all cases,
the LMOs are those obtained using the energy localization scheme of Edmiston and
Ruedenberg.4(^) In general it is important to note that the partitioning of the nuclear charge is
completely arbitrary as long as equation (2) is satisfied, and we rely on chemical intuition to
make sensible choices.
a. BF: back bonding. If the hydrogen in BH is replaced with a fluorine to form BF,
the new wave function gives five valence-LMOs. One LMO is predominantly localized on B
while four LMOs are predominantly localized on the F. However, only one of the latter is a
nearly pure lone pair orbital on F. The other three are bent towards B and may be thought of
as highly polarized BF bonds. Since assigning one +2 charge to B and four +2 charges to F
violates equation (2) (when the inner shells are included), the chemically sensible way to
+2 +2 +1 -1-1

10
partition the nuclear charges is to assign +1/3 and +5/3 to B and F, respectively for these
three LMOs:
b. B2H5: 3-center/2-electron bonds. Nonstandard partitionings are required when
LMOs extend over more than two centers, as the assignment of nuclear charges becomes less
obvious. A classic example is B2H6. An LMO analysis of the electronic charge distribution
reveals two doubly occupied bonding LMOs that extend over three centers: both B atoms and
one of the H atoms. Equal partitioning of the +2 charge in this LCD among the three centers
leads to only a +2/3 charge on the bridging hydrogens. Since no other LMOs are associated
with these centers, a more sensible partitioning of the nuclear charges in the three-center
bond is a +1/2 charge on both B atoms and a +1 charge on the hydrogen:
+ 1 + 1 + 1

11
In many, if not most, cases there is an even number of such bridging bonds and equation (2)
will then be satisfied for the two bridged atoms. Other molecules must be treated on an
individual basis.
c. NKLt+ and OH": ions. The scheme outlined in equation (1) will only produce
neutral LCDs. For charged species at least one LCD must possess a net charge. In NH4+, for
example, a +1 formal charge resides on the N. The least arbitrary assignment of this charge is
to partition it among the four NH bond LCDs:
For OH", where a -1 formal charge resides on the O, a total valence charge of +6 must be
assigned to one bond and three lone pair LMOs. One option is to assign +3/2 to each valence
LMO, but it seems more chemically sensible to consider the bond and lone pairs separately
(keeping the net charge in each LCD to a minimum) and assign a +1 charge to the O in the
bond LCD and divide the remaining +5 charge among the lone pair LMOs:

12
d. NH3+H20->NH4"'"+0H*: proton transfer. Analyzing chemical reactions using
the LCD method can be complicated since the nature of an individual LCD may change
during the course of the reaction. One solution is presented here using proton transfer
reactions as an example. In order to get a continuous description of intermediate structures
along the reaction path, reactants and products must be described by identical sets of LCDs.
This may be accomplished by considering an intermediate structure along the reaction path,
and viewing reactants and products as extreme representations of this intermediate structure.
For example, consider the reaction
While the two neutral reactants are easily described with standard inner-shell, bond, and lone
pair LCDs, this LCD description will differ significantly from the ones discussed in the
previous section for the two products. On the other hand, both [NH3+H2O] and [NH4++OH'
], and hence all structures along the connecting reaction path, can be described as [NH3
+H++OH"]. In order to facilitate this, an additional "LCD", consisting only of a +1 charge at
the position of the proton being transferred (i.e. no LMO is associated with this LCD), may
be defined.
NH3+H20^NH4++0H-.

13
This method has been used successfully for a variety of proton transfer reactions involving
the amino acid glycine and will be discussed in a forthcoming paper.
e. Triplet H2O. Electronic excitations pose the same basic problem to the LCD
method as that encountered for chemical reactions. For example, the wave functions for
singlet and triplet water give rise to very different LMOs:
In order to maintain energy invariance only orbitals with like occupancy can be mixed during
the MO localization. The two singly occupied MOs on triplet water do not mix and so they
remain canonical; one is essentially a pure p orbital on O and the other is a +/-/+ combination
of the H/O/H s orbitals. It may be tempting to describe the latter as a 3-center/2-electron
LCD discussed previously. However, this LCD-description would have very little in
common with that of singlet water and does not easily facilitate an understanding of the
singlet-triplet splitting. An alternative approach is to consider one of the lone pairs in singlet
water as tv/o identical singly occupied LMOs and assign a +l charge from the O to each."
Their triplet LMO-counterparts then may give rise to similar LCDs, and a +1 charge from the
O are assigned to both as well.

14
Using this approach the singlet-triplet energy difference then simply arises from an orbital
deformation, plus an extra electron exchange term arising from the change in spin.
2. SCF Energy Decomposition. As noted previously2('i) once the {ZiiA}] are
defined, it is possible to partition any molecular expectation value of interest into localized
contributions. Of prime interest, of course, is the total molecular SCF energy, For a
system of N localized orbitals (each containing two electrons for RHF wave functions and /V,
electrons in general) and M atoms,
N
(3)
where,
N
(4)
is the total energy of localized charge distribution i.
The first term is the total kinetic energy of the electrons in LMO i,
(5)
Each term has three Cartesian contributions,
= + t.' + T.' (6)
where

15
r = iV,jjr,v/;(l) (7)
This sub-division is useful since, for example, for a bond LMO the two KE components
perpendicular to the bond axis (7i) can behave very differently from the parallel component
(ril). The most important example is the crucial role of T\\ in the formation of covalent
bonds. 1
The second term in equation (4) is the total potential energy of interaction of
locahzed charge distribution i with itself, and all other localized charge distributions. The
potential energy term.
V - — V- "t" G-- 4" ?-IJ IJ IJ °IJ
(8)
is comprised of contributions due to electron-nuclear attraction.
M M (9)
LA=1 ^lA J L'^ = l lA J
electron-electron repulsion,
Gij=jN^Nj (10a)

16
(G^ ^ G,^ j (1)1/^/1)—•/^•(2)v/,(2), if N, = Nj = I high spin case) (10b)
la
and nuclear-nuclear repulsion,
, ^ ̂ Z.{A)Z^{B) S.j = 2LL— •
/4=1B»A ^AB
Here R is the distance between electron 1 and atom A, ryi is the distance between
electrons 1 and 2, and is the distance between atoms A and B. It is immediately
apparent that
= G, = G^„ (12)
and hence
(13)
3. LCD Dipoles and Quadrupoles. The localized electrostatic potential due to a
LCD can be expanded in terms of LCD multipoles. A LCD dipole is comprised of a nuclear
and electronic component,
M H, ='^Z.iA)R, - iV, jdry, (Dry/,il), (14)
A = \
where R>i and r denote the nuclear position vector and electronic position operator,
respectively. The dipole is not affected by the choice of origin if the overall charge of the

17
LCD is zero and so the dipole of a molecule comprised of neutral LCDs can be written as the
sum of the LCD dipoles:
A LCD quadrupole,
0, =iXz,(A)[3R,R,-i?jl]-4ivJ^/r,i//;(l)[3rr-rI]>/A,(l) (16) y\=i
will depend on the choice of origin unless the LCD dipole is zero. One can either chose a
common origin for all LCDs to get LCD contributions to the molecular quadrupole at that
origin, or chose different origins for each LCD to best describe its local electrostatic
potential. 12
B. Second Order M0ller-Plesset Energy Decomposition
The error in the energy introduced by the molecular orbital approximation is partially
recovered by second order M0ller-Plesset perturbation theory. j^e MP2 energy correction
[£•(2)] to the RHF energy can be written as the sum of pair correlation energies of doubly
occupied spatial orbitals.
(15)
N N
(")
where each the correlation energy associated with a pair of electrons in orbitals i and j.
Each pair energy is given by a linear combination of two-electron integrals connecting
occupied orbitals i and j with all virtual orbitals (P is the total number of virtuals).

18
p p
<r = TL'::;K ( 1 8 )
and
K;;=jj dr.dr.y/: (1)1//, (1)—V^; (2)1//, (2) \ 2
(19)
For an arbitrary set of occupied orbitals (e.g. localized orbitals), the C-- coefficients must be
determined iteratively. However, if canonical MOs are used, the underlying equations
simplify greatly (due to the fact that the Fock matrix is diagonal^^), and it is possible to
derive an analytical expression.
where the £!s are the canonical MO energies. Once the K"'s and C^'s are calculated in the
canonical MO basis, they can be transformed to a LMO basis by the same unitary
transformation that transforms the canonical MOs to the LMO basis.
C. Physical Interpretation of the Electronic Kinetic Energy
The role of the electronic kinetic energy in chemical phenomena has not received the
prominence it deserves. In most physical interpretations of quantum chemical results the
. virial theorem is invoked (implicitly or explicitly) and the kinetic energy is then considered
merely as a function of the potential energy. As a result, potential energy considerations
dominate most interpretations.Feinberg and Ruedenberg^S have pointed out numerous
drawbacks to this approach. In this study we consider LCD energy components, for which
(20)

19
the virial theorem does not apply and so the kinetic and potential energies must be given
equal consideration.
Ruedenberg and co-workers^ have noted that an alternative expression to equation
(5),
7; = iA^,j^ir,(V)//,(l))', (21)
facilitates physical interpretations, since it is easier to discuss the gradient of a wave function
than the curvature and since all volume elements make a positive contribution to the kinetic
energy. For example, it is then easy to see that a localized function will have a higher KE
than a more delocalized one;
This geometrical argument has its fundamental underpinning in the expression of the
uncertainty principle that relates position and momentum,
AxA/7^ > {. (22)
Ruedenberg has introduced the terminology "kinetic energy pressure" to describe this driving
force for wave function expansion. The opposing force is then the "potential energy
suction", a term that describes the increase in the attractive potential energy associated with
the contraction of a wave function.

20
Thus, in this study a kinetic energy decrease for a particular LMO is invariably
ascribed to a spatial expansion of the LMO, an assertion that is corroborated by density
difference plots of the individual LMOs, to be described later.
III. A Detailed Analysis of the Water Dimer-Hydrogen Bond
A. Computational Details
The reference water dimer geometry used in this work, shown in Figure la, is that
used by Feller The internal geometries of the two water molecules are the MP2/6-
311-h-G(2J,2/j) optimized structure of isolated water (ro//= 0-957IA, HOH angle =
104.34°). The remaining degrees of freedom of the water dimer are those of the fully
optimized water dimer structure at the same level of theory.20 Using this geometry as a
reference, the O-O distance (hereafter referred to as R) was then varied and the energy re
computed at the MP2/aug-cc-pVDZ2i level of theory, without re-optimization. This level of
theory was shown by Fellerto give an interaction energy that is essentially converged with
respect to basis set (see Figure 6 in Reference 19), and well within experimental accuracy.
Keeping the internal monomer geometries fixed at the gas phase values as R is decreased
separates the primary electronic effects from the secondary effects due to the slight change in
other internal coordinates. At the equilibrium distance the energy of the fully optimized
system is only 0.11 kcal/mol lower in energy. Since geometry optimization can change
individual energy components dramatically,2(a) this is addressed in Section G.
The localized molecular orbitals were obtained by using the energy localization
method of Edmiston and Ruedenberg.'^(a) This localization method is computationally more
expensive than others since two-electron integrals in the MO basis are required. However,
many of these integrals are required in the LCD energy expression as well and have to be
calculated anyway. In addition the Edmiston-Ruedenberg scheme uses the localization
criterion that is theoretically most sound. The LMOs used in the SCF energy decomposition

21
differ very slightly from the ones used in the decomposition of the MP2 energy correction,
since the canonical core MOs are included in the localization that produces the former LMOs
but not in the latter. This is due to the fact the core MOs are not included in the MP2 energy
evaluation.
All calculations were performed with the quantum chemistry code GAMESS,--
except that the constrained MP2 optimizations discussed in Section G which were done with
GAUSSIAN92.23
B. Total Energy Partitioning
The energy localization of the water dimer SCF wave function yields ten localized
molecular orbitals (LMOs), which in turn give rise to ten LCDs [depicted and numbered in
Figure lb]. Five of these LCDs have nuclear components exclusively from nuclei in either
the hydrogen acceptor or donor [labeled A and D, respectively, in Figure lb]. For
interpretative purposes, the LMO part of these five LCDs are considered to belong
exclusively to either A or D, though all orbitals in reality extend over all space. Thus, the
total energy of the system can be partitioned into three components:
£=£(A) + £(D) + £(AID). (23)
The first two terms have similar expressions. The first is given by
E{A) = KE{A) + P£(A) + £'-'(A)
(24)

22
and is the internal energy of A, comprised of electronic kinetic energy (KE), potential energy
(PE), and MP2 correlation energy components. The SCF energy component is the energy
expectation value due to the Hamiltonian of a free water molecule acting on the part of the
water dimer wave function assigned to A. Since the corresponding wave function of free
water represents the variational energy minimum, £-^^^(A) > £-^<^^(H20) for all R except
infinity.24 The same argument cannot be made for the MP2 correction for two reasons: one
is that M0ller-Plesset perturbation theory is not variational; the other is that the sum in
equation (18) extends over a// virtual orbitals, which have doubled in number on going to the
water dimer.
The remaining term in equation (23) is the interaction energy of A and D,
^(A ID) = PE{A ID) + E^-\A ID)
(25)
ieA|_;eD ;€D
where
(26)
and similarly for e'lf • Note that there is no kinetic energy contribution to the interaction
energy, only to the energies of the monomers. Given these definitions, the total binding
energy can be written as

23
A£ = £(A) + £(D) + E{A ID) - 2£(H,0)
= [£(A) - £(H,0)] + [£(D) - £(H,0)] + £(A I D) (27)
= A£:(A) + AfCD) + £:(A ID)
where £(1120) is the energy of an isolated water molecule. Similarly, differences in
individual LCD energy components are defined as the difference of the water dimer value
and that of the corresponding component in free water.
Figure 2 shows how the three energy components in equation (23) vary with R,
relative to their value in free water. First note the small energy scale of the total energy (left
>'-axis) compared to that of the energy components (right y-axis). The total energy decreases
to a minimum value of -5.1 kcal/mol relative to two isolated water molecules as R is
decreased to 2.911A (Req) whereupon it rises sharply and at /?=2.38A the relative total
energy is +3.9 kcal/mol. As pointed out previously, the internal monomer energies must
increase as the wave function of one monomer deviates from that of isolated water, because
of the presence of the other monomer. The interaction energy is always decreasing in the R
range considered in this study. So the decrease in total energy as R decreases from <» to RGQ
arises from a decrease in the AID interaction energy. Conversely the increase in total energy
as R is decreased past Rgq arises solely from the internal energies of the monomers. In fact,
the characteristic shape of the total-energy curve can be viewed as a competition between the
internal- and interaction-energy as R is decreased.
C. Donor/Acceptor Interaction Energy
While the two monomer SCF energies must increase as their separation is decreased
because of the shift away from the variational energy minimum of the isolated monomer, no
a priori determination can be made about the behavior of the individual energy components,
e.g. kinetic energy, e-n attraction, etc. The reverse is true for the SCF interaction energy; the

24
absolute value of all three potential energy components [equation (8)] must increase relative
to their value at infinite separation (=0), however, no a priori determination can be made
about whether they will add up to a net positive or negative potential energy of interaction. It
follows that it is the interaction energy — ultimately the competition between e-n attraction
and e-e plus n-n repulsion — that determines whether the overall SCF energy will decrease.
The data presented in Figure 2 show that for the relative orientations chosen for this study the
interaction energy always decreases. The reasons are discussed in this section.
The MP2 electron correlation contribution to the interaction energy of A and D
[equation (24)] is at most 9% over the range of R considered. Thus, this contribution has
only a minor effect on the overall behavior and will be discussed in Section F. The SCF
contribution is decomposed further into interaction energies of individual LCDs of A with all
of D in Figure 3a. The interaction energy is essentially the energy of the hydrogen bonded
lone pair LCD on A il=lp') interacting with D, although there is a small net repulsive
contribution from the other lone pair (LCD 8) that increases ̂ ^(AID), especially at small R.
Further analysis (Figure 3b) reveals that the decrease of PE{lp'\D) is primarily due to an
interaction of Ip' with the hydrogen bonded OH bond LCD {4=bo 0 and the lone pair LCDs
on D (2,3=lp) with becoming dominant as R is decreased past Rgq. At R=Req, these
three terms constitute 116% of the total interaction energy, with the bond and each lone pair
contributing 51% and 33%, respectively. Thus an explanation for why these pairs of LCDs
have negative interaction energies explains the vast majority of the total interaction energy.
From the discussion in the previous paragraph it is obvious that the interaction energy
decreases because the e-n attraction term is larger than the e-e and n-n repulsion terms
combined. The reasons why the e-n attraction dominates is best explained by considering the
orientation of the LMOs. Consider the SCF/aug-cc-pVDZ wave function of the following
water dimer orientation (the internal water geometry is that shown in Figure 1) in which the
oxygens are directly facing each other:

25
Iplp-pair
A LCD analysis reveals a LCD pair with an interaction energy (Uipiip) of +6.5 kcal/mol which
provides a point of comparison for "U/p'i/p and vip-\t,o'-
Clearly, the lone pair LCDs on D make important contributions to the interaction
en e r g y . The reason the e-n attraction dominates Vip-\ip is that the lone pair LMOs (Ip) are
pointing away from LMO Ip' giving rise to a relatively small e-e repulsion. Evidence for this
assertion is found when the components of Mip'Up are compared to the components of uipUp:
The e-e repulsion is increased more than the e-n attraction energy is decreased (the n-n
repulsion of course stays the same) on going from left to right, leading to an overall positive
energy of interaction.
The e-n attraction dominates X)ip-\bo' in comparison to 'UipUp due to the +1 charge at
the hydrogen position. If the +1 charge at the H2 position is moved to the Oi position in bo'
without letting the two LMOs adjust, the e-e repulsion is unchanged, the n-n repulsion
decreases, but the e-n interaction energy increases even more. This results in an overall
positive "•Uipiip":
^ I p M p S l p V p ^ I p M p " ^ I p V p 494.4 -I- 456.2 - 958.2 = -7.6 kcal/mol
^ipilp ^ipiip ^ipilp ^ipiip 579.2 + 456.2 -1022.4 = +13.0 kcal/mol

26
*CD (®I>» —^ O®* +2 +1 +1 +2 +2
G'/plfco' Slp^bo• Vlp^bo' '^lp'\bo' "<^lpllp" ^Ipllp "^Ipllp" "^Ipllp 647.2 + 567.2 - 1226.2 = -11.8 kcal/mol 647.2 + 456.2 - 1077.2 = +26.2 kcal/mol
The difference between +26.2 and +13.0 kcal/mol for DipUp is then an estimate of the energy
change introduced when the MOs are allowed to relax. However, the interaction energy for
these two LCDs are still repulsive. Similarly, if a +1 charge is removed from the oxygen and
placed at the position of the hydrogen in one of the lone pair LCDs in the Iplp-pair
considered above, one finds a of *22.8 kcal/mol.
The LCD method can also be used to obtain a more qualitative description of the
interaction energy through the use of LCD multipoles (described in Section A.3). In the
spirit of Lennard-Jones and Pople,^ the electrostatic potentials of lone pair and bond LCDs
are described as dipoles and quadrupoles, respectively. The interaction energy vip'\ip is then
approximated by the interaction energy of the dipoles of LCD Ip' and Ip, and Vip'ito' by the
dipole of Ip' interacting with the quadiupole of bo'.^^ The bond LCD dipole is only 0.23D at
Rgq and makes a neghgible positive contribution to the interaction energy.
+1=^-
M-/p' ®bo'
The results, shown in Figure 4, show that this description gives semi-quantitative interaction
energies even at small values of R where the multipolar expansion of the interaction energy

27
breaks down. If the exchange contribution (described in the Appendix) is subtracted from the
total interaction energy, the dipole-dipole and dipole-quadrupole interaction energies account
for 71% of X)ip-\ip and Vip-\bo' > respectively, at Rgq.
In summary, the interaction energy between A and D is essentially that of the two
LCDs directly involved in the hydrogen bond (//?' and bo \ respectively) and the interaction
of Ip' with the two lone pair LCDs on D (//?). The former can be qualitatively described as a
dipole-quadrupole interaction and the latter as a dipole-dipole interaction.
D. Hydrogen Donor Energy
The individual LCD components of the change in internal energy of D is shown in
Figure 5. It is apparent that the increase of AE(D) is due to an increase in both potential
energy (PE) and kinetic energy (KE). At large R, APE{T>) dominates while at small R,
AKE{D) increases sharply as the potential energy component levels off. The two curves
cross around Rgq with values of 4.4 and 3.8 kcal/mol, respectively for AKE and APE. So the
rise in internal energy ofDasR is decreased past R^q is largely due to a rise in the kinetic
energy pressure. The MP2 conection has a relatively small effect at all values of R, and will
be discussed in Section F.
1. Kinetic Energy. The individual LCD contributions to the AKE of D are shown in
Figure 6a. Clearly the increase in the internal kinetic energy of D is due entirely to an
increase in the kinetic energy of the OH bond-LMO directly involved in the hydrogen bond
(LMO A=bo'). At R>aK this increase is cancelled by a concomitant kinetic energy decrease
for the remaining LMOs, but for shorter distances this decrease is insufficient for a complete
cancellation. The changes in LMO kinetic energy can be explained by the contraction and
expansion of the LMOs. Figure 7 shows the three symmetry-unique valence LMOs of D at
R=Req together with their difference in density relative to the corresponding LMOs in free
water. The difference density may be written as

28
^ ¥ U ^ = ¥ U , - ¥ l - (28)
As expected, the largest change occurs in bo' (Figure 7e) where the electron density is
pushed towards Oj, presumably by the hydrogen bonded lone pair on A (LMO 7). This leads
to orbital contraction and an increase in the orbital kinetic energy. The remaining valence
MOs are pushed away from Oj by bo'.
leading to MO expansion and thus a drop in orbital kinetic energy, in the order IA7/pl >\/STho\.
2. Potential Energy. Figure 6b shows the individual LCD components of the APE of
D. Again, the largest single change is the decrease in APE{bo'). However, the remaining
LCD components, especially the two lone pair LCDs, more than counteract this change,
leading, overall, to only a slight increase in potential energy. The potential energy changes
are mainly a result of the changes in the electron-nuclear (e-n) attraction between the valence
LMOs and the D-oxygen nucleus (see Appendix). This term dominates the change in all
other e-n terms as well as electron-electron repulsion terms (the nuclear-nuclear repulsion
terms do not change since the internal monomer geometry is frozen) So the e-n attraction
energy decrease due to the contraction of bo' is nearly canceled by the e-n attraction energy
. increase due to the expansion of the remaining LMOs.
E. Hydrogen Acceptor Energy
Comparing Figure 8. which shows the kinetic energy, potential energy, and MP2
energy components of A£(A), with Figure 5 it is apparent that the internal electronic structure

29
of A becomes quite different from that of D as /? is varied. For R>~3.5A all contributions are
essentially zero, but at smaller R the change in kinetic energy increases sharply while the
change in potential energy decreases less sharply, leading to an overall increase in the
internal energy of A. So the rise in internal energy of A as R is decreased past Rgq is due
entirely to a rise in the kinetic energy pressure. These changes are rationalized by
considering the change in the density of each valence LMO at Rgq, shown in Figure 9. The
MP2 correction again has a very small effect for all values of R and is discussed in Section F.
1. Kinetic Energy. The individual LCD components of the kinetic energy of A are
displayed in Figure 10a. The kinetic energy of the two OH LMOs [9 and \0=bo, cf. Figure
lb] as well as the lone-pair not directly involved in the hydrogen bond (LMO 8=/p) all
increase relative to the free water molecule. The kinetic energy of the other lone pair (LMO
l=lp') exhibits more complicated behavior: it decreases initially but once the two water
molecules approach past Rgq, the kinetic energy increases sharply. Figure 9d shows that at
Req, electron density is transferred away from O4 (and towards the hydrogen bonded OH
LCD on D). This lowers the kinetic energy by 11.5 kcal/mol due to expansion of the orbital.
A breakdown of Tip' into Cartesian components. Figure 1 la, shows that most (74% or 8.5
kcal/mol at R^q) of this drop comes from LMO expansion parallel to the OO axis [7^^', cf.
Figure la]. Further decrease in R reverses this expansion and all three Cartesian components
increase dramatically. A density-difference plot at the smallest value of R (2.38A) for Ip
shown in Figure 1 lb, reveals that electron density is still shifted away from the oxygen
relative to /?=oo but that a strong tail is building up on D to satisfy the orthogonality
condition. Furthermore, electron density is accumulating on the hydrogen bond axis,
presumably due to the increasing net positive charge on H2. As a result, increases by
16.4 kcal/mol relative to its Req value (+7.9 relative to Rcc) and A7"/p' has increased to +34.2
kcal/mol. Thus, the two perpendicular components of AT/p' are the major (77%; 26.3
kcal/mol) contributors at /?=2.38A. So, as A and D are brought together, Ip' initially expands

30
as it is drawn away from O4, but then contracts again due to 1) the condition that it must
remain orthogonal to the other LMO in the hydrogen bond (LMO 4), and 2) the concentration
of charge on the hydrogen bond axis by H2:
Therefore, the increase in the orbital kinetic energy of LMOs bo and Ip is explained
by the concentration of electron density near O4 [see Figure 9e-f] and resulting orbital
contraction, in response to the electron density depletion in Ip':
2. Potential Energy. The density rearrangement exemplified in Figure 9 effects little
change in the internal potential energy of A at large R (>3.2A). A look at the individual LCD
components of APEiA), Figure 10b, shows that this is due to near perfect cancellation of the
increase in the potential energy of Ip' and decrease in the potential energy of the remaining
valence LCDs. As R is decreased further, the former increase levels off first, resulting in an
overall decrease in APE{A), and then decreases as well which accelerates the potential energy
drop. Evidence presented in the Appendix shows that the overall decrease of APE{A) is due
to the increased electron-nuclear attraction terms resulting from the MO contractions.
Ip' at /?=oo /p'at /?=2.91A Ip' at /?=2.38A
be

31
F. Correlation Energy
The neglect of electron correlation in SCF theory results in a wave function in which
the electron distribution on average is too compact and in a molecular energy that is too high.
As mentioned previously, in this study the energy lowering due to electron correlation is
estimated using second order M0ller-Plesset (MP2) perturbation theory. Components of this
correlation energy are rigorously ascribed to particular parts of the wave function, i.e.
particular LMOs. While these LMO correlation pair energies will sum to a negative total
correlation energy, their individual values are not necessarily less than zero because
individual SCF energy components do not necessarily represent an upper bound. In the case
of water dimer formation, electron correlation effects are important if SCF theory fails to
properly describe a) the interaction energy of the two water monomers or b) the change in the
internal monomer energies, both as /? is decreased.
Figure 12a shows the SCF and MP2 contribution to the total energy as a function of
R. The MP2 contribution grows larger with decreasing R and as a result the optimum 0-0
separation is shortened by about 0.1 A relative to the SCF value. At Rgq the relative MP2
correlation energy is -1.4 kcal/mol. Figure 12b shows that the energy lowering by MP2 is
entirely due to the MP2 interaction energy and the internal MP2 energies of the two water
molecules actually increase slightly. Thus the effect of correlation increases with decreasing
R because SCF theory increasingly overestimates the energy of interaction. Part of this error
is compensated for by the fact that jCF theory underestimates the change in the internal
energy of the two monomers. The components of these errors are discussed in the Appendix.
G. Role of Complete Geometry Relaxation
As mentioned in Section A, using frozen monomer geometries raises the total energy
by only 0.11 kcal/mol, however, it is well known that full geometry optimization can change
individual energy components dramatically2(a) and this concern is addressed as follows. The
water dimer geometries used above are used as initial guesses for MP2/6-311++G(2d,2p)

32
optimizations in which all parameters except R are optimized. For /?=:2.38A, geometry
optimization changes the two inter-molecular angles, 0a and 0d (cf. Figure la), to 61.1° and
50.1°, respectively. This effectively reverses the donor and acceptor functions of the
monomers, and so this structure is not included in the energy analysis. For the remaining
values of R, the geometry optimizations leads to much smaller changes: for /?=2.65A A9a=-
7.4° and A0d=5.9°, and these discrepancies grow smaller as R is increased. The largest
change in the monomer geometries occurs for the hydrogen bonded OH bond (rj) which
increases from 0.957A to 0.964A on going from R=°o to Req while all other bonds change by
only 0.001 A. Thus, the hydrogen donor is considered first.
The energy components of A^CD) based on both optimized and unoptimized
structures are shown in Figure 13a (the energy components based on optimized structures are
marked with an *). For R>3.17A the potential energy rises much faster in the optimized
case, while the kinetic energy decreases much faster; however, the shapes of the curves are
unchanged. At smaller R the rate of change in these two energy components is essentially
identical for the optimized and unoptimized case, and so the previously discussed sharp
increase in A£'(D) for R<3k remains a function of the kinetic energy. This correlates well
with the change in which has increased to 0.964 at R=3.\l whereafter it remains
essentially constant as R is decreased further. As expected the vast majority (91% and 95%
for the kinetic and potential energy, respectively at Rgq) of the differences between the
optimized and unoptimized values are due to the hydrogen bonded OH bond LCD {bo'). The
differences in the kinetic and potential energy very nearly cancel and so A£'(D) and A£(D)*
are within 0.45 kcal/mol over the range of R considered.
The energy components of AE'(A), shown in Figure 13b, are much less sensitive to
geometry optimizations. Again the kinetic and potential energies are decreased and
increased, respectively, though much less than for D. More importantly, the rate of change is
essentially unchanged, and the overall effect on AE{A) is always less than 0.32 kcaiymol.

33
The same is true for the interaction energy, where the largest discrepancy between energies
based on optimized and unoptimized structures are at most 0.69 kcal/mol.
In summary, the increase in the total energy is <0.20 kcaL/mol for all R considered,
while the absolute value of the changes in the monomer and interaction energies upon
geometry optimization are up to 0.70 kcal/mol. However, underlying these modest changes
are larger, opposing, changes in the kinetic and potential energy components that mostly
cancel.
IV. Summary
The hydrogen bond energy curve of the water dimer (Figure 2) has been analyzed in
terms of a partitioning of the total SCF energy (using the theory of locahzed charge
distributions) into internal energies of the hydrogen donor (D) and hydrogen acceptor (A),
and an interaction energy between the two monomers. The MP2 energy correction does not
alter the qualitative behavior of the energy curve as R is varied (Figure 12a). Two points
concerning the SCF energies are known a priori. 1) The two internal energies must increase
as the monomers are brought together, so the initial energy lowering must be due to the
interaction energy; 2) This energy lowering must be due to the fact that the electron-nuclear
(e-n) attraction terms dominate the potential energy of interaction. So two questions were
posed: I) why does the e-n attraction term dominate the potential energy of interaction?, and
n) what is the source of the sharp increase in energy for R<Req^ Based on the LCD analysis,
it is concluded that:
I. The interaction energy between A and D is that of the two LCDs directly involved
in the hydrogen bond {Ip' and bo', respectively) and the interaction of Ip' with the two lone
pair LCDs on D (Ip) (Figures 3b).

34
la. The interaction of Ip' and bo' is attractive because of the electron-nuclear
attraction energy due to the positive charge at the hydrogen position. This interaction is well
represented by a dipole-quadrupole interaction (Figure 4).
lb. The orientation of the two Ips effectively partially de-shields the D oxygen
nucleus leading to an attractive interaction with IpThis interaction is well represented by a
dipole-dipole interaction.
n. The rise in the energy as R is decreased past Rgq is due only to the rise in the
internal monomer energies (Figure 2). The behavior of the internal monomer energies can be
explained by the LMO expansions and contractions schematically shown here (Figures 7 and
9),
'(7) bo bo (5)
Ip (2,3) bo (9,10)
eq R<R eq
Ha. The rise in the internal energy of D is largely due to the rise in the kinetic energy
of bo' due to its contraction (Figure 5 and 6a). The associated change in the overall internal
potential energy of D (Figure 6b) is nearly zero.
lib. The rise in the internal energy of A is solely due to the rise in the kinetic energy
associated with the contraction of all the valence LMOs except Ip' (Figures 8 and 10a). The
internal potential energy of A decreases due to orbital contraction (Figure 10b), but this
decrease is not competitive with the kinetic energy increase.
Thus, the initial decrease and subsequent energy increase with decreasing R is a
result of the competition between the inter-water potential energy suction and intra-warer
kinetic energy pressure.

35
The lack of correlation leads SCF theory to underestimate both the magnitude of the
interaction energy and the increase in the internal energies of the monomers. The former
larger in magnitude, so the MP2 energy correction therefore lowers the relative energy of the
water dimer at all R (Figure 12b).
We expect the LCD method to be of equal value in understanding other chemical
systems.
V. Appendix: Further Details
Al. Hydrogen Donor Potential Energy
In Section D.2 it was shown that the modest change in the internal potential energy of
D (Figure 6b) is due to a near cancellation of the increase in the potential energy of the
hydrogen bonded OH bond LCD (bo =4) with the decrease in the potential energy of the
remaining valence LCDs. It is shown below that the source of this near cancellation is the
decrease and increase in the electron-nuclear (e-n) attraction energy due to the contraction of
bo' and the remaining valence LMOs, respectively.
The largest of the LCD components of APE{bo') shown in Figure Ala, is not the
internal potential energy of bo' {Avbo'bo') but rather the PE due to bo' interacting with the
two equivalent lone-pairs {Ip =2,3; Avbolp= A'U42 and A'U43). In fact Avbo'bo' niakes the
smallest contribution to APE{bo') of all the valence LCDs. The reason is the balance or
imbalance of the electron-electron (e-e) repulsion with the electron-nuclear (e-n) attraction
(nuclear-nuclear repulsions do not contribute since the monomer geometries are frozen).
Notice, for example that Avbo'lp has one of the smallest changes in e-e repulsion (Figure
Alb) and the second-largest change in e-n attraction (Figure Ale). This can be rationalized
by considering the individual components of Avbo'lp (up and down arrows signify an energy
increase and decrease, respectively):

36
+ 1 +1 +2
l i A K ho-Z,,
The concentration of electronic charge near the oxygen will decrease the interaction energy
of bo' with the +2 charges in Ip ), while the expansion of the Ip LMOs will increase
,/p- The former term dominates AVyo'lp (e.g., AV^„.2,^=-19.3 kcal/mol and AV^,, ,,,=+3.9
kcal/mol at Rgq) since the orbital change is much larger for bo' and since Z/p(01) =
2Zbo ' {0 \ ) . The concomitant increase in e-e repulsions (AGbo ' lp ) is smaller in comparison
because the two LMOs are pointing in different directions and the concentration of electronic
charge in Ip near the oxygen is decreased.
Similar reasoning can be used to explain the increase in APE{lp). Figure A2a shows
the individual LCD contributions to APE{lp), while Figure A2b and c shows the e-e repulsion
and e-n attraction contributions, respectively. The dominant negative component is Avipto'
discussed in the previous paragraph, while the dominant positive component is the change in
internal potential energy of one Ip (e.g. LCD 2), and the interaction energy with the other Ip
(LCD 3). The two latter changes are both due to the expansion of Ip which causes an
increase in the e-n interaction energy, and a relatively smaller decrease in intra- and inter-
orbital repulsions. It is interesting to note that while G22 and G23 differ by around 0.4
hartrees, AG22 and AG23 differ by at most 0.3 kcal/mol. Also, since AV22=AV23, A'D22==At>23.
The remaining valence LCD component, Avipho, [bo{=5) is the other OH bond LCD
in D] is also increasing. The same reasoning used for Avipbo' holds here: the term
dominates the change in potential energy, leading to an overall increase in energy, due to the
increased e-n attraction energy.
37
The remaining valence term in Figure 6a is AI'Eibo). the secondar\' contributor to
AP£'(D). A breakdown of APE{bo) into individual LCD components is shown in Figure A3.
All but one valence term, Avbobo^ has been discussed previously and this term, like Avh„'ho'-
makes a relatively modest contribution. This is due to the fact that this LMO is the least
perturbed of the valence LCDs, as evidenced by the relatively small change in kinetic energy,
and the fact that Zi,o(Oi)=+l.
To summarize, the decrease in APE{bo') and the increase in the potential energy of
the remaining valence LCDs is mainly due to a respective increase and decrease in the e-n
attraction energy between the LMOs and the two +2 charges in the Ips. These two opposing
energy trends lead to a very small overall change in APE(D) with R.
A2. Hydrogen Acceptor Potential Energy
In Section E.2 it was shown that the modest change in the internal potential energy of
A (Figure 10b) at R>3.2k is due to a near cancellation of the increase in the potential energy
of the hydrogen bonded lone pair {lp'=l) and the decrease in potential energy of the
remaining valence LCDs. For R<3.2A, APEilp') levels off first, resulting in an overall
decrease in the potential energy of A, and then decreases as well. This accelerates the
potential energy drop. It is shown below that the potential energy is dominated by the effect
of LMO contraction and expansion on the electron-nuclear (e-n) attraction term.
Figure A4a shows the individual LCD contributions to APE{lp'). Clearly, the change
in potential energy associated with Ip' itself is dominant and reflects the expansion and
contraction of the LMO. A further breakdown reveals that this is much more strongly
reflected in the e-n interaction term than in the self-repulsion term {AVip-ip- and AGip'ip- in
Figure A4c and b, respectively) for all but the smallest value of R. Hence, the behavior of
APE{lp') is largely governed by AVip'ip'.
It is evident from Figure 10b that APE{A) is negative for R<~3.2A because of the
drop in potential energy of the other lone pair (//?=8), and the two equivalent OH bond LCDs

38
(Z70=9,10) relative to free water. Further decomposition of APEilp), Figure A5a, shows that
this is primarily a result of a decrease in the e-n interaction energy in Avipip and Avipbo due
to the orbital contraction discussed in Section E.l. In the case of AVipip (= ,) this is
obviously due to an increased attraction of Ip to O4. This is also true, albeit less obvious, for
^yipbo whose respective components (up and down arrows signify an energy increase and
decrease, respectively),
IpZi^iO^)
equal -1.2, -0.006, and -4.3 kcal/mol at Rgq.
Similarly for APE{bo) [=APE{9) and APfClO)], Figure A5b, where the two largest
terms are Avgs and Adqiq- Again, the change in potential energy is dominated by the e-n
interaction energy. Since LCD 9 and 10 are equivalent by symmetry.
i AV^io 2(-i AV52,„(04))
At Rgq the two latter components equal -4.4 and -0.4 kcal/mol, respectively. The reason
AV99, which also includes a term (,) equal to the first of the two components, is so
much smaller is that the second component (2AV92,(h,)) increases with decreasing i? (+1.0 at
Req) -

39
To summarize, the initial {R>3.2A) increase and subsequent {R<3.2A) decrease in
APEilp') is predominantly a reflection of similar changes in the internal e-n attraction energy
of IpThe decrease in the potential energy of the remaining valence LCDs is mainly due to
decreases in the e-n attraction energy of the LMOs and their nuclear components at the
oxygen position. These two initially opposing energy trends lead to a very small overall
change in APE{k) for R>3.2, and an marked decrease for R<3.2A when all LCD potential
energy components decrease.
A3. Correlation Energy
a. Internal Water Energies. The breakdown of A£'(2)(D) into LMO contributions is
shown in Figure A6a. The increase in the internal correlation energy of D is clearly due
solely to bo' and is only partly canceled by the decrease in the remaining LMO correlation
energies. Figure A6b shows that this marked increase in AE^^^bo') is almost entirely due to
, and so the rise in A£^2)(D) jg mainly due to the fact that SCF theory underestimates
the increase in the internal energy of the OH bond LCD directly involved in the hydrogen
bond. An LCD-component analysis of AEP'XA) (Figure A7a) reveals a less clear cut picture:
all LCD components contribute to the increase in the correlation energy, but AE^^\lp') is
mainly responsible for the rate of increase. A more detailed look at the latter contribution
(Figure A7b) reveals that most of the increase initially is due to the interaction energies of Ip'
with the remaining LMOs on A, but then as Ip' starts to contract Ae'j^.]^. increases sharply as
well.
In general it is interesting to observe that LMO contraction and expansion generally
lead to opposing changes in the internal correlation energy, namely an increase and decrease,
respectively.
b. Interaction Energies. The electron correlation contribution to the SCF interaction
energy is broken down into interaction energies of individual LMOs on A with all of D
(Figure A8a). Again the interaction of Ip' with D is the major contribution (61 % at R^q) to

40
the interaction energy, while the remaining correlation energy is equally divided among the
remaining LMOs. Figure A8b shows that the major contribution (56% at Rgg) to E^-^Ip'tD)
is the interaction energy with bo' So overall, SCF theory underestimates the interaction
energy, especially the interaction energy between Ip' and boThe latter not only makes the
single largest contribution but also is almost solely responsible for the large rate of increase
in £(2)(AID) as the two monomers are brought together.
A4. Role of Electron Exchange
In this Section the electron exchange component of the electron-electron (e-e)
repulsion term [equation (10)] is given special attention. This term is important, for example,
in density functional theory^^ and the theory of inter-molecular forces,^^ so it is useful to
study this term within an ab initio framework.
This study employs LMOs, for which the inter-orbital e-e repulsions have been
minimized. As a result, the energy due to electron exchange,^(^)
= (29)
where
Gil (30) 12
is minimized. Hence, the energetic interpretation presented in this paper is the one for which
the role of exchange is as small as possible.
Figure A9a presents a breakdown of the total change in the exchange energy with
decreasing R in terms of intra- and inter-monomer energies. Even when minimized, the
electron exchange energy cannot be ignored for R<4A. At Rgq AEX=-6.2 kcal/mol is mostly

41
due to an increase in electron exchange in D (40%) and exchange interactions between A and
D (56%). The small change in EX{A) is due to a cancellation of an increase in AEX(lp') by
the remaining LMO contributions (Figure A9b). Increase in electron exchange of bo' (LMO
4) with the other LMOs in D [Figure A 10b] is largely responsible for the relatively large
contribution made by £'X(D) [Figure A 10a]. The increase of electron exchange between the
two fragments is very localized: at Req, alone constitutes 62% of ^^(AID) and is
almost solely responsible for the rate of decrease of AEX with decreasing R (Figure All).
Acknowledgments
The authors are indebted to Drs. Walter Stevens, Brian Wladkowski, Morris Krauss, Michael
Schmidt, and Klaus Ruedenberg as well as Mr. Simon Webb for helpful discussions. We
especially thank Prof. Ruedenberg for suggesting the use of multipoles in the interpretation
of the interaction energy. JHJ acknowledges an ISU College of Letters, Arts, and Sciences
Research Assistantship and also an award from the Hoechst Celanese Corporation. This
work was supported in part by a grant from the National Science Foundation (CHE-
9317317). The calculations reported here were performed on IBM RS6000 workstations
generously provided by Iowa State University.
References
1. Feinberg, M. J.; Ruedenberg, K.; Mehler, E. L. Advances in Quantum Chemistry (P.O. Lowdin, Ed.), Academic Press, New York, 1971, Vol. 5, p. 27.
2. (a) England, W.; Gordon, M. S. J. Amer. Chem. Soc. 1971, 93, 4649. (b) England, W.; Gordon, M. S. J. Amer. Chem. Soc. 1972, 94, 4818. (c) Gordon, M. S.; England, W. J. Am. Chem. Soc. 1972, 94, 5168. (d) Gordon, M. S.; England, W. Chem. Phys. Lett. 1972,15, 59. (e) Gordon, M. S.; England, W. J. Amer. Chem. Soc. 1973, 95, 1753. (f) Gordon, M. S. J. Mol. Struct. 1974, 23, 399. (g) England, W.; Gordon, M. S.; Ruedenljerg, K. Theoret. Chim. Acta 1975, 37, 111.
3. Hurley, A. C.; Lennard-Jones, J. E.; Pople, J. A. Proc. Roy. Soc. (London). 1953, A220, 446.

42
4. (a) Edmiston, C.; Ruedenberg, K. Rev. Mod. Phys. 1963, 35, 457. (b) Boys, S. F. Quantum Science of Atoms, Molecules, and Solids (P.O. Lowdin, Ed.), Academic Press, New York, 1966, p. 253.
5. Lennard-Jones, J. E.; Pople, J. A. Proc. Roy. Soc. (London) 1951, A205, 155.
6. Parks, J. M.; Parr, R. G. J. Chem. Phys. 1958, 28, 335.
7. Pritchard, R. H.; Kern, C. W. J. Amer. Chem. Soc. 1969, 91, 1631.
8. (a) Amos, A.T.; Crispin, R.J. Mol. Phys. 1976, 31, 159. (b) Bonaccorsi, R.; Scrocco, E.; Tomasi, J. J. Amer. Chem. Soc. 1976, 98, 4049. (c) von Niessen, W. Theoret. Chim. Acta 1975, 38, 9. (d) Amos, A. T.; Crispin, R. J.; Smith, R. A. Theoret. Chim. Acta 1975, 39,1. (e) Levy, B.; Millie, Ph.; Lehn, J. M.; Munsch, B. Theoret. Chim. Acta 1970,18, 143.
9. See for example: (a) Murrell, J. N.; Randic, M.; Williams, D. R. Proc. Roy. Soc. (London) 1965, A284,566. (b) Morokuma, K. J. Chem. Phys. 1971,55, 1236. (c) Kitaura, K.; Morokuma, K. Int. J. Quantum Chem. 1976,10, 325. (d) Stevens, W. J.; Fink, W. H. Chem. Phys. Lett. 1987,139, 15. (e) Glendening, E. D.; Streitwieser, A. J. Chem. Phys. 1994,100, 2900.
10. Jensen, J. H.; Gordon, M.S. J. Amer. Chem. Soc., accepted.
11. This is mainly a conceptual exercise as no new LCDs are defined and the occupation number and nuclear charge are simply reduced by one half in the energy formula for the appropriate LCD.
12. Ruedenberg, K.; Jensen, J.H.; Gordon, M.S. Work in progress.
13. M0ller, C.; Plesset, M.S. Phys. Rev. 1934,46, 618.
14. Pulay, P.; Saeb0, S. Theoret. Chim. Acta 1986, 69, 357.
15. Fomer, W. Chem. Phys. 1987,114, 21.
16. Petersson, G. A.; Al-Laham, M. A. J. Chem. Phys. 1991, 94, 6081.
17. Some exception include (a) Reference 1 and references therein, (b) Simas, A. M.; Smith Jr, V. H.; Thakkar, A. J. Theochem 1985,123,221 and references therein, (c) Sharma, B. S.; Thakkar, A. J. Int. J. Quant. Chem. 1986, 29, 323 and references therein, (d) Allen, T. L.; Scheiner, A. C.; Schaefer ffl, H. F. Inorg. Chem. 1990,29, 1930. (e) Liu, S.-B.; Liu, X.-Y.; Yang, Q-S.; Yu, Y.-X. Theochem 1991, 251, 271 and references therein.
18. Feinberg, M.J.; Ruedenberg, K. J. Chem. Phys. 1971, 54, 1495.
19. Feller, D. J. Chem. Phys. 1992, 96, 6104.
20. Frisch, M. J.; Del Bene, J. E.; Binkley, J. S.; Schaefer III, H. F. J. Chem. Phys. 1988, 89, 3662.

43
21. (a) Dunning Jr., T. H. J. Chem. Phys. 1989, 90, 1007. (b) Kendall, R. A.; Dunning Jr.. T. H.; Harrison, R. J. J. Chem. Phys. 1992, 96, 6796. (c) Each d polarization function is described by six Cartesian components rather than the five spherically averaged components used by Dunning et al.
22. Schmidt, M. W.; Baldridge, K. K.; Boatz, J. A.; Elbert, S. T.; Gordon, M. S.; Jensen, J. H.; Koseki, S.; Matsunaga, N.; Nguyen, K. A.; Su, S.; Windus, T. L.; Dupuis, M.; Montgomery Jr, J. A. J. Comp. Chem. 1993,14, 1347.
23. Gaussian 92, Revision A, Frisch, M. J.; Trucks, G. W.; Head-Gordon, M.; Gill, P. M. W.; Wong, M. W.; Foresman, J. B.; Johnson, B. G.; Schlegel, H. B.; Robb, M. A.; Replogle, E. S.; Gomperts, R.; Andres, J. L.; Raghavachari, K.; Binkley, J. S.; Gonzdez, C.; Martin, R. L.; Fox, D. J.; Defrees, D. J.; Baker, J.; Stewart, J. J. P.; Pople, J. A. Gaussian, Inc. Pittsburgh PA, 1992.
24. Rigorously, this statement is only true in the limit of a complete basis set where basis set superposition error (BSSE) does not occur. However, it is shown in reference 18 that the basis set used here is essentially complete with respect to BSSE.
25. The centroid of charge of each LMO is used as the local origin of a LCD.
26. (a) Parr, R. G. Density Functional Theory of Atoms and Molecules Clarendon Press, Oxford 1989. (b) Labanowski, J. K. Density Functional Methods in Chemistry. Springer-Verlag, New York 1991.
27. Margenau, H.; Kestner, N. R. Theory of Intermolecular Forces. International Series of Monographs in Natural Philosophy, Volume 18, Pergamon Press, Oxford 1969.

44
y
104J£^ 0.9571A
b)
A
bo'
D
Figure 1. a) Schematic representation of the water dimer geometry used in this study. The axes are used to define the Cartesian components of the LMO kinetic energies in the text, b) Numbering scheme used for the LCDs throughout the paper. On D: l=inner shell, 2 and 3=equivalent lone pairs, and 4 and 5=OH bonds. On A: 6=:inner shell, 7 and 8=lone pairs, and 9 and 10=equivalent OH bonds.

45
4 r
o c
"« o
<1
0 -
-2 -
-4
£(AID)
- 50
t> r?] TT n ££_
3
-50
-100
4 5^
^00
8
Figure 2. Plot of the change in the total energy (bold curve, left y-axis) and its internal and interaction components (remaining curves, right y-axis), both relative to their respective values in free water and as a function of the 00-separation. In this, and all following plots, the bold curve represents the sum of all other curves.

46
20
P£(9ID)=P£(10ID)
-20
-40
-60
-80
-100
2 3 4 5 6 7 8
20
-20
-40
714
-60
-80
-100
2 3 6 7 8
Figure 3. (a) Plot of the potential interaction energy of A and D, and its A-LCD components relative to their values in free water and as a function of the 00-separation. (b) Plot of the potential interaction energy of LCD 7 and D and its LCD components relative to their values in free water as a function of the 00-separation.

47
0
5
-10
-15
-20
-25 2 3 4 5, 6 7 8
Rooi^)
Figure 4. Plot of the interaction energy of the dipole of LCD 7 with the dipole and quadrupole of LCDs 2 and 4, respectively, as a function of the 00-separation.

48
50 r
AKE{D)
APE(D)
AE^^^(P)
4 5 6 ^oo(A)
8
Figure 5. Plot of the change in the internal energy of D and its kinetic, potential, and correlation energy components relative to their values in free water and as a function of the 00-separation.

49
200
AT 50
00 AT,
50
-50 8 7 6 4 2 3
^00 (•^)
40
APEi2)=APE(3)
•W APEiS) 20
0
-20
-60
-80
2
Figure 6. Plot of the change in the internal (a) kinetic energy and (b) potential energy of D and their LCD components, relative to their values in free water and as a function of the OO-separation.

50
T 1 null I
a y^20)j
/"'N
> 1
I I •mil I I I III! I I—r
V^4..,
; 1
I I HI I I
I I mi I I L
tt;—1—rnrm—i
¥ni ) . R , ~ Wip
I I tllllM I
I IBI i I I
- wL
(••I I I ^ I
I I im I I—I—7
Figure 7. Plots of the symmetry-unique valence LMOs of D at R=Req (a-c), and the density
difference relative to LMOs in free water (d-f). The plotting plane is the Oy plane with the exception of a) and d) where the plane is that defined by H2, Oi, and the centroid of charge of LMO 2. The relative water dimer orientation is depicted schematically in the lower left hand comer of (a) where the water molecule in question is boxed. The largest magnitude contour and contour increment is 1.0 and 0.05 Bohr3/2, and 0.025 and 0.001 Bohr^ for a-c and d-f, respectively.

51
AKE(A)
'APEiA)
Figure 8. Plot of the change in the internal energy of A and its kinetic, potential, and correlation energy components relative to their values in free water and as a function of the 00-separation.

52
I 1 l U l 1 ! 1
a
/ ..
\ •
" - • " • 1 1 i n i 1 1 1 V
] M i l l 1 1 - 1
{ ' S ) ' / ' ' '
\ 1 1 " t • • 1
1 1 M l 1 1 1
- r f i m I I I
1 J - l l l I 1 1 • p - • ,
e - vi.,
1 . n t n ' 1 1 1
1 M n 1 M 1 1 ;
C ; V^9(io),fi„
> 1 1 m i l
1 1 i i l l I I 1 1 ;
f " -~ ) ' '
1 1 1 i i T i r i . 1
Figure 9. Plots of the symmetry-unique valence LMOs of A at R=Req (a-c), and the density
difference relative to LMOs in free water (d-f). The plotting plane is the Gv plane with the exception of c) and f) where the plane is that defined by h5, o4, and Oi. The relative water dimer orientation is depicted schematically in the lower left hand comer of (a) where the water molecule in question is boxed. The largest magnitude contour and contour increment is 1.0 and 0.05 Bohr^^^, and 0.025 and 0.001 Bohr^ for a-c and d-f, respectively.

53
a)
b)
AKE(A)
o E 40
Tg-AT^Q
Roo(^)
20
10
0
"o -10 £
-20 CJ
o
CO 1
o 1
-50
-60
APE{1)
APE(6)
•APE(9)=APE(\0)
^<APE{S) L APE(A)
4 5 Rooi^)
Figure 10. Plot of the change in the internal (a) kinetic energy and (b) potential energy of A and their LCD components relative to their values in free water and as a function of the OO-separation.

54
a) 40
30
20
10 C3 U
5^ 0
-10
-20
5 , Rqo (^)
7
Figure 11. (a) Plot of the change in the kinetic energy of LMO 7 and its three Cartesian components relative to their values in free water and as a function of the OO-separation. (b)-(c) Plots of LMO 7 at R=2.38A (b), and the density difference
relative to the LMO in free water (c). The plotting plane is the Ov plane. The relative water dimer orientation is depicted schematically in the lower left hand comer of (b) where the water molecule in question is boxed. The largest magnitude contour and contour increment is 1.0 and 0.05 Bohr3/2^ and 0.025 and 0.001 Bohr^ for a and b, respectively.

55
a)
b) AE^^\A)
F^Vaid)
Figure 12. (a) Plot of the change in the total energy and its SCF and MP2-correction components, relative to their respective values in free water and as a function of the OO-separation. (b) Plot of the change in the correlation energy and its internal and interaction components, relative to their respective values in free water and as a function of the OCD-separation.

56
a) 50
b)
40
30 "0
E 13 20 0
i 10
0
-10
o E
O
AKE{D)
^PE(J))
AE(D)AE(D)*
^£(D)* OMM> *0 ̂—— C
Aii:£(D)* ^ L
-=--£r-
4 5 Roo(^)
100
80
60
40
20
0
-20
-40
-60
^AKE{A}ME{A)*
AE{AIAE{A)* \ •e mlm
•APE(A),APEiA)*
3 4 5 6 ^00 (^)
8
Figure 13. (a) Same as Figure 5 except that the kinetic, potential, and MP2 values based on optimized geometries are added (dotted lines; labels marked with *). The line that is not labelled (for space reasons) represents AE(2)(D) and AE(2)(D)*. which are both essentially zero, (b) Same as Figure 8 except that the kinetic, potential, and MP2 values based on optimized geometries are added (dotted lines; labels marked with *). The hne that is not labelled (for space reasons) represents AE(2)(A) and AE(2)(A)*, which are both essentially zero.

57
a) 0
-10 -10
-20 "
"o p -30 - •A\)45 -40 A'U42=A'U43
o -50 / 5 -60 - / AP£(4)
-70 - /
-80 1 1 1 1 1 2 3 4 5 6 7 8
b) 60 -
50
"o 40 1 AG41
\
o 30
20
WAG44 - ^^9/^—AG42=AG43
o
10 _
0 2 3 4 5 6 7 8
-60 ^^ 1 ^ 1 2 3 4 5 , 6 7 8
^00 (•^)
Figure Al. a) Plot of the change in the internal potential energy of LCD 4 and its LCD components, relative to their values in free water and as a function of the 00-separation. b) Plot of the change in the components of the electron-electron repulsion part of the intemal potential energy of LCD 4, relative to their values in free water and as a function of the OO-separation. c) Plot of the change in the components of the electron-nuclear attraction part of the intemal potential energy of LCD 4, relative to their values in free water and as a function of the OO-separation.

AE (kcal/mol) AE (kcal/mol) AE (kcal/mol)

59
AP£{5)
^53
At)55
^OO (^)
Figure A3. Plot of the change in the internal potential energy of LCD 5 and its LCD components, relative to their values in free water and as a function of the OO-separation.

60
a)
o p
C3 a
It)
1 0 -
A'U79-A'U7io
b)
0
1 ca CJ
C)
o £ C3 CJ
AV-,o=Ay
-10
2 3
Figure A4. Same as for Figure Al, but for LCD 7.
4 5 o 6 ^OO

61
A\)go-A'Ugio
AP£(8)
Ran (A)
b) 5
0
o -5 S
' o es -10
-15
-20
I APE{^)
4 5. ^00 (•^)
Figure A5. (a) Same as for Figure A3, but for LCD 8. (b) Same as for Figure A3, but for LCD 9.

62
a)
o E
O
1.5
1
0.5
0
-0.5
A£^-^X4)
A£<2)(D)
AE^^\2)=^E^^\3)
4 5^ ^00 (•̂ )
8
b) 1.6 -i
1.4 IA£<^\4) -
1.2 - 1
-
"o 1 S - \ -
1 0.8 - \
-
0.6 <1
0.4 _
0.2 - { -
0 2 3 4 5 6 7 8
/?00(A)
Figure A6. (a) Plot of the change in the internal correlation energy of D and its internal-LCD components relative to their values in free water and as a function of the 00-separation. (b) Plot of the change in the internal correlation energy of LCD 4 and its LCD components, relative to their values in free water and as a function of the OO-separation.

63
a) 2 n
1.5
o 1 E '
o
< 0.5
0
-0.5
b) 0.8
0.6
1 0.4
A£^2)(A)
AE'^\8)
a£*2'(9)=a£<2)(io)
AE^^\7)
4 5 6 ^oo (^)
O
0.2
0
-0.2
lAE^^\7)
A .(2) _ A (2) A (2) ^C7Q — I^CgjQ, ^t^yg
4 5„ ^00 (^)
H
8
Figure A7. (a) Same as for Figure A6a but for A. (b) Same as for Figure A6b but for LCD 7.

64
a)
o E
"rt CJ
0
-1
-2
-3
-4
-5
•£^2^(8ID), £<->(91D)=
£^-'(10ID)
£^2)(7|D)
£^2^(AID)
Rooi^)
b) 0
-0.5
-1
f-1.5 B
-2 o
^-2.5
-3
-3.5
-4
= e ' 712 —
( 2 )
713
[£^2^(7ID)
^00 8
Figure A8. (a) Plot of the correlation correction to the interaction energy of A and D, and its A-LCD components, relative to their values in free water and as a function of the OO-separation. (b) Plot of the correlation correction to the potential interaction energy of LCD 7 and D, and its LCD components, relative to their values in free water and as a function of the OO-separation.

65
a) 5
0
-5 0 B
1 -10
^ -15
-20
-25
b)
A£X(A)
0.5
0 S 1 0 o
< -0.5
-1
A£X(D)
£X(AID)
4 5„ ^00
AEXm
AEX(6)
AEXi9)=AEX{lO)
^EX{^)
4 5
^00 (•^) 7
Figure A9. (a) Plot of the change in the exchange energy and its internal and interaction components, relative to their respective values in free water and as a function of the OO-separation. (b) Plot of the change in the internal exchange energy of A and its internal-LCD components relative to their values in free water and as a function of the OO-separation.

66
a)
e -4 cd u
-6
-8
-10
A£X(1)
AEX(5)
AEX{2)=AEX{2)
AEX{4)
A£X(D)
n
8
b)
AG ,̂ = AGfj
A£X(4)
5 /?oo(A)
8
Figure AlO. (a) Same as Figure A9b, but for D. (b) Plot of the change in the internal exchange energy of LCD 4 and its LCD components, relative to their values in free v/ater and as a function of the OO-separation.

67
a)
o E
"« u
2
0
-2
-4
-6
-8
-10
-12
-14
£X(6ID)
£X(8ID), £X(9ID)=£X(10ID)
£X(7ID)
f£X(AID) ^00
b)
:i3 C3 O
2
0
-2
-4
-6
-8
-10
-12
^715' ^712 ~ ^713
'£X(7ID)
4 5 ^00 (A)
8
Figure All. (a) Plot of the exchange interaction energy of A and D, and its A-LCD components, relative to their values in free water and as a function of the 00-separation. (b) Plot of the exchange interaction energy of LCD 7 and D, and its LCD components, relative to their values in free water and as a function of the OO-separation.

68
CHAPTER 3. AN EFFECTIVE FRAGMENT METHOD FOR MODELING
INTERMOLECULAR HYDROGEN BONDING-EFFECTS ON QUANTUM
MECHANICAL CALCULATIONS
A paper published in and reprinted with permission from
Modeling the Hydrogen Bond, D. A. Smith, Ed. ACS Symposium Series 569
Copyright 1994 American Chemical Society
Jan H. Jensen, Paul N. Day, Mark S. Gordon, Harold Basch, Drora Cohen, David R. Garmer,
Morris Kraus, and Walter J. Stevens
Abstract
The effective fragment potential (EFP) method is introduced as a way to model the
effect of intermolecular hydrogen bonds on molecules described by standard quantum
mechanical (QM) methods. The chemical system of interest is divided into two
regions; an "active region" (AR) described by QM, and a "spectator region" (SR) that
influences the AR via hydrogen bonding. The SR is replaced by an EFP which
describes the interaction by three terms: electrostatics, polarization, and exchange
repulsion. The potentials are derived from separate ab initio calculations on the
prototypical interactions represented by the spectator region. The method is
currently being implemented in the quantum chemistry code GAMESS. Some
applications involving water in the SR are presented.

69
Introduction
Hydrogen bonding is one of the most important forms of intermolecular interaction. It is a
critical component of biomolecular structure, molecular recognition, and protic solvent
effects to name a few. Efficient computational models that describe hydrogen bonding
accurately are thus essential for studies of such topics. One such model, the effective
fragment potential (EFP) method, is introduced here.
Philosophy Behind The EFP Method
Initial Assumptions. The wavefunction of a chemical system of interest is divided into an
"active region" (AR) and a "spectator region" (SR). The AR is the region in which chemical
changes (e.g. bond breaking/making) occur. The chemistry in the AR is influenced by
intermolecular hydrogen bonds to the SR. Thus, no covalent bonds connect the AR and SR.
If one initially neglects the overlap of the two regions (errors introduced by this neglect will
be discussed later), it is possible to relate the inter-region interaction to the properties of the
isolated regions, in a general way. Following Buckingham (1), the total hamiltonian is
defined as the sum of the AR and SR hamiltonians plus an interaction term. V:
= + + (1)
When overlap, and hence electron exchange, is neglected one can treat the electrons as
belonging to one or the other of the two regions. The wavefunction of the un-perturbed
system, in which neither region is perturbed by the presence of the other, can then be written
as the product of the isolated AR- and SR-wavefunctions. This wavefunction is an
eigenfunction of whose eigenvalue is the sum of the energies of the isolated AR

70
and isolated SR. The energy due to the interaction, and resulting perturbation, of the two
wavefunctions can be obtained through perturbation theor\' with V as the perturbation, and is
then
In this case V describes purely Coulombic interactions and classical interpretations can be
given to each energy term. The first order energy corresponds to the electrostatic
interactions of the static AR and SR charge distributions. The second order energy is
comprised of two polarization energies (AR polarizing SR and SR polarizing AR) and a
dispersion energy. The total interaction energy correct to second order is therefore
At smaller inter-region distances, where electron exchange becomes important, the
total un-perturbed wavefunction must be antisymmetrized and is no longer an eigenfunction
of Hence, it is not obvious how to relate the exchange repulsion energy, that
must be added to the total energy, to the properties of the individual regions.
Further Assumptions. The following points are particular to the EFP implementation. (1)
The wavefunction of the SR is replaced by an EFP comprised of effective potentials that
simulate SR influence on the AR wavefunction. The AR wavefunction is described with
standard ab initio MO theory. (2) The internal structure of the SR does not change, and the
SR hamiltonian (and resulting energy, £5^') can thus be ignored. (3) The internal energy of
the AR includes since the AR wavefunction automatically responds to the presence of
the EFP in the course of the energy evaluation.
( 2 )
E" — r(0) 4. r<0' 4. 4. pPoi 4. pP"' 4. p^'^n (3)

71
p - rio' + fP"' ^AR ~ ^AR ̂ ̂AR • ( 4 )
(4) The dispersion term in equation 3) is presumed to have negligible effects on the
AR-electronic structure, based on the /?"^-distance dependence (I). When exchange
repulsion becomes important (at small inter-region separations such that the charge
distributions overlap), an additional term, , must be added. The total energy of the
system is then
The effective fragment potentials are added to the one-electron part of the AR hamiltonian,
so the total energy in the AO basis may be rewritten as
The second and third terms describe the interactions of the EFP with the electrons and nuclei
of the AR, respectively:
'Exchange Repulsion •Electrostatics •Polarization (5')
(5)
(6)
v;.=j^r,(/.;(i)v'^^'(i)0.(i). (7a)
A
(7b)

72
The EFP can further be divided into electrostatic, polarization, and exchange repulsion
contributions, cf. equation 5.
v"'^'"{i)=^v/'"-(i)+X\f"(i)+|;i/f(i). (8) k I ni
where AT, L, and M are the total number of reference points associated with the respective
potentials. The first term is the molecular electrostatic potential (MEP) of the isolated SR.
The second term represents the change in this MEP induced by the AR wavefunction. The
third term is a repulsive potential that describes the exchange repulsion between the AR and
SR. The nuclear part of the EFP consists only of the first two terms since the exchange
repulsion is a purely electronic effect.
A key feature of the EFP approach is that these potentials are derived from separate
ab initio calculations. The previous discussion stated that the electrostatic and polarization
terms can be rigorously derived from separate calculation of SR properties. This is not
rigorously possible for the exchange repulsion term. The next section describes how each
component of the potential is obtained, and how the potential is used during the derivation of
the AR wavefunction.
Constructing An Effective Fragment Potential
Electrostatic Interactions. The electrostatic interaction dominates the hydrogen bond
energy. Buckingham (7 j has shown that this interaction potential can be related to the
properties of the free molecules by expanding the molecular electrostatic potential (MEP) of
one charge distribution in a multipolar expansion about an expansion point, k. Thus the
electrostatic interaction potential of the AR and SR can be expressed as

73
^U- u oh u h
Here, is the net charge of the SR charge distribution, |i , 0, and Q are the dipole,
quadrupole, and octupole, respectively, of the SR, and F, F', andF" are the electric field,
field gradient, and field second derivative operators, due to the AR, at point k. As with the
perturbative analysis described above, this expansion is only rigorous if the molecules have
non-overlapping charge distributions.
In general, an infinite number of terms is required to get an exact expansion of the
MEP. However, by choosing several expansion points {K in equation 8) for a given
molecule, the expansion's convergence can be greatly accelerated. Numerous schemes (2-4)
have been developed to efficiently describe the MEP. The efficiency is usually determined
by comparing the accuracy of the fitted MEP, relative to the quantum mechanical MEP, to
the number of terms in the expansion. The electrostatic part of the EFT" can be any
expansion, but a compact expansion obviously reduces computational expense.
The distributed multipolar analysis (DMA) of Stone (5-6) has been found to give
well-converged multipolar expansions for several small test molecules (7). This permits (but
does not require) truncation at the quadrupole term at expansion points at the atom centers
and bond midpoints, the expansion centers recommended by Stone et al. (6). Multipolar
expansions of each gaussian product density element are evaluated at the expansion centers
closest to the density element. Thus, the best expansion points coincide with large
concentrations of gaussian product centers, e.g. atoms and bond mid-points. This is an
approximation to the method of Rabinowitz, el al. (8) in which each of the N(N+l)/2
gaussian product centers in the basis set is used as an expansion point. While this yields

74
finite expansions at eacii point, it results in an unwieldy number of points that are basis set
dependent.
Charge Penetration. Typical hydrogen bonded distances between two atoms are
generally shorter than the sum of their van der Waals radii, indicating that the atomic charge
distributions are overlapping to a non-negligible extent. As mentioned previously, the form
of the interaction potential in equation 9 is rigorous only for non-overlapping charge
distributions. The multipolar expansion is not an accurate representation of the exact
quantum mechanical MEP inside the region of significant charge density [one definition of
this region is the 0.001 au charge density envelope (9)]. As the charge distributions
interpenetrate, the MEP seen by one molecule due to the charge density on another molecule
is significantly altered, due to the overlap of the two charge densities. Since nuclei generally
are outside the overlap region they are effectively deshielded, leading to an effective increase
in nuclear charge and thus an effective increase in electron-nuclear attraction. Charge
penetration effects are therefore always attractive. Neglecting this charge penetration effect
can result in serious errors.
The penetration effects are included in the EFP model by fitting the multipolar
expansion of the MEP to the exact quantum mechanical MEP of the isolated spectator
molecule. This is done by adding a penetration potential to each multipolar expansion, and
optimizing penetration parameters to obtain the best fit to the accurate quantum mechanical
MEP of the isolated SR. Preliminary test calculations on neutral atoms (7) indicate that the
penetration effects decay rapidly with distance, and can be modeled with a single gaussian.
The gaussian form facilitates easy implementation in integral evaluation and derivative
schemes. Thus, by introducing adjustable parameters and and making the substitution
(10)

75
in the electrostatic part of the EFP, intermolecular electrostatic interactions were consistently
reproduced to within 5% or less of ab initio values at van der Waals distances (7).
Polarization. As indicated by equation 3, a part of the intermolecular interaction energy
arises from the change in electronic structure in one molecule due to the presence of another,
i.e. polarization. This interaction can be expressed in terms of properties of the isolated
molecules, i.e. molecular multipolar polarizabilities, (7) in an expression similar to that for
the electrostatic interaction,
o h a b c a b e d
Here a is the dipole polarizability tensor, and A and C are dipole-quadrupole and
quadrupole-quadrupole polarizability tensors, respectively. The field and field gradient terms
(F and F') are similar to those in equation 9. In the EFP methodology, several expansion
points (L in equation 8) are used to describe the polarizability of the SR. This leads to
accelerated convergence and allows the individual expansions to be truncated after the first
term while still maintaining some description of the higher order effects. Thus, the
polarization term in the EFP is given by

76
where A|i is referred to as the induced dipole moment at point /. Since )). the
expectation value of the field due to the AR at point /, depends on the final wavefunction, the
polarization term is non-linear with respect to the wavefunction. This is solved by obtaining
an initial guess at the induced dipole, e.g. calculated by using the current electric field, and
iterating to self-consistency. Since the distributed polarizabilities within an EFP are derived
from fully-coupled SCF calculations (see below), the induced dipoles within an EFP
molecule are not required to interact directly. This is an approximation if they arise from a
non-uniform field.
A few methods have been developed to obtain distributed polarizabilities (10-13).
The method most compatible with the EFP methodology is the one due to Garmer and
Stevens (13) in which the molecular polarizability is decomposed in terms of localized
molecular orbital (LMO) contributions. Each LMO polarizability is given by the (numerical)
first derivative of the LMO dipole (p.') with respect to a uniform field:
F • ^
Thus, L in equation 8 is the number of LMOs in the SR, and each point, /, is at the position of
the LMO centroid of charge. Summing a'^ over all LMOs gives the .n' component of the
total molecular polarizability. It is important to note that the molecular polarizability tensor
is symmetric, i.e. the sum of, say, the ;c>'- and the yx-components of the LMO-a's are equal,
but that this is not necessarily true for each individual LMO-a.
Several tests have been performed (7) to compare the distributed polarizability model
to the standard molecular polarizability and to Hartree-Fock SCF results. It is found that the
distributed model generally reproduces the SCF results better than the single polarizable

77
point model. The average error in energy for the former is around 10-209t. thus the majority
of the polarization energy in equation 11 can be modeled through the first term.
Exchange Repulsion. Exchange repulsion can dominate the intermolecular interaction
energy at distances where the charge density of two molecules overlap significantly. It arises
in part from the fact that charge density in the overlap region is depleted, leading to a
decrease in electron-nuclear attraction and thus a net repulsive interaction {14). As pointed
out previously, no rigorous way to describe this repulsion in terms of properties of the
isolated molecules exists. Thus, approximate methods for implementing this effect in EFP
calculations must be tested on molecular systems for which this exchange repulsion energy
has been calculated explicitly. In the EFP method reported here, the exchange repulsion
energy representation is chosen to be as simple as possible, requiring only one-electron
integrals and depending only on the density of the AR. The general approach used here is to
calculate the exchange repulsion energy for a variety of intermolecular geometric
arrangements for a complex (A---B) of interest, and fit the resulting energy surface to some
functional form. The exchange repulsion energy, EXO, is calculated by using the energy
decomposition scheme of Morokuma and Kitaura (14-15). Alternatively, it can be redefined
as the difference between the total ab initio energy and the electrostatic plus polarization
energy, which implicitly includes any charge-transfer and dispersion effects.
Repulsive effective potentials (REPs) are chosen here as a way to implement the
exchang e r e p u l s i o n i n t e r a c t i o n i n t h e E F P m e t h o d o l o g y . H e r e , a R E P c o n s i s t s o f s e v e r a l { M
in equation 8) linear combinations of gaussians,
(14)

78
where the coefficients ^ and or have been optimized to reproduce the exchange repulsion
energy surface (ERES) of a pair of molecules (A and B), for a given M. J. and n. This fitting
of the ERES is accomplished by minimizing the following error function.
.V/
-EXO^
EXO; ( 1 5 )
Here, P is the number of points on the ERES, corresponding to various orientations of A and
B; EXOp is the exchange repulsion energy at point p, and ( % Y y""-? ni
) is the exchange
' r
repulsion energy due to the REP of molecule B interacting with the unperturbed
wavefunction of A at point p. Molecule B is then the molecule to be replaced by an EFP, and
molecule A is the molecule in the AR to be described by quantum mechanics. It will be
shown below that the repulsive part of the EFP can be used in calculations where the AR is a
molecule other than A, and still give reasonable results. This transferability is not necessarily
a given, so it has been established through testing. Alternatively, new repulsive potentials
must be obtained for each molecular species used in EFP calculations.
Locating Stationary Points
While the internal structure of the of the EFP is fixed, its position relative to the AR is not.
So, to obtain the optimum interaction energy, the overall structure must be optimized. This is
achieved through a standard Newton-Raphson procedure. Since the internal EFP-geometry is
fixed, each EFP adds six degrees of freedom to the system. The six degrees of freedom
chosen are the three Cartesian components of the overall translation of the EFP relative to an

79
arbitrary origin and the three Cartesian components of the rotation vector around the EFP
center of mass (COM). The corresponding energy derivatives, depicted schematically in
Figure 1, are the Cartesian components of the net force and total torque around the COM.
These new derivatives are obtained through the following transformation.
Here, and F/ are the x components of the total iranslational force and torque due to all
terms on fragment A, respectively and [v];c is the component of vector v. Similar equations
apply for the x and >' components. The last term in equation 16b describes the torque induced
on the fragment multipoles by the electric field of the ab initio system. The detailed
expressions for the energy derivatives and torques are given elsewhere (17).
Applications
In the applications of the EFP method described in this section the SR region is taken to be a
water molecule. The EFP used for the water molecule is described by five multipolar
expansion points (corrected for charge penetration), four polarizable points, and three
exchange repulsion points. All terms in the EFP are evaluated at the RHF/CEP-3 IG* (18)
level of theory (d orbital exponent=0.85) using a fixed water geometry with bond lengths of
O.957A and a bond angle of 104.52°. The multipole expansion points are located at the three
nuclei and at the two bond midpoints. Multipoles through octupoles are included in the
evaluation of the energy and its derivatives. Multipoles have been evaluated from ab initio
calculations on the water molecule by the method described by Stone (5-6). Four effective
(16b)
(16a)
u a

80
polarizability points are used, located at the centroids of the four valence localized molecular
orbitals. These polarizabilities are obtained from ab initio calculations carried out under the
influence of an electric field. Three exchange repulsion points are included in the effective
fragment potential, one located at each nucleus. The contribution to the interaction potential
from each of these points is given by a sum of two spherical gaussians. The potential was fit
to the ERES of the water dimer. All calculations were performed with a local version of the
GAMESS (79) program.
Water Dimer. The water dimer system is chosen as an initial test case for the EFP method.
The effect of replacing either the hydrogen bond donor or acceptor water molecule with an
EFP-water is compared to dl\-ab initio calculations. Properties of interest include the dimer
structure, interaction energy, and vibrational frequencies, evaluated at the RHF/CEP-31G*
level of theory. In addition, the effect of polarization functions on the interaction energy is
studied.
Table I lists the optimized structure of the water dimer. The most important
geometric parameters in the effective fragment calculations are the internal coordinates of the
ab initio molecule. These values are underlined in Table I. The values marked with an
asterisk are fixed in the effective fragment method. Table I indicates that the internal
structure of the ab initio water molecule is predicted quite accurately by the effective
fragment method. In both effective fragment calculations, the bond lengths in the solute
0
molecule agree with those from the full ah initio calculation to within 0.001 A, and the bond
angle agrees to better than 0.1°. As for the relative positions of the two molecules, the
hydrogen bond length is off by at most 1% (0.022A for EFP=acceptor). The orientational
angle 6 is off by as much as 11° when the EFP acts as the acceptor. This also represents the
largest difference in structure between the two EFP calculations.

81
Table II gives the interaction energies for the two water molecules at the equilibrium
structures obtained from each of the three types of calculations with three basis sets. In the
calculations with the CEP-31G* basis set the interaction energies predicted by the H-donor
EFP calculation and by the H-acceptor EPF calculation are less than the 5.0 kcal/mol
predicted in the nW-ab initio calculation by 0.2 kcal/mol and 0.3 kcal/mol. respectively. This
is virtually unchanged when the basis set quality is increased by adding p polarization
functions (p orbital exponent=1.0) on the hydrogens in the ab initio water molecule. Larger
discrepancies, 1.2 and 2.6 kcal/mol, arise when the oxygen polarization functions are
removed. The source of these discrepancies is the fact that the EFP models a CEP-3IG*
water molecule and the EF calculations therefore resemble calculations with one CEP-3 IG
water and one CEP-3 IG* water. Such al\-ab initio calculations result in optimized
interaction energies of 6.9 kcal/mol and 5.6 kcal/mol for d functions on only the donor or
acceptor water, respectively. These more sophisticated full ab initio calculations are in better
agreement with the EFP calculations.
Table HI gives the harmonic vibrational frequencies and vibrational zero-point energy
(ZPE) changes obtained from hessian calculations on the dimer geometries in Table I. Only
numerical hessians are available in effective fragment calculations. To ensure accuracy, the
maximum component of the gradient of each geometry was reduced to less than 10"^
Hartree/Bohr, and the symmetrical displacements around the minimum were reduced to
0.001 Bohr. For the water dimer this generally leads to frequencies that are within 4.1% of
analytical results. The harmonic analysis in the effective fragment calculations shows an
overestimation of the frequencies associated with the internal coordinates of the ab initio
molecule by 0.06%, 0.0%, and 0.05% when the H-donor is replaced with a fragment and by
0.3%, 0.5%, and 0.2% when the H-acceptor is replaced with a fragment. For the frequencies
associated with the relative motion of the two waters, the H-donor effective fragment
calculation agrees quite well with the full ab initio calculation, except for frequencies #3 and

82
#4, for which the fragment results (187 and 233 cm"') are 19Vc and 269^- greater than the ah
initio frequencies. In the H-acceptor EF calculation, frequencies #3-6 are up to 269r (for #3)
higher than in the d\\-ab initio calculation. However, these deviations translate to only minor
(>0.3 kcal/mol) errors in the zero point energy (ZPE) correction to the interaction energy.
Water-Formamide. In order to evaluate the more general usefulness of the effective
fragment potential for the water molecule, we need to study its interaction with AR
molecules other than water. The interaction between the formamide molecule and the water
molecule is of interest in biochemistry because formamide is the simplest prototype for a
peptide linkage. In an ab initio study by Jasien and Stevens (20) four stationary points were
found on the RHF/DZP (21) fonnamide-water potential energy surface, within the constraint
of Cs symmetry. We have carried out ab initio geometry optimizations in Ci synmietry on
this system with the water molecule replaced by an effective fragment. In addition we have
done full ab initio geometry optimizations in Ci symmetry. Both lead to three Ci minima
similar to three of the Cs structures. The fourth structure was a Cs transition state at the all-
ab initio level of theory.
Figure 2 depicts the three Ci minima, labeled I-III, that were located by both aW-ah
initio and EFP optimizations. Selected structural parameters are listed for the full ab initio
(bold) and EFP calculations. In the effective fragment calculations on the three minima, the
length of the hydrogen bonds between the two molecules is longer than predicted by the ab 0
initio calculations by just 0.04 (structure ID; 2%) to 0.17 (structure I; 8%) A. The
orientational angles obtained in the effective fragment calculations do not agree exactly with
the ab initio calculations either, but are qualitatively correct.
The geometric parameters of greatest interest, the internal coordinates of the
formamide molecule, are compared in Table IV. The first column in Table IV lists the
internal coordinates of a lone formamide molecule in its equilibrium configuration, as

83
obtained in an ab initio calculation with the DZP basis, and the other six columns list the
change in these coordinates caused by the presence of a water molecule. For each of the
three minimum energy configurations, results are listed both from full ab initio calculations
and from effective fragment calculations. While the changes in these coordinates are small,
the effective fragment method consistently predicts nearly the same perturbation in these
internal coordinates as was obtained in the full ab initio calculations.
Table V lists the interaction energies for structures I-III. For the three minima on the
potential energy surface, the interaction energies obtained in the effective fragment
calculations differ from those obtained from the full ab initio calculations by 1.6 (19%), 0.9
(15%), and 0.5 (9%) kcal/mol. Although the effective fragment method underestimates the
interaction energies, it does correctly predict that structure I is considerably more stable (by
1.6 kcal/mol, compared to 2.3 kcal/mol in the ab initio case) than structures II or III, and that
structures 11 and EI are comparatively close in energy. Clearly, one arrives at the same
qualitative picture of the water-formamide interaction based on both methods.
The fact that the EF method does not do quite as well at predicting the formamide-
water interaction energy as it did at predicting the water dimer interaction energy is probably
due to the exchange repulsion part of the effective fragment potential, which was fit to the
water dimer interaction. More sophisticated exchange-repulsion potentials which explicitly
take into account the overlap between the AR and the SR may provide improved
transferability. Considering the simple form of the potential used here, the effective fragment
method does quite well. Since the formamide-water system is small enough to be treated in a
full ab initio calculation, this system could in principle be used to construct an exchange
repulsion potential that might be more accurate in modeling the hydration of larger peptide
systems.

84
Conclusion and Future Directions
The effective fragment potential (EFP) method is introduced as a way to model
intermolecular hydrogen bonds and their effect on quantum mechanical wavefunctions. It is
shown that the effect of a water molecule on the ab initio wavefunctions of water and
formamide can be modeled relatively accurately by introducing an EFP in the ab initio one-
electron Hamiltonian. The potentials are obtained from other ab initio calculations on the
isolated water molecule and water dimer. Thus for the formamide-water complexes no
parameters in the EFP model have been adjusted to reproduce the interaction. It is therefore
encouraging to find only relatively modest deviations from calculations in which both the
formamide and the water are treated quantum mechanically. The method is in principle
extendible to model any intermolecular hydrogen bond.
Current research is focused on a parallelizing the EFP code in GAMESS, as well as
including energy and gradient terms that describe EFP-EFP interactions. The latter would
allow, for example, to surround an ab initio wavefunction with more than one EFP water to
approximately model the first solvation shell in aqueous solvation.
Acknowledgments
This research was supported, in part, by grant No. 88-00406 from the United States-Israel
Binational Science Foundation (BSF), Jerusalem, Israel. Two of the authors (MSG, JHJ)
acknowledge the support of the National Science Foundation (CHE89-11911).
Literature Cited
1. Buckingham, A. D. In Intermolecular Interactions: From Diatomics to Biopolymers. Pullman, B., Ed.; Perspectives in Quantum Chemistry and Biochemistry; John Wiley & Sons Ltd.: New York, NY, 1978, Vol. I, 1-68.

85
2. Williams, D. E.; Yan, J. -M. Adv. Am. & Mol. Phys. 1988, 23, 87.
3. Lavery, R.; Etchebest, C.; Pullman, A. Chem. Phys. Lett. 1982, 266.
4. Etchebest, C.; Lavery, R.; Pullman, A. Theor. Chim. Acta (Berl.) 1982, 62, 17.
5. Stone, A. J. Chem. Phys. Lett. 1981, 83(2), 233.
6. Stone, A. J.; Alderton, M. Mol. Phys. 1985, 56(5), 1047.
7. Garmer, D. R.; Stevens, W. J.; Kraus, M.; Basch, H.; Cohen, D. manuscript in preparation.
8. Rabinowitz, J. R.; Namboodiri, K.; Weinstein, H. Int. J. Quantum Chem. 1986, 29, 1697.
9. Wong, M. W.; Wiberg, K. B.; Frisch, M. J. J. Amer. Chem. Soc., 1992.114, 1645.
10. Thole, B. T.; Van Duijnen, P. T. Chem. Phys. 1982, 71, 211.
11. Thole, B. T.; Van Duijnen, P. T. Theor. Chim. Acta, 1980, 55, 307.
12. Stone, A. J. Mol. Phys. 1985, 56(5), 1985.
13. Garmer, D. R.; Stevens, W. J. J. Phys. Chem. 1989, 93, 8263.
14. Salem, L. Roy. Soc. (London) 1961, A264, 379.
15. Morokuma, K. J. Chem. Phys. 1971, 55, 1236.
16. Kitaura, K.; Morokuma, K. Int. J. Quantum Chem. 1976,10, 325.
17. Day, P. N.; Jensen, J. H.; Gordon, M. S.; Stevens, W. J.; Garmer, D. R. manuscript in preparation.
18. Stevens, W. J.; Basch, H.; Krauss, M. J. Chem. Phys. 1984, 81, 6026.
19. Schmidt, M. W.; Baldridge, K. K.; Boatz, J. A.; Elbert, S. T.; Gordon, M. S.; Jensen, J. H.; Koseki, A.; Matsunaga, S.; Nguyen, K. A.; Su, S.; Windus, T. L.; Dupuis, M.; Montgomery, J. A. J. Comp. Chem., 1993,14, 1347.
20. Jasien, P. G.; Stevens, W. J. J. Chem. Phys. 1986, 84, 3271.
21. Dunning, Jr., T. H.; Hay, P. J. In Methods of Electronic Structure Theory. Shaefer III, H. F., Ed.; Plenum press, NY. 1977, chapter 1.

86
Table I. RHF/CEP-31G(d) optimized geometries. The * marks frozen EFP coordinates, while the underlined numbers refer to the internal water structure.
H6 R /
pi-—-H4--05
' H2
Ali-ai? initio EFP=Donor EFP=Acceptor
r(Oi-H2) 0.952 0.951 0.957* a(H2-Oi-H3) 106.4 106.4 104.5* R 2.04 2.05 2.07
0 41 40 52
r(04-H5) 0.955 0.957* 0.955 r(04-H6) 0.950 0.957* 0.950 a(H5-04-H6) 105.9 104.5* 105.8

87
Table n. Interaction energies for the water dimer in kcal/mol.
Basis Set All-a^ initio EFP=Donor EFP=Acceptor
CEP-31G 7.6 6.4 5.0 CEP-31G(d) 5.0 4.8 4.7 CEP-31G(d,p) 4.9 4.7 4.6

88
Table III. Harmonic frequencies (cm"') of the RHF/CEP-31G(d) water dimer.
Frequency PA\-ab initio EFP=Donor EFP=Acceptor
1. A" 138 134 130 2. A' 145 163 144 3. A" 151 187 204 4. A' 173 233 210 5. A' 342 346 414 6. A" 605 559 642 7. A' 1808 1809 ff 8. A' 1831 ff 1836 9. A' 4074 ff 4093 10. A' 4113 4113 ff 11. A' 4214 ff 4221 12. A" 4234 4236 ff
AZPE (kcaL/mol) 2.2 2.3 2.5

89
Table FV. RHF/DZP internal coodinates of the isolated formamide molecule, and the change in these coodinates caused by an ab initio or efp water in Structures I-IIl. Bond lengths in kigstroms and angles in degrees.
Form- Structure I Structure II Structure III amide ab inito EFP ab initio EFP ah initio EFP
r(C-N) 1.353 -0.009 -0.007 -0.006 -0.006 -0.005 -0.004 r(C-O) 1.196 0.009 0.007 0.007 0.004 0.004 0.004 r(C-H) 1.092 -0.002 -0.001 -0.003 -0.002 0.000 0.000 r(N-H) 0.995 0.005 0.005 0.000 0.000 0.000 -0.001 r(N-H') 0.992 0.000 0.000 0.000 0.000 0.005 0.004 a(O-C-N) 124.9 0.2 0.2 -0.5 -0.3 0.5 0.5 a(H-C-N) 122.3 -1.0 -0.8 -0.4 -0.2 -0.3 -0.3 a(H-N-C) 121.3 -0.7 -0.7 -0.1 -0.1 -0.1 -0.1 a(H'-N-C) 119.1 0.1 0.1 0.1 0.1 -0.5 -0.6 d(OCNH) 0.0 1.6 2.6 0.4 -0.3 0.0 0.3

90
Table V. RHF/DZP interaction energies for three water-formamide complexes in kcal/mol.
Structure Al\-ab initio Water=EFP
I -8.3 -6.7 II -6.0 -5.1 m -5.3 -4.8

91
COM
z
Figure 1. Schematic representation of the transformation of the Cartesian gradient components on a fragment to internal coordinate components defined relative to the center of mass (COM) of the EFP.

92
2.01 2.06
104.7 122.8
Structure II
175.0 176.^
2.10 Structure ni
2.20 2.25
138.6 141.5
Structure I
Figure 2. RHF/DZP optimized structures of three formamide-water complexes, with and without the water replaced by an EFP. The bold numbers are structural parameters for all-ab initio calculation, and may be compared to the numbers obtained in the EFP calculations. Bond lengths are given in Mgstroms and bond angles in degrees.

93
CHAPTER 4. AN APPROXIMATE FORMULA FOR THE INTERMOLECULAR
PAULI REPULSION BETWEEN CLOSED SHELL MOLECULES
A paper to be submitted to Molecular Physics
Jan H. Jensen and Mark S. Gordon
Abstract
The exchange repulsion formula proposed by Murrell' is considered in detail and
applied to several water dimer geometries. Insights into the contributing terms are obtained
by using localized molecular orbitals. Potentially important terms missing in the Murrell
formalism are identified and evaluated for the helium dimer using several basis sets. The
results point toward a relatively simple expression for intermolecular exchange repulsion,
based on the isolated wavefunctions of the two overlapping species.
1. Introduction
The Pauli exclusion principle gives rise to a repulsion between electrons of like spin^
— the so-called Pauli repulsion — that is much stronger than the Coulombic repulsion.3 It is
therefore a key determining factor behind molecular structure, ̂ '4 and the dominant short
range intermolecular "force." It is variously referred to as exchange repulsion, steric
hindrance, kinetic repulsion. Born repulsion, and four-electron destabilization.^ This paper is
concerned with the influence of Pauli repulsion on intermolecular interactions commonly
referred to as exchange repulsion. These two terms will be used interchangeably. Exchange
repulsion is the most important quantum mechanical effect that must be addressed when
modeling non-bonded interactions. Understanding this effect and how to efficiently include
it in such models presents an important challenge,6 and is the aim of this paper.

94
Since exchange repulsion is a direct result of the Pauli exclusion principle, it is a
purely quantum mechanical effect. Its manifestations within the molecular orbital (MO)
approximation were demonstrated elegantly by Baerends^ by considering two approaching
one-electron systems A and B (described, respectively, by \j/^ and if/g) with like spin. To a
first approximation the total wavefunction, T, is written in terms of and The Pauli
exclusion principle states that the wavefunction 4^ must be antisymmetric with respect to
electron exchange and is therefore written as a Slater determinant,
^(U2) = -^=i_[v/^(i)v/^(2)- V/,(2)va,(1)] (1)
where S is the overlap integral (VaIVb)- This requirement leads to cross-terms in the one-
electron density which deplete electron density in the overlap region,
p(l) = 2j 14̂ (1,2)l'̂ iT, = ̂ [|v/,(l)f + lv/,(l)|- -(2)
This local electron depletion gives rise to an increase in the energy, known as Pauli repulsion.
The expression for the density, and therefore the evaluation of the energy, can be simplified
by requiring and y/g to be orthogonal (| Vb') =
P(l) = K(l)f+K'(l)f (3)
Concepmally this simply translates the effect of the Pauli principle from the density to the
MOs.
The energy decomposition analysis due to Morokuma and Kitaura^ and the effective
Hamiltonian method of Huzinaga® are two examples of methods that incorporate Pauli

95
repulsion into intermolecular interaction energies by enforcing orbital orthogonality. Other
methods obtain the Pauli repulsion energy in terms of the unperturbed (non-orthogonal)
orbitals of the interacting molecules, either by exchange perturbation theory' •9-'0 or by direct
evaluation of the density matrices in the form of Eq The most well known work in
this category is that due to Murrell and co-workers.'
In this paper we: (1) summarize the derivation, due to Jeziorski and co-workers,^' of
the necessary formulas in the density matrix formalism; (2) relate these formulas to those
derived by Murrell et al.; and (3) compare their numerical results to those obtained by the
Morokuma-Kitaura algorithm. The goal of this study is to find simpler formulas for Pauli
repulsion and to evaluate their accuracy by comparison to exact calculations, within a given
atomic basis set.
II. Computational Methodology
The water dimer calculations were performed with Dunning's double zeta basis set
DZP,13 while the basis sets used for the helium dimer calculations are ST0-3G,''^ 6-310,^^
6-31IG,'^ and an even-tempered basis set consisting of 12 s gaussians.^^ The localized
molecular orbitals were obtained with the energy localization scheme due to Edmiston and
Ruedenberg.l^ All calculations were performed with the quantum chemistry program
GAMESS.l^
III. Theory and Applications
The interaction energy between two molecules is calculated by constructing a total
wavefunction from the wavefunctions calculated for the two separate molecules,
(4)
and evaluating its energy relative to that of the two separate molecules.

96
(5)
Since the wavefunction is not allowed to relax through a variational minimization, the
exchange energy derived from this equation is only correct to first order. In this study it
is assumed that the two molecules in question can be adequately described by restricted
Hartree-Fock (RHF) theory,20 i.e. that their respective wavefunctions can be written as
single Slater determinants.
Here y/j is a spin orbital, i.e. the product of a spin function (a or P) and a space orbital (0, ).
If the MOs of and Tg are made orthonormal, Eq (5) can be evaluated with standard RHF
algorithms. However, if the goal is to express AE in terms of the properties of molecules A
and B, it is desirable to avoid altering the orbitals. The equations necessary to evaluate Eq
(5) for non-orthonormal orbitals are presented next. We proceed by writing the total
Hamiltonian as a sum of Hamiltonians for molecules A and B, plus a term V that represents
the potential energy of interaction between A and B,
(6)
H = H^ + Hb + V, (7)
so that AE can be rewritten in terms of two internal energies and the interaction energy:

97
^E (4>|4))
— E — E + -' ' (OlO)
(8)
— A£j + A£g + E{V).
A. The Interaction Energy
1. Theory. At this point it is usually assumed that 4^^ and are of sufficient
accuracy to be true eigenfunctions of their respective Hamiltonians, in order to eliminate the
first two terms in the previous equation; that is,
=> A£,=0, (9)
(and similarly for B). If and are approximated as single determinants [Eq (6)], Eq (9)
could prove to be a severe approximation, and this point will be addressed later. E(V) can be
evaluated using density matrix formalism similar to that for orthonormal total wavefunctions,
^(^) = + JJ (2)-y.t(i 12)yf„,(21
I2 (1")
+w
Wab is the intersystem nuclear repulsion, and Ua is the potential due to the nuclei in A. The
density matrix due to is given by
rt{l\2) = [a{l)a(,2) + Pimi)] ieA meA.B
(11)

98
[for notational convenience y{l 11) = 7(1) for this and following density matrices]. The
matrix D is given by
D = (l + S)'' (12)
Here S is the matrix of intermolecular overlap integrals between MOs. The Pauli repulsion
arises from terms in E(V) that contain elements of S. The next step is therefore to separate
these terms from the rest by rewriting the matrix D as
D = l-S(l + S)-'
= 1 + P
where
leA m^A.B
(And similarly for 7®,). Substituting Eq (14) into Eq (10) allows one to write,
(13)
and hence the density matrix as
7.',(l|2) = 7o(l|2) + rL(ll2) (14)
7o'(1|2) = [a(l)a(2) + /3(1);8(2)]£(^;(1).^,(2) (15) ieA
rLiP) = l«(l)a(2) + P(1)^(2)]X X(16)
£(V') = £„„,(V) + f:„,,(V) (17)

99
Here £'„„/(^)=(^j|V|4'g^ represents the classical Coulombic interaction between the two
separated wave functions and is the part of Eq (10) that depends solely on 7o (1), 7o (2), and
the nuclear repulsion The remaining terms are collected in ^^..^(V) and represent the
Pauli repulsion energy:
= f/,(l) + j^^T, dr,+jrU\) u,il) + j^dr, t]-t ft-,
To^) dr,
f]2 It
rr„.(112)7f„,(2ll).
(18)
To explore potential simplifications in Eq (18) is to be simphfied, P can be expanded as a
power series in S,
P = -S + S'-S'+... (19)
If Eq (19) is truncated after the second term.
7i,(l 12) = -[a(l)a(2) + i3(l)j3(2)]XS5(/ 16^1 ;6B
0;(1)(/)/2)-X5,,0;(1)0,(2) keA
(20)
Eq (20) is then substituted in Eq (18) and terms resulting from the interchange of a single pair
of electrons between 4^^ and are collected. This is accomplished by taking the product
<l)j(j)j to be of orders,; and collecting all terms of order 5^. Thus, becomes

100
£„,.(V)=-25;x(f,|')-2lSx. igA j€B
+2lS^, I€A jeB
jeA jeB Ka + V.I.. + - K, b) + I(i|2A - K,\j)
A €<4
~ f \
y.. ,+X('l2^,|A-) _keA \ leB J leS
l&B
A'€<4 / \ ' J /
keA leB J (21)
as originally derived by Murrell and co-workers. Standard integral notation is used:
(22)
^F;|9 = (')1y)
('k;|') = {"\JJ)
(ylW) = jj^;{l)0/l)-%;(2)0,(2)Jr,^r, I2
n,A=j0;(i)f/.(%(i)^r,
Several studies^l have approximated Eq (20) further by writing:
ri.(l 12) = -[a(l)a(2) + Pim2)]^'^S,[(t):a)<p^(2) - 5^0; (!)</>, (2)] (23) i€A jeB
which greatly simplifies the last term of Eq (21),
ieA j€B
+2XX5-leA jeB
E.„dV) = -2lX{i|K,|i) - 2XXS.) K,.. + n.. + I(il2-'.|j) - (ilK,|j)+ X(il2.',lj)" ieA j€B icA j€B L /e5
y,,.+X('12-'.I'">+y,..+XW^Ab) - ('Vy|i' IgB k€A
(24)

101
However, these studies^^ did not compare the results obtained using this approximate
formula to more accurate results such as those obtained by Eq (18). The accuracy of Eq (24)
is considered next.
2. Applications to the Water Dimer. In order to gauge the severity of the
approximations outlined in Eq (9), (20), and (23) for typical ab initio calculations, £'„^,,( V)
and were evaluated for the RHF/DZP water dimer geometries and compared to the
exchange repulsion energy obtained from the Morokuma-Kitaura energy decomposition
scheme."' The latter energy represents the true RHF since all terms in the Hamiltonian
are evaluated to infinite order in S. Claverie22 has argued that the use of locaHzed molecular
orbitals (LMOs) in the evaluation of and (V) should make their difference less
severe (though no supporting numerical results were presented). Table I lists results in terms
of both LMOs and canonical MOs (CMOs) in order to test this assertion. In the Appendix
we show that Jtxch is invariant against a unitary transformation but that 7,^^^ is not. Thus,
only LMOs^^ were used to calculate£'„^;,(V) in Table I while both LMOs and CMOs were
used to calculate •
The results listed in Table la were obtained by starting with the equilibrium geometry
(the row marked "R"), changing the oxygen-oxygen distance by -O.SA and +0.5A and
keeping all other structural parameters fixed. Comparing columns one and two it is found
that the error introduced by the approximation in Eq (9) and (20) ranges from -0.3 to -1.6
kcal/mol and decreases in magnitude with increasing intermolecular separation. The
approximation in Eq (23) leads to an even greater (4.7-9.7 kcal/mol) underestimation of
at small distances.
It is evident that the use of LMOs indeed results in smaller errors. Columns five and
six list the last two terms {S^ terms23) in Eq (21) and (24), respectively, evaluated using
LMOs. The good agreement between those two terms indicate that the error incurred by Eq

102
(23) arises from the missing exchange integrals in the second term of [the first terms
in V) and identical]. Of course such integrals will be more important at
small intermolecular distances. The use of CMOs leads to larger errors in both the and S-
terms.
Eq (21) was evaluated using localized MOs (LMOs) and the final column in Table I
lists the energy due to the LMO pair with the largest overlap (the lone pair and OH bond
directly involved in the hydrogen bond). It is evident that the exchange repulsion energy for
the water dimer is well represented by a single LMO pair energy.
Table lb lists results generated from the equilibrium geometry of the water dimer
optimized within the C2v point group. The difference between and shows
distance dependent deviations within 0.1 kcal/mol of those in Table la: -0.2 to -1.7 kcal/mol.
The £'„ca(^) energy difference for this structure is a little less than for the Cs
structure, especially at short distances. The agreement between the terms in Eqs (21) and
(24) are good — even when CMOs are used — and most of the error is due to the term.
As expected the exchange repulsion energy is less well localized and eipbo must include the
interaction of the lone pair LMOs with both OH bond LMOs to give satisfactory results.
In summary, the data presented in Table I indicates that is the dominant term
in and that an expansion of in terms of the intermolecular overlap [Eq (19)]
gives semi-quantitative results when truncated after quadratic terms. The use of LMOs in the
evaluation of gives better agreement with than when CMOs are used.
When LMOs are used, the most complicated term in Eq (21) can be modeled quite accurately
by the last term in Eq (24), whereas the second-to-last term in Eq (24) is the main source of
error on going from Eq (21) to (24). The use of LMOs in the evaluation of Eq (21) reveals
the localized nature of exchange repulsion interactions.

103
B. The Internal Energies
The same density matrix formalism used to evaluate E(V) can be employed for the
internal energy terms and AjEg. (We present equations for and note that the same
equations apply for Af^). The energy of <I> due to Ha is given by ̂ ^
where
K = - \ V ~ ^ U , . ( 2 6 )
The subtraction of is accomplished by substituting Eq (14) into Eq (25) and collecting the
terms that depend solely on . The sum of the latter terms equals Ea- The remaining terms
correspond to the exchange energy contribution due to the internal energy of A. The result is
= j ̂ .(l')rl.(l' I
(27) , • jj yi/,(i)r:U(2)-yi,(i 12)yi;,(21
1:
If Eq (20) is substituted into Eq (27) and the analogous equation for the following
formula is obtained after collecting terms of order 5^:

104
A£,+A£, = -2XIS„ l e A j e B
+2IIS„ l e A j e B
l € B
+ K,. + V.,, + S('PA - A',W+1('12-', - A'Jy) k € A
Y,slT, + V,,-^'^{i\lJ,-K,\k) k&A V 'teA
l47;, + l'„ + X(y|2y,-Ar,|/) /efi /efl
(28)
This equation can be greatly simplified by recognizing that all terms necessary to form Fock
matrices corresponding to Ha and Hb are present,24 so
AE, + A£, =-2£Xs4'̂ ' + + i € A j e B t e A j € B t e A l e B
(29)
Eq (29) is therefore particularly easy to implement in computer programs. Alternatively, Eq
(28) can be combined with Eq (21) to give the total exchange repulsion energy,
^ e x c h ~ ^ e x c h ( ^ ^
i e A j € B i e A j e B » e A j s B k € A l e B k e A l e B
(30a)
(30b)
In order to write the third term in terms of Fock matrices the following higher order (5^^)
exchange integral terms were retained;
-^11^ i e A j e B k e A l e i l e B A e A

105
Since most quantum chemistry programs have efficient Fock matrix generating algorithms,
including the additional higher order terms makes the evaluation of Eq (30a) easier. The
contributions of the internal energies to the total exchange repulsion energy is considered in
the next subsection.
C. Basis Set Effects
As mentioned previously, it is assumed that and are obtained by separate RHF
calculations using a finite basis set to expand the MOs. If the basis set is large enough to
approach the basis set limit the MOs will approach the exact solution to the integro-
differential equation, 25
This can significantly simplify the equations derived above since an off-diagonal element of
the Fock matrix which connects on A with on B can be evaluated quite simply ̂ 2
For example, it is easily shown that AE^ [Eq (28)] vanishes (if one remembers that 5,^ = 0),
(31)
(32)
(33)
= 0
and similarly for AE^. This was first noted by Landshoff.26 Of course AE^ vanishes only in
the limit of an infinite basis set and so the question becomes: what are the basis set effects on
the relative contributions of AE^ + AEg and to This question has been

106
considered previously^^ for the helium dimer using rather large uncontracted basis sets. We
revisit the helium dimer problem [for a fixed interatomic distance (1 .SA)] using mostly
smaller contracted basis sets in conmion use, and the results are presented in Table 11.
Column one represents the true while columns two and three give the respective
interaction- and internal-energy components of to second order. From this it is evident
that when a very small basis set is used the internal energy contribution 2 can contribute
close to 50% of the total exchange energy. The contribution drops quite rapidly with larger
basis sets (to 4% at the 6-31IG level of theory). The last two columns show how the increase
in basis set leads to a decreased error in using Eq (32) to model Furthermore, for all
basis sets used the total second order energy deviates by at most 0.1 kcal/mol from the true
answer, which indicates that at the interatomic distance used, higher order terms are not
important. Finally, it is important to note that He converges very quickly to the basis set
limit (it is essentially converged with 12 basis functions) and that more complicated systems
must be investigated.
Thus, for sufficiently complete basis sets, = £'„rt( V). Further simplification of
E^^^^ arises by rewriting the second term of Eq (21) as
(34)
(Tjj is the electronic kinetic integral due to (j)j<j)j) so that Eq (32) can be used:
= +s'')-2T,]. (35)
Localized MOs satisfy the more general SCF equations,

107
(36)
where = e, and A,,. = for i^k if energy localized LMOs are used.^^ Eq (35) therefore
becomes
/e/i j€B s.,« + <) + X F,;s, + X F;S„ - 2T„
k€A k*i
UB (37)
These additional terms may be negligible since they resemble the 5--terms neglected on
going from to Future calculations will test this assumption. The basis set-
dependent error introduced by this approximation is identical to the error introduced by
neglecting Eq (33). So in the helium dimer example presented in Table 0, the approximation
in Eq (32) will lead to a 0.2 kcal/mol error in £,„/,( V) at the 6-31IG level of theory.
rV. Conclusions and Future Directions
By combining all the approximations outlined above we arrive at this much simplified
equation for exchange repulsion;
ieA j&B ieA jeB
+2ix^.; - ('VJ'} ieA jeB L I^B keA
(38)
The accuracy of this equation will increase with increasing basis set and appears to be useless
for minimal basis sets, judging by the helium-dimer data presented in Table n. The next step
is to study this basis set effect for the water dimer and similar systems. Additional future
directions include:

108
(1) The use of canonical orbitals to obtain data similar to that in Table I, to further
ascertain whether the use of localized orbitals presents a clear advantage.
(2) The general implementation of Eq (30b) to separate the effect of Eq (9) and (20)
on E^xchiy)-
(3) The approximation of the two-electron integrals in Eq (38). This includes the use
of the Mulliken approximation's and classical electrostatics to approximate the exchange and
Coulomb integrals, respectively.
V. Appendix
It has long been known that [Eq (15)], and therefore is invariant against a
unitary transformation among the orbitals on A. In this appendix it is shown that [Eq
(20)] but not 7,^^^ [Eq (23)] is invariant against separate unitary transformations among the
orbitals 0^ on A and (pj on B,
and (Al) ieA ;eB
where
(A2) neA
and similarly for T^. and have a common leading term,
rL-i = ri/,-1 = ieA jeB
(A3)

109
(the transformations do not affect the spin functions and are ignored) which is easily shown
to be invariant:
leA jeB
=11 "A
i£A jeB \k€A I.'PXn'L'P'X'L'PrT'
B n
leB / feA I'eB
= I XSKfc hyA-I.TX-'LT'Tn keAk'eAleB I'eB leA jeB
keA (eB
Similarly, the second term in Eq (20) is also invariant:
rL-2 = XSS('P' \(pj)(pi(pk i^A j€B keA
(A4)
= X S I ( A S ) k'€Ak"&Ak'"€Ak'"'GA !eB r&B ieA jeB jtea
= XX X(<^* k^A l€B k'GA
However, the second term in Eq (23) lacks the sum over k needed to take advantage of Eq
(A2) and is therefore not invariant against a unitary transformation.
References
1. (a) Murrell, J.N.; Randic, M.; Williams, D.R. Proc. Roy. Soc. (London), 1965, A284, 566. (b) Murrell, J.N.; Shaw, G.; Mol. Phys. 1967,12, 475. (c) van Duijnevelt, F.B.; Murrell, J.N. J. Chem. Phys. 1967, 46, 1759. (d) Williams, D.R.; Schaad, L.J.; Murrell, J.N. J. Chem. Phys. 1967,^7,4916.
2. Levine, I.N. Quantum Chemistry, 3rd ed.; Allyn and Bacon, Inc.: Boston, 1983; pp 242.
3. Lennard-Jones, J. Advancement of Science 1954,51, 1356.

110
4. Gillespie, R.J.; Nyholm, R.S. Quart. Rev. 1957,11, 339.
5. Baerends, E. J. In Cluster Models for Surface and Bulk Phenomena', G. Pacchione; P.S. Bagus; F. Parmigiani. Ed.; Plenum Press, New York, 1992, pp 189.
6. Claverie, P. In Intermolecular Interactions: From Diatomics to Biopolymers, B. Pullman, Ed.; John Wiley & Sons, Chichester, 1978, Chapter 2.
7. Kitaura, K.; Morokuma, K. Int. J. Quantum Chem. 1976,10, 325.
8. (a) Huzinaga, S. J. Mol. Struct. (Theochem) 1991, 234, 51. (b) Ohta, K.; Yoshioka, Y.; Morokuma, K.; Kitaura, K. Chem. Phys. Lett. 1983,101, 12. (c) von Amim, M.; Peyerimhoff, S.D. Theor. Chim. Acta 1993, 41, 87. (d) Romero, J.A.M.; Sanz, J.F. J. Chem. Phys. 1992, 99, 1255.
9. (a) Chipman, D.M. J. Chem. Phys. 1977, 66, 1830. (b) Jeziorski, B.; van Hemert, M. Mol. Phys. 1976, 31, 713. (c) Jeziorski, B.; Kolos, W. Int. J. Quantum Chem. 1977,12, 91. (d) Jerziorska, M.; Jeziorski, B.; Cizek, J. Int. J. Quantum Chem. 1987, 32, 149.
10. van Duijnevelt-van de Rijdt, J.G.C.M.; van Duijnevelt, F.B. Chem. Phys. Lett. 1973, 77,425.
11. Jeziorski, B.; Bulski, M.; Piela, L. Int. J. Quantum Chem. 1976,10, 281.
12. Froman, A.; Lowdin, P.-O. J. Phys. Chem. Solids, 1962, 23, 75.
13. Dunning,Jr., T. H.; Hay, P. J. In Methods of Electronic Structure Theory, H. F. Schaefer HI, Ed.; Plenum Press, NY, 1977. Chapter 1.
14. (a) Hehre, W. J.; Stewart, R. F.; Pople, J. A. J. Chem. Phys. 1969, 51, 2657. (b) Hehre, W. J.; Ditchfield, R.; Stewart, R. F.; Pople, J. A. J. Chem. Phys. 1970, 52, 2769.
15. (a) Hehre, W. J.; Ditchfield, R.; Pople, J. A. J. Chem. Phys. 1972, 56, 2257. (b) Hariharan, P. C.; Pople, J. A. Theor. Chim. Acta. 1973, 28, 213.
16. Krishnan, R.; Binkley, J. S.; Seeger, R.; Pople, J. A. J. Chem. Phys. 1980, 72, 650.
17. Schmidt, M.W.; Ruedenberg, K. J. Chem. Phys. 1979, 71, 3951.
18. (a) Edmiston, C.; Ruedenberg, K. Rev. Mod. Phys. 1963, 35, 457. (b) Raffenetti, R. C.; Ruedenberg, K.; Janssen, C. L.; Schaefer III, H. F. Theor. Chim. Acta 1993, 86, 149.
19. Schmidt, M. W.; Baldridge, K. K.; Boatz, J. A.; Elbert, S. T.; Gordon, M. S.; Jensen, J. H.; Koseki, S.; Matsunaga, N.; Nguyen, K. A.; Su, S.; Windus, T. L.; Dupuis, M.; Montgomery Jr, J. A. J. Comp. Chem. 1993,14, 1347.
20. Roothan, C. C. J. Rev. Mod. Phys. 1951,23, 69; and references therein.
21. (a) Sokalski, W.A.; Chojnacki, H. Int. J. Quantum Chem. 1973, 8, 679. (b) Otto, P.; Ladik, J. Chem. Phys. 1975, 8, 192.

I l l
22. Claverie, P. In Localization and De localization in Quantum Chemistry, O. Chalvet, R. Daudel, S. Diner, J.P. Malrieu, Ed.; D. Reidel Publishing Company, Dordrecht, 1976, pp 127.
23. Here "S^ term" refers to the term in the equations where two overlap integrals appear, not in the order of the S dependence.
24. Murrell, J.N.; Varandas, A.J.C. Mol. Phys. 1975, 30, 223.
25. Szabo, A.; Ostlund, N.S. Modem Quantum Chemistry, 1st ed., revised; McGraw-Hill, New York, 1989, pp 115.
26. Landshoff, R. Z Phys. 1936,102, 201. See also Ref. 12.
27. Gutowski, M. Chalasinski, G.; van Duijneveldt-van de Rijdt, J. Int. J. Quantum Chem. 1984, 26, 971.
28. (a) Mulliken, R.S. J. chim. phys. 1949,46, 500 and 521. (b) Barker, R.S.; Eyring, H.; Thome, C.J.; Baker, D.A. J. Chem. Phys. 1954, 22, 699.

112
Table I. Various contributions to the exchange repulsion energy if two water dimer configurations. The level of theory is RHF/DZP.
E ^ exch
-Eq (21) -Eq (24) LMO CMO
5' terms^ •Eq (21)
S' terms'' -Eq (24)
LMO CMO
^Ipbo -Eq(21)
r A
h /
j/ ^ L
h
^ )
Ip bo
19
r-o.sA r r+o.sA
29.7 4.3 0.6
28.1 3.7 0.3
25.0 3.3 0.3
20.0 2.4 0.3
-16.3 -2.2 -0.3
-16.0 -2.2 -03
-11.3 -1.8 -0.3
29.0 3.9 0.4
hijpi! r
hijpi!
't) C2.
r-o.sA r r+o.5A
11.8 1.6 0.2
10.1 0.9 0.0
8.3 0.7 0.0
6.4 0.5 0.0
-5.8 -0.7 -0.1
-5.1 -0.6 -0.1
-A.l
-0.6 -0.1
9.2 0.8 0.0
^Evaluated using the Morokuma-Kitaura energy decomposition scheme. ^Here 5^ refers to the term in the equations where two overlap integrals appear, not to the order of the S dependence.
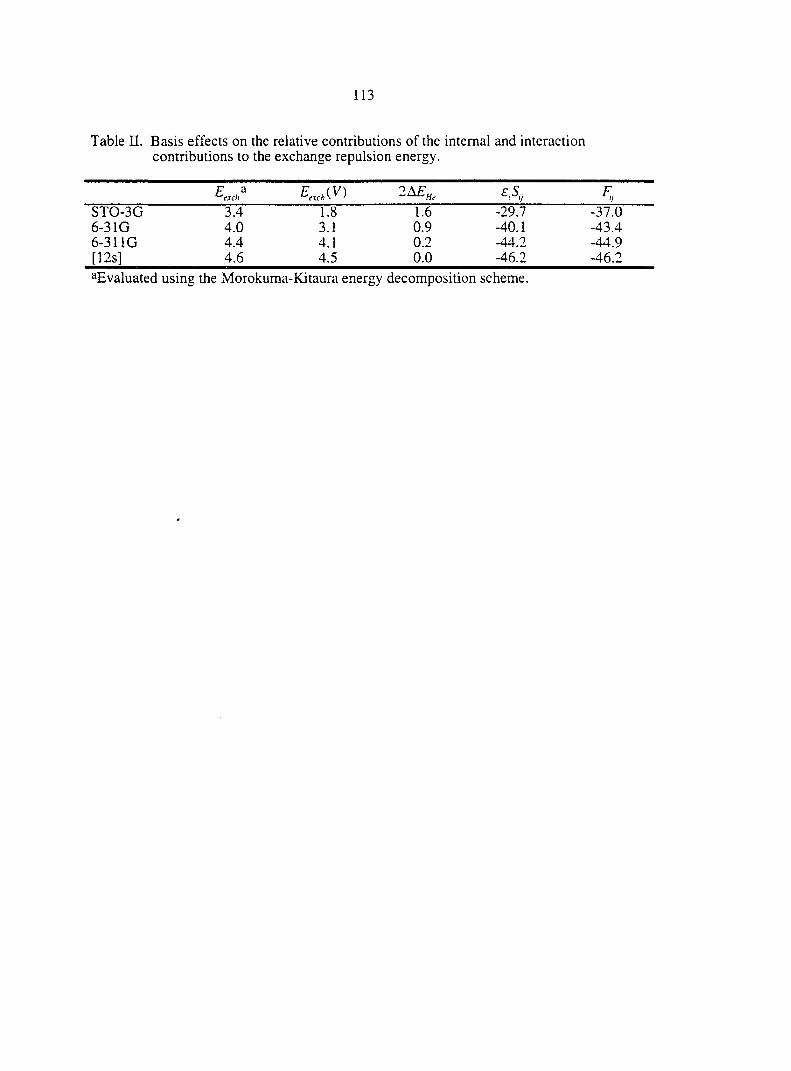
113
Table 11. Basis effects on the relative contributions of the internal and interaction contributions to the exchange repulsion energy.
E 3 cxch ''AF
ST0-3G 3.4 1.8 1.6 -29.7 -37.0 6-3IG 4.0 3.1 0.9 -40.1 -43.4 6-3110 4.4 4.1 0.2 -44.2 -44.9 [12s] 4.6 4.5 0.0 -46.2 -46.2
''Evaluated using the Morokuma-Kitaura energy decomposition scheme.

114
CHAPTER 5. THE CONFORMATIONAL POTENTIAL ENERGY SURFACE
OF GLYCINE: A THEORETICAL STUDY
A paper published in and reprinted with permission from
Journal of the American Chemical Society 1991, 113, 7917-7924
Copyright 1991 American Chemical Society
Jan H. Jensen and Mark S. Gordon
Abstract
The conformational potential energy surface of non-ionized glycine has been studied
using ab initio (6-31G*, ST0-2G) and semi-empirical (AMI, PM3) methods. The MP2/6-
31G*//RHF/6-31G* potential energy surface was then used to calculate the Boltzmann
equilibrium distribution and kinetics of conformational interconversion at various temperatures.
The results of this study are compared to previous computational and experimental
investigations of gas phase glycine.
Introduction
Isolated amino acids exist in the gas phase in the non-ionized form, NH2-CHR-COOH,
where R=H for glycine — the simplest of the roughly 21 amino acids common in nature.
Glycine is simply an amino group and a carboxyl group separated by a saturated carbon. This
structure has three internal rotational degrees of freedom: the rotation of the hydroxyl group
around the C-0 bond, the rotation around the C-C bond, and the rotation of the amino group
around the C-N bond.
The objective of this paper is to present a theoretical study of the conformational
potential energy surface (PES) of the alpha-amino carboxylic acid, glycine, in the non-ionized
form. An important part of this study is to make a thorough comparison between ab initio and

115
semi-empirical (AMI and PM3) hamiltonians with regard to structure, relative energies, normal
modes, and characterizations of stationary points. A subset of the possible minima on the
glycine PES is summarized in Scheme 1.
The use of ab initio methods to study this problem began when Vishveshwara and
Pople 1 published RHF/4-31G energies of several conformations (with standard bond lengths
and angles) assumed to be stationary points. They predicted the torsional parameters for their
global minimum conformation (GLY1 in Scheme 1) but were unable to verify this structure
with computation or experiment. The latter was rectified when two microwave studies of gas-
phase glycine were published independently.^-^ Neither group found the global minimum
predicted by Vishveshwara and Pople. Instead the experimental structure corresponded to a
conformer (GLY3) which was 2.2 kcal/mol above the theoretical minimum.' This apparent
disagreement between theory and experiment was investigated by Sellers and Schafer^ who
fully optimized the structure of both conformations at the RHF/4-21G level and found that 1)
the energy difference remained 2.2 kcal/mol (GLYl lower) and 2) the conformer observed
experimentally had a much larger calculated dipole moment (6.54D vs. I.IOD). The latter,
they argued, made the second conformer more visible in the microwave spectrum. Later, using
a more sensitive instrument, a microwave structure (GLYl) was observed by Suenram and
Lovas^ and verified as the global minimum by Schafer et al.^ who optimized a third conformer
(GLY2) at the RHF/4-21G level to provide additional evidence.
Palla et al.^ mapped PESs for glycine in the non-ionized and zwitterionic states with
four different methods; RHF/ST0-3G,^ CNDO,^ PCELO,!® and a classical potential. They
found significant differences in the surface predicted by ST0-3G and the surface predicted by
Vishveshwara and Pople, although GLYl remained the global minimum. All other methods
failed to even locate this experimental global minimum.
In 1984 Luke et al.'' reported RHF/ST0-3G optimized structures for the eight possible
Cs conformations of glycine and compared these, when possible, to the relative energies of

116
Vishveshwara and Pople's study. No force fields were calculated to determine the nature of
these stationary points. Masamura used the three 4-2IG optimized structures of Schiifer et
al.6 plus optimized structures of other amino acids to asses the reliability of MNDO'- and
AMI and found that both performed satisfactorily, although AMI performed better than
MNDO.
Very recently, Ramek'^ published a vibrational analysis of GLY3 at the 4-3IG level of
theory. He showed that GLY3 is a minimum on the RHF/4-3 IG PES.
In summary, three Cs conformers (GLYl-3) have been optimized with RHF/4-21G
and all eight Cs conformers have been optimized with RHF/ST0-3G. The torsional
parameters and relative energies for some assumed conformational transition states were
reported. 1 Only one force field to confirm the nature of these stationary points has been
published.
Computational Methods
For the ab initio calculations, two basis sets were employed. Molecular structures were
determined at the restricted Hartree-Fock (RHF) level, using the 6-31G*l5 and the STO-2G16
basis sets. All stationary points were verified to be either minima or transition states on the
PES by establishing that their matrices of second derivatives (hessians) were positive definite
or had one, and only one, negative eigenvalue upon diagonalization, respectively. The
hessians were all determined analytically. As part of the extensive probing of the glycine PES,
several linear least motion paths (LLMP) were investigated. The hessians for the highest
energy conformers on these paths were calculated with the 3-21G17 basis set to economize
computer time.
Single point energies using second order M0ller-Plesset perturbation theory (MP218)
with the 6-3 IG* basis set were performed on RHF/6-31G* structures (this is denoted; MP2/6-

117
31G*//RHF/6-31G*). Single point RHF/6-31G* energies were performed on structures
obtained with ST0-2G, AMI 19 and PM320. All ab initio calculations were performed with
either GAUSSIAN8621 or GAMESS 22
The semi-empirical calculations were performed with the MOPAC network of programs
(version 5.0),23 using the AMI and the newly developed PM3 hamiltonians. All transition
states were characterized as described above, but the hessians were computed numerically.
The transition states were, whenever possible, identified by following the gradient
downhill in both directions using the gradient following algorithm implemented in MOPAC.
A method was devised to gauge the similarity of two transition states, obtained with
different computational methods, by comparing the eigenvectors associated with the negative
eigenvalues. This Direct Mode Comparison (DMC) calculates the mass-weighted dot product
of the two normalized eigenvectors and judges their similarity by how little the dot product
(DMC index) deviates from unity. Similar eigenvectors indicate that the transition states are
similar, if not identical, and also suggests that the results obtained by following the minimum
energy path (MEP) from the transition state obtained at one level of theory will apply to the
transition state obtained at the higher level of theory.
The Gibbs free energy was calculated using standard statistic-mechanical formulae24
(with the harmonic oscillator-rigid rotor approximation) as implemented in GAMESS. All real
frequencies were scaled by 0.89 before they were used in these calculations.
The vibrational decomposition scheme used to decompose frequencies is that
implemented in GAMESS.25

118
Results and Discussion
A. The Cs Conformers
The eight conformers of non-ionized glycine, presented in Scheme 1, were optimized
within the Cs point group at the RHF/6-31G*, RHF/ST0-2G, PM3 and AMI levels of
theory, and characterized by calculating the hessians. The usefulness of RHF/STO-2G, PM3.
and AMI in the study of glycine can be gauged by comparison to 6-3IG* for the following
properties: 1) relative energy, 2) geometry, 3) number of imaginary frequencies.
The relative energies, calculated with various basis sets, are listed in Table I. The effect
of correlation (MP2 energy correction) does not appear to be significant: the relative energy
changes most for GLY3 and then only by 1.4 kcal/mol. Therefore, the remaining calculations
were performed at the SCF level of theory. The order, in terms of stability, predicted by the
highest level of theory is duplicated by RHF/6-31G*//RHF/6-31G* and by RHF/6-31G*//
RHF/ST0-2G.
The predicted energy range from GLYl to GLY8 is smaller for STO-2G and PM3.
Both RHF/ST0-2G and PM3 reproduce the trends reasonably well, but underestimate the
relative energy of GLY4 by 2-3 kcal/mol and of GLY7 by 4-6 kcal/mol. AMI overestimates
the relative energy of GLY3 by 6.4 kcal/mol. This, apparently, is due to the inability of AM 1
to account for intramolecular hydrogen bonding. The 6-3IG* basis set predicts an OH --N
distance of 2.02A, well within hydrogen bonding range, whereas AMI predicts 2.34A. This
is reflected in the structure analysis as large deviations (from 6-3IG* values) in the CC-0 and
NCC angles. These angles are overestimated by 7.4° and 1.7°, respectively, by AMI, whereas
the usual overestimation is lower (see Table II). Thus, the elongated OH---N distance is due to
a larger than average distortion of the AMI stmcture. This is probably due to a repulsion
between the OH and N groups, whereas 6-3IG* predicts an attraction, presumably due to
hydrogen bonding. Performing RHF/6-31G* single point energies on the AM 1 structures
leads to a 2 kcal/mol lowering in the relative energy for GLY3. The narrow energy spread for

119
GLY6, GLY8 and GLY4 is preserved. The relative energy of GLY3 (7.5 kcal/mol) is also
overestimated by RHF/6-31G*//PM3, as is the relanve energy of GLY8 (13.1 kcal/mol). The
former indicates that the PM3 structure deviates significantly from the one calculated with
RHF/6-31G*. Indeed, the CC-0 angle is overestimated by 8.3°. and the OH-- N distance is
2.31 A. Thus, it appears that while the hydrogen bonding parametrization of PM3 results in a
relatively good energy (4.2 kcal/mol) for GLY3, it does not result in a good structure, at least
compared to the RHF/6-31G* result.
Table n lists the average and standard deviations (relative to the 6-3IG* values) for 15
internal parameters of the eight Cs conformations of glycine. Both semi-empirical methods
perform well for bond lengths, the largest deviation being -0.05A for r(C=0), calculated with
AMI. The ST0-2G basis set does consistently worse for bond lengths, with the exception of
r(CH). Bond angles are well predicted on average by all methods, although AMI does the best
for most angles. All methods do fairly well for dihedral angles, with the exception of
D(CCNH) for which ST0-2G predicts an average deviation of 0.0±6.7°. The remaining
deviations are all at or below 1.0°.
The hessian was calculated for all eight conformations, and the eigenvalues were
extracted upon diagonalization. The 6-3IG* basis set predicts four minima (GLYl, GLY2,
GLY4 and GLY5), three transition states (GLY3, GLY6 and GLY7) and one conformer with
two imaginary frequencies (GLY8). The four minima are the four conformers for which
D(CCNH)=±60°. The semi-empirical hamiltonians predict (Table I) GLYl, GLY2 and GLY4
to be minima, but both predict one small (<50i cm-1) imaginary frequency for GLY5. STO-2G
predicts small imaginary frequencies for GLY2 (35.2i cm-') and GLY5 (36.9i cm-i). All
methods predict one imaginary frequency for GLY3 and GLY7, except PM3 predicts an extra
imaginary frequency (16.4i cm-l) for GLY7. Both semi-empirical methods predict two
imaginary frequencies for GLY6, whereas ST0-2G only predicts one. Finally all methods
predict two imaginary frequencies for GLY8. Thus, all methods deviate from the 6-3 IG*

120
results by predicting spurious small imaginary frequencies for some conformers. This is most
likely due to the use of a minimal basis set. Attempts to remove these small frequencies by
decreasing the gradient-convergence criteria for those structures led to frequency changes of
less than 2 cm-'.
To provide additional insight, the mass-weighted dot products of the eigenvectors
associated with the GLY3 and GLY7 imaginary frequencies from 6-310* and STO-2G or
AMI were calculated. These DMC indices for GLY3 are 0.969 and 0.996 for STO-2G and
AMI respectively, and 0.990 and 0.995 for GLY7. This is especially encouraging, since it
suggests that one can trace the MEP to products and reactants with AMI and be fairly confident
that the end points are the same for 6-3IG*. This results in a significant saving of computer
time.
Thus, the AMI gradient was followed downhill for GLY3 and GLY7. The GLY3
conformer was found to be the transition state connecting a Cy minimum with its mirror image,
and will be discussed in detail later. The GLY7 conformer was found to be the transition state
for the barrier for the C-N rotation of GLY4, with barrier heights of 6.8 and 6.6 kcal/mol
predicted by MP2/6-31G* and RHF/6-31G*, respectively. Unfortunately, both semi-empirical
methods predict two imaginary frequencies for GLY6, so the same procedure cannot be used in
this case. However, by examining the normal mode associated with the imaginary frequency
one can make a reasonable guess at the nature of the transition state. From this, it appears that
GLY6 is the transition state for the complete C-N rotation of GLYl, resulting in MP2/6-31G*
and RHF/6-31G* barrier heights of 5.8 and 5.6 kcal/mol, respectively.
In summaiy, within Cs symmetry, electron correlation has only a minimal effect on the
relative energies. Relative energies, calculated with MP2/6-31G*//RHF/6-31G*, are
duplicated well by RHF/6-31G*// RHF/6-31G* and RHF/6-31G*//RHF/STO-2G, and less
well by the other methods. Geometries are generally well predicted by all methods although
the semi-empirical methods do not handle intramolecular hydrogen bonding well. The RJIF/6-

121
31G* basis set predicts four minima, three transition states and one stationar\' point with two
imaginary frequencies (GLY8). The latter is predicted by all methods. ST0-2G finds only
two minima, whereas AMI and PM3 both predict three. The PM3 method predicts a second
conformer with two imaginary frequencies (GLY7). The nature of all three 6-3IG* transition
states is established.
B. The C] Conformers.
1. Minima. As mentioned in the Introduction, non-ionized glycine has three internal
rotation degrees of freedom. These can be defined as three torsional angles, (|), co, and t. for
the rotation about the C-0, C-C, and C-N bond, respectively. The GLYl conformer, for
example, is arbitrarily defined as the conformation for which ((});cl);X)=(0;0;0). Thus, one can
construct 36 conformations (({>=0,180; co=-120,-60,0,60,120,180; T=-120,0,120), for which
the steric repulsion of all atoms appears to be minimal and that therefore represent possible
minima on the PES. Sixteen of these conformations have equivalent energies due to symmetry:
E(<t);co;x)=E(<t);-co;-x), where (!)=0,180, to=0,60,120,180,1=0,120 and E((t);(o;T)= the energy
of conformation ((j);®;!:). Four of the remaining 20 energy unique conformations have Cs
symmetry, (0,180; 0,180; 0) and were discussed in the previous section. This leaves 16
possible C] minima on the conformational PES, (0,180; 0,60,120,180; 0,120), all of which
were used as initial guesses for full optimizations using AMI, PM3 and ST0-2G. Any
stationary points located with one or more of these methods were then used as initial guesses
for RHF/6-31G* optimizations.
The conformations of the resulting C; minima found on the PES are listed in Table III
and depicted in Figure 1 together with the Cs minima. It is apparent that the nature of the
surface is very dependent on the method used. In fact, only one Cj minimum, GLYl2 (0; 120;
120), is predicted by all methods. Using the 6-3IG* basis set, three additional minima are

located: GLY9 (0; 0; -120), GLY13 (180; 0; 120) and GLY16 {180; 180; 120). All four
minima are also predicted by ST0-2G, which predicts three additional minima: GLYl 1 (0; 120;
0), GLY14(180; 120;-120) and GLY15 (180; 120; 0). In addition to GLYl2, .^1 predicts
two other minima: GLY14 and GLYl5. Using PM3, a new minimum is found, GLYIO
(0;60;-120), in addition to GLY12 and GLY14. One would thus conclude that ST0-2G is the
best starting level for the investigation of this particular surface, since it is the only method that
identifies all minima found by 6-3IG*.
All four 6-3IG* C; minima deviate significantly in the two torsional angles, 0 and x.
relative to their idealized values. The largest deviation occurs for GLYl6, for which i deviates
by 30° and co by 16°. Such large deviations are also observed in the minima predicted by the
other methods. This often makes it difficult to categorize the minima properly. For example,
one might argue that the AMI and PM3 structures labelled GLY14 really are halfway between
GLYl4 and GLYl6. The deviations in (j) are always less than 5°. Comparing torsional
parameters for GLY12, one finds that most methods do relatively well compared to 6-3 IG*.
The largest deviation is in x which is underestimated by 16° by PM3.
Table FV lists the energies, relative to GLYl, of the conformations listed in Table HI.
Three of the minima on the 6-3 IG* surface have low relative energies: GLY9 (2.1 kcal/mol),
GLY12 (3.1 kcal/mol) and GLY16 (2.9 kcal/mol). The fourth conformer, GLY13, is much
higher in energy, 9.3 kcal/mol above GLYl (but <1 kcal/mol above the Q minimum GLY5).
Note that adding correlation reverses the relative energies of GLY9 and GLYl6. AH remaining
methods, ST0-2G, AMI and PM3, predict low relative energies for GLY12, in agreement
with 6-3 IG*. The ST0-2G basis set predicts roughly the same order of stability for GLY9.
GLYl2, GLYl3 and GLYl6 as MP2/6-31G*.
2. Transition States. Having apparently located all minima on the RHF/6-31G*
conformational PES, an effort was made to locate conformational transition states connecting
various minima. Linear least motion paths (LLMP's) were constmcted for all possible

123
combinations of minima, at the RHF/6-31G* level of theor\'. To be complete one has to
include the mirror conformers labelled GLYXM — (X=9,12,13,16) in certain
instances. The following types of LLMP's were considered:
GLYX<^GLYZ where X,Z=1,2,4,5,9,12,13,16; X<Z
GLYX4->GLYZM where X,Z=9,12.13.16; X^
This selection is exhaustive. The resulting LLMP barriers are listed in Table V. A 3-2IG
hessian27 was computed at the geometry of the highest energy structure on each LLMP to
determine the number of imaginary frequencies. High energy conformers having one or two
imaginary frequencies were then chosen as initial guesses for RHF/6-31G* optimizations to
locate a proper saddle point; i.e. a geometry with one and only one imaginary frequency.
Fifteen C; transition states have been identified in this manner, and the resulting barriers for the
fifteen conformational rearrangements are listed in Table VI. All other conformational changes
were either judged unlikely to have proper tiansition states, based on the fact that the geometry
had three or more, rather large (=300i cm-l), imaginary frequencies or failed to converge to a
proper transition state during optimization. In addition GLY3 is included as the transition state
for Reaction 16.
Both barriers and imaginary frequencies span a rather wide range for conformational
rearrangements. Barriers up to 15 kcal/mol (GLY2 —> GLY5) and as low as 0.1 kcal/mol
(GLY13 GLY4) are predicted. The latter implies a very flat region of the surface and may
not correspond to a real barrier to internal rotation. The barriers listed in Table VI do not
include zero point energy (ZPE) corrections. They will be addressed in the section on
temperarnre effects. The MP2 energy corrections have little effect (<1 kcal/mol) on the
barriers, as was observed for the relative energetics of the glycine minima. The magnitude of
the imaginary frequencies range from 31 cm-i up to 587 cm-l. The larger frequencies are all

124
associated with the rotation of the OH group; in fact, the magnitude of the imaginary' frequency
seems related to the mobility of the OH group. For example, the imaginarv' frequency of
Reaction 12 corresponds largely (74%) to a change in (O, while the (p-contribution is
minuscule. On the other hand, Reaction 14 corresponds almost entirely to 0 rotation.
Most barriers predicted by the LLMPs are within 1-2 kcal/mol of the optimized barriers.
Discrepancies are larger for higher barriers, and relative accuracies are therefore very good.
Analogous considerations of the imaginary frequencies cannot be made since the vibrational
analysis of the hessian is valid only at stationary points.
C. Comparisons to Previous Calculations.
Most of the previous studies of the conformational PES of glycine have been largely
concerned with a few or all of the eight Cs conformers. The relative energies of these,
presented in previous studies plus a subset from this study for comparison, are presented in
Table Vn. It is apparent that using standard bond lengths and bond angles is inadequate for the
prediction of relative stabilities,! possibly due the inadequate treatment of steric repulsions for
certain conformers (GLY2 and GLY6) which leads to overestimation of energies. Thus, when
the three lowest energy conformers were optimized by Schafer et al.,6 with a slightly smaller
basis set, the relative stabihty was well reproduced relative to MP2/6-31G*. The RHF/STO-
3G relative energies calculated by Lucas et al.l 1 show the same trends found with RHF/STO-
2G in this study, i.e. the relative energy of GLY4 is underestimated (by 1.7 kcal/mol), but
other stabilities are well reproduced.
In addition to Cs stationary points, a few earlier studies included Ci conformations.
Vishveshwara and Pople,! for example, predicted a shallow minimum at around (0;120;120)
with a relative energy of 4 kcal/mol. This compares quite well to GLY12 of this study, with a
MP2/6-3IG* relative energy prediction of 3.1 kcal/mol. The GLY9 conformer was not found,
although a rather flat region is indicated by the conformational potential energy map (Figure 11)

of that study in the (0;60;-120) region. Only the part of the PES for which 0=0° was
considered in their study, so the remaining two minima predicted by RHF/6-3IG* were not
observed. In addition, Vishveshwara and Poplel suggested a transition state (Figure 4b >) for
the GLYl GLY2 rearrangement around (0;90;0) which agrees quite well with the transition
state found for that rearrangement in this study: GLYTSl (-0.2;85.8;1.8).
The results obtained by Palla et al.7 for the RHF/ST0-3G conformational PES of non-
ionized glycines exemplifies the difficulties one encounters when using minimal basis sets and
conformational PE maps for this problem. Apparently the maps (Figures 6 and 7 in ref. 7) are
not detailed enough to indicate all possible minima. By inspection one does not find GLY9.
GLYl 1, GLYl3 or GLYl6. This is especially unfortunate since most of these were predicted
by RHF/6-3 IG* in this study. Thus, this surface misses many important points found on the
RHF/6-3 IG* surface.
Finally, a comment is in order regarding the structure observed independently by
Brown et al.2 and by Suenram and Lovas3 in the microwave spectrum of glycine. Sellers and
Schafer^ postulated that this structure is GLY3, and Ramek'sl4 work at the 4-3IG level of
theory seems to support this. However, the current work has shown GLY3 to be a transition
state connecting GLYl6 with its mirror image, with a tiny (0.2 kcal/mol) barrier. When ZPE is
included this barrier disappears (and an equally tiny Gibbs free energy barrier reappears at
higher temperatures). This reflects the very flat potential energy region in this part of the
surface and illustrates the essentially free internal rotation connecting GLYl6 with GLY16M.
This explains why GLY3 is observed in the microwave spectrum, since GLY3 represents the
geometric average between the two conformations. This part of the surface seems quite basis
set dependent, so GLY3 was also optimized at the RHF/6-31 IG** level of theory, resulting in
only a 3 cm-l decrease in the imaginary frequency. Thus, is seems that the nature of the GLY3
conformer has been correctly established both by experiment and theory.

126
D. Temperature Effects.
This section concerns itself with the effect of temperature upon the conformational
PES. Towards this end, Gibbs free energies are computed at various temperatures and used to
evaluate equilibrium distributions and rate constants for conformational interconversions. The
use of the harmonic oscillator-rigid rotor approximation is implicit in these calculations, and
caution should be exercised when analyzing properties calculated at high temperature and/or flat
regions of the PES. The numbers presented are semi-quantitative at best, but trends presented
in this section are most likely correct nevertheless.
1. Equilibrium distribution. The preceding discussion has focused on electronic
energy differences. Relative energies that include ZPE corrections correspond to enthalpy
differences at OK (AHQ). AS the temperature is increased more vibrational levels will be
occupied (enthalpy increase) and entropy differences can play a role. Thus, the relative
stabilities at T>OK are best represented by relative Gibbs free energies AG-p (note that
AHo=AGo).
To investigate the effect of temperature on the relative stabilities of the glycine minima,
AGt was computed for T=0-500K, in steps of lOOK, using MP2/6-31G* energies as the
electronic energy contribution. The relative free energies can be used to predict the Boltzmann
equilibrium distribution of glycine among the available minima:
^-AGr(i)/RT
i
In this expression, AGT(i) is the Gibbs free energy of conformation i at temperature T, relative
to the global minimum (AGT(GLYl);tO), and R is the ideal gas constant.
Figure 2 shows how the equilibrium distribution of a glycine gas varies with T. One
can see that most glycine molecules are in the global minimum conformation (GLYl) at T=0-

127
lOOK, but as the temperature is increased further, more and more molecules assume the GL'^'2
geometry, i.e. the relative Gibbs free energy of GLY2 decreases. The dramatic decrease of
AGT(GLY2) is due to a rather large entropy term. In the range 100-500K the GLY2
conformation has an entropy that is 3 cal/mol-K larger than the average entropy of all minima
(cystd=l cal/mol-K). This may be traced to a large vibrational entropy term arising from a ver\'
low (16 cm-l) frequency; the lowest frequencies in the other minima range from 70-110 cm-'.
This 16 cm-' frequency contributes 91%-37% to the vibrational entropy in that temperature
range and is a prime contributor at all T. The 16 cm-' frequency corresponds to an a" mode
and is displayed in Figure 3. This motion may be strongly coupled with the reaction coordinate
of GLY2 GLYl, since the mode corresponds almost exclusively to co rotation. Given the
low barrier of this reaction (AHo=0.9 kcal/mol) this surface is likely to be very flat, giving rise
to the very low frequency. At 300K the equilibrium composition is comprised of 72% GLYI
and 19% GLY2, while other conformations make minor contributions. At all temperatures
>99% of the composition is accounted for by the five conformations included in Figure 1.
2.Kinetics. The relative probability for finding glycine in a particular minimum does
not reveal the ease with which that minimum is reached. The latter is primarily a function of
the barrier which has to be surmounted to reach the minimum and the associated kinetics.
Table VI appears to list all barriers on the conformational PES associated with a proper
transition state and to which kinetic considerations can be applied. Given the barriers and the
equilibrium partition functions for reactants and transition states (QR and Q'^, respectively), one
can calculate the classical rate constants using conventional transition state theory (TST):28
j^TST _ Q* ^-AGt/RT
h Qr

128
Here, and h are the Boltzmann and Planck constants, respectively. The classical rate
constant kTST does by definition not include quantal effects such as tunneling, and an ad hoc
correction must be included. This usually is done by introducing a transmission coefficient (K)
calculated by some method. In this study the augmented Wigner correction,29
?c = l + - 1 hv"" 24 ksT
1 + RT
AG T J
has been used. In this expression, is the imaginary frequency of the transition state.30 The
final rate constant is thus given by
jJST/w _ ̂ TSJ
{kTST/w is hereafter referred to as k).
Forward and reverse rate constants {kf and kr, respectively) were calculated for the
reactions listed in Table VI at T=100-500K in increments of lOOK. Reactions 8 and 16 were
excluded, since these barriers disappeared when ZPE was included. The resulting rate and
equilibrium constants (Keq=^///:r) are listed in Table VDI.
One point of interest is the ease of conversion of glycine from the global minimum to
the other four conformers in Figure 2 as a function of temperature. For example, while the
equilibrium composition of glycine at 300K (based on the relative free energies of all eight
minima) has about 15% more GLY2 than GLY9, the rate constants indicate that GLY1^GLY9
is faster (^=2.8x10¹⁰ s-i) than GLYl —> GLY2 (/:=5.8x109 s-i) at the same temperature. This
difference is even more pronounced at lower temperatures.
An interesting question concerns the possibility of different paths connecting the same
two minima. One example is the path to GLYl2 from GLYl. The GLYl—>GLY12 LLMP

129
predicts a 9 kcal/moi barrier, but does not result in a proper transition state. The two most
direct paths that emerge from this study are: GLYl-> GLY2 —> GLY12 and GLYl—> GLY9
—> GLYl2, Paths 1 and 2, respectively. At 300K the rate determining step for both Paths is
the second step, with respective rate constants of 1.0x10⁹ s-l vs. l.SxlO'O s-i. Path 2 is
therefore favored over Path 1. This is consistent with the lower net barrier for Path 2. As
expected, the difference is more pronounced as the temperature is decreased.
Equilibrium constants provide valuable information in addition to relative energies.
When derived from transition state theory, Keq is not only a function of the exponential term
but also of QR,r/QR,f (tunneling does not contribute to K^q within the parabolic
tunneling approximation). The latter ratio becomes more important as the barriers approach the
same magnitude. Some interesting temperature trends occur. Two examples of equilibrium
reversal with increasing temperature are found on the conformational PES: GLYl GLY2
and GLY9 GLY16M. The former equilibrium favors GLYl at low temperatures
(Keq,T=lOO=0.002) but is reversed, somewhat above room temperature, and at 500K Kcq=3.4.
However, it is apparent (Figure 2) that although GLY2 approaches GLYl in stability, GLYl
remains the global minimum at 5(X)K. So, the reversal cannot be caused entirely by the
exponential term. Rather, as the difference in forward and reverse barrier heights approaches
zero, QGLY2/QGLYI (which increases from 3.6 to 4.4 over the temperature range) becomes the
predominant term, shifting the equilibrium in favor of GLY2. The equilibrium GLY9 <->
GLY16M shifts in favor of GLY16M between 200 and 300K due to the fact that the relative
stabilities are of GLY9 and GLY16M are reversed in that temperature range (and thus the
relative probabilities, see Figure 1). Of course the barriers are reversed which causes the shift
in equilibrium.

130
Conclusions
The RHF/6-31G* conformational potential energy surface (PES) of non-ionized
glycine contains eight Cs stationary points (four minima, three transition states and one
structure with two imaginary frequencies), at least four additional energy unique (C/) minima
(Fig. 1) and 16 conformational transition states connecting various minima. The nature of the
surface is basis set dependent and is not well reproduced by ST0-2G. AMI or PM3, since the
former predicts too many, and the two latter, too few minima relative to 6-3IG*. Correlation
appears to have little effect on relative energies.
The Boltzmann equilibrium distribution of glycine (Fig. 2), calculated using relative
Gibbs free energies, indicates that the stability of the global minimum (GLY1) and the second
lowest minimum (GLY2) approach one another with increasing temperature. At 300K. the
equilibrium distribution consists of 72% GLYl and 19% GLY2. The explanation lies in the
large vibrational entropy of GLY2 caused by a very low (16 cm-1) a" vibrational mode (Fig.
3).
The kinetics of conformational interconversion is studied using conventional transition
state theory with a simple Wigner tunneling correction. The interconversion of GLY 1 to
GLY12 occurs via GLY2 (i.e. GLYl—> GLY2 —> GLY12) rather than GLY9, based on
relative rate constants presented in Table Vnia,b. Equilibrium reversals, shown fay calculating
equilibrium constants (Table VIIIc), with increasing temperatures are observed for two
different equilibria: GLYl4-> GLY2 and GLY9 ̂ GLY16M. The former is explained by the
large equilibrium partition function of GLY2 relative to GLYI (caused, again, by the large
vibrational entropy of GLY2) which dominates the equilibrium constant as the difference in
relative energies approach zero. The latter is due to a reversal of stability of GLY9 and
GLY16M as the temperature is increased (Fig. 1).
Two main points emerge from the comparison of this with other studies. One is that
conformational potential energy maps 1.7 have to be rather refined to locate all minima on the

131
glycine PES. The second is that one conformation (GLY3, Scheme 1) is a transition state on
the electronic PES, but that the electronic barrier is so small that the vibrational energies of the
normal modes are sufficient to overcome this barrier. Thus, this study suggests that GLY3 is
the conformational average of the free internal interconversion between GLY16 and its mirror
image, and hence observed in microwave spectra.2.3
Acknowledgments
This work was supported in part by a grant from the Petroleum Research Fund,
administered by the American Chemical Society. Computer time was made available by the
North Dakota State University Computer Center on its IBM 3090/200E, obtained via a joint
study agreement with IBM. Additional calculations were carried out on a DECstation 3100 and
a VAXstation 3200, both funded by a grant from the National Science Foundation (CHE86-
40771). We would like to thank Nikita Matsunaga for drawing our attention to Dr. Ramek's
paper. Helpful discussions with Dr. Michael Ramek, Dr. Walter Stevens and Dr. Donald
Truhlar are gratefully acknowledged.
References
1. Vishveshwara, S.; Pople, J. A. J. Am. Chem. Soc. 1977, 99, 2422.
2. Brown, R. D.; Godfrey, P. D.; Storey, J. W. V.; Bassez, M. P. J. Chem. Soc., Chem. Commiin. 1978, 547.
3. Suenram, R. D.; Lovas, F. J. J. Mol. Spectrosc. 1978, 72 , 372.
4. Sellers, H. L.; Schafer, L. J. Am. Chem.Soc. 1978, 100, 7728.
5. Suenram, R. D.; Lovas, F. J. J. Am. Chem. Soc. 1980,102, 7180.
6. Schafer, L.; Sellers, H. L.; Lovas F. J.; Suenram, R. D. J. Am. Chem. Soc. 1980. 102, 6566.
7. Palla, P.; Petrongolo, C.; Tomasi, J. J. Phys. Chem. 1980, 84, 435.

132
8. (a) Hehre, W. J.; Stewart, R. F.; Pople, J. A. J. Chem. Phys. 1969. 51. 2657. (b) Hehre, W. J.; Ditchfield, R.; Stewart, R. F.; Pople, J. A. j. Chem. Phys. 1970, 52. 2769. (c) Gordon, M. S.; Bjorke, M. D.; Marsh, F. J.; Korth. M. S. J. Am. Chem. Soc. 1978, 700, 2670.
9. (a) Pople, J. A.; Santry, D. P.; Segal, G. A. J. Chem. Phys. 1965, 43, 129. (b) Pople, J. A.; Segal, G. A. J. Chem. Phys. 1965, 43. 136. (c) J. Chem. Phys. 1966.
44, 3289. (d) Pople, J. A.; Beveridge, D. L. Approximate Molecular Orbital theoiy. McGraw-Hill, New York, 1970.
10. (a) Diner, S.; Malrieu, J. P.; Claverie. P. Theor. Chim. Acta 1969, 13, 1. (b) Malrieu. J. P.; Claverie, P.; Diner, S. Theor. Chim. Acta. 1969, 13, 18. (c) Diner, S.; Malrieu. J. P.; Jordan, F.; Gilbert. Theor. Chim. Acta 1969, 15, 100.
11. Luke, B. T.; Gupta, A. G.; Loew, G. H.; Lawless, J. G,; White, D. H. Int. J.Quantum Chem.: Quantum Biol. Symp. 1984, 11, 117.
12. Masamura, M. J. Mol. Struc. 1987, 152, 293.
13. Masamura, M. J. Mol. Struc. 164. 299.
14. Ramek, M. Int. J. Quantum Chem.:Quantum Biol. Symp. 1990, 17, 45.
15. Hariharan, P. C.; Pople J. A. Theor. Chim. Acta 1973, 28, 213.
16. (a) Hehre, W. J.; Stewart, R. F.; Pople J. A. J. Chem. Phys. 1969, 51, 2657. (b) Hehre, W. J.; Ditchfield, R.; Stewart, R. F.; Pople, J. A. J. Chem. Phys. 1970, 52, 2769. (c) Gordon, M. S.; Bjorke, M. D.; Marsh, F. J.; Pople, J. A. J. Am. Chem. Soc. 1978, 100, 2670.
17. Binkley, J. S.; Pople, J. A.; Hehre, W. J. J. Am. Chem. Soc. 1980, 102, 939.
18. Krishnan, R.; Pople, J. A. Int. J. Quantum Chem. 1978,14, 91.
19. Dewar, M. J.; Zoebisch, E. G.; Healy, E. F.; Stewart, J. J. P. J. Am. Chem. Soc. 1985, 107, 3902.
20. (a) Stewart, J. J. P. J. Comp. Chem. 1989, 10, 209. (b) Stewart, J. J. P. J. Comp. Chem. 1989, 10, 221.
21. Frisch, M. J.; Binkley, J. S.; Schlegel, H.B.; Raghavashari, K.; Melius, C. F.; Martin, R. L.; Stewart, J. J. P.; Brobrowicz, F. W.; Rohlfing, C. M.; Kahn, L. R.; DeFrees, D. J.; Seeger, R.; Whiteside, R. A.; Fox. D. J.; Fluder, E. M.; Topiol, S.; Pople, J. A. GAUSSIAN86; Carnegie Mellon Quantum Chemistry Publishing Unit, Pittsburgh, PA 15213.
22. Schmidt, M. W.; Baldridge, K. K.; Boatz, J. A.; Jensen, J. H.; Koseki, S.; Gordon, M. S.; Nguyen, K. A.; Windus, T. L.; Elbert, S. T. QCPE Bulletin. 1990, 10, 52.
23. Stewart, J. J. P. QCPE, program 455.

133
24. Davidson, N. Statistical Mechanics, McGraw-Hill, New York, 1962.
25. (a) Boatz, J. A.; Gordon, M. S. J. Phys. Chem. 1989, 93, 1819. (b) Pulay. P; Torok. F. Acta Chim. Acad. Sci. Hung. 1966, 47, 276.
26. Carsky, P.; Hess, Jr., B. A.; Schaad, L. J. J. Comp. Chem. 1984, 5, 280.
27. To econoniize computer time, the hessians were not calculated with the 6-3IG* basis set. Instead, the 3-2IG basis set was used after it had been judged to be sufficiently accurate, by a few comparative calculations with 6-3IG*. The ST0-3G basis set was considered as well but rejected since the imaginary frequencies were much too large in magnitude, compared to 6-3IG* calculations.
28. A sunmiary of transition state theory is given in; Steinfield. J. I.; Francisco, J. S.; Hase. W. L. Chemical Kinetics and Dynamics, ch. 10. Prentice-Hall, Englewood Cliffs. 1989.
29. Formula taken from ref. 28, pg 320. Note typo.
30. Although a rigorous evaluation of the tunneling probability requires an analysis of the reaction path [(a) Skodje, R. T.; Truhlar, D. G J. Phys.'Chem. 1981, 85, 624. (b) Truhlar, D. G.; Garret, B. C. J. Chem. Phys. 1987, 84, 365] the Wigner correction provides qualitative trends in rate constants.

134
Table I. Relative energies (kcal/mol) of the eight Cs conformers.a
Basis set GLYl GLY2 GLY3 GLY6 GLY8 GLY4 GLY5 GLY7 MP2/6-31G*// 0.0 1.7 1.8 5.8 6.5 6.5 8.4 13.3 RHF/6-31G* RHF/6-31G*// O.OM 1.9M 3.2T 5.6T 6.1B 7.0M 9.3M 13.6T RHF/6-31G* RHF/6-31G*// 0.0 2.3 3.9 6.1 7.5 7.9 11.6 15.4 RHF/ST0-2G RHF/6-31G*//PM3 0.0 2.1 7.5 6.2 13.1 9.2 13.4 16.5 RHF/6-31G*//AMl 0.0 2.2 6.2 7.5 6.7 7.6 11.4 14.3 RHF/ST0-2G// O.OM 0.6T 2.0T 4.8T 5.8B 4.1M 7.7T 9.8T RHF/ST0-2G PM3//PM3 O.OM l.lM 4.2T 4.6B 5.2B 3.6M 6.8T 7.7B AM1//AM1 O.OM 0.4M 8.2T 6.2B 6.9B 6.0M 9.1T 12.6T
^The nature of each stationary point is indicated as a superscript by M(minimum), and T(transition state) and B (barrier).

135
Table EI. Average deviations (6-3IG* - X) of bond lenghts, bond angles, and dihedrals for X=ST0-2G, PM3, and AMI. Bond lengths in Angstrom, bond and dihedral angles in degrees.
Param. ST0-2G PM3 AMI Bond Lengths
r(CC) -0.053±0.004 0.003±0.002 0.005±0.003 r(C=0) -0.034±0.003 -0.031±0.001 0.047±0.001 r(C-O) -0.064±0.004 -0.023±0.004 -0.034±0.004 r(OH) -0.046±0.002 0.001±0.002 -0.018±0.003 r(CN) -0.048±0.007 -0.031±0.004 0.011±0.004 r(CH) -0.013±0.002 -0.024±0.002 -0.043±0.003 r(NH) -0.042±0.001 0.00210.001 0.002±0.002
Bond Angles A(CC=0) -0.711.5 -4.0±0.3 -3.3±0.9 A(CC-O) 0.5+2.0 -5.2+2.0 -3.6±1.9 A(HOC) 4.9±1.3 -1.0±1.5 -0.6±1.8 A(NCC) 1.9±1.5 1.4±1.1 -0.5±0.7 A(HCC) -1.6±0.5 -1.6±0.3 0.5±0.2 A(HNC) 5.2+1.1 1.9±1.5 -0.2±1.2
Dihedral Angles D(0=CCH) -0.9±0.3 -1.0±0.2 -0.8±0.2 D(CCNH) 0.0+6.7 -0.4±2.4 1.0+2.5

Table EI. Minima (({);a);T) located on the conformational PES of glycine.
Conformer Idealized Conform. 6-31G* ST0-2G AMI PM3 GLY9 (0; 0;-120) (0; 22;-106) (-1:22;-113) GLYIO (0; 60;-120) (-2; 54;-117) GLYll (0: 120; 0) (0; 149; -4) GLYI2 (0; 120; 120) (-2; 138; 125) (-2; 126; 118) (-3; 134; 110) (-3; 134; 109) GLY13 (180; 0; 120) (-178; 21; 99) (-179; 21; 103) GLY14 (180; 120;-120) (179; 115;-130) (-178; 142;-138) (-177; 134; -131) GLY15 (180; 120; 0) (172; 110; -4) (176; 113;-18) GLY16 (180; 180; -120) (-179; 164; -150) (-176; 160; -143)

137
Table IV. Energies, relative to GLYl (in kcal/mol), of the Cy conformational minima.
Basis set GLY9 GLYIO GLYll GLY12 GLYl 3 GLY14 GLY15 GLY16 MP2/6-31G*// 2.2 3.2 8.9 1.5 RHF/6-31G* RHF/6-31G*// 2.2 3.1 9.3 2.9 RHF/6-31G* RHF/ST0-2G// 1.4 0.6 1.3 6.0 7.3 6.4 1.2 RHF/STO-2G PM3//PM3 2.1 2.5 3.5 AM1//AM1 3.5 7.6 7.9

Table V. Energy (kcal/mol) of the highest energy conformer on a LLMP, connecting the conformation heading the row with the one heading the column, relative to the conformation heading the row.
Conform. GLYl GLY2 GLY4 GLY5 GLY9 GLY12 GLYl 3 GLY16 GLYl 3.9 14.0 18.9 2.7 9.0 16.0 23.0 GLY2 2.0 16.7 15.7 6.7 3.5 21.1 20.8 GLY4 7.0 11.6 4.9 9.7 17.2 2.7 7.4 GLY5 9.6 8.3 2.6 13.4 12.5 5.6 10.7 GLY9 0.6 6.5 14.6 20.6 4.2 13.5 18.5 GLY9M 0.6 6.5 14.6 20.6 4.3 4.8 18.4 15.4 GLYl 2 5.9 2.4 21.2 18.7 3.2 16.8 13.4 GLY12M 5.9 2.4 21.2 18.7 3.8 4.8 18.8 13.8 GLY13 6.7 13.7 0.4 5.6 6.3 10.5 2.4 GLY13M 6.7 13.7 0.4 5.6 11.2 12.6 5.2 2.0 GLY16 20.1 19.8 11.5 17.0 17.6 13.6 5.0 GLY16M 20.1 19.8 11.5 17.0 14.6 14.0 4.6 0.4

139
Table VI. Barriers (kcal/mol) and imaginary' frequencies (unscaled;cm-l) for conformational rearrangements. Barriers are calculated with RHF/6-3IG* or MP2/6-3IG*. Fwd=forward; Rev= reverse.
unoptimized optimized 3-2IG barriers 6-3IG* RHF MP2 freq fwd rev freq fwd rev fwd rev
l.GLYl<-^GLY2 201i 3.9 2.0 58i 3.2 1.3 2.8 1.3
2.GLY1<^GLY4 754i,202i 14.0 7.0 556i 13.5 6.5 14.1 6.5
3.GLY1<-^GLY9 354i,95i 2.7 0.6 211i 2.5 0.5 2.6 0.4
4.GLY2^GLY4 764i.225i 16.7 11.6 529i 14.2 9.1 14.7 10.0
5.GLY2<-^GLY5 772i,195i 15.7 8.3 549i 14.3 7.0 15.0 8.4
6.GLY2<-^GLY12 365i,134i 3.5 2.4 287i 3.3 2.3 3.5 3.0
7.GLY4^GLY5 213i,95i 4.9 2.6 37i 4.0 1.7 3.8 1.9
8.GLY4<->GLY13 327i,185i 2.7 0.4 182i 2.5 0.2 2.5 0.1
9.GLY4<^GLY16 397i,219i 7.4 11.5 84i 3.5 7.6 3.7 8.7
10.GLY5<^GLY9 768i,358i 13.4 20.6 529i 6.8 14.0 8.1 14.3
ll.GLY5<^GLY13 384i,209i 5.6 5.6 318i 3.6 3.6 3.9 3.4
12.GLY9<->GLY12 305i,178i 4.2 3.2 31i 2.2 1.2 2.2 1.2
13.GLY9<->GLY12M 214i,165i 4.8 3.8 91i 4.1 3.1 3.7 2.7
14.GLY9<-»GLY16M 774i,191i 15.5 14.6 5871 13.0 12.2 14.0 14.7
15.GLY13<^GLY16M 224i,22i 2.0 4.6 89i 1.1 7.5 1.2 8.6
16.GLYi6<-^GLY16M 117i* 0.4 0.4 llli 0.3 0.3 0.2 0.2

140
Table Vn. Previously calculated relative energies (in kcal/mol) for various glycine conformers. compared to values obtained in this studyt.
Basis set GLYl GLY2 GLY3 GLY6 GLY8 GLY4 GLY5 GLY7 MP2/6-31G*// 0.0 1.7 1.8 5.8 6.5 6.5 8.4 13.3 RHF/6-31G*1: RHF/4-31G1 0.0 2.6 2.2 8.1 7.5 RHF/4-21G// 0.0 1.9 2.2 RHF/4-21G6 RHF/ST0-3G// 0.0 0.9 1.8 4.7 6.0 4.8 8.8 10.5 RHF/STO-3G11 RHF/ST0-2G// 0.0 0.6 2.0 4.8 5.8 4.1 7.7 9.8 RHF/STO-2Gi

141
Table Vni. (a) Forward and (b) reverse rate constants (in s"') and (c) equilibrium constants as a function of temperature (T, in K).
T 100 200 300 400 500
Forward Rate Constants
l.GLYl<->GLY2 1.5E+06 8.7E+08 5.8E+09 1.3E+10 2.1E+10
2.GLY1<^GLY4 2.7E-16 3.3E-02 1.8E+03 4.3E+05 1.2E+07
3.GLY1<->GLY9 1.4E+07 4.6E+09 2.8E+10 6.6E+10 l.lE+11
4.GLY2f-^GLY4 8.0E-19 4.6E-04 4.3E+01 1.3E+04 4.2E+05
5.GLY2^GLY5 3.1E-19 2.7E-04 2.8E+01 9.5E+03 3.1E+05
6.GLY2<->GLY12 3.2E+04 8.0E+07 l.OE+09 3.6E+09 7.1E+09
7.GLY4^GLY5 4.8E+03 5.8E+07 l.lE+09 4.3E+09 9.3E+09
9.GLY40GLY16 5.1E+03 5.4E+07 9.7E+08 3.7E+09 7.8E+09
10.GLY5<^GLY9 5.6E-04 6.4E+04 3.3E+07 7.3E+08 4.5E+09
ll.GLY5<^GLYi3 8.7E+03 I.4E+08 3.4E+09 1.6E+10 3.6E+10
I2.GLY9<^GLY12 l.lE+07 2.8E+09 1.5E+10 3.2E+10 4.7E+10
13.GLY9<^GLY12M l.lE+04 9.9E+07 1.8E+09 6.8E+09 1.5E+10
14.GLY90GLY16M 2.1E-16 3.5E-02 2.1E+03 5.3E+05 1.5E+07
15.GLY13<^GLY16M 8.0E+08 2.0E+10 4.7E+10 6.5E+10 7.4E+10
Reverse Rate Constants
l.GLYl^GLY2 8.3E+08 4.1E+09 5.9E+09 6.3E+09 6.2E+09
2.GLY1<-»GLY4 5.4E+00 4.9E+06 5.1E+08 5.1E+09 2.1E+10
3.GLY1^GLY9 l.OE+12 1.3E+12 1.3E+12 1.2E+12 l.lE+12
4.GLY2<^GLY4 l.OE-07 8.6E+02 1.8E+06 8.2E+07 8.1E+08
5.GLY2^GLY5 2.1E-04 3.6E+04 2.1E+07 5.1E+08 3.3E+09
6.GLY2<^GLY12 6.1E+06 5.2E+09 4.7E+10 1.3E+11 2.4E+11
7.GLY4^GLY5 2.5E+07 4.1E+09 L9E+10 3.7E+10 5.1E+10
9.GLY4<^GLY16 9.7E-07 l.OE+03 l.OE+06 3.1E+07 2.3E+08
10.GLY5^GLY9 8.1E-17 2.5E-02 1.8E+03 5.0E+05 1.5E+07
ll.GLY5^GLY13 1.3E+04 1.7E+08 3.6E+09 1.5E+10 3.5E+10
12.GLY9<h^GLY12 2.2E+09 3.6E+10 7.6E+10 9.9E+10 l.lE+11
i3.GLY9<^GLY12M 2.0E+06 1.2E+09 8.6E+09 2.1E+10 3.5E+10
14.GLY9^GLY16M 5.4E-17 2.4E-02 2.3E+03 7.4E+05 2.5E+07
15.GLY13f^GLY16M 1.6E-06 1.3E+03 1.2E+06 3.4E+07 2.5E+08

r
U)
o r
ON
Ui
r
4^ b m + o o
OJ to t—* t—' o VO --a OS U\ ji. U) to
b b b b b b b b b b b b r r r r r r r r r r r r
>-< K; •< i-< K: << \o so Ul
t Ui t t t
to t
to t
to t t t t 4-
Q i Q O
i Q
vl' o
•i' o O
4-O
4-O
4-O
4-O
4-O
r r r r r r r r r r r r <-< •-< >-< •-< i-< •-< K-* MD 4^ so to ro to OJ OS K)
U\ ai b\ b w m m m o 6 O U) OJ to
+ to
U\
N) m + o so
Ol •— >— Ul •—
W L»j m
L/j m w m m m
o o OJ ivi to o Lfl -J
O U)
_ oo to to U\ )—» Lfl w OS to Lfi m m tn
bo m m
bs m
to m
4i-m
Ln tn
Ln tn 1 o so
OJ tn 1 o
tn m tn + o
+ o o
1 o to
1 o to
1 o +
o OS
+ o
1 O ro
1 o to
Ln tn 1 o so
OJ tn 1 o o OJ o so O
(jj )0 to to »—* SO to to to OJ )0
m Lu m
b cn
b m
to m
bo cn
4^ m tn
OJ tn tn
4::-tn 1 o
Lo tn
bs tn
bo tn
+ o
i o
1 o
i o
1 o + o 4^
+ o to
1 o to
o to
O OS
4::-tn 1 o O to
o ON
6
m J3 C
C 3 n o D v>
t o
-J w OJ Ui 'o 1—> to k> m tn tn tn tn + o o o 6 o U) '
+ + O O OJ to
* to •-• >— lyi 00 k) tn
'-J tn tn
ON tn tn
Ln tn
o o to 0 01 O 4i.
O to o Lh
4-o o
+ o to
U) 4^ _4̂ ON
vO U) to cn tn cn cn o o i—A o o 1—A
CT\ U) U)
+ + o o to >—
OJ so NO L/> bo tn
b tn
LA cn
to cn
00 m tn
o O to O Ui
o 4^
o to
o 4^
+ o o

143
%
\ I /
O
C r'H H
GLYl
/
H
.,s>N 4
GLY2 H
H
(X^
H
H
H
GLY3
li.
\ 7 C r'H H /
H
GLY4
H =^H
/
H H
GLY5
H
/ C *."/H H
GLY6
\ H
H
\ I C C / li."/H
Q H
\
GLY7
Scheme 1. Possible Q stationary points on the conformational PES of glycine.

144
GLYl GLY2
GLY4 GLY5
GLY12 GLY9'
GLY13 GLY16
Figure 1. Optimized stmctures of the eight phase glycine.
minima found on the conformational PES of gas-

145
120
-o- GLY1 GLY2
-o- GLY9(M) GLY16(M)
-- GLY12(M)
100 -g-
80 -
60 -
40 -
20 -
0 t!" 0 1 0 0 2 0 0 300 400 500 600
T(K)
Figure 2. The equilibrium composition of glycine in the temperature range 0-500K, as a plot of the percent probability vs T. Notice that GLY16M should be considered in conjunction with GLY3.

146
Figure 3. a" normal mode associated with the lowest vibrational frequency of the GLY2 conformation.

147
CHAPTER 6. THE UNCATALYZED PEPTIDE BOND FORMATION IN THE
GAS PHASE
A paper published in and reprinted with permission from
Journal of Physical Chemistry, 1992, 96, 8340-8351
Copyright 1992 American Chemical Society
Jan H. Jensen, Kim K. Baldridge, and Mark S. Gordon
Abstract
Several levels of electronic structure theory are used to analyze the formation of a
peptide bond between two glycine molecules. Both a stepwise and concerted mechanism was
considered. The energetic requirements for the stepwise and concerted mechanisms are
essentially the same within the expected accuracy of the methods used. A simpler model
system comprised of formic acid and ammonia is found to provide a good representation of the
essential features of dipeptide formation. Total electron densities and localized molecular
orbitals are used to interpret the mechanisms.
L Introduction
The peptide bond is of central importance to protein chemistry in particular and
biological chemistry in general. It provides the link between amino acid subunits of proteins
and imposes an important conformational restriction on the main chain. While Nature has
crafted a very complicated machinery for the making and breaking of peptide bonds, ̂ chemists
have succeeded in this regard as well,^ starting with Fisher's first peptide bond synthesis in
1903.^ Controlled hydrolysis of the peptide bond is central to the field of protein sequencing,
initiated by Sanger's determination of the amino acid sequence of insulin.^ Therefore, analysis
of the details of the mechanism leading to the formation of a peptide bond warrants

148
investigation. Important questions to be answered in this regard are: (1) does this bond
formation occur in a concerted or stepwise manner? (2) what is the molecular and electronic
structure of each transition state? (3) what are the associated barrier heights? (4) what are the
effects of entropy on the details of the mechanism? (5) what is the nature of solvent effects on
the apparent mechanism? and (6) how do enzymes and other catalysts aid peptide bond
formation/breaking? The first four of these questions will be addressed in this paper.
The more general case of amide bond formation has been extensively studied. The
mechanism of amide bond formation was studied experimentally by Jencks and co-workers^
for the acid/base catalyzed aminolysis of alkyl esters in aqueous solutions. Evidence was
presented to support a preference for a stepwise mechanism, based on pH-dependence studies
using various esters. The following mechanism was proposed:^^'^^
O
RNH2 + 'c—OR'
OH T"
+ H I R—N—C"0—R'
OH T®
,H T 2 ^ 1 R—N—C—O—R ^ R—N—C—O—R' (1)
R~N—C— O—R
•OR' (+H'-)
The rate-determining step is the proton transfer (step 2), rather than the amine attack (step I),
mediated by an acid (step 2a) or base (step 2b) catalyst (through either T*" or T", respectively)
or the solvent. The third step, i.e. the breakdown of the tetrahedral intermediate and the

149
formation of the amide bond, could not be probed due to the lower barrier. One way to
address this problem is to consider a related reaction, namely the hydrolysis of the amide bond,
which mechanistically is related to amide bond formation since it is the reverse of (1) for
R'=H. Thus, step 3 in reaction (1) corresponds to the initial hydration of the amide bond, to
be followed by complete hydrolysis through additional steps.^
The hydration of amides is a special case of the general nucleophilic attack on carbonyl
centers for which three competing mechanisms exist:^
Nuc—C—O" + HA
Nuc: + C=0 + H—A Nuc—C— OH Nuc- -C~ 0-- H- - A
+ A"
Nuc A'
Depending on the nucleophile and pH, Q and S may either represent intermediates or
mechanistically extreme representations of the transition state for the concerted path. In acidic
solution the nucleophile is weak (Nuc:=HoO) and the mechanism is "S-like." For amides,
this is facilitated through the delocalization of positive charge on the nitrogen;^
^OH OH // /
— C — —C \
NHR' +NHR'
~Q.+
NHR'

150
Additional steps lead to complete hydrolysis;^
HoO^—C—OH HO-C—OH ^ ^ HO =c—OH + R'NHo 1 1 NHR' ^NHoR'
— CO2H + R'NH,:,-" (3)
In basic solution the nucleophile is strong (Nuc:=OH') and Q is regarded as an intermediate
that is broken down by the following steps
HO-
H2O HO-
NHR' OH
•O" •CO.H + R'NHi (4)
^NH.R'
No experimental evidence exists for a concerted ester aminolysis/amide hydrolysis mechanism.
There have been several previous theoretical studies on prototypical reactions which are
intended to mimic peptide bond formation, most notably the landmark series of papers by Oie
et al.^ This group^^^^ initially studied the reaction of ammonia with formic acid to form
formamide and water,
NH3 + HCOOH -> HC(=0)NH2 + H2O (5)
using both semiempirical and ab initio wavefunctions. Both a stepwise process and a
concerted mechanism (Schemes 1 and 2, respectively; R=R'=H) were considered. The latter
proceeds through the four-center transition state (TS3), while the former involves the
formation of the intermediate (INT2) as a result of the addition of an ammonia N-H bond
across the carboxyl double bond of the acid. It was found that at the highest level of theory

151
considered [fourth order perturbation theory (MP4'®) with the 6-3 lG(d,p) basis set" at the 3-
21G^^ geometry, denoted MP4/6-31G(d,p)//RHF/3-21G]. the two mechanisms are
energetically competitive with each other. It was also found that the energetics predicted using
minimal basis set ST0-3G'^ geometries are essentially the same as those obtained using the
larger 3-2IG basis set. Later papers considered the effect of having a second ammonia present
as a 'catalyst' in reaction and the effect of a simple cationic catalyst,^'^^ or a second
catalytic ammonia,on reaction (6).
h2nch2cooh + nh3 ^ h2nch2c(=0)nh2 + h2o (6)
While these earlier papers presented landmark ab initio calculations on biosystems,
computational restrictions at the time they were performed limited those investigations to model
systems. The current work presents a parallel series of investigations on both the simple model
system (5) discussed above and on the simplest dipeptide - glycyl glycine:
h2nch2cooh-I-nh2ch2cooh ^ h2nch2c(=0)nhch2c00h-I-H2O (7)
II. Computational Approach
An important aspect of this study is to determine levels of theoretical treatments of large
molecules which are both efficient and reliable. Therefore, several levels of theory will be
discussed.
The molecular structures of all stationary points have been determined with both the
semiempirical AMl'^ method and the minimal ST0-3G^^ basis set, at the self-consistent field
(SCF) level of theory. For the model system, stationary points were identified with the 6-
31G(d)" basis set, as well at both the SCF and MP2'^ levels of theory. Geometry
optimizations were performed with the aid of analytically determined gradients and the search

152
algorithms contained in MOP AC (version 5.0)'^ (AMI; the "NOMM^'^" option was used
where applicable), GAMESS,'® GAUSSIAN86,l^ and GAUSSIANSS^O (ab initio). The
nature of each SCF-stationary point was established by calculating (analytically for ab initio
wavefunctions, numerically for semiempirical methods) and diagonalizing the matrix of energy
second derivatives (hessian) to determine the number of imaginary frequencies (zero for a local
minimum, one for a transition state). The MP2 and SCF geometries are sufficiently similar so
that the considerable computational expense of MP2 hessians was considered unnecessary.
The two mechanisms (stepwise and concerted) for the model system were initially
explored with the semiempirical methods. The three transition states (TSl, TS2 and TS3; see
Schemes 1 and 2) were located and identified by following the gradient downhill in both
directions using the gradient following routine implemented in MOPAC. The resulting
structures were optimized and verified as minima by calculating the hessian. These geometries
were used as initial guesses for subsequent ab initio calculations.
Several computational problems arise in the study of systems as complex as those in
reaction (7). One is how to select the lowest-energy conformation for each structure from the
many conformational isomers that exist in a system this large. Another is how to efficiendy
optimize structures this complex. The approach taken in this study is the following. First we
define that part of the structure that glycyl glycine and the model system have in common as the
"model system part" of each structure. Those atoms which are directly involved in a transition
state are collectively referred to as the "TS part." The AMI geometry for the model system part
of the three transition states was taken from the model system calculations. Then (N-)H and
(C-)H were replaced with CH2COOH and CHoNH2, respectively, each arranged so as to most
closely resemble the global minimum conformation of gas phase glycine.-^ These two parts
were subsequendy energy minimized while the geometry of the TS part was kept frozen. Then
all geometrical parameters were relaxed and the TS was optimized using the NLLSQ-^ option
in MOPAC. Again, the gradient was followed downhill in both directions starting at each TS,

153
the resulting structures optimized and verified as minima. These structures were then used as
initial guesses for the subsequent ST0-3G optimizations. It was found that this 'freeze-
unfreeze' technique was necessary to obtain the ST0-3G transition states as well. Clearly,
many more conformational isomers of the stationary points found in this study exist.
However, the structures presented here are thought to be representative of both the structures
and energies involved in gas phase peptide bond formation.
To obtain improved predictions of energetics, higher level calculations were performed
at the SCF-optimized geometries. These single point calculations were performed with the 6-
31G(d,p) and 6-311G(d,p)^^ basis sets and frozen-core many body perturbation theory
through second (MP2)^^ or full fourth (MP4) order. The notation used to describe such single
point calculations is A//B, signifying a calculation at theoretical level A performed at a geometry
obtained at theoretical level B. The MP4/6-31 lG(d,p) results were obtained by extrapolation
from MP4/6-31G(d,p) and MP2/6-31 lG(d,p), assuming that improvements in basis set and
level of correlation are additive.^"^
The technique used to obtain localized molecular orbitals (LMOs) is that described by
Boys.^^ The electron density of each LMO is calculated over a 61x61 grid, squared, multiplied
by the orbital occupation number (two for RHF) and summed up to give the total electron
density. In the analysis of the total electron density the presence of a bond critical point (that
is, a saddle point in the electron density) connecting two atoms is considered to be indicative of
bonding. Intemuclear distances and LMOs then provide qualitative information about the
relative strength of each bonding interaction. The information thus obtained is used to elucidate
key features of the mechanisms by translating the MO-based results into a valence bond-like
description (section in.B.)
The zero point and Gibbs free energies are calculated using standard statistic-
mechanical formulae^^ (with the harmonic oscillator-rigid rotor approximation) as implemented
in GAMESS.

154
III. Results And Discussion
The concerted and stepwise mechanisms for the dipeptide bond formation are illustrated
in Schemes 1 and 2, respectively. In these schemes, and in the related tables and discussions,
R = R' = H for the model system [(5)], while for the actual dipeptide bond formation [(7)], R
= CH2NH9 and R' = CH2COOH. For the concerted mechanism, there is a single four-center
transition state, denoted TS3 in Scheme 2, with an associated classical barrier height AE^. For
the stepwise process, an intermediate INT2 is separated from reactants by a barrier AEj at
transition state TSl and from products by a barrier AE3 at transition state TS2. A key
question is therefore whether the barrier height AEg is greater or smaller than the larger of the
two barriers AEj and AE3. The barrier separating INT2 and INTl in Scheme 1 corresponds
to an internal rotation in the intermediate.
This section is organized as follows. First the SCF-optimized molecular structures for
each basis set and reaction are compared. Secondly, those parts of the TS-wavefunctions
(localized molecular orbitals and total density) common to both (5) and (7) are analyzed to
give a valence bond-like description of the mechanisms. Thirdly, the energetics of the two
mechanisms are discussed and the effect of entropy is addressed. Lastly, the effect of electron
correlation (MP2) on the molecular structure is examined.
A. Molecular Structures.
The structures of the model system (5) are investigated using both the 6-3 lG(d) and
ST0-3G basis sets and the semiempirical AM 1 hamiltonian so that the accuracy of the latter
two may be gauged by comparison to the former. These are then used to investigate the glycyl
glycine system (7). Two key features of the predicted geometries are of interest: (1) How well
do the various levels of theory agree with regard to the prediction of key geometric parameters?
(2) How similar are the key common geometric features in the model compound and the full

155
dipeptide? The two questions are addressed first for the products and reactants of both systems
and subsequently for the transition states.
The predicted geometries for glycine and the dipeptide are displayed in Figures 1 and 2,
respectively. In each of these figures, both the ST0-3G and the AMI (in parentheses)
parameters are given and in Figure 1 experimental parameters^are included in brackets.
The glycine conformation shown in Figure 1 is the global minimum on the potential energy
surface of gas phase glycine,^' and is used as reactant for both mechanisms. The structure
agrees well with structures obtained using a higher level of theory-as well as with neutron
diffraction.^^^®^ Bond lengths calculated with ST0-3G are too long by O.Ol-O.OSA relative to
experiment (due to the small basis set). Figures 2a and b depict the dipeptide product of the
stepwise and concerted mechanisms, respectively. Bond lengths predicted by AMI and STO-
3G generally agree to within 0.05A and bond angles to within 7°. Judging from the 0=CC-N
dihedral angles, the two glycine subunits in Figure 2 retain the conformation of the monomer,
the largest deviation being 31.9° calculated with AMI for 2a. The peptide bond linkage
deviates from planarity by up to 30°. Both methods predict a 0.02-0.03A increase in the C-N
bond length relative to formamide. Bond lengths and angles of the two glycyl glycine
conformers differ little. The largest disagreements are for the AMI C^^-N and C^-C bond
lengths.
The predicted geometries for formic acid and formamide are presented in Table I, while
those for the three transition states (TSl, TS2, TS3) and the intermediate INT2 are given in
Tables II-V, respectively. Only the most interesting geometric parameters are given in the latter
four tables. Complete geometries are available as supplementary material. The molecular
structures of the three transition states and one intermediate are depicted schematically in
Figures 3-6, respectively.
The structures of formic acid and formamide are well predicted by all methods. For the
transition states, there are significant deviations among the various theoretical methods. The

156
SCF/6-31G(d) geometry is used as reference for each structure. The TS best represented by
the simpler methods is TSl. The only serious deviation (>0.i A) is the overestimation of the
C-N bond length by 0.208A using ST0-3G. Large deviations in the key geometric parameters
are more common for TS2 and TS3. In the case of ST0-3G only the C2-O3 (NtH_^) distance
is within 0.1 A of the 6-31G(d) values for TS2 (TS3). The largest deviation is the 0.274A
underestimation of the C1-O3 distance in TS3. Bond angles are generally within 10° of those
predicted by 6-31G(d). The AMI method does somewhat better in that it brings the O5-H4 and
O3-H4 distance deviations down to 0.075 and 0.084A, respectively. The largest AMI
deviation (0.294A) is the underestimation of the €[-03 distance in TS3. The deviations in
bond angles predicted by AMI are generally within 15°. An exception is that the O-H-0 angle
in TS2 is underestimated by 24°. It appears the leaving water molecules in the TSs are more
intact while also more strongly attached to the carbon for AMI and especially ST0-3G relative
to 6-31G(d).
For INT2 (Table V; Figure 6) bond lengths vary between basis sets, but the deviations
for both AMI and ST0-3G are on the order of 0.05A. Bond angle deviations are on the order
of 3-5°.
Both ST0-3G and AMI have been used to analyze the reactions of the model system
and the actual dipeptide bond forming reaction. For the STO-3G basis set, the key geometric
parameters predicted for the model system are in excellent agreement with those for dipeptide,
even though there are significant differences relative to 6-3 lG(d). All bond lengths agree to
within O.O3A and the angles generally to within 1.5°( 2-3° for some INT2 parameters). The
agreement obtained using AMI is comparatively good. So, the reaction between formic acid
and ammonia appears to be a realistic structural model for the glycine + glycine reaction. Thus,
the 6-31G(d) results obtained for the model system are very likely to be an accurate
representation of (7) and can be used to interpret its mechanism.

157
In Figure 6 a hydrogen bond is drawn between an oxygen at the C-terminal and one of
the hydroxy] hydrogens, as the 0---(H-)0 distance is 2.652A and the 0--H-0 angle is
159.5°, both of which are optimimum for hydrogen bonding.-® In addition, one of the 0(-"H-
O) LMO lone pairs is delocalized along the 0---H "bond" axis.
B. Electronic Wavefunction.
Figures 7-9 display four key 6-31G(d) localized molecular orbitals (LMOs) and the
total density in the bond breaking/making region for each transidon state. Key features of each
molecular structure are included for comparison (and explained in the figure legend). In this
manner, key features of the mechanism can be elucidated.
First consider TSl (Figure 7). The C-N bond is essentially formed at the TS. Here,
the C-N bond distance in a fiilly optimized structure of zwitter-ionic glycine,^^ rather than the
conformer shown in Figure 1, serves as a reference since the C-N(H2) bond length is
considerably shorter (0.07A) than that in C-N(H3). While the C-N distance is 0.044A longer
than the bond length in the glycine zwitter-ion, there is a clear bonding orbital and the total
electron density exhibits a saddle point connecting C and N. The C-O bond appears to be a
single bond judging from the bond length, identical to the single bond in formic acid. From the
density it is apparent that although there is some H^-O bonding, there is more electron density
between H4 and N. This is consistent with the fact that the N-H bond distance is closer to an
equilibrium value than is the 0-H distance: the N-H4 bond is elongated by 0.204A while the O-
H4 distance is stretched by almost twice that (0.380A). This suggests that there is an N-H
bond and only weak bonding between O and H. Thus, the bonding picture of TSl (2) is very
much like the intermediate in reaction (1) in that C-N bond formation precedes hydrogen
transfer.

158
O,
H jj
Vh
Next consider TS2 (Figure 8). No bond appears to exist connecting O5 and the C
atom. This is especially apparent from the lack of a C-0 bond critical point in the total density
and the very long 1.925A-intemuclear distance. It is also apparent that the corresponding LMO
(Figure 8d) is essentially an Og lone pair. Weak bonding exists between O5 and H4, but a
much stronger bond is found between H4 and O3. Evidence for these assertions is found in the
total density (bond critical points are evident between both H4-O5 and H4-O3, but there is a
larger build-up of charge density between the latter than the former) as well as in the bond
lengths. The deviation from equilibrium bond distance is more than twice as large for H4-O5
than for H4-O3 (0.369A versus 0.166A) The LMO connecting O3 and H4 (Figure 8) shows
significant delocalization onto the C-O3 bond which adds to a rather diffuse density build-up
between the latter two atoms. This, in conjunction with C-O3 and C-N bond lengths that are
intermediate between double and single bond lengths (the C-N distance is 1.330A), suggests a
partial C-O3 double bond. Hence, TS2 might be written as
HI"
H I
.-O5
O3
3 ' NH,

159
Since the C-O3 distance is longer and the C-N distance shorter than those in formamide one
expects more [0-C=N] character than in formamide. Note the strong similarity between 3 and
1 in the acid catalyzed hydrolysis mechanism, indicating a S-like TS in the gas phase as well as
in acidic aqueous solution.
Finally, an intermediate picture emerges for TS3 (Figure 9). The N-H^ bond is more
completely formed than in TSl, since the N-H distance is closer to its equilibrium value. The
O-H interaction is weaker than in TSl and TS2 although a bond critical point is present.
While the C-N bond distance is 0.02A shorter than in TSl, the LMO and total electron density
remains virtually unchanged. Thus, the C-N bond is almost completely formed. The C-O3
bond length is O.OSA shorter than in TS2 but there is still no significant density build-up
between C and O (and no bond critical point), and the LMO remains primarily an O orbital.
These observations leads one to conclude that there is no C-O3 bond. A possible bonding
picture of TS3 is
Thus, in the concerted aminolysis-mechanism the proton transfer is preceded by N-C bond
formation as it is in the stepwise mechanism. Conversely, amide hydrolysis via a concerted
mechanism involves a nucleophilic attack on a protonated substrate, much like the first step of
the stepwise mechanism in the gas phase and acidic aqueous solution.
?4
4

160
C. Energetics.
The total energies, zero point vibrational energies (ZPE), and Gibbs free energies at
298K (G298) for all species of interest at several different levels of theory are included in the
supplementary materials. The corresponding energy differences (AE), OK enthalpy differences
[AHq = AE + A(ZPE)], and Gibbs free energy differences are listed in Tables VI and VII.
Referring to Schemes 1 and 2, the values of greatest interest are the heights of the barriers at
TSl and TS2 (the stepwise transition states) versus the barrier height at TS3 (the transition
state for the concerted process). These barriers are referred to as AEj, AE3, and AE^,
respectively (Table VI). Also of interest is the relative stability of the two intermediates (AE-,
and AE4) and the overall endothermicity of the reaction (AE^ for the model system and the
stepwise process of (7); AEg for the concerted mechanism of glycyl glycine formation^®).
These values are listed in Table VII.
Model System. First, consider the relative values of AEj and AE3, the two steps in
the stepwise mechanism. At the SCF level of theory for the model system, the minimal basis
sets (AMI, ST0-3G) predict the second step in this process (AE3, conversion of the
intermediate to products) to be considerably more energy-demanding than the first step (AEj,
conversion of reactants to the intermediate). The relative values of AE3-AEJ range from 10
kcal/mol for AMI to 28 kcal/mol for ST0-3G. The use of the larger basis sets 6-31G(d) and
6-31G(d,p) at the minimal basis set geometries decreases these differences to 2-4 kcal/mol.
This is a dramatic basis set effect. Only when the larger 6-3 lG(d) basis set (denoted "C" in
Tables VI and VII) is used to predict the geometry do the SCF calculations predict the first step
in the stepwise mechanism to be the higher energy of the two. Using the largest basis set
employed here, 6-31 lG(d,p) at the 6-31G(d) geometries, the SCF calculations predict AEj to
be 7.7 kcal/mol greater than AE3. The addition of correlation conections reduces both AEj and
AE3 by about 10 kcal/mol, but has a much smaller effect on the relative values of these two
barrier heights. At the highest level of theory, MP4/6-31G(d,p)//RHF/6-31G(d), AEj is

161
greater than AE3 by 1.7 kcal/mol. Note, however, that the difference between MP2 and MP4
barriers is generally less than 2.0 kcal/mol.
At the SCF level of theory, the barrier height, AE^, for the concerted mechanism is
predicted with all basis sets except ST0-3G to be higher than either of the barriers in the
stepwise mechanism. Recall that STO-3G predicts a value for AE3 that is much too large (see
Table VI). Improvement of the basis set to 6-31G(d), 6-31G(d,p), or 6-31 lG(d,p) raises AE^
by about 10 kcal/mol, relative to the minimal basis sets. So, at the SCF level of theory, the
stepwise process is predicted to be more viable than the concerted mechanism by about 10
kcal/mol, using any of the three largest basis sets. The spread in barrier heights for AE^
predicted by these three basis sets at the 6-3 lG(d) geometry is only 2.6 kcal/mol. Addition of
correlation corrections (MP2) reduces the predicted value of AE^ by as much as 20 kcal/mol,
with the effect being the greatest for the larger basis sets. Even so, AE^ is still found to be
higher than either AEj or AE3 at all correlated levels except MP2/STO-3G. The barriers
predicted with MP4 are only slightly different from those predicted with MP2 for a given basis
set. At the 6-31G(d) geometries, all correlated calculations find the concerted mechanism to
require about 4 kcal/mol more energy than the stepwise mechanism. Use of a minimal basis
(STO-3G or AMI) geometry raises this difference to 6-8 kcal/mol. It is gratifying that most
levels of theory investigated here are in reasonable agreement on this point [MP4//6-
31 lG(d,p)//C and MP2/6-3 lG(d)//A favor the stepwise mechanism by 3.3 and 7.5 kcal/mol,
respectively].
Of particular interest with regard to the next subsection is the following comparison:
The values of AEj, AE3, AEg predicted by MP2/6-31G(d)//AMl are 44.6, 46.2, 52.7 kcal/mol,
respectively, while MP2/6-31G(d)//STO-3G predicts 41.3, 40.6,48.8 for the same three
barrier heights. These may be compared with the predictions of 41.4, 39.7, 44.7 at the highest
level of theory performed here, MP4/6-31 lG(d,p)//6-3 lG(d). The agreement between each of

162
the two less time-consuming levels of theory with the latter is quite good, particularly when
ST0-3G geometries are used. All three levels of theory predict that the stepwise mechanism
has a smaller overall energy requirement than the concerted mechanism, but only by a few
kcal/mol.
Glycyl glycine. The barriers and relative energies for the glycyl glycine system are
listed in Tables VI and Vn, respectively. The overall trends found for the dipeptide are similar
to those discussed above for the model system: There are significant changes as a result of
both basis set improvement and the addition of correlation corrections. Based on the detailed
comparisons presented for the model system, one expects that barrier heights obtained at the
highest levels of theory used for dipeptide will be at least qualitatively similar to those predicted
by MP4/6-311G(d,p)//RHF/6-31G(d) for the model system. The values of AEj, AE3, AE^
predicted by MP2/6-31G(d)//AMl are 43.4, 52.7, 52.7 kcal/mol, respectively, while MP2/6-
31G(d)//STO-3G predicts 40.5, 44.7, 47.7 for the same barrier heights. The barrier heights
predicted for glycyl glycine are very similar to those found for the model system. Notice in
particular that MP2/6-3IG(d)//A favors the stepwise process (AE3 > AEj) by 3.0 kcal/mol.
This is essentially what was found for the model system with the highest level of theory.
Based on these results, it may be concluded that, as found for the model system, the two
alternative mechanisms have similar overall energy requirements. This suggests that the
essence of the energetics for dipeptide bond formation is largely unaffected by the ancillary
groups not directly involved in the bond-making and bond-breaking. This observation
provides some justification for the previous calculations on model systems,^ as well as some
impetus for performing similar time-saving calculations for more elaborate amino acids.
Thermodynamics. Table VII lists the energies of the products and intermediates
relative to the reactants for both the model system and the glycyl glycine system. The latter has
two (conformationally) distinct products, and two energy differences must be considered.^®
The results for the model system and reaction (7) are very similar and both can be represented

163
schematically by Figure 10. First the model system is considered and the RHF/6-31G(d)
results are taken as the reference. It can be seen (Table VII) that the first and second step are
endothermic by 5.6 and 3.3 kcal/mol, respectively. The addition of more basis functions and
correlation decrease the numbers slightly: MP4/6-311G(d,p)//C predicts 3.7 and 1.9 kcal/mol.
All ab initio values, with the exception of RHF/ST0-3G, roughly fall on the solid curve.
RHF/STO-3G offers a drastically different picture. The first step is now ^A-othermic by
26.1 kcal/mol and the stability of INT2 is equally overestimated (25.8 kcal/mol). The overall
endothermicity is also overestimated, 12.0 versus. 3.3 kcal/mol. This, in conjunction with the
Hanmiond Postulate,^^ helps explain the deviations in TS geometry observed above: the
elongated C-N bond in TSl and the almost completely formed water in TS2 and TS3. The
former is indicative of an earlier ("reactant-like") TS, while the latter suggests a later TS which
is exactly what one would expect from comparing the RHF/STO-3G with the RHF/6-3 lG(d)
potential energy surface (PES; Figure 10). It is known^^ that ST0-3G performs poorly for
systems with differing numbers of multiple bonds, and this would explain why the overall
endotheimicity is predicted better than the thermodynamics of the individual steps. AMI
presents an intermediate picture both in terms of thermochemistry and TS geometry-deviation.
The conclusions reached in the previous paragraphs generally apply to the glycyl
glycine system. The highest common level of theory [jVIP2/6-31G(d)] shows similar results
for the two systems. The endothermicity of the first step decreases to 3.6 kcal/mol and the
overall endothermicity of the stepwise mechanism is 2.0 kcal/mol (compared to 6.0 and 3.4
kcal/mol for the model system, respectively). The concerted mechanism considered here
results in a glycyl glycine conformer with an energy, and endothermicity, 4.6 kcal/mol higher
than that for the stepwise process. Experimentally, one would expect the two mechanisms to
result in the same Boltzmann distribution of glycyl glycine conformers.
Effect of nuclear motion. The discussion in the preceding subsections has
concentrated on electronic barrier heights and energy differences, without including the effects

164
of motion of the nuclei. The most obvious such effect is that of the zero point vibrational
frequencies (ZPE). The ZPE corrected values, calculated with the harmonic approximation, are
listed in Table VI and VII. To simplify the discussion, only those levels of theory discussed
previously will be considered here. In general, the ZPE corrections to the calculated barrier
heights are on the order of 1-5 kcal/mol. For the model system, these corrections are such that
the first step in the stepwise process (AHj) becomes relatively higher than the second step
(AH3), with the stepwise mechanism still being favored by a few kcaiymol. The change is
mainly due to a 2-4 kcal/mol decrease for AH3 and very little change in AHj. Also,
increases slightly so that at the highest level of theory the stepwise mechanism is still preferred,
by 2.4 kcal/mol. MP2/6-31G(d) //A continues to overestimate the gap by about 4 kcal/mol.
The same trends are evident for the dipeptide, such that the gap between the energy
requirements for the stepwise and concerted mechanisms increases by about 3 kcal/mol.
While AH J is slightly smaller than AH3 for the dipeptide at the MP2/6-31G(d)//STO-3G level,
these two may well reverse at higher levels of theory, based on the results for the model
system.
Given the molecular structures and vibrational frequencies, it is straightforward to
calculate the Gibbs free energy at any temperature, using the harmonic oscillator/rigid rotor
approximation. This is useful, since it allows one to estimate both temperature and entropy
effects on the reaction energetics. The free energy differences at 298K are listed in Table VI
and vn. The inclusion of entropy increases the (Gibbs free) energies of all structures relative
to the reactants. The intermediates increase by roughly 5 kcal/mol more than the TSs, which
increase by about 10-12 kcal/mol relative to the electronic energy, and the first step thus
becomes 15-17 kcal/mol higher in energy than the second. All the TSs increase by the same
amount for all levels and the stepwise mechanism is still favored by no more than 3 kcal/mol at
the highest level. MP2/6-31G(d)//A now overestimates this difference by only 2.1 kcal/mol
since AGj increases 2 kcal/mol more than AG^. AMI continues to overestimate the barrier for

165
the concerted mechanism. For the dipeptide system the gap widens a bit (by 3 kcal/mol for
MP2/6-31G*//A) and if one considers the 2.1 kcal/mol-overestimation observed in the model
system, the difference drops to around 6 kcal/mol.
D. The Effect of Correlation On The Molecular Structure.
It is evident from the previous discussion that correlation has a significant effect on the
calculated barriers. The possibility that the calculated geometries may be equally affected has
been investigated. The principal concern is whether the bonding description of the three
transition states outlined in section B changes qualitatively. All previously discussed stationary
points in reaction (5) were optimized at the MP2/6-31G(d) level of theory, and the resulting
key geometric parameters are listed in Tables I-V. In addition, the glycine zwitter-ion"^ was
also optimized to provide reference C-N and N-H equilibrium bond distances (1.507A and
1.024A, respectively).
First, consider TSl. One finds that all the key bond distances and their associated
equilibrium bond distances considered in Figure 7, increase relative to the SCF values. The
distance deviations from equilibrium, calculated using MP2, give a bonding description similar
to 2. Again, the 0-H distance shows a deviation from its equilibrium value that is twice as
large as that for N-H (0.400A versus. 0.200A). This seems to indicate that is primarily
bonded to the nitrogen. The N-C distance of 1.562A (equilibrium value=1.507A) seems to
indicate that the N-C bond is essentially formed, while the 1.336A C-0 distance is indicative of
a single bond when compared to the formic acid C-0 distances of 1.350A (single) and 1.212A
(double). Thus, the proton transfer seems to proceed after the N-C bond is essentially formed,
and the bonding picture of TSl (2) remains similar to the labile intermediate proposed by
Jencks and co-workers.^
Now consider TS2. The C-O^ distance of 1.836A, compared to the equilibrium value
of 1.350A for a single bond, does not suggest any significant bonding between those two

166
atoms. Judging from the C-O3 and N-C bond (equilibrium) distances of 1.3 ISA (1.350A,
single; 1.224A, double) and 1.358A (1.362A for formamide) there is some delocalization of
charge from the C-O3 bond onto the N-C bond. The 03-H^ distance has increased and the O5-
H4 distance decreases relative to the SCF-geometry, so that the proton transfer from the
incoming water is less complete. However, the respective distances of 1.21 lA and 1.272A, in
conjunction with the C-O5, C-O3, and N-C distances, suggest that proton transfer precedes
nucleophilic attack in the first step of formamide hydrolysis, in accordance with SCF and
experimental results.^"^
Next, consider TS3. As in TSl, the N-C bond is largely formed, although the
deviation from equilibrium is larger for MP2 (0.070A) than for SCF (0.020A). H4 appears
primarily bonded to N considering N-H and H-C2 (equilibrium) distances of 1.200A (1.024A)
and I.329A (0.980A), respectively. Although the gap between bond and equilibrium bond
distance for O2-C has decreased relative to SCF (0.462A versus 0.554A), 1.812A seems
unreasonably large for any significant bonded interaction between O2 and C. Thus the
conclusions regarding TS3, and indeed for TSl and TS2, in section B remain consistent
with results obtained with correlated wave functions.
The energetics of both the stepwise and concerted mechanisms are essentially
unaffected by the changes in geometry. The MP2/6-31G(d)//MP2/6-31G(d) calculated values
for barriers and relative stabilities are listed in Table VI and VII, respectively. The largest
deviation from MP4/6-31 lG(d,p)//RHF/6-31G(d) values is 1.6 kcal/mol for AE3. The latter
remains the highest of the three barriers considered in Table VI.
IV. Conclusions
Two mechanisms of peptide bond formation are considered in this study, a stepwise
mechanism proceeding through a tetrahedral intermediate (Scheme 1) and a concerted
167
mechanism (Scheme 2). These mechanisms are explored in two systems, a model system
[(5)] leading to the formation of formamide and an extended system [(7)] leading to the
formation of the dipeptide glycyl glycine. The model system is studied extensively using high
levels of theoiy [the highest being MP4/6-31 lG(d,p)//RHF/6-31G(d)], and the results are
compared to less accurate methods to gauge their accuracy. The glycyl glycine system is then
investigated with these less accurate methods to establish how well the model system
represents the actual extended system. The main conclusions that may be drawn from this
work are:
1. In the first step of the stepwise mechanism, C-N bond formation precedes proton
transfer, in accordance with the experimental results for acidic aqueous solutions.
2. In the second step of the stepwise mechanism a proton is transferred after the leaving
group has departed in the dehydration reaction. This is equivalent to nucleophilic attack
preceded by proton transfer; i.e. an S-like transition state, in the reverse reaction, hydration.
3. The mechanism for the concerted reaction is essentially a composite of points 1 and
2.
4. The overall reaction is predicted to be slightly endothermic.
5. While the first step in the stepwise process seems to require slightly more energy
than the second, the difference is too small to distinguishing the two steps with certainty.
6. The stepwise process requires slightly less energy than the concerted mechanism,
but the two are too close to call.
7. The inclusion of entropy effects slightly widens the difference in energy
requirements for concerted versus stepwise.
8. The model system appears to be a good representative of the actual dipeptide system.
In particular, the geometric parameters common to (5) and (7) are very similar, and the
barriers and relative energetics for (5) and (7) are very close. Thus one can use the results

168
obtained with the highest level of theory for (5) to analyze its mechanism and be fairly
confident that they apply to (7) as well.
9. The semiempirical AMI method predicts transition state geometries that are in better
agreement with 6-31G(d) structures than ST0-3G, because ST0-3G greatly overestimates the
stability of the intermediates relative to the reactants (Figure 10).
10. The MP4/6-311G(d,p)//6-31G(d) energetics appear to be well-represented by both
MP2/6-31G(d)//AMl and MP2/6-31G(d)//STO-3G calculations on (5). The latter two
methods are sufficiently modest so that they may be used on (7).
11. While points 1-3 are partially based on SCF electron densities, they are also
supported by geometries obtained with correlated (MP2) wave functions.
Acknowledgements
This work was supported in part by a grant from the Petroleum Research Fund,
administered by the American Chemical Society. The calculations were performed on the
North Dakota University EBM 3090/200E, obtained in part by a Joint Study Agreement with
IBM, on the Cray Y-MP at the San Diego Supercomputer Center, on a VAXstation 3200, and
on an IBM RS/6000/530 obtained through a grant from the National Science Foundation. Dr.
Thomas R. Cundari and Theresa L. Windus are thanked for their careful reading of the
manuscript.
References
1. For a general review see: (a) Lehninger, A. L. Biochemistry, Worth Publishers, Inc.: New York, 1975. (b) Stryer, L. Biochemistry, W. H. Freeman and Co.: San Francisco. 1981.
2. (a) Bodanszky, M. Peptide Chemistry, Springer-Verlag: Berlin, 1988. (b) The Peptides, Volume 1\ Gross, E., Meienhofer, J., Eds.; Academic Press: New York, 1979.
3. Fisher, E. Ber. dtsch. Chem. Ges. 1903, 56, 2094.

169
4. (a) Sanger, F.; Thompson, E. 0. P. Biochem. J. 1961, 49, 463. (b) Sanger, F.; Tuppy, H. Biochem. J. 1963, 53, 353.
5. (a) Jencks, W.P.; Gilchrist, M. J. Am. Chem. Soc. 1968, 90, 2622. (b) Satterthwait, A.; Jencks, W. P. J. Am. Chem. Soc. 1974, 96, 7018. (c) Satterthwait, A.; Jencks. W. P. J. Am. Chem. Soc. 1974, 96, 7031. (d) Gresser, M. J.; Jencks, W. P. J. Am. Chem. Soc. 1977, 99, 6970.
6. (a) Lowry, T. H.; Richardson, K. S. Mechanism and Theory of Organic Cheinistry-, Harper & Row, Publishers: New York, 1981. (b) Carey, F. A.; Sundberg, R. J. Advanced Organic Chemistry, Pari A: Structure and Mechanisms; Plenum Press, New York, 1984.
7. (a) Reference 6(a), page 605. (b) Reference 6(b), page 411.
8. Reference 6(b) pages 431-432.
9. (a) Oie, T.; Loew, G. H.; Burt, S. K.; Binkley, J. S.; MacElroy, R. D. J. Am. Chem. Soc. 1982,104, 6169. (b) Oie, T.; Loew, G. H.; Burt, S. K.; MacElroy, R. D. J. Am. Chem. Soc. 1983,105, 2221. (c) Oie, T.; Loew, G. H.; Burt, S. K.;Binkley, J. S.; MacElroy, R. D. Int. J. Quantum Chem.; Quantum Biol. Symp. 1982, 9, 223. (d) Oie, T.; Loew, G. H.; Burt, S. K.; MacElroy, R. D. J. Comp. Chem. 1983, 4, 449. (e) Oie, T.; Loew, G. H.; Burt, S. K.; MacElroy, R. D. J. Am. Chem. Soc. 1984,106, 8007.
10. (a) Krishnan, R.; Pople, J. A. Int. J. Quantum Chem. 1978,14, 91. (b) Krishnan, R.; Frisch, M. J.; Pople, J. A. J. Chem. Phys. 1980, 72, 4244.
11. (a) Hehre, W. J.; Ditchfield, R.; Pople, J. A. J. Chem. Phys. 1972, 56, 2257. (b) Hariharan, P. C.; Pople, J. A. Theor. Chim. Acta. 1973, 28, 213. (c) Standard polarization functions were used; H (p = 1.1), C (^/ = 0.8), N (if = 0.8), O {d = 0.8).
12. Binkley, J. S.; Pople, J. A.; Hehre, W. J. J. Am. Chem. Soc. 1980,102, 939.
13. (a) Hehre, W. J.; Stewart, R. F.; Pople, J. A. J. Chem. Phys. 1969, 51, 2651. (b) Hehre, W. J.; Ditchfield, R.; Stewart, R. F.; Pople, J. A. J. Chem. Phys. 1970, 52, 2769.
14. Dewar, M. J.; Zoebisch, E. G.; Healy, E. F.; Stewart, J, J. P. J. Am. Chem. Soc. 1985,107, 3902.
15. (a) M0ller, C.; Plesset, M. S. Phys. Rev. 1934, 46, 618. (b) Pople, J. A.; Binkley, J. S.; Seeger, R. Int. J. Quantum Chem.; Quantum Chem. Symp. 1976,10, 1. (c) Carsky, P.; Hess, B. A.; Schaad, L. J. J. Comp. Chem. 1984, J, 280.
16. Stewart, J. J. P. QCPE, program 455.

170
17. The option to add a Molecular Mechanics correction that increases the barrier to rotation around a peptide bond, is not used.
18. Schmidt, M. W.; Baldridge, K. K.; Boatz, J. A.; Jensen. J. H.; Koseki. S.; Gordon, M. S.; Nguyen, K. A.; Windus, T. L.; Elbert, S. T. QCPE Bull. 1990, 10. 52.
19. Frisch, M. J.; Binkley, J. S.; Schlegel, H. B.: Raghavashari, K.; Melius, C. F.; Martin, R. L.; Stewart, J. J. P.; Brobrowicz, F. W.; Rohlfing, C. M.; Kahn, L. R.; DeFrees, D. J.; Seeger, R.; Whiteside, R. A.; Fox, D. J.; Fluder, E. M.; Topiol, S.; Pople, J. A. GAUSSIAN86; Carnegie Mellon Quantum Chemistry Publishing Unit: Pittsburgh, PA 15213.
20. Frisch, M. J.; Head-Gordon, M. Schelegel, H. B.; Raghavachari, K.; Binkley, J. S.; Gonzalez, C.; DeFrees, D. J.; Fox, D. J.; Whiteside, R. A.; Seeger, R.; Melius, C. F.; Baker, J.; Martin, R.; Kahn, L. R.; Stewart, J. J. P.; Fluder, E. M.; Topiol, S.; Pople, J. A.GAUSSIAN88; Carnegie Mellon Quantum Chemistry Publishing Unit: Pittsburgh, PA 15213.
21. (a) Vishveshwara, S.; Pople, J. A. J. Am. Chem. Soc. 1977, 99, 2422. (b) Suenram, R. D.; Lovas, F. J. J. Mol. Spectrosc. 1978, 72, 372. (c) Schafer, L.; Sellers, H. L.; Lovas, F. J.; Suenram, R. D. J. Am. Chem. Soc. 1980, 102, 6566. (d) Jensen, J. H.; Gordon, M. S. J. Am. Chem. Soc. 1991,113, 7917. (e) lijima, K.; Tanaka, K.; Onuma, S. J. Mol. Struct. 1991, 246, 257.
22. A non-linear least squares gradient minimizer that minimizes gradients using Bartel's method. See MOP AC manual and source code for further information.
23. (a) Krishnan, R.; Binkley, J. S.; Seeger, R.; Pople, J. A. J. Chem. Phys. 1980, 72, 650. (b) Standard polarization functions were used: H (p = 0.75), C {d = 0.626), N = 0.913), 0{d= 1.292).
24. Hehre, W. J.; Radom, L.; v.R. Schleyer, P; Pople, J. A. Ab Initio Molecular Orbital Theory; John Wiley & Sons, Inc.:New York, 1986. Page 321.
25. Foster, J.M.; Boys, S. F. Rev. Mod. Phys. 1960, 32, 300.
26. Bader, R. F. W.; Nguyen-Dang, T. T.; Tal, Y. Rep. Prog. Phys. 1981, 44, 5679.
27. Davidson, N. Statistical Mechanics; McGRaw-Hill: New York, 1962.
28. Pauling, L. C. The Nature Of The Chemical Bond And The Structure Of Molecules And Crystcds: An Introduction To Modem Structural Chemistry; Cornell University Press: Ithaca, 1960.
29. The glycine zwitter-ion shown here was optimized at the RHF/6-3 lG(d) level of theory within the point group. The in-plane amine hydrogen is trans to the carboxylic acid carbon to avoid proton transfer to the oxygens, a barrier-less process in the gas phase.

171
H
O \ /
c— c,
O H
30. The dipeptide products of the stepwise and concerted reaction differ in geometry, and thus energy, due to the procedure by which the intermediates and products were obtained (see Section H. Hence, the overall endothermicity must be considered separately for the two mechanisms.
31. Hammond, G. S. J. Am. Chem. Soc. 1955, 77, 334.
32. Reference 24, page 293.

172
Table I. Structures of formic acid^ and formamide.''''^
MP2/6-31G(d) 6-31G(d) ST0-3G AMI
\ /" C N
H H
R(C-O) 1.350 1.323 1.386 1.357 R(C=0) 1.212 1.181 1.214 1.230 R(C-H) 1.096 1.084 1.104 1.103 R(O-H) 0.980 0.953 0.990 0.971 A(O-C-O) 125.1 124.9 123.6 117.6 A(H-C=0) 125.4 124.7 126.0 130.1 A(C-O-H) 106.1 108.7 104.8 110.6
O. H
\-/
R(C-N) 1.362 1.348 1.403 1.367 R(C=0) 1.224 1.193 1.218 1.243 R(C-H) 1.105 1.091 1.105 1.114 R(N-H) 1.011,1.009 0.996,0.993 1.014,1.013 0.990,0.986 A(O-C-N) 124.7 124.9 124.4 122.0 A(H-C-N) 112.4 112.7 111.4 112.6 A(C-N-H) 118.4,121.4 119.2,121.9 120.5,121.3 120.6,121.2
^The fomaldehyde structures have Q symmetry. ''RHF/6-31G(d) and AMI predict a Q structure, whereas MP2/6-31G(d) and RHF/ST0-3G predict a slightly nonplanar structure. <^Bond lengths in kistroms, angles in degrees.

173
Table D. Structure of transition state TSl for diglycine (model compound).^
MP2/6-31G(d) 6-31G(d) ST0-3G AMI
R(Ci -N2) (1.562) (1.548) 1.787(1.756) 1.552(1.531)
R(Ci -03) (1.336) (1.322) 1.317(1.315) 1.346(1.346) R(N-,-H4) (1.224) (1.211) 1.139(1.128) 1.281(1.284)
R(03-H4) (1.380) (1.334) 1.378(1.404) 1.423(1.419) A(H-N-C) (72.9) (72.4) 69.3(70.7) 80.6(80.7) A(N-C-O) (96.6) (95.9) 88.7(89.9) 93.3(94.0) A(C-O-H) (112.7) (77.0) 80.8(79.8) 83.4(83.0) D(H-N-C-O) (-9.0) (-5.3) -1.2(-0.4) 0.6(-0.2)
^Bond lengths in angstroms, angles in degrees.

174
Table HI. Structure of transition stale TS2 for diglycine (model compound).^
O,
H T
.-95
R
NHR'
MP2/6-31G(d) 6-31G(d) ST0-3G AMI
R(C2=03) (1.318) (1.293) 1.317(1.312) 1.345(1.339)
R(C2-05) (1.836) (1.925) 1.728(1.720) 1.635(1.662)
R(03-H4) (1.211) (1.119) 1.372(1.377) 1.371(1.355)
R(05-H4) (1.272) (1.322) 1.078(1.078) 1.239(1.247) A(C-03-H) (82.5) (87.1) 80.2(80.0) 87.7(88.5) A(O-C-O) (88.2) (84.5) 87.6(88.1) 87.1(86.8) A(O-H-O) (127.4) (129.9) 120.1(119.7) 104.5(105.7) D(O-C-O-H) (2.0) (3.1) -0.6(-0.5) 1.3(1.1)
^Bond lengths in angstroms, angles in degrees.

175
Table IV. Structure of transition state TS3 for diglycine (model compound).^
H.
H • O3
N2 Ci""//; R
/ O
MP2/6-31G(d) 6-31G(d) ST0-3G AMI
R(Ci -N2) (1.577) (1.524) 1.695(1.676) 1.546(1.522)
R(Ci -03) (1.812) (1.877) 1.615(1.603) 1.575(1.583)
R(N2-H4) (1.200) (1.135) 1.241(1.220) 1.332(1.340)
R(03-H4) (1.329) (1.378) 1.167(1.176) 1.303(1.294) A(H-N-C) (81.2) (85.5) 73.1(73.6) 81.9(82.5) A(N-C-0) (82.9) (81.5) 81.4(82.0) 87.0(87.1) A(C-O-H) (69.3) (66.3) 78.0(77.8) 81.7(81.6) D(H-N-C-O) (-6.5) (-6.6) 0.0(-0.8) -2.8(-2.0)
^Bond lengths in ^gstroms, angles in degrees.

176
Table V. Structure of intermediate INT2 for diglycine (model compound).^
R' O3H
\ Ni C,— R
/ r H 05H
MP2/631G(d) 6-31G(d) ST0-3G AMI
R(Ci-N2) (1.443) (1.433) 1.504(1.489) 1.473(1.451)
R(C2-03) (1.409) (1.386) 1.416(1.426) 1.413(1.418)
R(C2-05) (1.404) (1.383) 1.432(1.426) 1.422(1.416) A(N-C-03) (108.2) (108.8) 113.5(109.1) 114.2(112.2) A(N-C-05) (116.0) (115.2) 109.1(114.0) 112.0(114.8) A(O-C-O) (106.5) (107.0) 108.1(107.1) 101.8(101.6)
^Bond lengths in ^gstroms, angles in degrees.

177
Table VI. Energetics for peptide bond formation (kcal/mol).^
Level of theory AEi AH] AGi AE3 AH?
0
<1
AE6 AH6 AG6 Model System
AMI 45.4 55.2 59.1
RHF/6-31G*//AMl 57.4 60.9 71.1
RHF/6-31G**//AMl 56.4 60.6 70.1 RHF/ST0-3G//A 50.7 78.3 57.8
RHF/6-31G*//A 52.7 51.0 67.2
RHF/6-31G*//C 54.9 51.8 64.5
RHF/6-31G**//C 52.8 50.3 63.3
RHF/6-311G**//C 58.2 50.5 67.1
MP2/6-31G*//AMl 44.6 43.5 54.5 46.2 41.6 46.6 52.7 52.5 62.6
MP2/6-31G //AMI 44.8 47.1 53.0
MP2/STO-3G//A'^ 53.5 56.9 44.7
MP2/6-31G*//A 41.3 44.6 53.2 40.6 38.8 38.2 48.8 52.0 58.6
MP2/6-31G**//C 38.8 39.1 43.5
MP4/6-31G**//C 40.6 39.0 44.6
MP2/6-311G**//C 39.5 40.6 50.9 39.7 35.1 35.2 43.6 43.8 55.0
MP4/6-311G**//C 41.4 42.5 52.8 39.7 35.1 35.2 44.7 44.9 56.1 MP2/6-31G*//MP2/C 40.5 38.4 43.1
Glycylglycine System
AMI 56.0 56.7 71.1
RHF/6-31G*//AMl 64.2 66.4 78.6
MP2/6-31G*//AMl 43.4 40.5 56.6 52.7 46.3 52.1 52.7 49.4 65.6 RHF/ST0-3G//A 52.5 79.4 61.1
RHF/6-31G*//A 58.2 54.5 72.6
MP2/6-31G*//A 40.5 40.2 52.8 44.7 41.7 40.4 47.7 48.1 61.2
= ST0-3G basis set, C = 6-3IG^ basis set. Note that 6-3IG^ and 6-31G(d) are used interchangeably, as are 6-31G and 6-31 G(d,p). AH is at OK and AG is at 298K. ^'Values are from Reference 9(a).

Table Vn. Energetics for peptide bond formation (kcal/mol). See Table VI for further explanation.
Level of theory AE2 AH2 AG2 AE4 AH4 AG4 AE7 AHv AG? AEg AH8 AGs Model System
AMI -5.3 -5.1 0.7
RHF/6-31G*//AMl 3.9 5.1 7.9
RHF/6-31G**//AMl 2.4 3.6 5.8
RHF/STO-3G//A -26.1 -25.8 12.0
RHF/6-31G*//A 6.3 6.1 2.7
RHF/6-31G*//C 5.6 5.2 3.3
RHF/6-31G**//C 4.0 3.6 1.3
RHF/6-311G**//C 8.4 7.9 4.8
MP2/6-31G*//AMl 5.0 0.8 14.3 2.7 2.0 15.4 5.6 -4.3 -5.6
MP2/6-31G**//AMl 3.5 3.6 4.3
MP2/STO-3G//Ab -1.5 0.0
MP2/6-31G*//A 6.0 12.0 20.1 6.0 11.9 20.1 3.4 -2.7 -3.8
MP2/6-31G**//C 2.9 2.7 1.3
MP4/6-31G**//C 3.8 3.7 2.0
MP2/6-3I1G //C 2.7 6.9 17.0 2.5 6.7 16.8 1.1 -2.3 -2.2
MP4/6-311G //C 3.7 7.9 18.0 3.5 7.7 17.8 1.9 -3.1 -3.0 MP2/6-31G*//MP2/C 5.0 4.9 2.9
Glycylglycine System AMI 2.8 3.0 8.1 6.2
RHF/6-31G*//AMl 11.6 10.8 9.3 3.3
MP2/6-31G*//AMl 4.0 6.5 17.3 3.2 5.6 16.5 4.0 4.4 6.0 -0.8 -0.3 -3.0 RHF/STO-3G//A -23.7 -22.3 10.0 12.8
RHF/6-31G*//A 12.3 10.9 5.2 11.1
MP2/6-31G*//A 3.6 7.0 20.6 2.6 5.3 19.6 2.0 -1.2 2.0 6.6 3.6 6.4

179
H
f
o—
XS2 NHR' H TSl c:: OH
AE AE
TS4
AE2I Jae, J a e .
INTl INT2 f R O R OH
N H + R OH N C R +H,0
N C
OH
Scheme 1. The stepwise mechanism for peptide bond formation.

180
H r . - o
H" I t ' I I
::'"R
H TS3 O
AE,
AE7 (AEg for R=CH2NH2 and
R'=CH2C00H)^' I '
NH + R C OH
Scheme 2. Concerted mechanism for peptide bond formation.

181
gWOfsW ••;'.• •^.v \%"S«S*S«J'
[0.966]
Figure 1. RHF/STO-3G (AMI) optimized (within the point group) parameters for the glycine conformation used as reactant for (7). Bond lengths are in ^gstroms and bond angles are in degrees. The shading scheme for N, C, O, and H are used in subsequent figures. Experimental values are given in brackets.

182
a. (116.4) 109.0
1.0 (1.000)
.218 (1.246)
118.8 (124.0) (120.0)
1.447 (1.389)
D(04-CC-N^)= 15.7 (31.9) D(H9-NC-03) =-14.6 (-10.8) D(03-CC-Ni5) =-12.6 (1.1)
b.
1.473 (1.389)
(121.4) (121.3) 115.7 122.6 1.218(1.246)
11.6 (117.8) (116.9)
1.443 (1.443) 1.027
(0.995)
D(04-CC-N4) =-0.7 (-13.2) D(H9-NC-03) = -149.7 (-166.0) D(03-CC-N,5) =-4.2 (-1.1)
Figure 2. RHF/ST0-3G (AMI) optimized parameters for the glycyl glycine product produced by the a) stepwise and b) concerted mechanism of (7). Bond lengths are in angstroms and bond angles are in degrees.

183
Figure 3. Tiie RHF/ST0-3G optimized structure of TSl in the stepwise mechanism of (7).
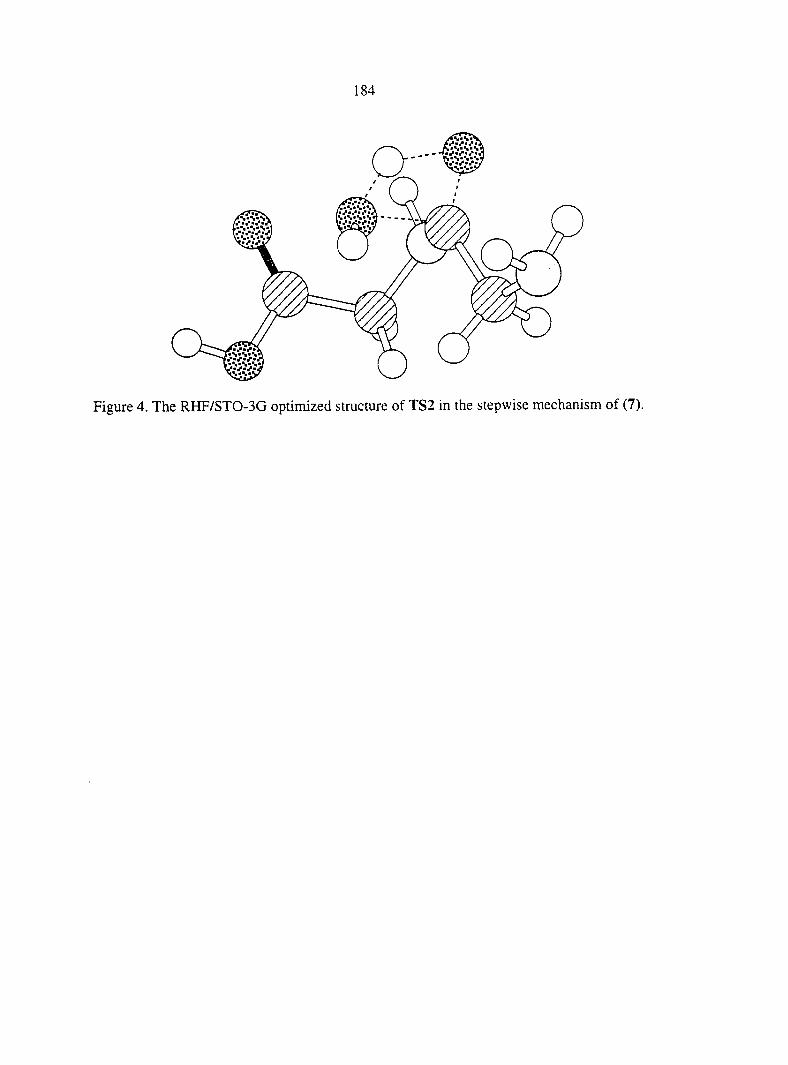
184
Figure 4. The RHF/ST0-3G optimized structure of TS2 in the stepwise mechanism of (7).

185
Figure 5. The RHF/ST0-3G optimized structure of TS3 in the concerted mechanism of (7).

186
Figure 6. The RHF/ST0-3G optimized structure of INT2 in the stepwise mechanism of (7).

187
1.334 C0.953«), O3
H. 1.322(1.323')
1.211 (1.007");
4 H
/ 2 I.5JS / (1.307")
• <^••'""1H
O' H
I
Figure 7. 'l lie tour localize(d RHF/6-31G(d) MOs involved in bond making/breaking in TSl of (5) (a-d) and the total density in the N-H-0 plane (f). Plots a (N-H bond LMO) and b (predominantly O lone pair) use the N-H-O plane while plots c (N-C bond LMO) and d (C-0 bond LMO) use the N-C-0 plane. Figure 7e schematically represents the orientation of the molecule, the RHF/6-31G* bond lengths in angstroms, and related parameters from g) formic acid and h) glycine zwitter-ion^^ in parenthesis. All plots in this and the subsequent two figures have maximum contour lines of 1 Bohr"^'^ and increments of 0.05 Bohr'^^^.

188
Figure 8. Plots similar to those in Figure 7 for TS2, but with the following changes. The planes are O-H-0 for the top two plot (a = O3-H4 bond LMO; b = predominantly O5 lone pair) and the density and O-C-0 for the middle two plots (c = O3-C bond LMO; d = predominantly O5 lone pair). The superscript "g" now referers to formic acid while "h" refers to formamide.

189
1.378 ' (0.953*)^, O
1.135 (1.007^
Figure 9. Plots similar to tliose in Figure 7 for TS3, except lira plot d represents an i,iviu that is predominantly O3 lone pair.

190
b.
Figure 10. Schematic representation of the RHF/6-31G(d) (bold), RHF/ST0-3G (solid), and AMI {dashed PES for a) the stepwise and b) concerted mechanism.

191
CHAPTER 7. ON THE NUMBER OF WATER MOLECULES NECESSARY TO
STABILIZE THE GLYCINE ZWITTERION
A paper published in and reprinted with permission from
Journal of the American Chemical Society, 1995, 117, 8159-8170
Copyright 1995 American Chemical Society
Jan H. Jensen and Mark S. Gordon
Abstract
A thorough ab initio study of how the addition of successive water molecules shifts
the gas phase-zwitterion neutral equilibrium of the amino acid glycine towards that of the
solution phase is presented. Of particular interest is the number of water molecules necessary
to stabilize the zwitterion, and how the solvent effects conformational preference. It is found
that two water molecules can stabilize the glycine zwitterion; that is, give rise to a potential
energy minimum with at least one vibrational level. The results are analyzed and explained
using localized charge distributions.
I. Introduction
Elucidating the effect of solvent on structure and reactivity at the molecular level
poses a formidable challenge to experiment and theory alike. Much progress has been made
in this area' but "a set of unifying principles describing chemical dynamics in l iqu ids"
remains elusive. However, it is generally agreed upon that a clear understanding will involve
both solute and solvent dynamics and their coupling, rather than simply solute dynamics
under the influence of some representation of the solvent. These molecular solvent effects
are not well understood. The zwitterionic-neutral equilibrium of the amino acid glycine,

192
+nh3ch2coo- nh2ch2cooh.
provides a good test case for the study of such effects since it shifts markedly in favor of the
zwitterionic form upon aqueous solvation.
As discussed in Section IIIA, the gas phase structure of glycine is fairly well
understood. The zwitterionic form of glycine does not appear to exist in the gas phase.
The neutral potential energy surface (PES) of glycine has been studied both theoretically^
and experimentally.^
At room temperature the bulk aqueous form of glycine is predominantly zwitterionic
for pH=2-10 (ref. 7) with the zwitterionic form favored by a free energy and enthalpy of 7.2
and 10.3 kcal/mol,^ respectively. Various NMR relaxation techniques have been used to
study the kinetics of intramolecular proton transfer^ in aqueous solution and all yielded a free
energy of activation of about 14.3 kcal/mol for proton transfer. One study^^'^^ determined the
rate constant at several temperatures and derived enthalpy and -TAS contributions to the free
energy of activation of -0.2 and 14.6 kcal/mol, respectively! It should be noted that the NMR
studies are unable to distinguish between intramolecular and water-catalyzed proton transfer
mechanisms and this can complicate the thermodynamic interpretation of the rate constant if
both are important. Other experimental data^^ include a heat of solvation of -19.2 kcal/mol.
calculated as the difference in the heat of solution and sublimation of solid glycine.
If the gas phase structure of glycine is defined as a "reactant" and the aqueous
structure as a "product", a "reaction path" can be traced by adding successive water
molecules to the reactant until the product is reached. Key points along this reaction path are
1) the point at which the zwitterion form becomes a local minimum and 2) the point at which
the neutral and zwitterion forms become isoenergetic. as illustrated in Scheme 1. The
research described in this paper concerns itself with the first point. Important questions to be

193
answered in this regards are as follows: 1) Why is there no barrier to proton transfer in the
gas phase? 2) How does the solvent induce a barrier and thus stabilize the zwitterion? 3)
Can the solvent participate directly in the proton transfer and if so, how does this mechanism
differ from the gas phase mechanism?
Several theoretical studies on the solvation of glycine have been published.
Bonaccorsi et al.^' used a continuum reaction field method, and obtained a zwitterionic-
neutral free energy difference of 5.6 kcal/mol and a heat of solvation of -19.5 kcal/mol; in
both cases the 4-3IG basis set was employed. Rzepa and Yi 1- combined the continuum and
super-molecule approach in a semiempirical study on glycine-water clusters. The remaining,
discrete, solvation studies on glycine can be divided into two groups. One is Monte Carlo
studies employing classical potentials and a large number of water molecules. The other is
quantum mechanical studies on relatively small glycine-water clusters.'^-l'^-'^ The two
studies that are particularly relevant to this study report SCF calculations, using split valence
basis sets, on one water molecule complexed with zwitterionic^ and neutraU^ glycine, and
will be discussed in the appropriate sections of this paper.
11. Computational Methodology
1. Geometries. Molecular geometries were calculated at the restricted Hartree-Fock
(RHP) level of theory using Dunning's DZP'^ [DZ(d,p)] basis set. For reasons explained
later, geometries on the PES of gas phase glycine were calculated at the RHF/6-3 lG(d)'^ (6-
31G*) level of theory. Some other preliminary geometry optimizations were also performed
at this level of theory. The nature of all stationary points were verified by calculating the
eigenvalues of the matrix of energy-second derivatives (Hessian). Stationary points with n
negative eigenvalues can follow n downhill directions that lead to lower energy structures, so
that minima and transition states have 0 and 1 negative eigenvalues, respectively. Upon
conversion to frequencies, the unsealed eigenvalues are used to calculate zero point

194
vibrational energies and free energies at 298K using the harmonic oscillator-rigid rotor
approximation.
2. IRCs. The nature of all RHF/DZP transition states were verified by tracing the
intrinsic reaction coordinate (IRC) from the transition state to the two lower energy structures
it connects, by using the second order Gonzales-Schlegel integration method.'^ An IRC is
defined as the minimum energy path from the transition state to the reactants and products,
traced in mass-weighted Cartesian coordinates. It is typically depicted as a plot of the total
energy vs. "5", the root mean square displacement of all atoms from the previous integration
point. Thus, this reaction coordinate contains solute as well as solvent coordinates.
3. Energies and Convergence. The relative energies of most stationary points were
evaluated at the MP2/DZP-i~i-//RHF/DZP level of theory, where A//B denotes an energy
calculation at the "A" level of theory evaluated at the "B" geometries. MP2 denotes second
order M0ller-Plesset perturbation theory,20 and DZP-f-f- denotes the DZP basis set augmented
by diffuse s and sp functions on hydrogens and heavier elements, respectively.2' Two
additional sets of MP2 calculations were performed on the glycine(H20) system (to be
described in detail in Section IIIC) to test how well the DZP-i~i- basis set is converged. The
glycine(H20) system was chosen over the gas phase glycine system since it also contains
intermolecular hydrogen bonds. One MP2 set employs the TZP-h--- basis set to test the
importance of triple-i^ valence basis sets. The other MP2 set employs the aug-cc-pDZV23
basis set, which includes diffuse 5 and p functions on the hydrogen atoms, and diffuse s, p,
and d functions on the heavier atoms. This basis set has been shown to give essentially
converged results for the water dimer.24 Additionally, a set of MP425/DZP+-I- calculations
were performed to monitor the convergence of the perturbation expansion. Table I lists the
results. As can be seen, the MP2/DZP-t~)- energy of both the transition state and the neutral
structure, relative to the zwitterion, is within 0.6 kcal/mol of the higher level results.

195
4. Energy Decomposition. The theory of localized charge distributions-^ is used to
analyze the total energy, and is summarized here. A localized charge distribution (LCD)
consists of a localized molecular orbital (LMO,i//,) plus its assigned local nuclear charge
distribution [Z,(A) for all atoms A]. A charge distribution of a neutral molecule consisting of
2N electrons in N orbitals, can be partitioned into N neutral LCDs by setting
Z i ( A ) = 2 if y / i is an inner-shell or a lone-pair LMO predominantly
where is the nuclear charge on atom A. Consider the BH molecule as an example.
Localizing the electronic wave function yields three doubly occupied LMOs: an inner-shell, a
lone pair, and a bond orbital. The first two are predominantly localized on one atom (B),
whereas the bond orbital is localized on both atoms (B and H). These three orbitals can now
be used to define their corresponding localized nuclear charge distributions: inner-shell and
lone-pair LMOs are assigned +2 charges positioned at the one atom on which they are
localized, whereas the bond LMOs are assigned -i-l charges on each of the two atoms on
which they are localized:
localized on atom A,
1 if i//,- is a bond LMO predominantly localized on atom A
and its bonded partner,
0 otherwise.
( 1 )
The total nuclear charge on a given atom ( A ) must be preserved,
N
(2)

196
+2 +2 +1 +1
These three types of localized charge distributions can be used to describe most, but not all,
charge distributions. A charge distribution with a formal net charge, for example, requires
special attention and is addressed in later sections.
Once the are defined, h is possible to partition any molecular expectation
value of interest into localized contributions. Of prime interest, of course, is the total
molecular SCF energy, For a system of N localized orbitals.
The first term is the idnetic energy of the electrons in LMO The second term contains the
internal potential energy of LCD i plus the interaction potential energy between LCD i and
all other LCDs.-^ The MP2 energy correction [£(-)] to the RHF energy can be written as the
sum of pair correlation energies of doubly occupied spatial orbitals,
where each e|^"Ms the correlation energy associated with a pair of electrons in LMO i and
j 26(h),27 fhe |;otal energy + E^^^) can thus be written as
(3)
(4)
(5)

197
5. Calcuiational Details. Most calculations were performed with the quantum
chemistry code GAMESS.-® Many of the calculations were performed in parallel on a 16
node iPSC/'860 Paragon, and a local workstation cluster. Some of the MP2 and analytic
Hessian calculations were performed with the HONDO program.The MP4 calculations
were performed using GAUSSIAN92.30
The LMOs used in the LCD analyses were obtained by using the energy localization
scheme due to Edmiston and Ruedenberg.^' This algorithm yields localized molecular
orbitals by minimizing interorbital repulsions.
III. Results
A. Nomenclature and Overview
Structures are named as follows. Zwitterionic, transition state, and neutral structures
are designated by Z, TS, and N, respectively. These labels are followed by the number 0,1.
or 2 indicating the number of water molecules that are associated with the glycine molecule.
If necessary, the structures are distinguished from each other by appending the letters a, b,
etc., as they are introduced. For example, structure Z2b is the second dihydrated zwitterionic
structure discussed in this paper.
Relative classical energies, enthalpies at OK, and Gibbs free energies at 298K are
denoted by AE, AHQ, and AG298, respectively. The classical binding energy of a
glycine(H20)n complex is defined as:
AEb = E[Gly#] + /2E[H20] - E[complex] (6)
where E[Gly#] is the energy of an isolated glycine molecule whose geometry is fixed at that
of the glycine(H20)n complex. We term this distortion energy the "intrinsic glycine energy."

198
EfHoO] is the energy of a water molecule whose structure has been optimized, which is a
constant. The change in the binding energy,
AAEb= AE[Gly#] - AE. (7)
can be used, together with the change in the intrinsic energy, to express the change in the
total energy,
AE = AE[Gly#] - ZlAEb- (8)
The relative intrinsic energy provides information about how the glycine geometry is
distorted by the solvent.
Key geometric parameters (calculated using RHF/6-31G* for gas phase structures and
RHF/DZP for solvated structures) of the structures involved in proton transfer on the gas
phase, mono-, and dihydrated glycine potential energy are displayed in Figures 1, 3, and 5,
respectively. Table 11 lists additional structural information, and Table III lists the associated
relative energies, and energy components, of these stationary points, based on MP2/DZP++
single point calculations. The associated IRCs are shown in Figure 2. Additional mono- and
dihydrated neutral structures and energetics are presented in Figures 4 and 6. and Table IV,
respectively. The key finding, to be discussed in detail in the following sections, is that the
zwitterion is not a minimum on the glycine(H20)n potential energy surface until n=2.
B. Gas Phase Glycine
1. Zwitterion PES. As mentioned in the Introduction, the zwitterionic form of
glycine does not exist in the gas phase. However, calculations on the isolated zwitterion
provide valuable information about the intrinsic chemistry of this species that is necessary for
a direct evaluation of solvent effects. Such calculations are possible since some basis sets.

199
notably ones without p-type polarization functions on the hydrogens, predict a shallow
minimum on the zwitterionic PES.
A careful study of the RHF/6-31+G* conformational zwitterion PES by Ding and
Krogh-Jespersen- suggests that there is only one minimum on this surface. The RHF/6-31G*
Cs optimized structure of this minimum (ZO) is shown in Figure la. (A RHF/DZP geometr)'
optimization starting from this geometry resulted in proton transfer to give a neutral
structure.) The most important feature of ZO is an unusually short intramolecular hydrogen
bond distance of 1.55A, with an associated NH bond that is 0.071 A longer than the two other
NH bonds. The CO bond cis to the nh3 group is significantly (0.045A) longer than the trans
CO bond, indicating more single bond character for the former bond (Table II). This is
presumably due to the accumulation of negative charge on the cis oxygen due to the
neighboring positive nh3 group, and its participation in the intramolecular hydrogen bond.
2. Proton Transfer Transition State. The RHF/6-31G* transition state for
intramolecular proton transfer is shown in Figure lb. The structure is very similar to ZO: the
breaking NH bond is lengthened by a mere 0.027A while the H---0 distance has shortened by
0.077A. The barrier at this level of theory is minuscule (0.02 kcal/mol), and disappears when
vibrational effects and electron correlation (MP2/DZP++) is added (Table III). Figure 2a
shows a plot of MP2/DZP++ energies along the RHF/6-31G* IRC. Clearly, at this level of
theory the zwitterionic minimum does not exist.
3. Neutral PES., The IRC in Figure 2a leads to the neutral stnicture NOa shown in
Figure Ic This structure also has an intramolecular hydrogen bond, albeit much weaker than
in ZO based on the hydrogen bonding distance of 1.97A. The proton transfer reaction in
Figure 1 is exothermic by 17.0 kcal/mol on the classical potential energy surface. Addition
of vibrational zero point corrections (to give AHQ) and of entropy effects (to give AG298)
raises this number to -16.4 and -16.0 kcal/mol, respectively (see Table HI). The neutral PES
of gas phase glycine has been studied extensively and it is known^ that NOb,

200
NOb (Q)
and not NOa, is the global minimum. At the RHF/6-31G* level of theory NOa is a transition
state connecting two isoenergetic Cy minima on the electronic PES. However, the first
vibrational level in this double well is higher in energy than the barrier connecting the two
wells, and NOa appears to be a minimum on the HQ surface.At the MP2/DZP++//-
RHF/6-31G* level of theory, NOa is 1.0 kcal/mol higher in energy than NOb. Adding HQ or
G298 energy corrections increases this number to 1.1 and 1.8 kcal/mol, respectively, as
shown in Table III. Thus the overall exothermicity of the Z —> N proton transfer reaction in
the gas phase is 18.0 kcal/mol on the classical potential energy surface.
C. GIycine(H20)
1. Zwitterion PES. The monohydrated zwitterion surface was initially explored at
the RHF/6-31G* level of theory to select candidates for geometry optimizations at the
RHF/DZP level of theory. Since both glycine and water have planes of symmetry, C5
structures are possible. Thirteen Q stationary points were considered first, and are shown in
Scheme 2. Of these Q structures, three have the water hydrogen bonded to the COO" group
(i-iii), four to the nh3+ group (v-viii), and six to both groups (ix-xiv). Structures iii and x
had been located previously by Langlet et al."^
Structure i appears to be the only Q minimum on the RHF/6-3IG* zwitterion PES.
A RHF/DZP geometry optimization initiated from this RHF/6-3 IG* geometry' (and hessian)
leads to a neutral structure, so i does not appear to be a minimum on the RHF/DZP zwitterion

201
PES. Structure ii has one imaginary frequency with an a" normal mode corresponding to
rotation about the C-N bond and is a transition state for NH3'^ rotation in i. Structure iii has a
very small (14/ cm"') imaginary frequency. Following the a" mode associated with this
frequency lead to the Cj structure iv which is a minimum on the RHF/6-31G* PES but only
very slightly lower in energy. However, a search for the corresponding RHF/DZP minimum,
using the same procedure as for i, led to a neutral structure.
All the remaining structures, v-xiv, have 1-3 imaginar>' frequencies with associated a"
modes. Structures with water hydrogens out of the plane of symmetry are invariably higher
in energy than structures with in-plane water hydrogens for a given water-zwitterion
arrangement. The former structures invariably have an imaginary frequency with a mode that
is predominantly water rotation — a motion that leads to the latter, lower energy, structures.
All other distortions, to C/ geometries, lead to the 6-3IG* equivalent of structure Zla shown
in Figure 3a upon optimization of the geometry. Additional geometry searches led to
structure Zlb, shown in Figure 3b. Equivalent structures, verified as minima, are also found
on the RHF/DZP PES.
The two zwitterionic minima found on the RHF/DZP monohydrated glycine surface
(Figure 3) both have the water molecule bridging the COO" and NHs"*" groups. The two
structures differ mainly in which oxygen of the COO" group the water molecule is hydrogen
bonded to: for Zla it is the oxygen cis to the nitrogen while for Zlb it is the trans oxygen.
The binding energies [equation (6)] for Zla and Zlb are essentially identical (18.3 and 18.4
kcaUmoI, respectively; see Table IV). Both structures Zla and Zlb retain the intramolecular
hydrogen bond found in the glycine molecule, though the hydrogen bond length in Zla
(Zlb) is longer by 0.4lA (0.37A) relative to ZO. The water-glycine hydrogen bond
arrangement introduces only a 0.5° deviation from planarity in the heavy-atom frame work of
glycine for Zla, but a 36.5° deviation for Zlb (Table II). Since ZO is the only "minimum"
on the zwitterionic gas phase PES, any deviation from planarity will lead to an increase in the

202
intrinsic energy. Therefore, the intrinsic glycine energy of Zlb is higher than that for Zla
(by 1.4 kcal/mol, see Table III). The total energy of Zlb relative to Zla of 1.3 kcal/mol can
then be attributed to the higher intrinsic glycine energy of Zlb (Table III).
Since Zla and Zlb are essentially identical structures only the lower energy structure
Zla is considered as a starting point for proton transfer to form a neutral minimum.
2. Intramolecular Proton Transfer Transition State. The most direct path to a
neutral structure is the intramolecular transfer of the proton in the intramolecular hydrogen
bond. A RHF/DZP transition state (TSla) for such a reaction is shown in Figure 3c. The
monohydrated transition state is quite similar to the gas phase analog, but occurs slightly later
on the reaction path.^^ j^e largest structural change on going from Zla to TSla is the
shortening of the intramolecular OH distance by 0.59A, while the associated NH bond is
lengthened by the comparatively smaller amount of 0.128A, These changes in the glycine
structure effect a 0.26-0.30A lengthening of the two water-glycine hydrogen bonds.
At the RHF/DZP level of theory the proton transfer barrier is 1.5 kcal/mol. This
occurs because the decrease in the binding energy in the transition state (5.3 kcal/mol) is
larger than the decrease in the intrinsic glycine energy (3.7 kcal/mol), relative to Zla.
However, the inclusion of electron correlation (MP2/DZP++ single point energies) lowers
AE[GlyTr] to -7.3 kcal/mol and leaves the change in binding energy essentially unchanged
(see Table III). Therefore there is no barrier at the correlated level. A similar energy
analysis of the entire IRC, leading from Zla to the neutral structure Nla (discussed in
Section niC4) via TSla, is shown in Figure 2b. This shows that the energy lowering from
the internal proton transfer in glycine dominates the energy increase due to the weakening of
the water-glycine hydrogen bonds throughout the reaction. Therefore it appears that Zla is
not a true minimum.
As an additional check, the RHF/DZP structure was used as an initial guess for a
MP2/DZP geometry optimization for which the N-H bond was constrained to its RHF value.

203
The resulting partially optimized MP2/DZP structure was then fully optimized in a second
step by removing the N-H distance constraint. This full optimization led to a neutral glycine
structure.
It thus appears that the zwitterionic form is not a minimum on the monohydrated
glycine PES.
3. Water-Assisted Proton Transfer Transition State. Water-assisted proton
transfer presents an alternative, indirect, path for the formation of monohydrated neutral
glycine. While it was established in the previous section that Zla is a minimum on the
Hartree-Fock surface due to the lack of electron correlation in the structure optimization, the
study of water-assisted proton transfer initiated from this structure provides valuable
information about the intrinsic mechanism. This analysis then serves as a reference point for
more extensively hydrated systems in analogy to TSO.
The RHF/DZP transition state for the water-assisted proton transfer from Zla (TSlb)
is shown in Figure 3d. The breaking N-H bond is 0.168A longer than in Zla (0.036A longer
than in TSla), while the breaking water 0-H bond is longer in TSlb relative to Zla by
0.197A. The water molecule is pulled towards glycine, to make the two forming OH bonds
1.219A and 1.285A. In the process, the intramolecular hydrogen bond is broken [the
(N)H—O bond length is stretched by lA].
With the inclusion of correlation TSlb is 3.6 kcal/mol above Zla. However, the IRC
initiated from TSlb (Figure 2c) shows that at this correlated level the energy maximum
occurs slightly before TSlb resulting in a 4.8 kcal/mol "barrier". The inclusion of
vibrational and temperature effects lowers the energy difference by 3.4-4.6 kcal/mol, which
makes TSlb roughly isoenergetic with Zla.
4. Neutral PES. The two proton transfer paths discussed in the previous two sections
lead to two different neutral minima on the monohydrated PES of glycine. The
intramolecular proton transfer IRC shown in Figure 2b leads to the neutral structure Nla

204
shown in Figure 3e. The two glycine-water hydrogen bonds in Zla have lengthened by more
than 0.5A. However, the binding energy has only decreased by 10.0 kcal/mol relative to the
zwitterion (see Table III), from 18.3 kcal/mol to 8.3 kcal/mol. The glycine structure itself
retains the intramolecular hydrogen bond but the bond length is increased by 0.11A relative
to the zwitterion. The proton transfer decreases the intrinsic glycine energy by 21.7 kcal/mol.
Combined with the 10 kcal/mol loss of water binding energy this leads to an overall
exothermicity of 11.8 kcal/mol. The addition of vibrational effects increases the
exothermicity further by 1-2 kcal/mol (see Table III).
The water-assisted proton transfer IRC shown in Figure 2c leads to the neutral
structure Nib shown in Figure 3f. Judging from the inter-atomic distances, this structure has
strong intermolecular hydrogen bonds, especially between the water and the COOH group.
Consequently the binding energy has only decreased by 6.7 kcal/mol upon proton transfer.
The glycine structure Nib has no intramolecular hydrogen bond, and the heavy atom
framework deviates from planarity by 44.4° (Table II). The intrinsic energy is 3.6 kcal/mol
higher than for Nla, but since the binding energy is larger for Nib, the overall exothermicity
for Zla Nib is 10.4 kcal/mol, only slightly less than that for Zla Nla.
In a previous study of the PES of monohydrated neutral glycine, Stevens and Basch'^
identified five stationary points with Q symmetry. These five structures were re-optimized
without symmetry constraints at the RHF/DZP level of theory for comparison with Nla and
Nib. The structures (Nlc-Nlg) are shown in Figure 4, and the relative energetics are
presented in Table IV. All but one structure proved to be lower in energy than Nla and Nib.
The two lowest energy conformers (Nlc and Nld) both have the water molecule bound to the
COOH group by about 11 kcal/mol. Structure Nlc is lower in energy (by 1.2 kcal/mol) than
Nld due to its lower intrinsic energy (1.6 kcal/mol). The next two structures in Figure 4
have the water molecule associated with both functional groups. Structure Nle has an
intermolecular hydrogen bond to the nitrogen plus a weak interaction with the C=0 oxygen,

205
while Nlf has two intermolecular hydrogen bonds: one to the C=0 oxygen and another to
one of the NH hydrogens. The binding energies of these two structures bracket that of Nla
which also has a bridging water molecule. Together with the relative internal glycine
energies this results in total energies for Nle, Nlf, and Nla of 3.4-3.7 kcal/mol relative to the
global minimum Nlc. Structure Nig has the water molecule bound to the C=0 oxygen by
6.3 kcal/mol. This is the weakest binding energy of all the monohydrated glycine structures
considered here. The glycine structure resembles NOa and the difference in intrinsic energy
thus contributes one kcal/mol to the total relative energy of 5.4 kcal/mol. Structure Nib has
the largest binding energy of the neutral glycine structures on the monohydrated PES (11.7
kcal/mol). However, the internal geometry, which resembles NOa, lacks the intramolecular
hydrogen bond and the intrinsic glycine energy is large (5.8 kcal/mol) as a result. This leads
to a high net relative energy of 5.6 kcal/mol.
D. Glycme(H20)2
1. Zwitterion PES. The most promising candidates for minima on the dihydrated
zwitterionic surface were chosen based on the results in the previous section. Two such
candidates, which combine the water-glycine arrangements of Zla with i and iv from
Scheme 2, are shown here.
O iiiii^ H H
H H 0 N
O
\ /
H O H XV

206
A complete geometry optimization of structure xv led to Z2a shown in Figure 5a. A water
glycine-hydrogen bond associated with each water in xv has been broken to form a water-
water hydrogen bond in Z2a. Upon geometry optimization structure xvi is 6.1 kcal/mol
higher in energy than Z2a (AHo=5.8 and AG298=4.9 kcal/mol). Due to this relatively high
energy xvi is not considered further. Another (Cj) structure, Z2b (Figure 5b), has both water
molecules in a bridging arrangement similar to Zla. A similar Q structure in which the in-
plane NH3+ hydrogen points towards the COO" group is a transition state to rotation about
the CN bond in Z2b. A third structure, Z2c (Figure 5c), has a similar bridging arrangement
of the water molecules except that they are hydrogen bonded to different oxygens in the
COO" group, which is perpendicular to the nh3+ group. The geometry of Z2c is slightly
distorted from C5 symmetry since the Q structure has a small (23/ cm-') imaginary
frequency with an associated a" normal mode.
The relative energetics for Z2a-c are presented in Table IV. The three structures are
within 1.3 kcal/mol in total relative energy (the inclusion of vibrational and temperature
effects increases that value by 1.1 kcal/mol); Z2a is the lowest, followed by Z2b which is 0.7
kcal/mol higher. The overall relative energies follow the same trend as the intrinsic glycine
energies, although the energy range of the latter spans 11 kcal/mol! Thus, just two water
molecules can introduce a significant distortion of the structure of glycine without a large
increase in overall energy. This is because the distortion of the glycine molecule affords a
stronger interaction with the two water molecules as is evidenced by the binding energies
(Table IV). Structures Z2b and Z2c have binding energies that are 4,3 and 9.6 kcal/mol
larger than that of Z2a.
Since structures Z2a-c are fairly close in energy and quite different in structure, all
three were selected as starting points for proton transfer to form neutral structures.
2. Intramolecular Proton Transfer Transition State. Of the three structures, Z2a-
c, only Z2a has an intramolecular hydrogen bond and can transfer a proton intra-molecularly.

207
The transition state for such a reaction (TS2a) is shown in Figure 5d, The glycine geometr>-
is similar to TSla: the intramolecular OH distance is shorter by 0.54A, while the associated
NH bond is longer by 0.151 A, so TS2a is a slightly later^- transition state than TSla. The
lengthenings of the water-glycine hydrogen bonds relative to Z2a are only 0.12-0. ISA, less
than half that for TSla relative to Zla.
The RHF/DZP barrier is 2.8 kcal/mol, but the inclusion of electron correlation
(MP2/DZP++ single point energies) makes the transition state energy 0.6 kcal/mol lower than
the energy of the zwitterion (Table III). Just as for TSla, electron correlation lowers the
relative intrinsic glycine energy from -3.5 to -7.0 kcal/mol while the change in binding
energy is well described by RHF/DZP (AAF,b=-6.3 and -6.4 kcal/mol for RHF/DZP and
MP2/DZP++, respectively). Figure 2d shows that when MP2/DZP+-(- electron correlation is
added, the intrinsic glycine energy decrease is larger in magnitude than the decrease in the
binding energy along the entire RHF/DZP IRC. In addition, vibrational effects decrease the
transition state energy further, by 3 kcal/mol, relative to the zwitterion. Thus, Z2a does not
appear to be a true minimum.
3. Water-Assisted Proton Transfer Transition States. Neither Z2b or Z2c have
an intramolecular hydrogen bond, so proton transfer must be assisted by one of the water
molecules. Transition states for the water-assisted proton transfer initiated from Z2b and
Z2c (TS2b and TS2c) are shown in Figure 5e and f, respectively. The two transition states
are very similar since their heavy atom frameworks have similar deviations from planarity
(32.7-58.4°, Table II). The covalent bonds that are broken or formed are within 0.01 A of one
another in the two transition states. The breaking N-H bond is 0.03A shorter, but the
breaking 0-H bond is 0.07A longer, in both TS2b and TS2c compared to TSlb and so it is
not possible to say that the latter transition state is later or earlier than the two former
transition states. The water-glycine hydrogen bonds are elongated (by 0.20-0.42A) for both
TS2b and TS2c relative to their respective minima.

208
The two barriers associated with TS2b and TS2c as well as their binding- and
intrinsic energy components are listed in Table III. In order to use the glycine(H20) results
as a reference, the intrinsic energy is taken to be that of the glycine-water complex
corresponding to the Zla Nib water assisted reaction discussed previously, and the
binding energy is that of the other, "spectator", water molecule. The relative intrinsic
energies of both transition states TS2b and TS2c are lower than the 3.6 kcal/mol classical
barrier height for Zla Nib; in fact the intrinsic energy of TS2c is lower (by 1.3 kcal/mol)
than that of Z2c. The overall barriers of 6.3 and 4.4 kcal/mol are mainly due to the 4.7 and
5.6 kcal/mol decrease in the binding energy for TS2b and TS2c relative to Z2b and Z2c,
respectively. The relative contributions of AAEb and AE[Gly#] to the total relative energy
along the entire IRC connecting Z2b with N2b are shown in Figure 2e. Figure 2e reveals
that the relative intrinsic energy reaches a maximum shortly before 5=0, just as for Zla —>
Nib (Figure 2c), after which it falls below the decrease in interaction energy. The interaction
energy changes most rapidly around the RHF transition state region, and as a result the
MP2/DZP++ and RHF/DZP energy maxima coincide (the latter occurs at s=0 by definition).
The inclusion of vibrational effects lower the electronic barrier heights by 4-5 kcal/mol. so
that the free energy barrier for Z2b —> N2b is 1.9 kcal/mol at 298K. Structure Z2b thus
appears to be a true zwitterionic minimum. Structure Z2c does not appear to be a stable
minimum when vibrational effects are added (see AHQ in Table III), but there is an entropic
stabilization (AG298) that provides a very slight net stability for this species.
4. Neutral PES. The three proton transfer paths discussed in the previous two
subsections lead to three different neutral minima on the dihydrated PES of glycine. The
intramolecular proton transfer IRC shown in Figure 2d leads to neutral structure N2a shown
in Figure 5g. The intermolecular hydrogen bond distances have increased by 0.11-0.47A
relative to the zwitterion and the binding energy has decreased by 13.1 kcal/mol as a result.
The change in the intrinsic energy of glycine is -20.7 kcal/mol, very similar to the

209
monohydrated value of -21.7 kcal/mol. The overall exothermicity is therefore 7.6 kcal/mol.
and is increased by 1.3 kcal/mol upon inclusion of vibrational effects.
The two water-assisted proton transfer reactions lead to nearly identical neutral
minima, N2b and N2c (Figure 5h and i). The intrinsic glycine-water energy difference of
N2b and N2c, relative to Z2b and Z2c, is -12.3 and -16.3 kcal/mol. respectively (Table III).
The latter is larger in magnitude mainly because the intrinsic energy of Z2c is 3.0 kcal/mol
higher than Z2b. Both are larger than the energy of Nib relative to Zla because the intrinsic
energies of both Z2b and Z2c are higher than that of Zla. The total relative energy of N2b
of -3.8 kcal/mol makes Z2b —> N2b the least exothermic reaction considered in this study.
Vibrational effects increase the exothermicity to 5-6 kcal/mol. The reaction Z2c —> N2c has
an overall exothermicity of 5.5 kcal/mol, 6.7 and 7.3 kcal/mol for AE, AHQ, and AG298.
respectively.
Since the global energy minimum on the dihydrated PES clearly will be a neutral
structure the neutral region of the surface was explored further, and the results are shown in
Figure 6 and Table IV. Just as for the neutral monohydrated PES, the lowest energy
conformers (N2d and N2e) are found by hydrating the COOH group. Both structures
combine high binding energies and low intrinsic glycine energies which result in low total
relative energies; 0.0 and 1.0 for N2d and N2e, respectively. Structure N2a is 3.3 kcal/mol
higher in energy than N2d, due mostly to the lower binding energy of N2a. Structures N2b
and N2c prove to be relatively high energy conformers on the neutral PES. The relative
energy of N2b is 7.8 kcal/mol. This is due mainly to the relatively high intrinsic glycine
energy.
5. Conformational Interconversion of Zwitterionic Structures. Since both Z2a
and Z2c are apparently unstable with respect to proton transfer, the conformational
conversion of Z2b to Z2a or Z2c may represent alternative paths for proton transfer from
Z2b that are energetically more favorable. In order to address this question the

210
conformational transition states for Z2b Z2a (TS2d) and Z2b Z2c {TS2e) were
located and verified by calculating the pertinent IRCs. These two transition states are
presented in Figure 7, together with their energies relative to Z2b. On the electronic energy
surface the energy requirement for proton transfer in Z2b (6.3 kcal/mol) is comparable to
that for isomerization to Z2a (6.9 kcal/mol) and about twice as large as that for isomerization
to Z2c (3.1 kcal/mol). However once vibrational and temperature effects are included the
proton transfer barrier (1.9 kcal/mol) is lower than the barriers to conformational
interconversion: 5.6 and 3.6 kcal/mol for isomerization to Z2a and Z2c, respectively.
IV. Analysis
One of the goals of this study is to obtain a good understanding of mono- and
dihydrated glycine based on quantum mechanics. The binding energy analysis [equation (8)]
of mono- and dihydrated structures shows that their energies are dominated by the intrinsic
energy of glycine. Therefore, it is necessary to analyze the intrinsic energy of glycine
further. Three very basic questions present themselves immediately: 1) why is the neutral
structure lower in energy than the hypothetical zwitterionic structure? 2) why is there no
barrier to proton transfer in the gas phase? and 3) why is there a barrier to water-assisted
proton transfer? The theory of localized charge distributions,26 outlined in Section II, is used
to address these questions. The first two questions are considered in Section A and the third
question is considered in Section B
A. Analysis of the Gas Phase Proton Transfer IRC.
1. Nuclear Charge Partitioning. The energy localization of the glycine SCF
wavefunction yields 20 localized molecular orbitals (LMOs). In order to get a continuous
description of intermediate structures along the reaction path, reactants and products must be
described by identical sets of LCDs. One solution is to describe all structures along the IRC
as [nh2ch2coo" + H+]. To facilitate this, an additional "LCD", consisting only of a +1

211
charge at the position of the proton being transferred is defined (i.e. no LMO is associated
with this LCD). The 21 LCDs are divided into four "functional" groups:
(1) One is simply the proton LCD. (2) The NH2 group consists of the N lone pair, the two
NH bonds, the N core, and the CN bond LCD. (3) The CH2 group consists of the C core and
the two CH bond LCDs. (4) The COO" group consists of the remaining LCDs, including the
CC bond LCD. The formal -1 charge on the latter group is assigned for convenience to Ods
(the oxygen involved in the proton transfer) by assigning +5/3 to each of its three lone pair
LMOs, rather than the full +2 charge prescribed by equation (1).
2. Total Energy Partitioning. The energy associated with each functional group (X)
is given by,
NH.
£ ( X ) = x (9)
and the interaction energy between groups X and Y is
(10)

212
Using these definitions the total energy can be written as
£ = £ | + £ - , + f | _ - , + f " ^ ( 1 1 )
where
e, = E{NH,) + E{NH, \Hn =
£-, = E[COO') + E{COO' I //") = Ecooh (12)
e,_. = E{NH.\ COO-) = £,„,
e„ = E{CH.) + E(CH,\H*) + E{CH, \NH.) + E{CH, I COO') =
3. Origin of the ZO -> NOa Exothermicity. Figure 8a shows the four energy
components in equation (12) (left vertical axis) along the IRC, relative to their respective
values for the glycine anion nh2ch2coo". So, AE at the zwitterion structure corresponds
to the affinity for a proton at the nitrogen, while AE at the neutral end of the IRC corresponds
to the proton affinity at the oxygen. The difference in these two proton affinities is, of
course, the energy difference between the zwitterionic and neutral structures (17 kcal/mol).
The net AE may be analyzed in terms of the four components as follows; Aej evaluated at the
zwitterion structure represents the proton affinity of the NH2 group in the zwitte'.ion, while
Ae2 evaluated at the neutral structure represents the proton affinity of the COO" group in the
neutral species or the negative of the COOH gas phase acidity. The difference between these
two quantities (135 kcal/mol) is very similar to the analogous difference between ch3nh2
and ch3coo' (129 kcal/mol) and represents the strong preference of the proton for the
oxygen end of the molecule. This difference in proton affinities of the two functional groups

213
in glycine is the reason that the neutral structure is lower in energy than the zwitterionic
structure.This 135 kcal/mol preference is reduced to the net neutral-zwitterionic AE of 17
kcal/mol primarily due to the values of Aei at the neutral structure (-19 kcal/mol) compared
with Ae2 at the zwitterionic structure (-125 kcal/mol). These favor the zwitterion by a net
106 kcal/mol, but this is insufficient to overcome the relative proton affinities discussed
above.
4. Why There Is No Barrier. The two energies, Aeiand Ae2 taken along the entire
IRC (Figure 2a) represent the proton dissociation potentials used by, e.g., Scheiner^"^ to
analyze proton transfer reactions. Following Ref. 34(b) the proton transfer between NH2 and
COO" is decomposed into two separable but simultaneous processes: the dissociation of the
proton from NH2 (represented by Asi in Figure 8a) and its association with COO" (A£2)- The
sum of these two potentials is then a first approximation to the total energy of the proton
transfer. Figure 8b shows this approximate total energy, together with the two remaining
energy components and the true total energy AE, all relative to their respective values for the
zwitterion. It is clear from this figure that Aei-i-Ae2 is not a good approximation to the total
energy in this case, since this sum has a 10 kcal/mol barrier to proton transfer. This "barrier"
is more than cancelled by a concomitant 18 kcal/mol "minimum" in the interaction energy
Aei.2- Thus within the framework of the energy partitioning outlined above, the lack of a
barrier to proton transfer is due to an initial decrease in the interaction energy between the
NH2 and COO' groups as the proton is transferred. Careful examination of the individual
energy components reveals that the single largest contributor to this initial decrease is the
interaction between the lone pair LCD on N and one of the lone pairs on the oxygen involved
in proton transfer (Oc/5). A qualitative explanation in terms of LCD charge and dipolar
interactions, obtained at the RHF/DZP-i~i- level of theory, follows.

214
Figures 9a and b show the position of the centroids of electronic charge of the N [ N i p )
and Ocis lone pair LMOs ilpl-3) for the zwitterion and the structure at ^=0.6 bohr-amu'''-
(where Af'i.2 is a minimum), respectively. The arrows represent the dipole moments due to
the LCD charge distributions26(c).26(h),35 evaluated at each centroid. A close look at the
LMOs indicate that in the zwitterionic structure the Oc/s lone pairs are in an arrangement that
is intermediate between that of a CO single bond, with three similar lone pairs, and that of a
CO double bond with two lone pairs and two CO "banana" bonds. On going to the jy=0.6-
structure, where the Ods lone pairs are in an arrangement corresponding to a CO single
bond, the interaction of the N lone pair LCD and Ipl on Ods changes from slighdy repulsive
to attractive. The resulting decrease in the interaction energy of these two lone pairs is
largely responsible for the initial decrease of A£i.2 as the proton is transferred. For
interpretive purposes the interaction of the N and three Ods lone pairs may be approximated
by a charge-dipole plus a dipole-dipole interaction (the net -1/3 charge for each of the Ods
LCDs is placed at their centroids). Such an analysis of the Nlp-lpl interaction energy
ascribes the interaction energy lowering to a less repulsive charge-dipole and more attractive
dipoie-dipole interaction on going from ZO to the latter structure.
B. Analysis of the Water Assisted Proton Transfer IRC.
1. Partitioning of the Nuclear Charge And Total Energy. The structures along the
IRC (Figure 2c) are described in terms of [NH2CH2COO'+OH"-i-Hi++H2"^]. where Hi+ and
H2"'" are transferred to and from the OH" group, respectively. The glycine anion is divided
into three functional groups as described above, so there is a total of six functional groups.
The formal minus charge of the OH" group is assigned to the O atom as before by assigning a
+5/3 charge to each of the three O lone pairs.
The total energy is decomposed into a contribution from the proton transfer from the
NH2 group to the OH" group (£/) and the OH" group to the COO" group (£//). There is also an
interaction energy £/.//, and all contributions from the methylene group, £r:

215
E —£i + £ii + £i_ii+£^. (13)
Both £j and £// are composed of a term due to proton dissociation, association and an
interaction term,
and = £, + £4 + (14)
where
e, = E{NH.) + EiNH. \H;) = £^^. = E{COO') + EiCOO' \h:) = £cooh
£2=\E{OH-)+E{OH'\H;) = £„^o, £^=\EiOH-) + EiOH~ \H:) = £„^o, (15)
£,_2 = EiNH, 1 OH-) £3.^ = E{COO- I OH-)
Only one-half of the OH" energy is included in £2 and £4 to avoid double counting it. The
last two energy terms are given by
£,_„ = £(//; \h:)+EiNH. I coo-)+e{ n h . \ h : ) + Eicoa i h ;) ^ (16)
£^ = £(C//,) + ^E{CH. I Y) = £cfj, Y*CH.
2. Origin of the Barrier. Figure 10a shows a plot of A£/+A£//, A£/.// and /S.£r,
evaluated relative to their values in the zwitterion, along the water-assisted proton transfer
IRC shown in Figure 2c (see Figure 8b for comparison). It is evident from Figure 10a that
within this energy partitioning scheme the electronic energy barrier is due to 4£i-ii. The
combined energy from the two simultaneous proton transfer reactions, Af/-i-A£//, is dominated

216
by AE[ since Hi + is being transferred between the two groups with the largest difference in
proton affinity (NH2 and OH"). When the proton is transferred from NH2 to OH", Af/ is
always decreasing. Figure 10b shows a breakdown of Ae/.// into its four components
[equation (16)]. Clearly, the two most important contributions to A£/.// are the interactions
between the two protons and between the NH2 and COO" groups. The former energy is
simply a reflection of the change in proton-proton distance during the reaction, while the
behavior of the latter energy can be qualitatively explained in terms of (RHF/DZP-f-i-) LCD
net charges and dipoles, as explained below.
Figures 1 la and b show the location of the LMO centroids and the associated LCD
dipoles of the N and Ods lone pairs for Zla and TSlb, respectively. The large increase in
E(NH2\C00') is mainly a result of the increase in the interaction energy of Ipl and lp2 with
Nip. On going from Zla to TSlb there is a small clockwise rotation about the CN bond and
as a result the Nip dipole is pointed towards Ods- As a result, the charge-dipole interaction
between Nip and Ipl and lp2 changes from attractive to repulsive. In addition there is a small
counterclockwise rotation about the C-0 bond which makes the Nlp-lpl and Nlp-lp2 dipole-
dipole interactions more repulsive and less attractive, respectively. The charge-dipole and
dipole-dipole energy terms make roughly equal contributions to the energy increase.
V. Summary
The effect of solvation by one or two water molecules on two mechanisms for proton
transfer in the glycine zwitterion is considered in this study. It is found that two water
molecules stabilizes the glycine zwitterion, so that it appears to be a minimum on the
potential energy, adiabatic ground state, and 298K free energy surfaces. In particular:
1) One and two water molecules are not sufficient to stabilize zwitterionic structures
for which direct intramolecular proton transfer is possible, i.e. structures that contain

217
intramolecular hydrogen bonds. This is because of the decrease in the interaction energy
between the COO" and NH2 group during the initial stage of proton transfer.
2) Two water molecules give rise to structures with and without intramolecular
hydrogen bonds that are essentially isoenergetic.
3) Structures without intramolecular hydrogen bonds can transfer the proton via a
water molecule, and for one such structure (Z2b) the free energy barrier is 1.9 kcal/mol. This
structure is kinetically stable not only with respect to proton transfer but also to
conformational conversion to other dihydrated zwitterionic structures. It therefore may be
observable at low temperatures.
4) The water assisted proton transfer mechanism is energetically more demanding
because of the increase in the interaction energy between the COO" and NH2 group, and
between the two transferring protons, during the initial stage of proton transfer.
5) The lowest energy conformers on both the mono- and dihydrated PES are neutral
structures with the water molecule(s) bound to the COOH group (Nlc and N2d,
respectively). These structures combine relatively strong binding energies with low intrinsic
glycine energies. The latter can be attributed to the high proton affinity of the COO" group
relative to the NH2 group.
6) Structure N2d is II.6 kcal/mol lower in energy than Z2b.
The barrier to proton transfer in dihydrated glycine appears to be at most a few
kcal/mol. This suggests that the level of theory necessary to unequivocally state whether a
dihydrated zwitterion structure may be observed experimentally will remain prohibitively
expensive for some time. However, our results suggest that an experimental investigation is
warranted.

218
Acknowledgments
The authors are indebted to Drs. Walter Stevens, Brian Wladkowski and Michael Schmidt as
well as Mr. Simon Webb for helpful discussions. Mr. Brett Bode's assistance in preparing
Figures 9 and 11 is gratefully acknowledged. JHJ acknowledges an ISU College of Letters,
Arts, and Sciences Research Assistantship. This work was supported in part by grants from
the National Science Foundation (CHE-9317317) and the Air Force Office of Scientific
Research (92-0226). The calculations reported here were performed on IBM RS6000
workstations generously provided by Iowa State University and on the 16 node iPSC/860
Paragon at the Air Force Phillips Laboratory.
References
1. (a) Fleming, G. R.; Wolynes, P. G. Physics Today. 1990, 43, 36. (b) Rossky, P. J.; Simon, J. D. Nature 1990, 370, 263.
2. Ding, Y.; Krogh-Jespersen, K. Chem. Phys. Lett. 1992, 799, 261.
3. (a) Tse, Y.-C.; Newton, M. D.; Visheshwara, S.; Pople, J. A. J. Am. Chem. Soc. 1978, 100,4329. (b) Yu, D.; Armstrong, D. A.; Rauk, A. Can. J. Chem. 1992, 70, 1762.
4. Langlet, J.; Caillet, J.; Evleth, E.; Kassab, E. Modeling of Molecular Structure and Properties. Proceedings of an International Meeting, Nancy, France. Revail, J.-L., Ed.; Studies in Physical and Theoretical Chemistry 1990, 71, 345 , Elsevier, Amsterdam.
5. (a) Ramek, M.; Cheng, V. K. W.; Frey, R. F.; Newton, S. Q.; Schafer, L. J. Mol. Struct. 1991, 245, 1. (b) Jensen, J.H.; Gordon, M.S. J. Amer. Chem. Soc. 1991, 113, 3917. (c) Csaszar, A. G. J. Amer. Chem. Soc. 1992,114, 9568. (d). Hu, C.-H.; Schaefer III. H. F. J. Amer. Chem. Soc. 1993,14, 1347. (e) Barone, V.; Adamo, C.; Lejl, F. J. Chem. Phys. 1995,102, 364.
6. (a) Brown, R.D.; Godfrey, P.D.; Storey, J.W.V.; Bassez, M.P. J. Chem. Soc., Chem. Commun. 1978, 547. (b) Suenram, R.D.; Lovas, F.J. J. Mol. Spectrosc. 1978, 72, 372. (c) Suenram, R. D.; Lovas, F. J. J. Amer. Chem. Soc. 1980,102, 7180. (d) lijima, K.; Tanaka, K.; Onuma, S. J. Mol. Struct. 1991, 246, 251. (e) Godfrey, P. D.; Brown, R. D. J. Amer. Chem. Soc. 1995, 777, 2019.
7. Maskill, H. The Physical Basis of Organic Chetnistrw; Oxford University Press: Oxford, U.K. 1985. pp 162.
8. Wada G.; Tamura, E.; Okina, M.; Nakamura, M. Bull. Chem. Soc. Jpn. 1982, 55, 3064.

219
9. (a)Sheinblatt, N.; Gutowsky, S. J. Amer. Chem. Soc. 1964, 86. 4814. (b) Chang. K. C.; Grunwald, E. J. Phys. Chem. 1976, 80. 1422. (c) Slifkin, M. A.; Ali, S. M. J. Molec. Liquids 1984, 28, 215.
10. Gaffney, J.S.; Pierce, R.C.; Friedman, L. J. Amer. Chem. Soc. 1977. 99, 4293.
11. Bonaccorsi, R.; Palla, P.; Tomasi, J. J. Amer. Chem. Soc. 1984, 106. 1945.
12. Rzepa, H.S.; Yi, M.Y. J. Chem. Soc. Perkin Trans. 2 1991,531.
13. (a) Romano, S. Clementi, E.; Int. J. Quantum Chem. 1978,14, 839. (b) David, C. W. Chem. Phys. Lett. 1981, 78, 337. (c) Mezei, M.; Mehrotra. P. K.; Beveridge, D. L. J. Biomolec. Struc. Dynam. 1984, 2, 1. (d) Stamato, F. M. L. G.; Goodfellow, J. M. Int. J. Quant. Chem.: Quant. Biol. Symp. 1986,13. 211. (e) Alagona, G.; Ghio, C.; Kollman, P. A. J. Mol. Struct. (Theochem) 1988, 166, 385. (f) Alagona, G.; Ghio, C. J. Mol. Liquids 47, \2>9.
14. (a) Fomer, W.; Otto, P.; Bernhardt, J.; Ladik, J.J. Theoret. Chim. Acta 1981, 60, 269. (b) Kokpol, S. U.; Dungdee, P. B.; Hannongbua, S. V. Rode, B. M.; Limtrakul. J. P. J. Chem. Soc., Faraday Trans. 2 1988, 84, 1789; and references therein.
15. Basch, H.; Stevens, W. J. Chem. Phys. Lett. 1990,169, 275.
16. Dunning,Jr., T. H.; Hay, P. J. Methods of Electronic Structure Theory. Schaefer III, H. F., Ed.; Plenum Press, NY, 1977. Chapter 1.
17. (a) Hehre, W. J.; Ditchfield, R.; Pople, J. A. J. Chem. Phys. 1978,14, 9\. (b). Harihanan, P. C.; Pople, J. A. Theor. Chim. Acta. 1973, 28, 213.
18. The frequencies were not scaled because it is not clear what scale factors to use for the low-frequency librational modes associated with hydrogen bonds.
19. (a) Gonzales, C.; Schlegel, H. B. J. Phys. Chem. 1990, 94, 5523 . (b) Gonzales, C.; Schlegel, H. B. J. Chem. Phys. 1991, 95, 5853.
20. (a) M0ller, C.; Plesset, M. S. Phys. Rev. 1934,46, 618. (b) Pople, J. A.; Binkley, J. S.; Seeger, R. Int. J. Quantum Chem.; Quantum Chem. Symp. 1976, 10, \.
21. (a) Diffuse sp and 5 functions were added to non-hydrogen and hydrogen atoms respectively. The exponents are C=0.0438, N=0.0639, 0=0.0845, H=0.0360. (b) Clark, T.; Chandrasekhar, J.; Spitznagel, G. W.; von R. Schleyer, P. J. Comp. Chem. 1983, 4, 294.
22. Dunning, Jr., T. H. J. Chem. Phys. 1971, 55, 716.
23. (a) Dunning Jr., T. H. J. Chem. Phys. 1989, 90, 1007. (b) Kendall, R. A.; Dunning Jr., T. H.; Harrison, R. J. J. Chem. Phys. 1992, 96, 6796. (c) Each d polarization function is described by six Cartesian components rather than the five spherically averaged components used by Dunning et al.
24. Feller, D. J. Chem. Phys. 1992, 96, 6104.

220
25. Krishnan, R.; Frisch, M. J.; Pople, J. A. J. Chem.. Phys. 1980, 72. 4244.
26. (a) England, W.; Gordon, M, S. J. Amer. Chem. Soc. 1971, 93. 4649. (b) England, W.; Gordon, M. S. J. Amer. Chem. Soc. 1972, 94, 4818. (c) Gordon, M. S.; England. W. J. Am. Chem. Soc. 1972, 94. 5168. (d) Gordon, M. S.; England. W. Chem. Phys. Lett. 1972,15, 59. (e) Gordon, M. S.; England, W. J. Amer. Chem. Soc. 1973. 95. 1753. (f) Gordon, M. S. J. Mol. Struct. 1974, 23, 399. (g) England, W.; Gordon, M. S.; Ruedenberg, K. Theoret. Chim. Acta 1975, 37, 177. (h) Jensen. J. H.; Gordon, M. S. J. Phys. Chem.. 1995, 99, 8091.
27. Peterson, G. A.; Al-Laham, M. A. J. Chem. Phys. 1991, 94, 6081.
28. Schmidt, M. W.; Baldridge, K. K.; Boatz, J. A.; Elbert, S. T.; Gordon, M. S.; Jensen, J. H.; Koseki, S.; Matsunaga, N.; Nguyen, K. A.; Su, S.; Windus. T. L.; Dupuis, M.; Montgomery Jr, J. A. J. Camp. Chem. 1993,14, 1347.
29. (a) Dupuis, M.; Farazdel, A. Kama, S. P.; Maluendes, S. A. Modem Techniques in Computational Chemistry, Clementi, E., Ed., Escom, Leiden. The Netherlands, 1990. p. 277. (b) Dupuis, M.; Chin, S.; Marquez, A. Relativistic and Electron Correlation Effects in Molecules and Solids. Malli, G.L., Ed., Plenum Press, New York 1994. p. 315.
30. Gaussian 92, Revision A, Frisch, M. J.; Trucks, G. W.; Head-Gordon, M.; Gill, P. M. W.; Wong, M. W.; Foresman, J. B.; Johnson, B. G.; Schlegel, H. B.; Robb, M. A.; Replogle, E. S.; Gomperts, R.; Andres, J. L.; Raghavachari, K.; Binkley, J. S,; Gonzalez, C,; Martin, R. L.; Fox, D. J.; Defrees, D. J.; Baker, J.; Stewart, J. J. P.; Pople, J. A. Gaussian, Inc. Pittsburgh PA, 1992.
31. (a) Edmiston, C.; Ruedenberg, K. Rev. Mod. Phys. 1963, 35,457. (b) Raffenetti, R. C.; Ruedenberg, K.; Janssen, C, L.; Schaefer III, H. F. Theor. Chim. Acta 1993, 86. 149.
32. Hammond, G. S. J. Amer. Chem. Soc. 1955, 77, 334.
33. A similar argument, which inspired this discussion, can be found in reference 4.
34. (a) Hillenbrand, E. A.; Scheiner, S. J. Amer. Chem. Soc. 1984,106. 6266. (b) Scheiner. S. Acc. Chem. Res. 1985,18, 174.
35. Pritchard, R.H.; Kem. C. W. J. Amer. Chem. Soc. 1969, 91, 1631.

221
Table I. Energies (in kcal/mol) of TSla and Nla relative to Zla at various levels of theor>'. See section IIIA for the definitions of the nomenclature.
TS-Z N-Z MP2/DZP++ -1.9 -11.8
MP2ArZP++ -1.6 -12.4 MP2/aug-cc-pDZV -2.0 -11.7
MP4/DZP++ -1.3 -12.2

222
Table II. Selected structural parameters for the stationar>' points discussed in this paper. O^-is
refers to the glycine oxygen atoms involved in the proton transfer, and 0 is the dihedral angle, N-CC-Ocw- Distances are in A and angles in degrees. See section IIIA for the definitions of the nomenclature.
r(C0(;-/5) V{ C O jrans^ 0 zo 1.248 1.203 0.0 TSO 1.253 1.200 0.0 NOa 1.316 1.185 0.0
Zla 1.249 1.209 -0.5 Zlb 1.236 1.222 -36.5 TSla 1.271 L200 -3.4 TSlb 1.271 1.200 28.7 Nla 1.320 1.191 -27.0 Nib 1.318 1.189 44.4
Z2a 1.252 1.211 -16.0 Z2b 1.254 1.208 0.0 Z2c 1.229 1.229 -103.0 TS2a 1.277 1.200 -7.0 TS2b 1.284 1.200 -32.7 TS2c 1.271 1.208 -58.4 N2a 1.317 1.195 -20.6 N2b 1.313 1.195 -65.8 N2c 1.315 1.195 -67.9

Table III. MP2/DZP++//RHF/DZP energies (in kcal/mol) for proton transfer transition states and resulting neutral structures, relative to the zwitterion, for Glycine(H20)n, n=0-2. See section IIIA for the definitions of the various terms.
Transition State Neutral
Reaction -AARb AE[Gly#] AE AHo AG298 -AAEb AE[Gly#] AE AHo AG298
ZO->NOa - - -l.Oa -1.9a -1.7a - - -17.0:» -16.4a 16.0a
Zla->Nla 5.4 -7.3 -1.9 -4.8 -4.7 10.0 -21.7 -11.8 -12.8 -13.9
Zla-^Nlb - - 3.6 -1.0 0.2 6.7 -17.1 -10.4 -11.1 -11.6
Z2a->N2a 6.4 -7.0 -0.6 -3.6 -3.6 13.1 -20.7 -7.6 -8.4 -8.9
Z2b^N2b 4.7b 1.7c 6.3 1.3 1.9 8.5b -12.3c -3.8 -5.0 -6.1
Z2c->N2c 5.6b -1.3c 4.4 -0.7 0.5 10.8^ -16.3c -5.5 -6.7 -7.3
^These values are calculated at the MP2/DZP++//RHF/6-31G* level of theory. ^Change in the binding energy of the "spectator" water molecule. '^Relative intrinsic energy of the gIycine(H20) system, where the water molecule in assisitng the proton transfer.

224
Table IV. MP2/DZP++//RHF/DZP binding energies, relative binding energies, intrinsic glycine energies, and relative total energies of zwitterionic and neutral mimina. See section IIIA for the definitions of the various terms.
AEb -AAEb AE[Gly#] AE AHo AG298 NOb - - - o.oa o.oa o.oa NOa - - - l.Oa l.ia 1.8^
Zla 18.3 0.0 0.0 0.0 0.0 0.0 Zlb 18.4 -0.1 1.4 1.3 1.5 1.7
Nlc 10.9 0.0 0.0 0.0 0.0 0.0 Nld 11.3 -0.4 1.6 1.2 1.2 1.2 Nle 9.2 1.7 1.7 3.4 3.3 3.3 Nlf 7.4 3.5 0.2 3.7 3.3 2.7 Nla 8.3 2.6 1.1 3.7 3.8 3.1 Nig 6.3 4.6 0.9 5.4 5.1 3.8 Nib 11.7 -0.8 5.8 5.6 5.8 5.9
Z2a 34.8 0.0 0.0 0.0 0.0 0.0 Z2b 39.1 -4.3 5.0 0.7 0.9 1.6 Z2c 44.4 -9.6 10.9 1.3 1.9 2.4
N2d 24.4 0.0 0.0 0.0 0.0 0.0 N2e 25.1 -0.7 1.7 1.0 1.0 0.7 N2a 21.7 2.7 0.6 3.3 3.3 2.9 N2f 20.4 4.0 1.3 5.3 4.8 3.7 N2g 18.1 6.3 -0.3 6.0 5.1 3.9 N2c 24.1 0.3 6.4 6.7 6.9 7.0 N2h 18.8 5.6 1.4 6.9 6.5 5.5 N2b 23.2 1.2 6.6 7.8 7.7 7.4 N2i 15.1 9.3 0.4 9.7 9.1 6.4
^These values are calculated at the MP2/DZP++//RHF/6-31G* level of theory.

HO NH^ •
O
+ n J H2O + «? HtO
0. NHi""
HO^— NHo
+ n-> HoO
9v NH3- HO NH.
^ ' " O
Scheme 1. "Reaction path" leading from the glycine zwitterion-neutral equilibrium in the gas phase to that in bulk aqueous solution.

. -H .
H---0-
O /
"N •i^H
\ / H---0 H
i: 5.5
-K O' N-^
/ i"H O H
v: 8.5
• .-H. Q"
nH
H---0
< //
H---0
H/ h ^ - n - H
' i"H H
ii: 7.8 (1760
- - - Q H-
\
H
H" (157/, 139/) O H (104/)
H 1
.0 H
O /
o' r / ix: 5.9 \ /
H OH
.-H. O' "N
/ 0-..M H
H-^0 iii: 4.6 /
(14/) H
H.
H Q
O
HJ N- •H---Ov
vii: 8.3 (118/, 43/)
h sh .-"^w
o' x: 4.5
(196/, 71/, 34/)
• H. O" 'N
nH
y~i'H O - ^ , , H
H- •o iv: 4.6 J
H
O •H---0
} V//L.
/
\
H
H
H
O
O
Hi • N '
^,,(34^-22^61750
H OH
H \
/O-H''^ \'H,
6 xii: 3.3 (89/, 18/)
^ Scheme 2. RHF/6-3IG* energies (in kcal/mol) relative to Hs.^ .-'^H ^ u Zla and imaginary frequencies. All structures
'0,, / xiii: 10.8 0/,^ / xiv: 10.5 / ^// (180/, 58/) J (184/, 75/)
Oh 0^

227
1.076 .55XC;i4snH 1.473.-Oi;i9^ 0.957
ZO (CJ TSO (C) NOa(C,)
Figure 1. RHF/6-31G* optimized structures of a) ZO, b) TSO, and c) NOa. The atom shading defined in a) is used throughout this paper.

228
15
10
-I 0
a) ZO NOa
AE
Zla -4 Nla
AE[Gly#]
d) Z2a —> N2a
•-s^E -
\ \^E^ly#] "
,
15
10
5
0
-5
-10
-15
-20
-25
C) Zla ̂ Nib
VAE
-10 -5 10
e) Z2b N2b
AE[Gly#]
-2 .i/2.
-15 -10 -5 1 l'̂
s (Bohr amu ") 10 -1 0
s (Bohr amu"") Figure 2. Plot of the total energy and its intrinsic and binding energy-components [equation
(8)] for various IRCs. The level of theory is MP2/DZP-H-//RHF/6-3IG* for a) and MP2/DZP-H-//RHF/DZP for b) through e).

229
0.951 2.08 2.18
1.014
1.96 Zla 1.92
1.018 Zlb
1.154 285
182
TSlb
TSla
2.60 2.52 '
0.955
2.13
2.07 Nib 0.953
Nla
Figure 3. RHF/DZP optimized structures of the two monohydated zwitterionic structures and the transition states and neutral minima resulting from proton transfer. Bond lengths are in A.

230
Nlc Nld
Nle (side view) Nle (top view)
2.04
2.14
Nlf Nig
Figure 4. RHF/DZP optimized structures of the minima found on the neutral monohydrated glycine PES. Bond lengths are in A.

231
1.91VS
Z2a
d)
2.02
TS2a
b)
0.958ff:ft .86
Z2b (C,)
2.32
1.152 fSK 1.316
1.222 TS2b
f)
0.961®-^
2.12
1-158V (D
1.158 1.325
TS2c
N2a &;
0.955
h)
2.16 \2.31
0.956
n 1'
2.12 2.31
0.957 1.86>?^ 0.954
Figure 5. RHF/DZP optimized structures of the three dihydrated zwitterionic structures (a-c) and the transition states (d-f) and neutral minima (g-i) resulting from proton transfer. Bond lengths are in A.

232
1.88
N2f (side view)
2.03
3.16/ 2 . 1 1
N2f (top view)
^ 1.96
N2h
Figure 6. RHF/DZP optimized structures of the minima found on the neutral dihydrated glycine PES. Bond lengths are in A.

233
TS2d: AE=6.9 TS2e: AE=3.1 AHo=6.3 AHo=3.1 AG2g8=5.6 AG29g=3.6
Figure 7. RHF/DZP optimized structures of the transition states connecting Z2b with a) Z2a and b) Z2c and the barrier heights relative to Z2b. Bond lengths are in A and energies are in kcal/mol.

234
a) -340 100
-345
2-100 P AE 3-200
^-300
350
Ae 355
-400
-360 -500 -0.5 0 0.5 1 2.5 3 1.5 2
5 (Bohr amu^''")
b)
As,
AE Ae -20
-30 -0.5 0 1 1.5 2 2.5 3 0.5
^ (Bohr amu'^")
Figure 8. a) Plot of the four energy components defined in equation (12) (left vertical axis) and the total energy (bold curve, right vertical axis), relative to their respective
components in the glycine anion, b) Plot of AEi+Ae2 and the remaining energy components relative to their respective values in the zwitterion. In these and subsequent plots the bold curve represent the sum of the remaining curves. Energies are evaluated at the MP2/DZP-i~i-//RHF/6-31G* level of theory.

235
b)
.?=0.6 Bohr-amu
Figure 9. a) Structure ZO (top view) on which the location of the centroids (small circles) of electronic charge of the N and Ods lone pairs are shown. The arrows centered on these centroids represent LCD dipoles. b) Same as for a) but for the structure at s=0.6 bohr-amu 1/2

236
40 -
Aej+Aen
1 j -^
s (Bohr amu "•)
-15
AE(NH2 \C00
« 20
UJ 0
mcoamr^ AE(NH2\H2
s (Bohr amu'''")
Figure 10. a) Plot of Ae/+Ae//and the remaining energy components in equation (13) (left vertical axis) and the total energy (bold curve, right vertical axis) relative to their
respective values in the zwitterion. b) Plot of Ae/.// and its components [equation (16)] relative to their respective values in the zwitterion.

237
a)
Nip
Zla
TSlb
Figure 11. a) Structure Zla (top view) on which the locations of the centroids of electronic charge of the N and Ods lone pairs are shown. The arrows centered on these centroids represent LCl3 dipoles. b) Same as for a) but for TSlb.

238
CHAPTERS. CONCLUSIONS
The main conclusions of chapters 2-4 can be summarized as follows. The hydrogen
bond can be understood as a competition between the electrostatic interaction energy (which
lowers the energy) and the internal electronic kinetic energy of the molecules (which raises
the energy). The hydrogen bond length represents the point on the potential energy surface
where the interaction energy ceases to dominate the total energy. The interaction energy can
be modeled quite well by classical electrostatics, specifically distributed multipole
expansions up to octupoles and distributed dipole polarizabilities. The exchange repulsion
part, which becomes dominant at small distances, must be modeled fully quantum
mechanically to be general. However, due to the short range of this effect only molecules in
the immeadiate vicinity of one another need to be treated that way.
Next, the conclusions of chapters 5-7 are summarized. Gas phase neutral glycine can
exist in several low energy conformations. Dimerization of gas phase glycine to form
glycylglycine can occur via two different but energetically very similar mechanisms. The
glycine zwitterion, the lowest energy form of glycine in bulk aqueous solution, is not even a
local minimum in the gas phase. However, "microsolvating" glycine by only two water
molecules is sufficient to stabilize the glycine zwitterion.