glyme-based electrolytes for lithium metal batteries using ... · s 6 figure s3. nyquist plots...
TRANSCRIPT

S 1
Glyme-based electrolytes for lithium metal batteries using insertion
electrodes: An electrochemical study
Shuangying Weia, Zhenguang Lib, Kento Kimurab, Shoichi Inoueb, Loris Pandinia, Daniele Di
Leccea, Yoichi Tominagab,c,** and Jusef Hassouna,c,d,*
a University of Ferrara, Department of Chemical and Pharmaceutical Sciences, Via Fossato
di Mortara 17, 44121, Ferrara, Italy.
b Tokyo University of Agriculture and Technology, Graduate School of Bio-Applications and
Systems Engineering (BASE), 2-24-16, Naka-cho, Koganei-shi, Tokyo 184-8588, Japan.
c Institute of Global Innovation Research (GIR), Tokyo University of Agriculture and
Technology (TUAT), Tokyo, Japan
d National Interuniversity Consortium of Materials Science and Technology (INSTM)
University of Ferrara Research Unit, University of Ferrara, Via Fossato di Mortara, 17,
44121, Ferrara, Italy.
Corresponding Authors: [email protected],[email protected]
Supporting Information
S 2
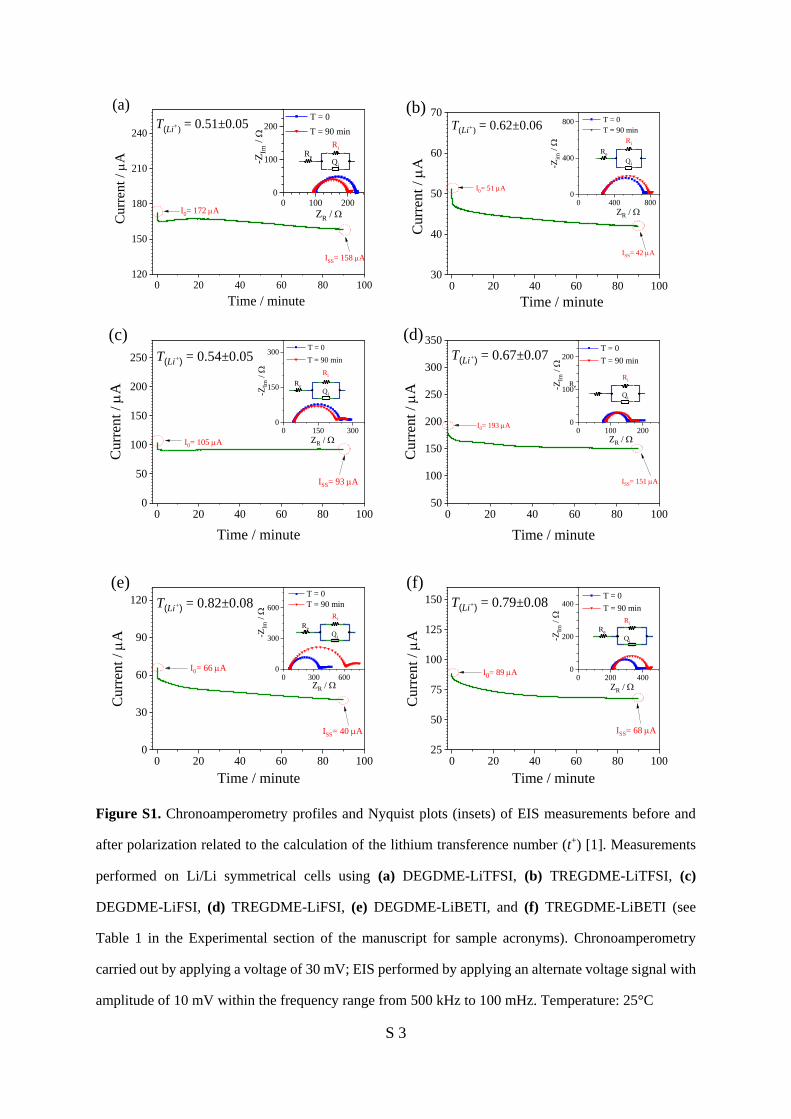
Figures S1 and S2 show the chronoamperometry profiles and Nyquist plots (insets) at 25°C
and 50°C, respectively, of EIS measurements before and after polarization on Li/Li
symmetrical cells using DEGDME-LiTFSI (panel a), TREGDME-LiTFSI (panel b),
DEGDME-LiFSI (panel c), TREGDME-LiFSI (panel d), DEGDME-LiBETI (panel e), and
TREGDME-LiBETI (panel f). The data have been analyzed by NLLS method and the lithium
transference number (t+) has been evaluated by the method proposed by Evans et al. [1]. The
lithium transference number values are reported and discussed in the manuscript (Figure 2,
Results and discussion section). Table 1 in the Experimental section of the manuscript reports
the sample acronyms. Table S1 and S2 report the data used for the determination of the lithium
transference number using equation (1) in the manuscript at 25°C and 50°C, respectively. The
values of R0 and Rss (interphase resistances at middle-high frequencies of the initial state and
the steady state, respectively, reported in Figure S1 and Figure S2) were determined by NLLS
fit of the corresponding Nyquist plots using the equivalent circuit Re(RiQi)Q or (RiQi)(RQ)
with a chi-square (χ2) ranging from 9×10⁻⁵ to 6×10⁻⁶, thus ensuring acceptable accuracy. In the
equivalent circuits used for the study, Re is the electrolyte resistance, Ri is the
electrode/electrolyte interphase resistance, Qi is the pseudo-capacitance related to
electrode/electrolyte interphase, and Q or (RQ) is a low-frequency element accounting for Li+
diffusion phenomena [2]. The data reveal a general decrease of the lithium transference number
by the increase of the temperature as likely due to an increase of anion and solvent molecules
motion into the electrolyte and to enhanced solvation which hinder the transport of the lithium
ions as observed in previous paper [3].
S 3
0 20 40 60 80 100120
150
180
210
240
0 100 2000
100
200T(Li+) = 0.51±0.05
(a)C
urr
en
t /
mA
Time / minute
I0= 172 mA
ISS= 158 mA-Z
Im /
W
ZR / W
T = 0
T = 90 min
Ri
Qi
Re
0 20 40 60 80 10030
40
50
60
70
Cu
rren
t /
mA
Time / minute
I0= 51 mA
ISS= 42 mA
T(Li+) = 0.62±0.06
(b)
0 400 8000
400
800
Qi
Ri
-Zim
/ W
ZR / W
Re
T = 0
T = 90 min
0 20 40 60 80 1000
50
100
150
200
250
0 150 3000
150
300
(c)
Cu
rren
t /
mA
Time / minute
T(Li+) = 0.54±0.05
I0= 105 mA
ISS= 93 mA
Qi
Re
-ZIm
/ W
ZR / W
Ri
T = 0
T = 90 min
0 20 40 60 80 10050
100
150
200
250
300
350
0 100 2000
100
200
(d)
Curr
ent
/ m
A
Time / minute
T(Li+) = 0.67±0.07
I0= 193 mA
ISS= 151 mA
-ZIm
/ W
ZR / W
T = 0
T = 90 min
Ri
Qi
Re
0 20 40 60 80 1000
30
60
90
120
0 300 6000
300
600T(Li+) = 0.82±0.08
Curr
ent
/ m
A
Time / minute
I0= 66 mA
ISS= 40 mA
(e)
ZR / W
T = 0
T = 90 min
-ZIm
/ W Ri
Re
Qi
0 20 40 60 80 10025
50
75
100
125
150
0 200 4000
200
400T(Li+) = 0.79±0.08
Curr
ent
/ m
A
Time / minute
I0= 89 mA
ISS= 68 mA
(f)
-ZIm
/ W
ZR / W
T = 0
T = 90 min
Re
Qi
Ri
Figure S1. Chronoamperometry profiles and Nyquist plots (insets) of EIS measurements before and
after polarization related to the calculation of the lithium transference number (t+) [1]. Measurements
performed on Li/Li symmetrical cells using (a) DEGDME-LiTFSI, (b) TREGDME-LiTFSI, (c)
DEGDME-LiFSI, (d) TREGDME-LiFSI, (e) DEGDME-LiBETI, and (f) TREGDME-LiBETI (see
Table 1 in the Experimental section of the manuscript for sample acronyms). Chronoamperometry
carried out by applying a voltage of 30 mV; EIS performed by applying an alternate voltage signal with
amplitude of 10 mV within the frequency range from 500 kHz to 100 mHz. Temperature: 25°C

S 4
0 20 40 60 80 1000
800
1600
2400
3200
4000
4800
5600
0 10 200
10
20T(Li+) = 0.32±0.03
(a)C
urr
ent
/ m
A
Time / minute
I0= 2620 mA
ISS= 1930 mA-Z
Im /
W
ZR / W
T = 0
T = 90 min
Ri
Qi
Re
0 20 40 60 80 1000
800
1600
2400
3200
0 10 200
10
20T(Li+) = 0.36±0.04
(b)
Cu
rren
t /
mA
Time / minute
I0= 2080 mA
ISS= 1270 mA
-ZIm
/ W
ZR / W
T = 0
T = 90 min
Ri
Qi
Re
0 20 40 60 80 1000
400
800
1200
1600
0 10 20 30 40 50 600
10
20
30
40
50
60T(Li+) = 0.38±0.04
(c)
Curr
ent
/ m
A
Time / minute
I0= 810 mA
ISS
= 498 mA
-ZIm
/ W
ZR / W
T = 0
T = 90 min
Ri
Qi
Re
0 20 40 60 80 1000
600
1200
1800
2400
3000
3600
0 10 200
10
20T(Li+) = 0.46±0.05
(d)
Curr
ent
/ m
A
Time / minute
I0= 2160 mA
ISS= 1310 mA
-ZIm
/ W
ZR / W
T = 0
T = 90 min
Ri
Qi
Re
0 20 40 60 80 1000
800
1600
2400
3200
4000
4800
0 10 200
10
20T(Li+) = 0.43±0.04
(e)
Curr
ent
/ m
A
Time / minute
I0= 2140 mA
ISS
= 1680 mA
-ZIm
/ W
ZR / W
T = 0
T = 90 min
Ri
Qi
Re
0 20 40 60 80 1000
800
1600
2400
3200
0 10 200
10
20T(Li+) = 0.39±0.04
(f)
Cu
rren
t /
mA
Time / minute
I0= 1950 mA
ISS= 1160 mA
-ZIm
/ W
ZR / W
T = 0
T = 90 min
Ri
Qi
Re
Figure S2. Chronoamperometry profiles and Nyquist plots (insets) of EIS measurements before and
after polarization related to the calculation of the lithium transference number (t+) [1]. Measurements
performed on Li/Li symmetrical cells using (a) DEGDME-LiTFSI, (b) TREGDME-LiTFSI, (c)
DEGDME-LiFSI, (d) TREGDME-LiFSI, (e) DEGDME-LiBETI, and (f) TREGDME-LiBETI (see
Table 1 in the Experimental section of the manuscript for sample acronyms). Chronoamperometry
carried out by applying a voltage of 30 mV; EIS performed by applying an alternate voltage signal with
amplitude of 10 mV within the frequency range from 500 kHz to 100 mHz. Temperature: 50°C
S 5
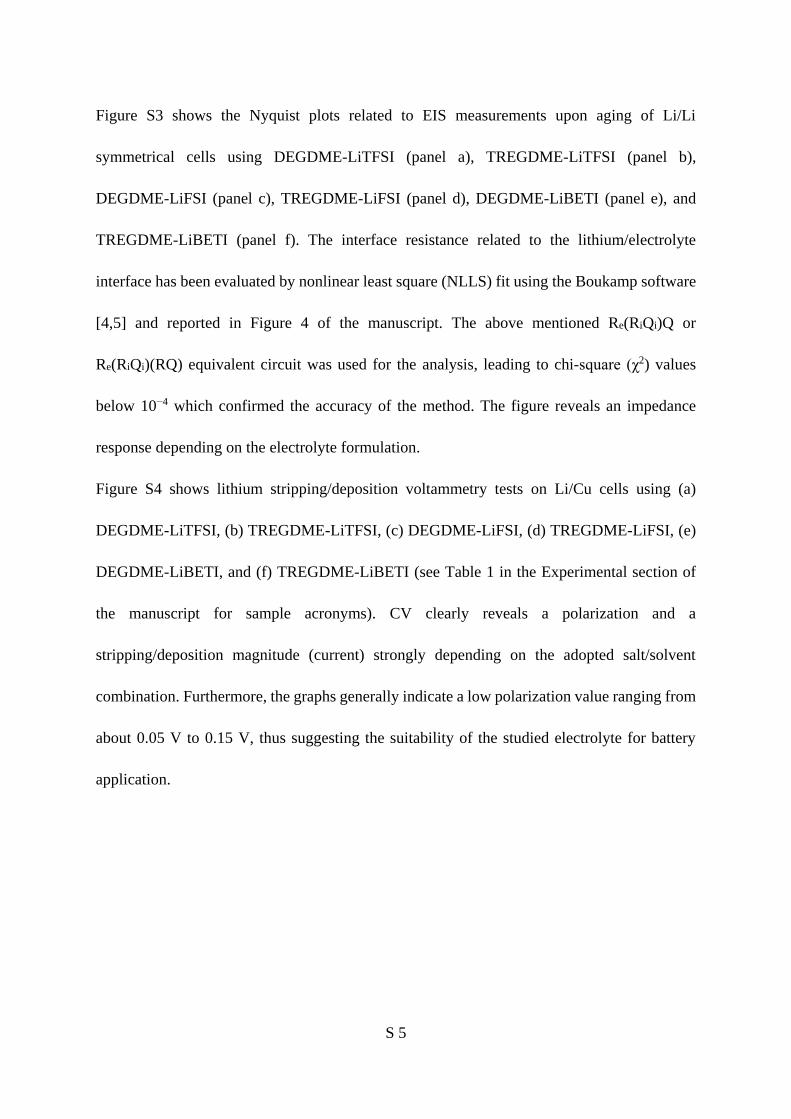
Figure S3 shows the Nyquist plots related to EIS measurements upon aging of Li/Li
symmetrical cells using DEGDME-LiTFSI (panel a), TREGDME-LiTFSI (panel b),
DEGDME-LiFSI (panel c), TREGDME-LiFSI (panel d), DEGDME-LiBETI (panel e), and
TREGDME-LiBETI (panel f). The interface resistance related to the lithium/electrolyte
interface has been evaluated by nonlinear least square (NLLS) fit using the Boukamp software
[4,5] and reported in Figure 4 of the manuscript. The above mentioned Re(RiQi)Q or
Re(RiQi)(RQ) equivalent circuit was used for the analysis, leading to chi-square (χ2) values
below 10−4 which confirmed the accuracy of the method. The figure reveals an impedance
response depending on the electrolyte formulation.
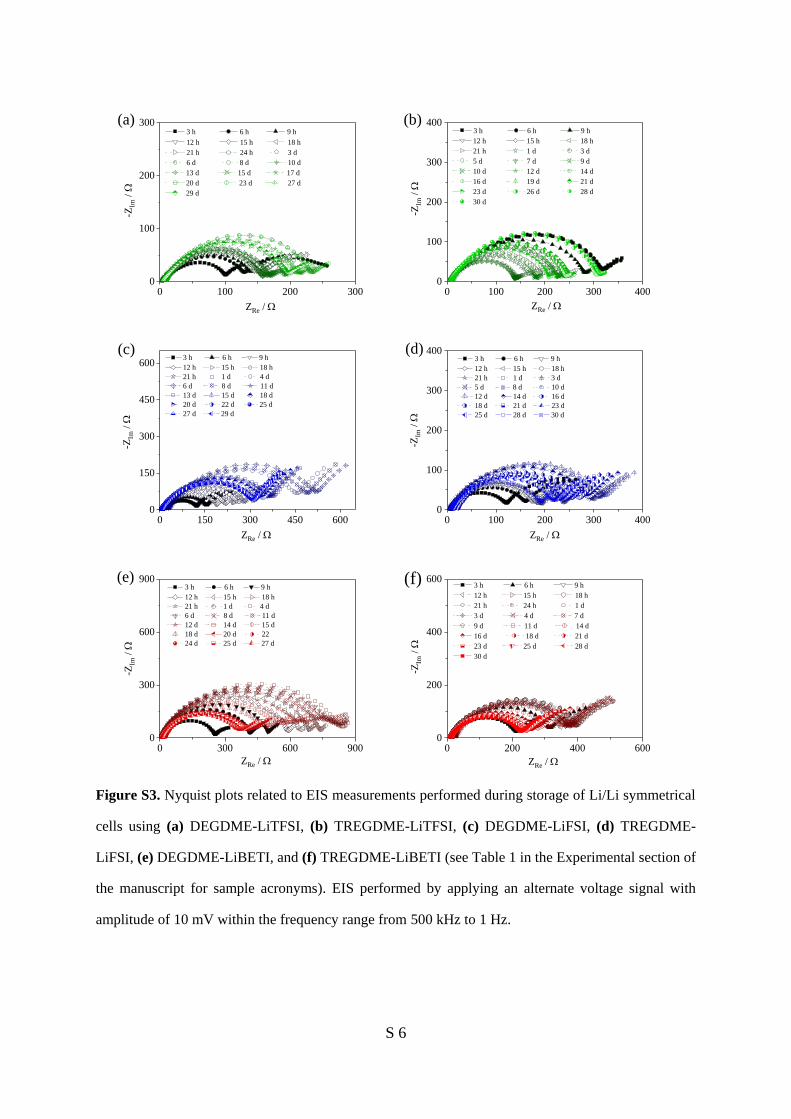
Figure S4 shows lithium stripping/deposition voltammetry tests on Li/Cu cells using (a)
DEGDME-LiTFSI, (b) TREGDME-LiTFSI, (c) DEGDME-LiFSI, (d) TREGDME-LiFSI, (e)
DEGDME-LiBETI, and (f) TREGDME-LiBETI (see Table 1 in the Experimental section of
the manuscript for sample acronyms). CV clearly reveals a polarization and a
stripping/deposition magnitude (current) strongly depending on the adopted salt/solvent
combination. Furthermore, the graphs generally indicate a low polarization value ranging from
about 0.05 V to 0.15 V, thus suggesting the suitability of the studied electrolyte for battery
application.
S 6
Figure S3. Nyquist plots related to EIS measurements performed during storage of Li/Li symmetrical
cells using (a) DEGDME-LiTFSI, (b) TREGDME-LiTFSI, (c) DEGDME-LiFSI, (d) TREGDME-
LiFSI, (e) DEGDME-LiBETI, and (f) TREGDME-LiBETI (see Table 1 in the Experimental section of
the manuscript for sample acronyms). EIS performed by applying an alternate voltage signal with
amplitude of 10 mV within the frequency range from 500 kHz to 1 Hz.
0 100 200 3000
100
200
300(a) 3 h 6 h 9 h
12 h 15 h 18 h
21 h 24 h 3 d
6 d 8 d 10 d
13 d 15 d 17 d
20 d 23 d 27 d
29 d
-ZIm
/ W
ZRe / W
0 100 200 300 4000
100
200
300
400(b) 3 h 6 h 9 h
12 h 15 h 18 h
21 h 1 d 3 d
5 d 7 d 9 d
10 d 12 d 14 d
16 d 19 d 21 d
23 d 26 d 28 d
30 d
-ZIm
/ W
ZRe / W
0 150 300 450 6000
150
300
450
600
(c)
-ZIm
/ W
ZRe / W
3 h 6 h 9 h
12 h 15 h 18 h
21 h 1 d 4 d
6 d 8 d 11 d
13 d 15 d 18 d
20 d 22 d 25 d
27 d 29 d
0 100 200 300 4000
100
200
300
400(d)
-ZIm
/ W
ZRe / W
3 h 6 h 9 h
12 h 15 h 18 h
21 h 1 d 3 d
5 d 8 d 10 d
12 d 14 d 16 d
18 d 21 d 23 d
25 d 28 d 30 d
0 300 600 9000
300
600
900(e)
-ZIm
/ W
ZRe / W
3 h 6 h 9 h
12 h 15 h 18 h
21 h 1 d 4 d
6 d 8 d 11 d
12 d 14 d 15 d
18 d 20 d 22
24 d 25 d 27 d
0 200 400 6000
200
400
600 3 h 6 h 9 h
12 h 15 h 18 h
21 h 24 h 1 d
3 d 4 d 7 d
9 d 11 d 14 d
16 d 18 d 21 d
23 d 25 d 28 d
30 d
-ZIm
/ W
ZRe / W
(f)

S 7
-0.4 -0.3 -0.2 -0.1 0.0 0.1 0.2 0.3 0.4-6
-3
0
3
6
-0.4 -0.2 0.0 0.2 0.4 0.6-18
-12
-6
0
6
Curr
en
t /
mA
Potential vs. Li+/Li / V
(a)
Cu
rrent / m
A
Potential vs. Li+/Li / V
1st
cycle
-0.4 -0.3 -0.2 -0.1 0.0 0.1 0.2 0.3 0.4-2
-1
0
1
2
-0.4 -0.2 0.0 0.2 0.4
-20
-15
-10
-5
0
5(b)
Curr
en
t /
mA
Potential vs. Li+/Li / V
1st
cycle
Cu
rrent / m
A
Potential vs. Li+/Li / V
-0.4 -0.3 -0.2 -0.1 0.0 0.1 0.2 0.3 0.4
-300
-200
-100
0
100
200
-0.4 -0.2 0.0 0.2 0.4-300
-200
-100
0
100(c)
Curr
en
t /
mA
Potential vs. Li+/Li / V
1st
cycle
Cu
rrent / m
A
Potential vs. Li+/Li / V
-0.4 -0.3 -0.2 -0.1 0.0 0.1 0.2 0.3 0.4-200
-150
-100
-50
0
50
100
150
-0.4 -0.2 0.0 0.2 0.4-200
-100
0
100(d)
Curr
en
t /
mA
Potential vs. Li+/Li / V
1st
cycle
Cu
rrent / m
A
Potential vs. Li+/Li / V
-0.4 -0.3 -0.2 -0.1 0.0 0.1 0.2 0.3 0.4-0.4
-0.2
0.0
0.2
0.4
-0.4 -0.2 0.0 0.2 0.4
-10
-8
-6
-4
-2
0(e)
Curr
en
t /
mA
Potential vs. Li+/Li / V
1st
cycle
Cu
rrent / m
A
Potential vs. Li+/Li / V
-0.4 -0.3 -0.2 -0.1 0.0 0.1 0.2 0.3 0.4-4
-2
0
2
4
-0.4 -0.2 0.0 0.2 0.4-15
-10
-5
0
(f)
Curr
en
t /
mA
Potential vs. Li+/Li / V
1st
cycle
Cu
rrent / m
A
Potential vs. Li+/Li / V
Figure S4. Lithium stripping/deposition voltammetry tests of Li/Cu cells using (a) DEGDME-LiTFSI,
(b) TREGDME-LiTFSI, (c) DEGDME-LiFSI, (d) TREGDME-LiFSI, (e) DEGDME-LiBETI, and (f)
TREGDME-LiBETI (see Table 1 in the Experimental section of the manuscript for sample acronyms).
CVs performed within -0.3 and 0.3 V using a scan rate of 0.1 mV s-1.

S 8
Electrolyte R0 (Ω) χ2 I0 (A) Rss (Ω) χ2 Iss (A) t+
DEGDME-LiTFSI 133±2 7×10⁻⁵ 1.72×10⁻⁴ 109±1 8×10⁻⁵ 1.58×10⁻⁴ 0.51±0.05
TREGDME-LiTFSI 450±5 8×10⁻⁵ 5.13×10⁻⁵ 497±5 6×10⁻⁵ 4.20×10⁻⁵ 0.62±0.06
DEGDME-LiFSI 211±2 9×10⁻⁵ 1.05×10⁻⁴ 182±2 9×10⁻⁵ 9.28×10⁻⁵ 0.54±0.05
TREGDME-LiFSI 76.7±0.4 2×10⁻⁵ 1.93×10⁻⁴ 82.0±0.8 4×10⁻⁵ 1.51×10⁻⁴ 0.67±0.07
DEGDME-LiBETI 300±1 8×10⁻⁵ 6.60×10⁻⁵ 561±2 8×10⁻⁵ 4.01×10⁻⁵ 0.82±0.08
TREGDME-LiBETI 157±1 2×10⁻⁵ 8.90×10⁻⁵ 214±1 3×10⁻⁵ 6.79×10⁻⁵ 0.79±0.08
Table S1. Data used for the determination of the lithium transference number using equation
(1) at 25 °C (see discussion of Figure 2 in the manuscript). R0, I0, Rss and Iss are the interphase
resistances (at middle-high frequencies) and the current of the initial state and the steady state
reported in Figure S1, respectively, while χ2 is the chi-square value obtained for the
determination of the resistances by NLLS fit of the corresponding Nyquist plots. The error on
the final t+ number was estimated as 10% based on the error on resistances and possible
instrumental uncertainty.

S 9
Electrolyte R0 (Ω) χ2 I0 (A) Rss (Ω) χ2 Iss (A) t+
DEGDME-LiTFSI 7.3±0.1 6×10⁻⁵ 2.62×10⁻³ 2.5±0.2 4×10⁻⁵ 1.93×10⁻³ 0.32±0.03
TREGDME-LiTFSI 6.8±0.1 7×10⁻⁶ 2.08×10⁻³ 2.3±0.2 6×10⁻⁵ 1.27×10⁻³ 0.36±0.04
DEGDME-LiFSI 21±1.1 9×10⁻⁵ 8.10×10⁻⁴ 17.7±0.4 2×10⁻⁵ 4.98×10⁻⁴ 0.38±0.04
TREGDME-LiFSI 4.4±0.1 6×10⁻⁶ 2.16×10⁻³ 2.3±0.1 6×10⁻⁵ 1.31×10⁻³ 0.46±0.05
DEGDME-LiBETI 7.3±0.1 7×10⁻⁶ 2.14×10⁻³ 2.3±0.2 3×10⁻⁵ 1.68×10⁻³ 0.43±0.04
TREGDME-LiBETI 6.3±0.1 1×10⁻⁵ 1.95×10⁻³ 2.5±0.1 4×10⁻⁵ 1.16×10⁻³ 0.39±0.04
Table S2. Data used for the determination of the lithium transference number using equation
(1) at 50 °C (see discussion of Figure 2 in the manuscript). R0, I0, Rss and Iss are the interphase
resistances (at middle-high frequencies) and the current of the initial state and the steady state
reported in Figure S2, respectively, while χ2 is the chi-square value obtained for the
determination of the resistances by NLLS fit of the corresponding Nyquist plots. The error on
the final t+ number was estimated as 10% based on the error on resistances and possible
instrumental uncertainty.

S 10
References
[1] J. Evans, C. A. Vincent, P.G. Bruce, Electrochemical measurement of transference
numbers in polymer electrolytes, Polymer. 28 (1987) 2324–2328. doi:10.1016/0032-
3861(87)90394-6.
[2] L. Carbone, D. Di Lecce, M. Gobet, S. Munoz, M. Devany, S. Greenbaum, J. Hassoun,
Relevant Features of a Triethylene Glycol Dimethyl Ether-Based Electrolyte for Application
in Lithium Battery, ACS Appl. Mater. Interfaces. 9 (2017) 17085–17095.
doi:10.1021/acsami.7b03235.
[3] J. Peng, L. Carbone, M. Gobet, J. Hassoun, M. Devany, S. Greenbaum, Natural Abundance
Oxygen-17 NMR Investigation of Lithium Ion Solvation in Glyme-based Electrolytes,
Electrochim. Acta. 213 (2016) 606–612. doi:10.1016/j.electacta.2016.07.144.
[4] B.A. Boukamp, A nonlinear least squares fit procedure for analysis of immittance data of
electrochemical systems, Solid State Ionics. 20 (1986) 31–44. doi:10.1016/0167-
2738(86)90031-7.
[5] B. Boukamp, A package for impedance/admittance data analysis, Solid State Ionics. 18–
19 (1986) 136–140. doi:10.1016/0167-2738(86)90100-1.