going the distance - arup
TRANSCRIPT

1
Going the DistanceIntegrated Demand Responsive Transport in Cities
A preliminary study of the potential role of a digitally-enabled demand responsive transport service, operating as part of an integrated public transport network.

2

3
0 Executive Summary
1 Introduction1.1 Demand Responsive Transport 1.2 Scope of Study1.3 Methodology
2 Learning from DRT Innovations2.1 Reviewing Existing DRT2.2 Case Studies of DRT2.3 Lessons Learnt
3 The Operational Model of iDRT3.1 DRTville Today3.2 iDRT in DRTville3.3 Scenarios3.4 iDRT User Perspective3.5 iDRT Infrastructure
4 The Financial Case for iDRT4.1 Potential Markets4.2 iDRT Cost Elements4.3 iDRT Operating Costs
Contents
4.4 Example User Journeys Switching to iDRT4.5 Revenue4.6 Financial Summary
5 Implementation of iDRT5.1 Business Model5.2 Operational Models5.3 The Role of Digital5.4 Value Propositions5.5 Evolution and Delivery
6 Global Application6.1 Global Application6.2 Global City Recommendations
7 Conclusions7.1 Conclusions7.2 The Way Forward
8 About Arup8.1 Who we are

1
0 Executive Summary
2
Uber. Didi. Lyft. These are the poster children of a tide of new apps, each presenting the possibility of mobility in a more connected age. Digitising the concept of demand responsive transport – where a mode is influenced by the requests of its users – these apps are a far cry from traditional ‘dial-a-ride’ services still employed in rural areas of the UK. A revolution in demand responsive transport is underway, but it is not delivering for the masses. Most digital DRTs lack consideration of wider public transport systems, limiting not only their contribution to the public good, but the long term commercial potential for operators. A new integrated approach to DRT could leave travellers happier, reduce costs for the public sector and present new profitable markets. This report presents the feasibility of such an ‘iDRT’. To test this theory, we replace poor performing low frequency (LF) buses with an iDRT service that shuttles users to a high frequency bus route. We explore scenarios in DRTville - a context defined by real data from anonymised medium-sized UK cities. Analysis of existing DRT services demonstrates great diversity in the market, the near absence of iDRT at present, and clear evidence that commercial success for digital DRTs requires careful learning from previous implementations. Our implementation of iDRT suggests a better financial proposition compared to an LF bus; in parallel, user journeys are faster, more convenient, and offered at comparable cost.If multiple occupancy taxi journeys are provided alongside, the service is potentially profitable.
A revolution in demand responsive transport is underway, but is not delivering maximum value for the masses. A new integrated approach could leave travellers happier, reduce costs for the public sector and present new profitable services for operators. This report presents tests the feasibility of iDRT.
0 Executive Summary
iDRT’s business model rests on maximising vehicle occupancy, and where implemented, the interaction of taxi and bus user groups. Compared to a traditional LF service, it presents higher risk for significantly higher reward with significant long term potential.This implementation of iDRT presents opportunities to many stakeholders, each presented with a unique value proposition based on their strengths and weaknesses. Similarly, it is versatile with its operational model, enabling many parties to lead on implementation. Global applicability is clear. We call on cities seeking better public transport to take several steps – consider DRT as a mode rather than a technology; identify weaknesses where iDRT may fit; lever iDRT to enable Mobility-as-a-Service in urban areas; rise up to orchestrate change; and above all, be bold with implementations.
iDRT – from our preliminary study – appears to hold great potential. We examine just one implementation, but predict a vision of the future with a rise in a variety of iDRT services, characterised by real time, strategic-scale, integrated, collaboratively-developed, digitally-enabled DRT services. Ultimately, the future of iDRT remains uncertain. The actions of bus companies, digital new entrants, taxi companies and local authorities will govern the path forward, and we challenge these groups with several provocations that we believe will spark a new revolution of DRT - this time benefiting all parties, and shaping cities to be better places to live.

3
1 Introduction

4
Demand Responsive Transport (DRT) is defined as any form of transport where day-to-day service provision is influenced by the demand of the users. With qualities of bus and taxi, the term covers a wide range of vehicular transport solutions; from traditional ‘dial-a-ride’ services that provide social transport booked by phone, to new transport services that allow journeys to be booked through a mobile app.DRT is not a new concept. In developing countries, informal ‘paratransit’ systems are often a key form of urban transport. Within the context of a developed country, until recently DRT had found most success as a rural community transport solution, used where conventional bus services do not exist, often due to their financial instability and requirement for heavy subsidisation. Despite serving this niche, DRT has a mixed legacy of schemes that have been unable to scale (either in size or to a broader user base) nor show long term financial sustainability.
1.1 Demand Responsive Transport
We have created this report to illustrate the viability of a new, integrated approach to DRT - a high-level perspective, valuable to both city authorities and transport operators.
“Kutsuplus’s aspiration was to be the Uber of public transport…ultimately [without investment], it died.” Guardian, Jan 16
“Cities across the USA are cutting public transportation because they think ride-hailing services will fill the gap.” Slate, Dec 16
“The bus industry must innovate or die. We just need someone to stop making excuses, take a chance and be prepared to fail.”Passenger Transport, Feb 17
Times are changing. The development of phone-based demand responsive solutions is transforming the taxi industry. Ride hailing apps have scaled at immense speed to commercial success, but at the same time sparking controversy, conflicts and increased regulation from the public sector. Yet in parallel, cities are beginning to ask the question – how can I use DRT to improve the attractiveness and cost-efficiency of mainstream public transport services?Despite these complimentary interests, parties are not working to move DRT to a strategic element of mass transit systems. DRT, digital or otherwise, is generally implemented as a niche service to provide for particular journey or passenger characteristics without consideration of modal integration or macro transport outcomes. Barriers appear non-trivial. Logistically, DRT offers flexibility and adaptability, at odds with traditional timetables. Culturally, public and private stakeholders are used to transactional relationships, not collaborating for mutual benefits.As digital innovation accelerates and public budgets are squeezed, the future of urban mass transport is under debate.

5
Recent DRT research has tended to focus on technical feasibility – how can an algorithm be optimised to effectively match vehicles to users? We know DRT works technically, but how can we transition the concept to be an integrated, strategic mode? Or iDRT for short. There are many possible ways this could manifest itself in cities of the future, influenced by cultural trends, technological developments and changing mobility markets. These are difficult to predict with certainty. In this study we test one specific opportunity relevant today – replacing low frequency buses with iDRT services connected to the wider transport network. We believe this to be applicable to cities of many sizes, characteristics and geographies.
1.2 Scope of Study
We know DRT works technically, but how can we transition the concept to be an integral part of a transport strategy?
Before
After
The Problem Many cities have a core public transport network with high frequency (“turn up and go”) services which provide convenient and as such, well used services – generally along radial corridors.Most of these cities also operate a number of less frequent services to less dense suburban areas, characterised as providing hourly connectivity rather than accessibility. These low frequency services suffer in almost all cases from low patronage, so are often heavily subsidised and subject to ad-hoc modification or removal.This results in financial burden for local authorities; expensive, poor performing public transport for users and encourages citizens to take private car journeys. Cities suffer negative outcomes through poor air quality, slow economic growth and limitations on urban design (e.g. increased need for parking).
The Proposed SolutionWe propose replacing these inconvenient and financially non-viable low frequency buses with an iDRT service that provides better experiences of a transport system at a lower cost The service is integrated, carrying travellers from sub-urban origins to the high-frequency transport network to continue their journey. On return legs, the system works in reverse. We propose completely replacing low frequency buses, presenting a new strategic mode.
Indirect low frequency buses and direct, high frequency buses operate in parallel.
A DRT service replaces the low frequency bus service, and acts as a connection to the high frequency bus service.
6
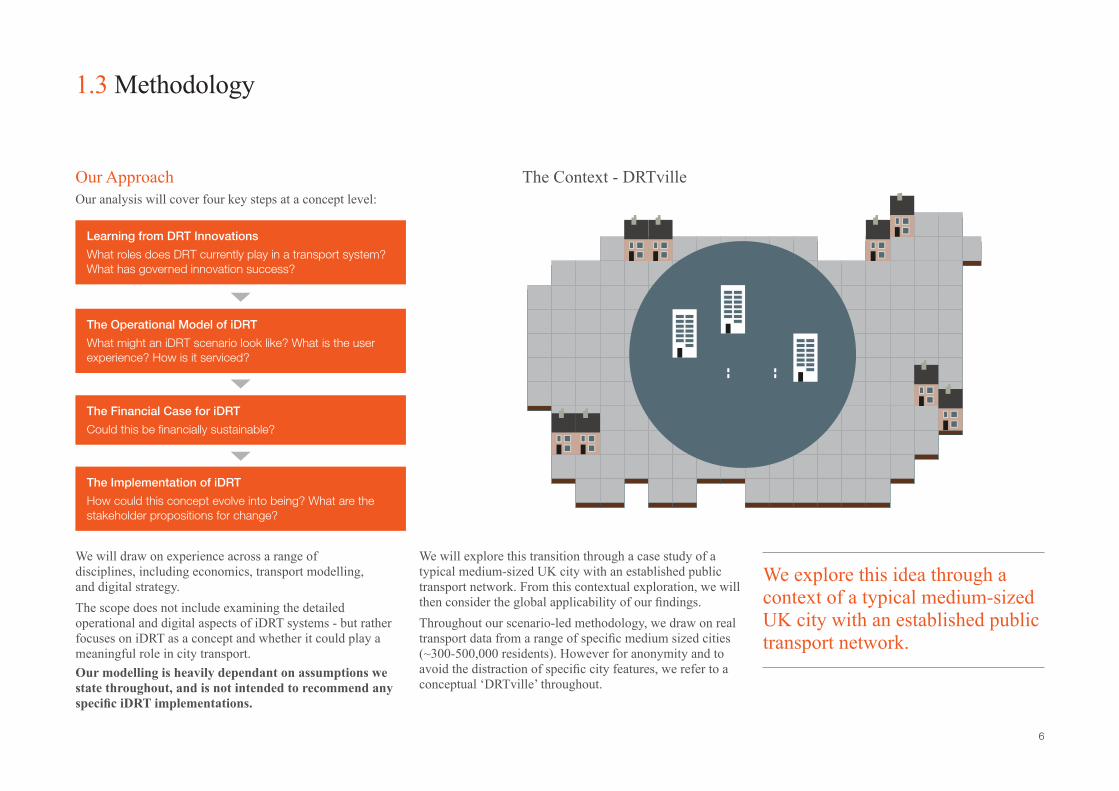
Our ApproachOur analysis will cover four key steps at a concept level:
The Context - DRTville
We will draw on experience across a range of disciplines, including economics, transport modelling, and digital strategy.The scope does not include examining the detailed operational and digital aspects of iDRT systems - but rather focuses on iDRT as a concept and whether it could play a meaningful role in city transport.Our modelling is heavily dependant on assumptions we state throughout, and is not intended to recommend any specific iDRT implementations.
We will explore this transition through a case study of a typical medium-sized UK city with an established public transport network. From this contextual exploration, we will then consider the global applicability of our findings. Throughout our scenario-led methodology, we draw on real transport data from a range of specific medium sized cities (~300-500,000 residents). However for anonymity and to avoid the distraction of specific city features, we refer to a conceptual ‘DRTville’ throughout.
Learning from DRT Innovations
What roles does DRT currently play in a transport system? What has governed innovation success?
The Operational Model of iDRT
What might an iDRT scenario look like? What is the user experience? How is it serviced?
The Financial Case for iDRT
Could this be financially sustainable?
The Implementation of iDRT
How could this concept evolve into being? What are the stakeholder propositions for change?
1.3 Methodology
We explore this idea through a context of a typical medium-sized UK city with an established public transport network.
2 Learning from DRT Innovations

8
2.1 Reviewing Existing DRT
To map the context in which our interpretation of DRT sits, and to draw learning from existing innovations, we will first review some existing DRT services.Historically, DRT was considered a niche tool that - despite its flexibility - had a relatively limited number of forms. However, over the last 10 years it has become an area of increasing diversity. The enabling power of digital technologies has made DRT increasingly appealing to entrepreneurs, resulting in a wealth of new forms, particularly in the taxi market. Within this report, we have reviewed 19 existing digitally-enabled DRT systems across the globe that are currently active, or have been within the last 10 years.
In this section we will:
• Segment the landscape of varying types and interpretations of DRT – forming a taxonomy to fit.
• Illustrate these segments – exploring selected cases studies in detail.• Draw lessons learnt – identifying what governs the success of
DRT systems.
Throughout our report we consider ride-hailing services as a form of DRT.
Our analysis has presented two key variables for segregation of modern digital DRT systems:
• Party capacity – the maximum number of separate parties that can be in a vehicle at one time. This is related to, but distinct from, the number of seats within a vehicle. This ignores any informal sharing within the system.
• Route intelligence – a qualitative scale, demonstrating the degree to which data is used within the DRT routing.
From this we have formed a taxonomy of DRT, illustrated with some of the case studies examined.
Fixed
iDRT
2-6
7+
1
LOW HIGH
Redefined periodically
Route Intelligence
Taxonomy of Digitally-Enabled Demand Responsive Transport
Party
Cap
acity
Redefined in real-time
Redefined in real-time and in interaction with external transport modes
Didi Bus
iDRT sits in the top right segment of our taxonomy - high party capacity with real-time, integrated route intelligence.
LOW
HIG
H
Conventional bus
Car share
Dial-a-ride

9
2.2 Case Studies of DRT
This section provides brief overviews of selected case studies, categorised by their place in the taxonomy. A full list of all services reviewed in this study, along with detailed case study information and references, can be found in the Appendix.
Uber
Didi Chuxing
Split
Slide
Chariot
Uber Sunrail
One of the first and now largest ride-hailing DRT service, Uber spread the concept of smartphone ride-hailing. Enjoying phenomenal growth, Uber has made some enemies in incumbents and local authorities, but more recently has made efforts to share data with cities, promising a vision of ‘transportation as reliable as running water.’
Didi Chuxing is major ride-hailing DRT service focused on China, serving around 400 million of the country’s population. Didi is categorised here by its original taxi-hailing services, but the company has since diversified to include ride sharing and bike sharing.
Launched in Washington DC, Split billed itself as a low-cost alternative to existing services. Despite initial success, the service discontinued in 2016. This was attributed to the saturated market and ongoing price war between Lyft and Uber.
Slide is branded as a ‘ride to work’ transport service, established in 2016, operating in Bristol. The service targets the heavily congested morning and evening peak hours along major commuter routes. Pick up and drop off locations can require a short walk for passengers, but are designed to make more optimal routes for drivers.
Chariot is a commuter-targeted service, operating within the city of San Francisco, USA. The service currently operates along 25 set routes during the morning and evening commute hours, transporting between 700 and 1000 people a day.
Uber Sunrail began as a way of connecting residents of Altamonte Springs to and from a new railway system via Uber. The city government subsidises the scheme as an alternative to a bus service (Flexbus). Whilst Flexbus cost the city $1.5 million per year, the Uber pilot was budgeted at just $500,000.
Years operating: 8Vehicle size: 4-6 passengersLocations: >66 countries, 545 citiesValue: $60+ billion (2017)
Years operating: 5 Vehicle size: VariousLocations: 400 cities in ChinaValue: $35 billion (2016)
Years operating: 1.5Vehicle size: 4-6 passengersLocations: Washington DC, USA
Years operating: 1Vehicle size: 6 passengersLocation: Bristol, UK
Years operating: 3 Vehicle size: 14 passengersFleet size: 150 vehicles Location: San Francisco, USA
Years operating: 1Vehicle size: 1-4 passengersLocations: 5 cities in Florida, USA
DRT services demonstrate great variety in scale and offering, but very few demonstrate conscious interaction with the public transport network.
iDRT
iDRT
iDRT
iDRT
iDRT
iDRT

10
2.3 Lessons Learnt
Through detailed analysis and comparison of the case studies, we have identified a number of key learnings that govern the success of a DRT concept. These lessons are valuable steering for our specific implementation of DRT.
Efficiency in Occupancy Steer Expectations Permanence is King Know Your PropositionA number of techniques around service design have been applied to ride-hailing fleets to boost the number of riders served by a given vehicle.
Users have had varied expectations of what a DRT service is. In some situations this has lead to poor user opinion and uptake – communication is key.
For a viable solution it is important for a DRT service to maintain a certain market penetration in order to be seen as a ‘go-to’ option rather than a temporary part of a transport network.
Realising the niche of a DRT service is important for fully understanding its unique offering and the key competitors for that market segment.
Slide operates purely in commuter hours, in a fixed zone, to increase occupancy and reduce costs.
Uber Sunrail saw a 10 fold passenger increase on the Sunrail commuter train in the first 6 weeks of a partnership involving geo-locational discounts.
Uber, the originator of surge (real-time) pricing, has found itself under the spotlight when public safety incidences have lead to huge fares for users.
Ride Leap found itself caught between the city and the state as to who had the right to approve it – contributing to the business’s demise.
Kutsuplus found itself serving a large operational area with limited buses. The combination meant users could not depend on the service – stifling growth.
Many DRTs have undertaken autonomous vehicle investment, either internally or through partnerships – including Gett, Uber, Lyft and Didi.
Split launched in Washington DC, and found itself in a crowded market, with its unique offering of low cost squashed by the Uber – Lyft price war.
Bridj has diversified its offering beyond passengers to provide a delivery service during the evening for convenience goods.
Collaborate for Mutual Value
Stay on the Right Side of Regulation
Autonomous Vehicles are Looming
Diversification for Resilience
Market demand for point-to-point DRT exists, but integrating with additional modes creates a unique value offering for both public and private stakeholders, as our report sets out to examine.
DRT services are a unique commercial proposition, so often they have to drive new legislation. Laws can be archaic and ambiguous in their application. Without careful navigation and influence this can end a business.
There is no definite answer as to when fully autonomous vehicles will enter the market, but one thing that is certain, when they become mainstream it will be a game-changer for DRT services.
If an established DRT service already has overcome the main technological and business challenges of the market, it can capitalise on economies of scope, expanding to new offering to new customer segments.
Digitally-enabling a DRT system is not a gauranteed path to commercial success. A number of user, operational and political risks must be addressed.
11
3 The Operational Model of iDRT

12
3.1 DRTville Today
Business as UsualIn this section we briefly paint the picture of DRTville as it stands. The transport characteristics of DRTville are typical of a medium-sized UK city – low-occupancy, private car dominated, a bus network of mixed quality and a small quantity of active travel. We present this data to illustrate the context within which we will be designing an iDRT implementation.
Transport Modes
Modal Use – Travel to Work
Car Driver59.1%
Taxi0.5%
Rail3.6%
Car Passenger5.3%
Bicycle3.8% Walk
16.1%
Other1.1%
HF Bus10.0%
LF Bus0.6%
There are a number of high frequency (HF) bus services operating on the main radial corridors and with <1 hour, but mainly <15 min frequency. These services are well used, financially viable, and typically direct. They operate 6am – midnight.
There a number of low frequency (LF) bus services that operate at ~1 hour frequency and provide a relatively indirect and slow service into the city centre. The operating period is 7am to 7pm and hence much shorter than the core high frequency network. Many of these services struggle to breakeven.
DRTville features a significant taxi market, on par with a UK city of its size. These offer quick and direct transport to any location, but are expensive. The emergence of ride hailing DRT apps have undercut pre-existing services, but not to a transformative degree (~10-20% savings).
Private car use is very common in DRTville, a primary mode of transport for many individuals and used to service a great variety of journey types. Motivations for use are complex, and span short-term absences of viable alternatives to longer term cultural associations.
Active travel modes exist, comprising of walking and cycling, with typical travel distances and in DRTville reflecting the national averages; a maximum of 2km for walking and 5km for cycling. Barriers include steep gradients, weather conditions and provision of good footway and cycleway infrastructure.
DRTville does not enjoy a metro system, and intra-urban rail, while competent, serves a very limited part of the system.
DRT exists only in the form of ride-hailing apps (classified under taxi) and a few dial-a-ride schemes. Neither are of a perceptible penetration at a city scale no recorded in official data.
DRTville’s transport system is characterised by high levels of low-occupancy private car use, a bus network of mixed quality and a small quantity of active travel.
13
3.2 iDRT in DRTville
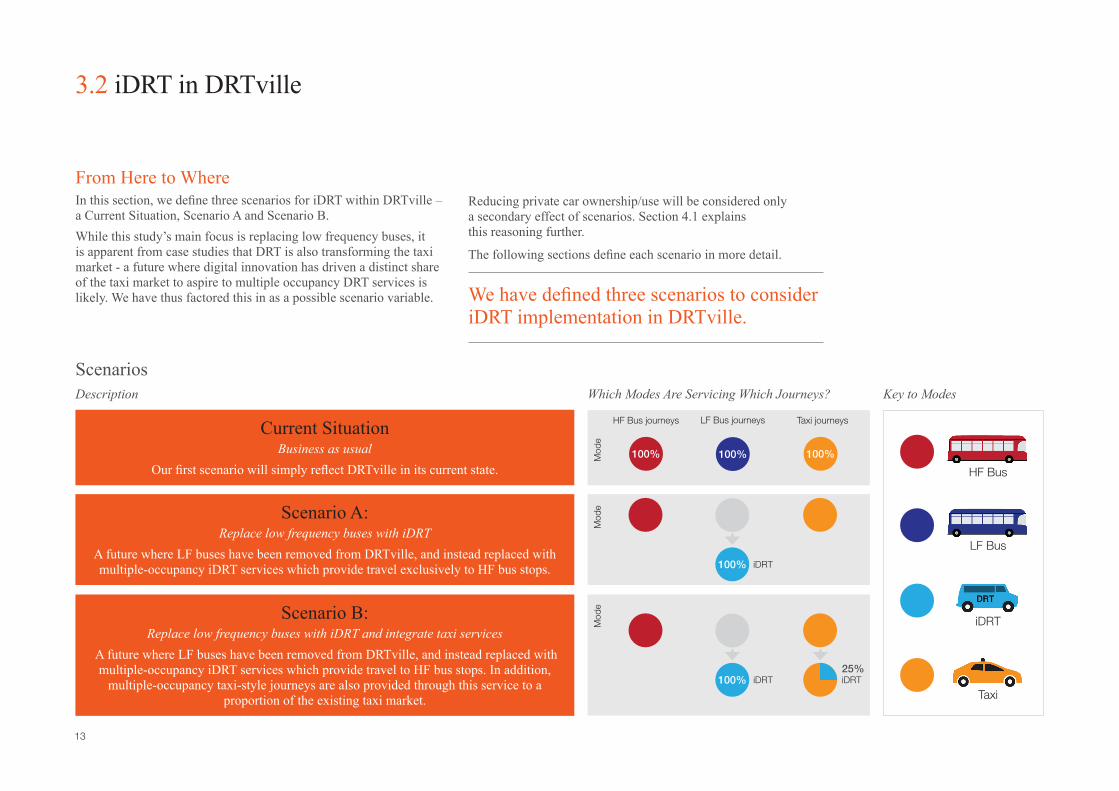
From Here to WhereIn this section, we define three scenarios for iDRT within DRTville – a Current Situation, Scenario A and Scenario B.While this study’s main focus is replacing low frequency buses, it is apparent from case studies that DRT is also transforming the taxi market - a future where digital innovation has driven a distinct share of the taxi market to aspire to multiple occupancy DRT services is likely. We have thus factored this in as a possible scenario variable.
ScenariosWhich Modes Are Servicing Which Journeys? Key to ModesDescription
We have defined three scenarios to consider iDRT implementation in DRTville.
Current SituationBusiness as usual
Our first scenario will simply reflect DRTville in its current state.
Scenario A:Replace low frequency buses with iDRT
A future where LF buses have been removed from DRTville, and instead replaced with multiple-occupancy iDRT services which provide travel exclusively to HF bus stops.
Scenario B:Replace low frequency buses with iDRT and integrate taxi services
A future where LF buses have been removed from DRTville, and instead replaced with multiple-occupancy iDRT services which provide travel to HF bus stops. In addition,
multiple-occupancy taxi-style journeys are also provided through this service to a proportion of the existing taxi market.
Reducing private car ownership/use will be considered only a secondary effect of scenarios. Section 4.1 explains this reasoning further.
The following sections define each scenario in more detail.
HF Bus journeys
Mod
eM
ode
Mod
e
LF Bus journeys Taxi journeys
100% 100% 100%
iDRT
iDRT
iDRT iDRT
Taxi
HF Bus
LF Bus
100%
100%25%

14
3.3 Scenarios
Scenario
Current SituationOur first scenario will be a direct representation of the current situation in DRTville.
Transport NetworkAccess to public transport varies wildly depending on your location. In general, journeys along a single arterial routes are well served, but connections across the centre, or any journeys originating or terminating outside of an arterial route are poorly served.
User ExperienceFor people with access to an HF bus, transport provision is good, providing your journey is arterial in nature.
For those only within walking distance of an LF bus, transport provision is slow, infrequent, and of limited operating hours. There is also less effective multi-modal integration (such as with trains) for LF buses compared to HF. For non-arterial routes, taking a bus into the centre and a second back out again is possible. However this is slow, and with non-integrated tickets, is also relatively expensive.
Taxis are an alternative option for radial routes but these journeys – while fast – are very expensive. Taxis also stand as the only non-private mode for certain destinations unserved by either LF and HF buses.
Walk [10min]
In-Bus time [30min]
Wait time [15min](1 Bus per hour)
Generalised cost [55min] (Travel time)
Wait [5min]
In-Taxi Time [30min]
Generalised cost [35min] (Travel time)
cd
a
Walk [10min]
In-Bus time [30min]
Wait time [15min](1 Bus per hour)
Generalised cost [55min] (Travel time)
Wait [5min]
In-Taxi Time [30min]
Generalised cost [35min] (Travel time)
cd
a
Walk [10min]
In-Bus time [30min]
Wait time [15min](1 Bus per hour)
Generalised cost [55min] (Travel time)
Wait [5min]
In-Taxi Time [30min]
Generalised cost [35min] (Travel time)
cd
a
Network Overview
User Journeys
Modes Servicing JourneysHF Bus journeys LF Bus journeys Taxi journeys
100% 100% 100%X

15
iDRT: Replace low frequency busesTo form this scenario, the city is segmented in to zones where an LF bus is the nearest public transport mode. In practice these areas may be larger than the effectual catchment zones for LF bus if it is too far for a hypothetical user to walk. In Scenario A, theses LF buses are removed. In its place a multiple occupancy iDRT service operates across the zones. A vehicle collects people at request, and drops them to the nearest HF bus stop. This applies to all LF buses – removing 11 LF routes in DRTville.
Transport NetworkAn iDRT vehicle has to operate within an operational zone. They can switch zones to meet changes in demand, but they can never perform journeys that finish at any points other than an HF node. The system requires careful management to ensure the fleet maintains sufficient spread across the zones. This service operates the same hours as the HF bus; 6am – midnight.
HF buses now enjoy greater patronage – thanks to the iDRT dropping off new customers at their stops.
The taxi market continues as usual – a few customers who would have taxied to a HF bus may switch, but this is negligible for the purposes of our study.
User ExperienceLF bus users have a transformed experience. Wait times are reduced, hours of operation are increased and overall journey is likely faster, as an HF bus and DRT combination is typically a more direct journey than an LF bus by itself.
Taxi users travelling to nearby HF bus routes will enjoy a new option through which to do so, but in general the taxi market will remain unaffected.
Walk [10min]
In-Bus time [20min]
Wait time [30min](1 Bus per hour)
Generalised cost [60min] (Travel time)
Walk [5min]
In-DRT [10min]
In-Bus [15min]
Wait [5min]
Generalised cost [40min] (Travel time)
Wait [5min]DRT
DRT
cd
a
DRT
DRT
Walk [10min]
In-Bus time [20min]
Wait time [30min](1 Bus per hour)
Generalised cost [60min] (Travel time)
Walk [5min]
In-DRT [10min]
In-Bus [15min]
Wait [5min]
Generalised cost [40min] (Travel time)
Wait [5min]DRT
DRT
cd
a
DRT
DRT
Network Overview
User Journeys
A
Modes Servicing JourneysHF Bus journeys LF Bus journeys Taxi journeys
100%
Scenario
16
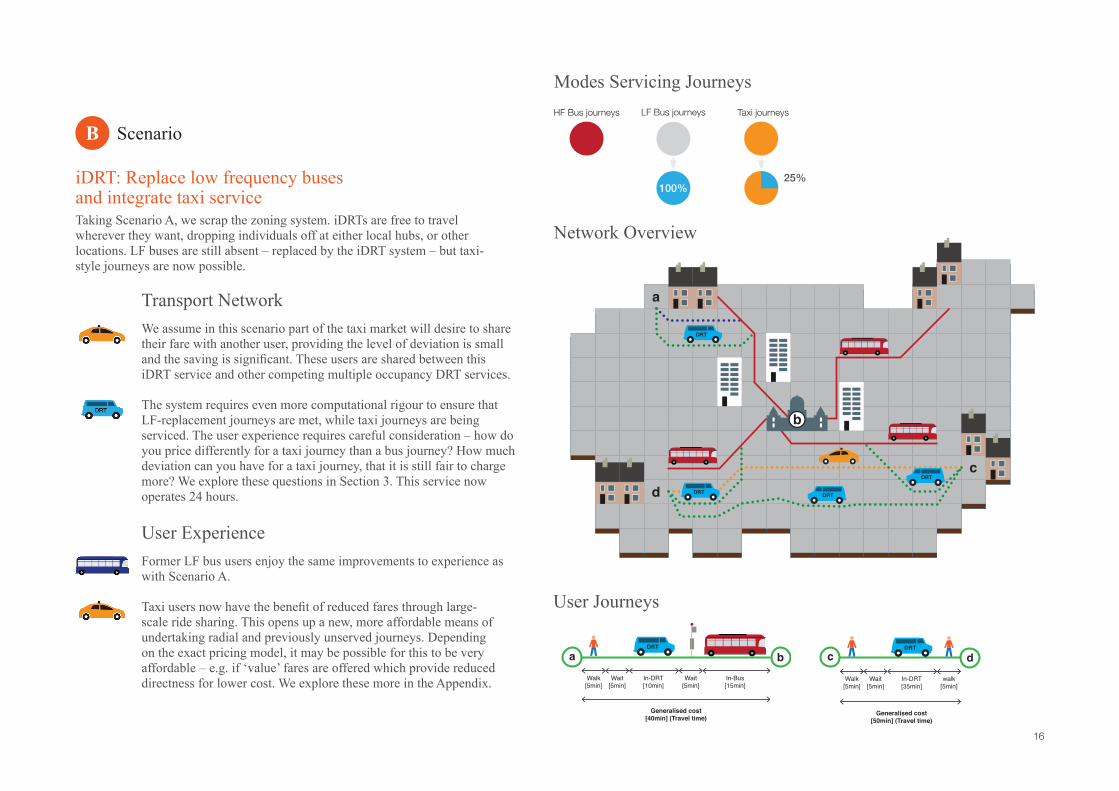
iDRT: Replace low frequency buses and integrate taxi serviceTaking Scenario A, we scrap the zoning system. iDRTs are free to travel wherever they want, dropping individuals off at either local hubs, or other locations. LF buses are still absent – replaced by the iDRT system – but taxi-style journeys are now possible.
Transport NetworkWe assume in this scenario part of the taxi market will desire to share their fare with another user, providing the level of deviation is small and the saving is significant. These users are shared between this iDRT service and other competing multiple occupancy DRT services.
The system requires even more computational rigour to ensure that LF-replacement journeys are met, while taxi journeys are being serviced. The user experience requires careful consideration – how do you price differently for a taxi journey than a bus journey? How much deviation can you have for a taxi journey, that it is still fair to charge more? We explore these questions in Section 3. This service now operates 24 hours.
User ExperienceFormer LF bus users enjoy the same improvements to experience as with Scenario A.
Taxi users now have the benefit of reduced fares through large-scale ride sharing. This opens up a new, more affordable means of undertaking radial and previously unserved journeys. Depending on the exact pricing model, it may be possible for this to be very affordable – e.g. if ‘value’ fares are offered which provide reduced directness for lower cost. We explore these more in the Appendix.
Walk [5min]
In-DRT [10min]
In-Bus [15min]
Wait [5min]
Generalised cost [40min] (Travel time)
Wait [5min]
DRT
Walk [5min]
In-DRT [35min]
Wait [5min]
Generalised cost [50min] (Travel time)
walk [5min]
DRT
cd
a
DRT
DRT
DRT
DRT
Walk [5min]
In-DRT [10min]
In-Bus [15min]
Wait [5min]
Generalised cost [40min] (Travel time)
Wait [5min]
DRT
Walk [5min]
In-DRT [35min]
Wait [5min]
Generalised cost [50min] (Travel time)
walk [5min]
DRT
cd
a
DRT
DRT
DRT
DRT
Walk [5min]
In-DRT [10min]
In-Bus [15min]
Wait [5min]
Generalised cost [40min] (Travel time)
Wait [5min]
DRT
Walk [5min]
In-DRT [35min]
Wait [5min]
Generalised cost [50min] (Travel time)
walk [5min]
DRT
cd
a
DRT
DRT
DRT
DRT
Network Overview
User Journeys
B
Modes Servicing JourneysHF Bus journeys LF Bus journeys Taxi journeys
100%25%
Scenario
17
3.4 iDRT User Perspective
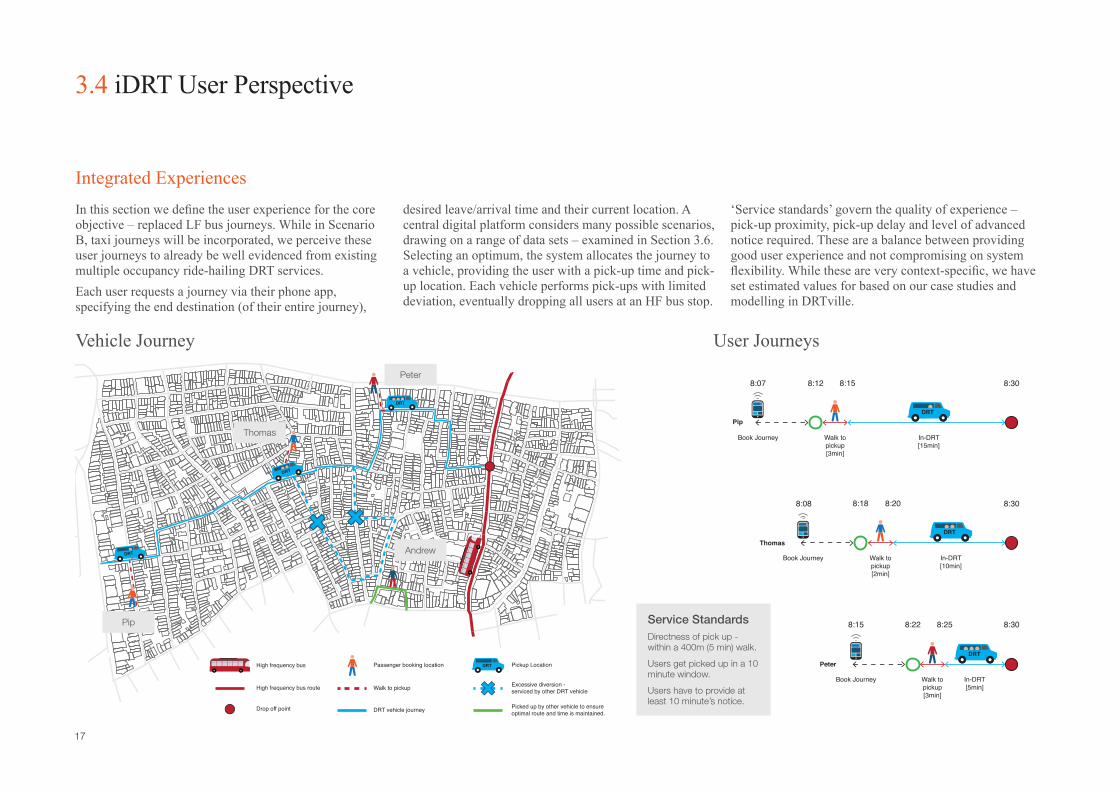
In this section we define the user experience for the core objective – replaced LF bus journeys. While in Scenario B, taxi journeys will be incorporated, we perceive these user journeys to already be well evidenced from existing multiple occupancy ride-hailing DRT services. Each user requests a journey via their phone app, specifying the end destination (of their entire journey),
desired leave/arrival time and their current location. A central digital platform considers many possible scenarios, drawing on a range of data sets – examined in Section 3.6. Selecting an optimum, the system allocates the journey to a vehicle, providing the user with a pick-up time and pick-up location. Each vehicle performs pick-ups with limited deviation, eventually dropping all users at an HF bus stop.
‘Service standards’ govern the quality of experience –pick-up proximity, pick-up delay and level of advanced notice required. These are a balance between providing good user experience and not compromising on system flexibility. While these are very context-specific, we have set estimated values for based on our case studies and modelling in DRTville.
Integrated Experiences
Vehicle Journey User Journeys
DRTPassenger booking location
Walk to pickup
DRT vehicle journey
Pickup Location
Excessive diversion - serviced by other DRT vehicle
Picked up by other vehicle to ensure optimal route and time is maintained.
High frequency bus
High frequency bus route
Drop off point
DRT
DRT
DRT
DRT
DRT
DRTPeter
Book Journey In-DRT [5min]
Walk to pickup [3min]
Book Journey
8:308:158:128:07
8:308:208:188:08
8:308:258:228:15
Walk to pickup [3min]
Pip
In-DRT [15min]
Thomas
Book Journey In-DRT [10min]
Walk to pickup [2min]
Service StandardsDirectness of pick up - within a 400m (5 min) walk.
Users get picked up in a 10 minute window.
Users have to provide at least 10 minute’s notice.
Peter
Thomas
Andrew
Pip

18
3.5 iDRT Infrastructure
The viability of a DRT system heavily depends on the efficiency of allocation of trips to vehicles. As few vehicles as possible must be used to service demand, to minimise cost, whilst maintaining service standards. The use of a central digital platform that combines datasets – both internal and external – can rapidly simulate different scenarios to converge upon an optimal solution. An illustrative digital architecture is shown below.
The simulation opposite demonstrates how DRT routes manifest themselves in the replacement of a low frequency bus route. Some routes are similar to the original LF route, others span a connecting journey between two HF routes. The common factor is diversity, and a degree of deviation from a traditional, predefined route.
Optimising Resources
Digital Architecture
Vehicle Journeys – LF Users
• Origin• Desired arrival time• Desired arrive location• Payment details
• Expected traffic levels• Current traffic levels• HF bus movements
• Routing• Pick-ups• Breaks• Salary/Commission
• Pick-up time• Pick-up location
• Demand by area*
*only in Scenario B
The viability of a DRT system heavily depends on the efficiency of allocation of trips to vehicles.
KEY
Replaced Low Frequency Bus Route
High Frequency Bus Route
DRT Vehicle Routing 1
DRT Vehicle Routing 2
DRT Vehicle Routing 3
Passenger Pick-up Location
DRT
CD
A
DRT
DRT
Digital platform
User requestsOffline drivers
External dataWorking drivers
• Real time position

19
4 The Financial Case for iDRT
20
4.1 Potential Markets
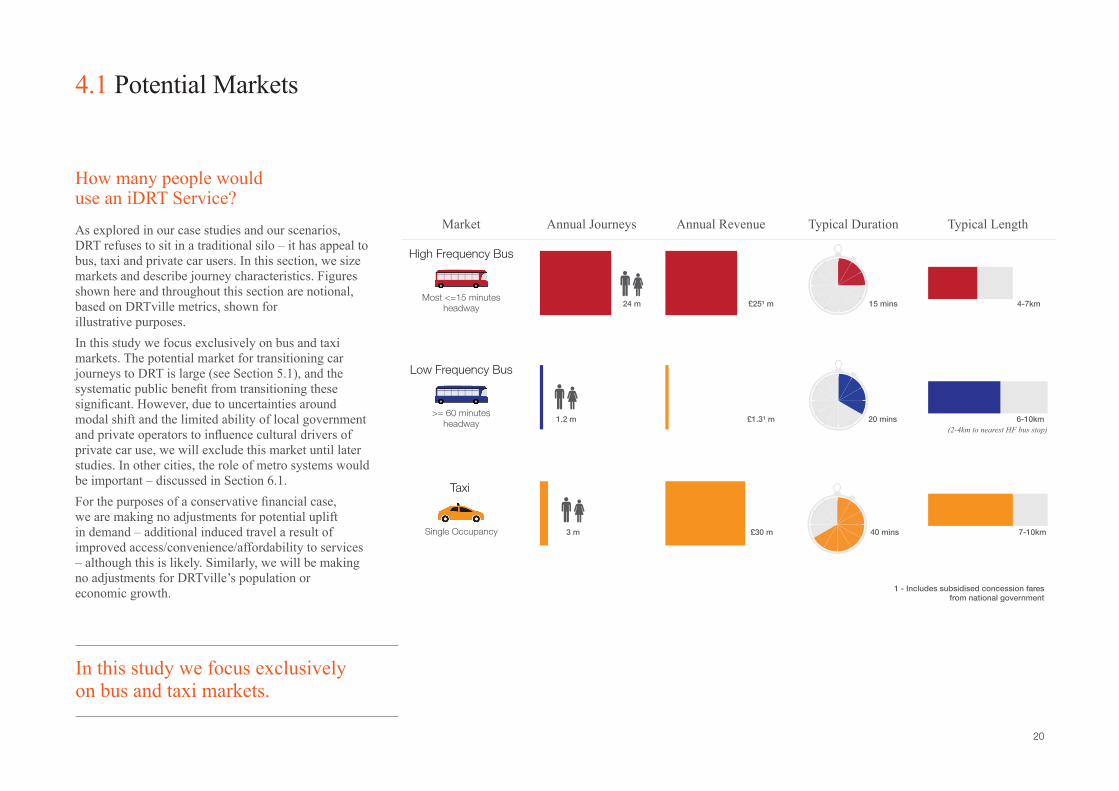
As explored in our case studies and our scenarios, DRT refuses to sit in a traditional silo – it has appeal to bus, taxi and private car users. In this section, we size markets and describe journey characteristics. Figures shown here and throughout this section are notional, based on DRTville metrics, shown for illustrative purposes.In this study we focus exclusively on bus and taxi markets. The potential market for transitioning car journeys to DRT is large (see Section 5.1), and the systematic public benefit from transitioning these significant. However, due to uncertainties around modal shift and the limited ability of local government and private operators to influence cultural drivers of private car use, we will exclude this market until later studies. In other cities, the role of metro systems would be important – discussed in Section 6.1. For the purposes of a conservative financial case, we are making no adjustments for potential uplift in demand – additional induced travel a result of improved access/convenience/affordability to services – although this is likely. Similarly, we will be making no adjustments for DRTville’s population or economic growth.
How many people would use an iDRT Service?
In this study we focus exclusively on bus and taxi markets.
Market Annual RevenueAnnual Journeys Typical Duration Typical Length
Single Occupancy
Taxi
>= 60 minutesheadway
Low Frequency Bus
Most <=15 minutesheadway
High Frequency Bus
1.2 m
3 m
24 m
£1.3¹ m
£30 m
£25¹ m
20 mins 6-10km
40 mins
15 mins 4-7km
7-10km
(2-4km to nearest HF bus stop)
1 - Includes subsidised concession faresfrom national government

21
4.2 iDRT Cost Elements
The DRT innovation we have observed in the taxi sector is being enabled in part by digital innovation – we have discussed how digital systems can minimise cost by design in Section 3.6. However, our case studies have shown this does not instantly translate to a “low cost” business for an operator. Here we review the overall cost structure for an iDRT system and key costing decisions.
Illustrative estimations averaged across Scenario A and B.
Driver cost is estimated at >50% of total iDRT cost. As such, in addition to efficiency of allocation (discussed in Section 3.6), vehicle size and staffing are important decisions.
Commission models are more efficient, but do not guarantee that staffing will be met, particularly if the service is new or unusual and freelance drivers need convincing. As such, a salary model has been specifically chosen for A.
In our spatial analysis, 6 seaters are the maximum size possible to maintain an adequate spread of vehicles to meet service standards (response times, journey times), so is chosen for A and B.
What does it take to deliver an iDRT system?
Key Decisions
Cost Structure
The cost of the driver’s time is the main cost element of iDRT.
• Higher operator risk• Security of job• Instant staff force• Less flexible supply
• Lower operator risk• Social issues with zero-hour contracts• Needs definitive, reliable labour market• Flexible supply of staff
• Reduced spatial coverage• Slower response for users• More deviation for users• Lower costs• Likely need to be
provided by operator
• Increased spatial coverage• Faster response for users• Less deviation for users• Higher costs• Common in pre-existing
taxi driver base
Staffing the Fleet
Vehicle Size vs. Coverage
A B
CommissionPermanent Salary
A B
16-seater4-seater 6-seater
Driver
Overheads(including
technology)
Maintenance
Vehicle
Fuel

22
4.3 iDRT Operating Costs
This section applies the costs of iDRT to our scenarios.In Scenario A, a significant saving is observed in the total cost of providing iDRT shuttle journeys over traditional journeys to LF bus users. In Scenario B, this saving is larger, attributable to increased economies of scale from the new taxi users and staffing efficiencies in commission models. Taxi journeys – typically much longer – are significantly more constantly to service per ride, but are notably cheaper through iDRT than a traditional taxi due to increased occupancy. By bringing in an additional market, the total cost of B is higher than the Current Situation.
Can iDRT save money?Current situation
Walk [10min]
In-Bus time [30min]
Wait time [15min](1 Bus per hour)
Generalised cost [55min] (Travel time)
Wait [5min]
In-Taxi Time [30min]
Generalised cost [35min] (Travel time)
cd
a
Tota
l Op
erat
ing
Co
st (£
m)
6.0
5.0
4.0
3.0
2.0
1.0
-
30 LF Buses
1000 Taxis
0 DRTs
Scenario A
A
A
Walk [10min]
In-Bus time [20min]
Wait time [30min](1 Bus per hour)
Generalised cost [60min] (Travel time)
Walk [5min]
In-DRT [10min]
In-Bus [15min]
Wait [5min]
Generalised cost [40min] (Travel time)
Wait [5min]DRT
DRT
cd
a
DRT
DRT
0 LF Buses
1000 Taxis
24 6-seater iDRTs
Scenario B
B
Walk [5min]
In-DRT [10min]
In-Bus [15min]
Wait [5min]
Generalised cost [40min] (Travel time)
Wait [5min]
DRT
Walk [5min]
In-DRT [35min]
Wait [5min]
Generalised cost [50min] (Travel time)
walk [5min]
DRT
cd
a
DRT
DRT
DRT
DRT
0 LF Buses
750 Taxis
49 6-seater iDRTs
BB
Scenario A
- iDRT LF
Current Situation
- LF Bus
Scenario B
- iDRT LF
Scenario B
- iDRT Taxi
significantsaving
significantsaving
X
X
An iDRT system could offer significant cost savings compared to the operation of an LF bus.

23
4.4 Example User Journeys Switching to iDRT
Indicative costs for our system have now been established, but before a price can be set for the service, we need to understand what will make a viable customer proposition. The DRT systems studied in our case studies show great disparity in price, suggesting a DRT fare is governed by many factors.In this section we return to the user journeys of DRTville and compare experiences and pricing - before and after. In each journey, we have speculated what we believe is a reasonable average journey fare for different iDRT journeys, considering journey time, cost of servicing, and a qualitative assessment of the ‘cost and convenience of different journeys. At this stage we do not explore tariffs see the Appendix – but where applicable we consider allocation to different operators on multimodal journeys.
Pricing Experiences Low Frequency Bus Users – Scenario &
Taxi Users – Scenario
Walk [10min]
In-Bus time [30min]
Wait time [15min](1 Bus per hour)
Generalised cost [55min] (Travel time)
Wait [5min]
In-Taxi Time [30min]
Generalised cost [35min] (Travel time)
cd
a
Walk [10min]
In-Bus time [20min]
Wait time [30min](1 Bus per hour)
Generalised cost [60min] (Travel time)
Walk [5min]
In-DRT [10min]
In-Bus [15min]
Wait [5min]
Generalised cost [40min] (Travel time)
Wait [5min]DRT
DRT
cd
a
DRT
DRT
Walk [10min]
In-Bus time [30min]
Wait time [15min](1 Bus per hour)
Generalised cost [55min] (Travel time)
Wait [5min]
In-Taxi Time [30min]
Generalised cost [35min] (Travel time)
cd
a
Walk [5min]
In-DRT [10min]
In-Bus [15min]
Wait [5min]
Generalised cost [40min] (Travel time)
Wait [5min]
DRT
Walk [5min]
In-DRT [35min]
Wait [5min]
Generalised cost [50min] (Travel time)
walk [5min]
DRT
cd
a
DRT
DRT
DRT
DRT
iDRT
iDRT
Convenienceand Comfort
35 min
£11.30
Convenienceand Comfort
60 min
£1.50
Convenienceand Comfort
40 min
£2.00Allocated
(£1.50 iDRT, £0.50 HF Bus)
50 min
Convenienceand Comfort
£6.00
Previous LF bus users can enjoy better quality services for similiar fare; previous taxi users can enjoy significant savings for minimal reduction in experience.
/Scenario
Scenario

24
4.5 Revenue
In this section we apply our fares to the scenarios to estimate revenues. In Scenario A, iDRT’s revenue stream is principally identical to LF buses in the current situation. In Scenario B, revenue from taxi users is a far more significant stream. Throughout all scenarios, LF bus users represent a small part of the DRTville’s public transport revenue.It is important to note that in Scenario B the taxi market is not being ‘destroyed’. Users are transitioning to lower shared vehicle fares in a iDRT system, but from a driver perspective, total revenue per km is expected to increase.In our analysis we assume linear time and distance fares for taxi and iDRT-Taxi users; traditional ‘stepped’ fares for LF bus and iDRT-LF users. We explore tariffs that allow separate rates for iDRT-Taxi and iDRT-LF journeys in more detail in the Appendix. As discussed previously, our analysis assumes no influence of price elasticity; that is to say, demand is constant regardless of fare price. All figures are for illustrative purposes only.
Totalling Income
36.0
33.0
30.0
27.0
24.0
6.0
3.0
-
Fare revenue HF bus users Fare revenue LF bus users Fare revenue taxi users
25% of taxi users transfered to iDRT.
Current Scenario
£m
Taxi LF Bus HF Bus iDRT
Scenario
Taxi LF Bus HF Bus iDRT Taxi LF Bus HF Bus iDRT
Current situation
Walk [10min]
In-Bus time [30min]
Wait time [15min](1 Bus per hour)
Generalised cost [55min] (Travel time)
Wait [5min]
In-Taxi Time [30min]
Generalised cost [35min] (Travel time)
cd
a
Scenario A
A
Walk [10min]
In-Bus time [20min]
Wait time [30min](1 Bus per hour)
Generalised cost [60min] (Travel time)
Walk [5min]
In-DRT [10min]
In-Bus [15min]
Wait [5min]
Generalised cost [40min] (Travel time)
Wait [5min]DRT
DRT
cd
a
DRT
DRT
Scenario B
B
Walk [5min]
In-DRT [10min]
In-Bus [15min]
Wait [5min]
Generalised cost [40min] (Travel time)
Wait [5min]
DRT
Walk [5min]
In-DRT [35min]
Wait [5min]
Generalised cost [50min] (Travel time)
walk [5min]
DRT
cd
a
DRT
DRT
DRT
DRT
X
A BX
100% of LF bus users transitioned to iDRT.

25
4.6 Financial Summary
In this section we summarise the overall financial case for iDRT, drawing on the earlier sections. In Scenario A the financial case is mixed – costs are notably lower for the provision of transport for LF bus users, but as a business we estimate it would struggle to breakeven. In Scenario B, while the overall expenditure is higher to operate the system, we believe it presents a viable profit. It is important to note that the taxi and bus markets are fragmented by several players, whereas the iDRT market could feasibly be run by one operator. LF bus users may never represent a large market financially, but in the Current Situation, they represent a substantial net loss – a situation that can be turned around with iDRT. The HF bus company benefits from higher revenue – from new passengers – throughout A & B.
Commercial Proposition
40.0
35.0
30.0
25.0
20.0
15.0
10.0
5.0
-
-5.0
Fare
Cost
Net
Taxi LF Bus HF Bus Taxi LF Bus HF Bus iDRT Taxi LF Bus HF Bus iDRT
£m
Approx-10%Profit
Approx-100%Profit
Approx10%Profit
10% profitassumption
10% profitassumption
10% profitassumption
10% profitassumption
X
Profitability of iDRT as a service is consistently superior to an LF bus, but margins are heavily scenario dependent.
A BX
Current situation
Walk [10min]
In-Bus time [30min]
Wait time [15min](1 Bus per hour)
Generalised cost [55min] (Travel time)
Wait [5min]
In-Taxi Time [30min]
Generalised cost [35min] (Travel time)
cd
a
Scenario A
A
Walk [10min]
In-Bus time [20min]
Wait time [30min](1 Bus per hour)
Generalised cost [60min] (Travel time)
Walk [5min]
In-DRT [10min]
In-Bus [15min]
Wait [5min]
Generalised cost [40min] (Travel time)
Wait [5min]DRT
DRT
cd
a
DRT
DRT
Scenario B
B
Walk [5min]
In-DRT [10min]
In-Bus [15min]
Wait [5min]
Generalised cost [40min] (Travel time)
Wait [5min]
DRT
Walk [5min]
In-DRT [35min]
Wait [5min]
Generalised cost [50min] (Travel time)
walk [5min]
DRT
cd
a
DRT
DRT
DRT
DRT
X
LF F
are
LF C
ost
iDR
T Fa
re
iDR
T Fa
re
Taxi
Far
eTa
xi C
ost
LF F
are
LF C
ost
Complete removal of LF buses.
Uplift in revenue (at no cost) from iDRT LF fare split.
Emergence of iDRT serving exclusively LF bus users.
25% reduction in market size due to transition of users to iDRT.
Increased uplift in revenue (at no cost) due to increased split of iDRT LF fare.
Expansion of iDRT service to capture 25% of taxi market.

26
27
5 Implementation of iDRT

28
5.1 Business Model
The commercial strategy for iDRT rests on two reinforcing loops. Firstly, the number of vehicles must be minimised to create costs that do not surpass a viable fare in the eyes of LF bus users.In tandem, a large capture of LF bus users creates a significant user base who endorse the service by trusting it with regular journeys. This publicity attracts value-orientated segments of the taxi market. Despite enjoying a cost saving, they represent a substantial income for the iDRT service, in effect subsidising LF bus users. This business model is not without risk. An effective scale and consistency is necessary from the outset – customers are likely to be unforgiving with operational shortcomings, particularly in early use. This is amplified by the need for collaboration between iDRT and HF buses, logistically and commercially. Despite the increased risk, commercial possibilities are significant. The service – for now – is a unique offering in DRTville, and all other cities within the UK. The future possibility to attract car users presents a growth market 10 times the size of that examined in this study.
Risk for Reward
iDRT’s business model carefully balances two reinforcing loops. It trades slightly increased risk for far higher reward, and has significant long term potential.
Market Comparison Business Model Evaluation
(illustrative purposes only)
Total number of annual journeys by mode in DRTville.
1,200,000
LF Bus
3,000,000
Taxi
46,000,000
Private Car
• Highly reliant on collaboration.
• Competition from fast moving DRT new entrants.
• Critical masses – density, patronage and geographical coverage.
• Operational reliability crucial to viability
• Unique service. • Significant growth
opportunities – both car users and induced LF users.
• Early partnerships can increase barriers to entry for competitors.
• Likely support from policy makers
StrengthsWeaknesses
Commercial SustainabilityMaintain iDRT LF bus fares close to previous
experiencesGather higher margin
taxi user fares
Raise coverage and publicity
Minimise costs
Minimise vehicle numbers Reinforcing loop Reinforcing loop
Maximise vehicle occupancy
Affordable and convenient alternative
to LF bus
Effectively transfer all LF bus users
Attract taxi customers

29
5.2 Operational Models
A hybrid of existing modes, a mixture of user types and a value proposition that spans public and private interests, iDRT does not point to clear operator. Our analysis of DRTville’s policy landscape, operational players and market specifics lead us
to four possible scenarios for operating the viable iDRT. These are influenced by our example context, and while these are likely applicable elsewhere, we perceive there are many more incarnations not discussed herein.
Flexible Approach
In this scenario, the bus company that ran the replaced LF bus service owns and operates the iDRT instead. Integration between HF and iDRT makes logical business sense.
In this scenario the iDRT is operated by a taxi party with their existing taxi driver base. Collaboration is necessary but the operators have a history of peaceful colocation.
In this scenario the city’s entire transport system is designed by an integrated transport authority – operators tender for different elements. The roles of iDRT and the HF bus have integration embedded in their requirements.
In this scenario a new digital entrant provides the service. A platform is used to collect new drivers to service demand. Collaboration with the bus company is necessary, but may be more difficult if there is a prior perception of competition.
Bus-offshoot Taxi Venture
Public Sector FranchisedDigital Platform
Bus CompanyTaxi
iDRT HF BusiDRT HF Bus
Bus Company
HF Bus
Bus CompanyPlatform Provider
UsersDrivers
Collaboration
ConnectsTaxi
HF BusiDRT
Bus Company
BusCompany
Platform Provider Defined roles
Local Authority
iDRT could be viably operated by a range of public and private statekholders.
30
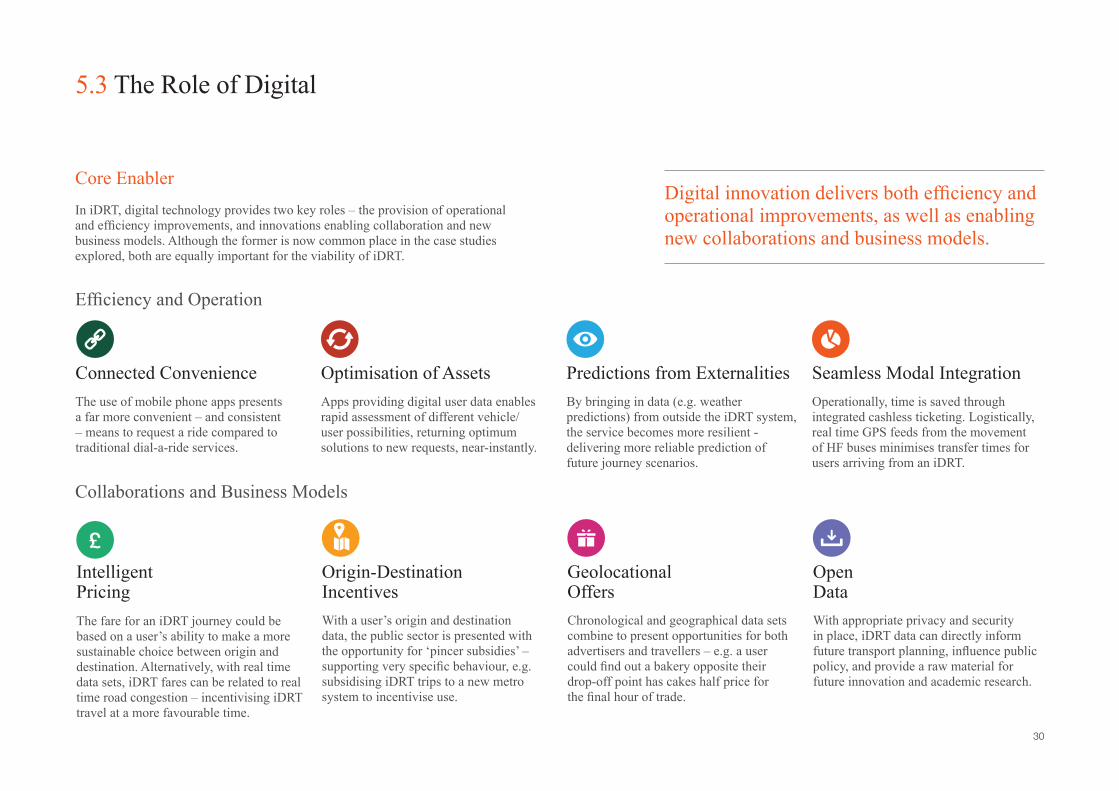
5.3 The Role of Digital
In iDRT, digital technology provides two key roles – the provision of operational and efficiency improvements, and innovations enabling collaboration and new business models. Although the former is now common place in the case studies explored, both are equally important for the viability of iDRT.
Core Enabler
Efficiency and Operation
Collaborations and Business Models
Connected Convenience Optimisation of Assets Predictions from Externalities Seamless Modal IntegrationThe use of mobile phone apps presents a far more convenient – and consistent – means to request a ride compared to traditional dial-a-ride services.
Apps providing digital user data enables rapid assessment of different vehicle/user possibilities, returning optimum solutions to new requests, near-instantly.
By bringing in data (e.g. weather predictions) from outside the iDRT system, the service becomes more resilient - delivering more reliable prediction of future journey scenarios.
Operationally, time is saved through integrated cashless ticketing. Logistically, real time GPS feeds from the movement of HF buses minimises transfer times for users arriving from an iDRT.
Intelligent Pricing
Origin-Destination Incentives
Geolocational Offers
Open Data
The fare for an iDRT journey could be based on a user’s ability to make a more sustainable choice between origin and destination. Alternatively, with real time data sets, iDRT fares can be related to real time road congestion – incentivising iDRT travel at a more favourable time.
With a user’s origin and destination data, the public sector is presented with the opportunity for ‘pincer subsidies’ – supporting very specific behaviour, e.g. subsidising iDRT trips to a new metro system to incentivise use.
Chronological and geographical data sets combine to present opportunities for both advertisers and travellers – e.g. a user could find out a bakery opposite their drop-off point has cakes half price for the final hour of trade.
With appropriate privacy and security in place, iDRT data can directly inform future transport planning, influence public policy, and provide a raw material for future innovation and academic research.
Digital innovation delivers both efficiency and operational improvements, as well as enabling new collaborations and business models.
31
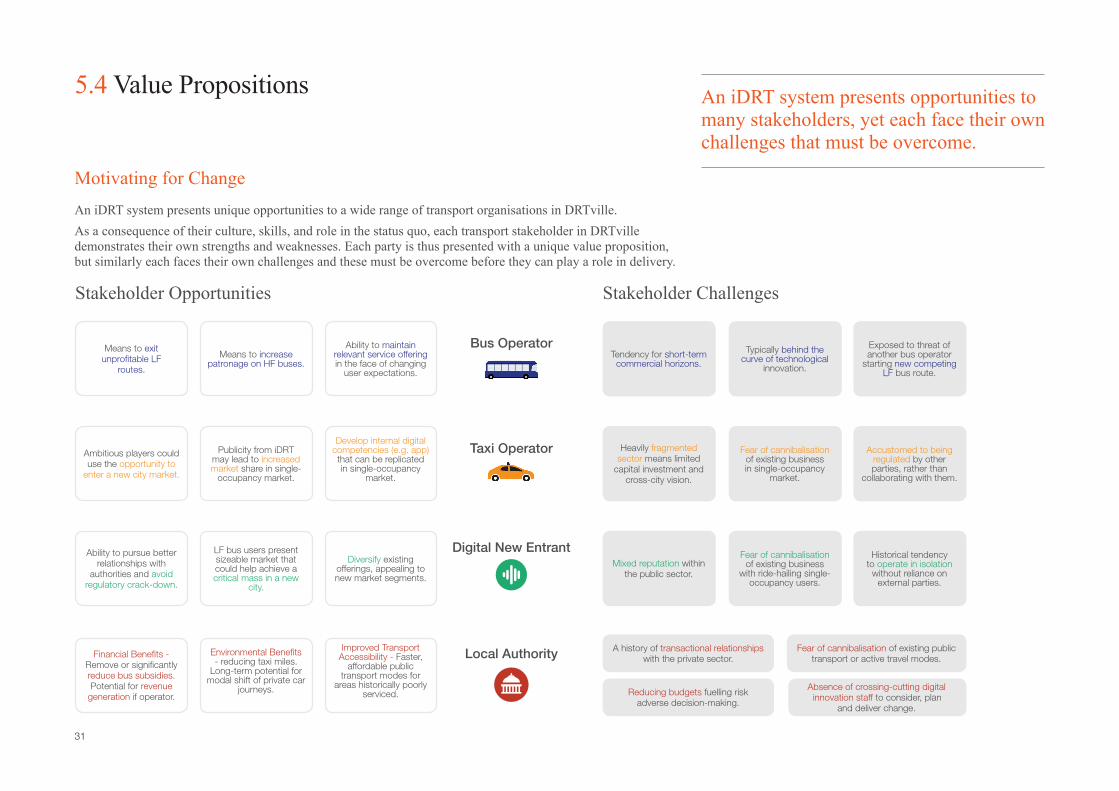
5.4 Value Propositions
An iDRT system presents unique opportunities to a wide range of transport organisations in DRTville.As a consequence of their culture, skills, and role in the status quo, each transport stakeholder in DRTville demonstrates their own strengths and weaknesses. Each party is thus presented with a unique value proposition, but similarly each faces their own challenges and these must be overcome before they can play a role in delivery.
Motivating for Change
Bus Operator
Taxi Operator
Local Authority
Digital New Entrant
Stakeholder Opportunities Stakeholder Challenges
Means to exit unprofitable LF
routes.
Tendency for short-term commercial horizons.
Ambitious players could use the opportunity to
enter a new city market.
Heavily fragmented sector means limited
capital investment and cross-city vision.
Ability to pursue better relationships with
authorities and avoid regulatory crack-down.
Mixed reputation within the public sector.
A history of transactional relationships with the private sector.
Fear of cannibalisation of existing public transport or active travel modes.
Reducing budgets fuelling risk adverse decision-making.
Absence of crossing-cutting digital innovation staff to consider, plan
and deliver change.
Financial Benefits - Remove or significantly reduce bus subsidies. Potential for revenue
generation if operator.
Means to increasepatronage on HF buses.
Typically behind the curve of technological
innovation.
Publicity from iDRT may lead to increased market share in single-
occupancy market.
Fear of cannibalisation of existing business in single-occupancy
market.
LF bus users present sizeable market that could help achieve a critical mass in a new
city.
Fear of cannibalisation of existing business
with ride-hailing single-occupancy users.
Environmental Benefits - reducing taxi miles.
Long-term potential for modal shift of private car
journeys.
Ability to maintain relevant service offering in the face of changing
user expectations.
Exposed to threat of another bus operator
starting new competing LF bus route.
Develop internal digital competencies (e.g. app) that can be replicated in single-occupancy
market.
Accustomed to being regulated by other parties, rather than
collaborating with them.
Diversify existing offerings, appealing to new market segments.
Historical tendency to operate in isolation
without reliance on external parties.
Improved Transport Accessibility - Faster,
affordable public transport modes for
areas historically poorly serviced.
An iDRT system presents opportunities to many stakeholders, yet each face their own challenges that must be overcome.

32
5.5 Evolution and Delivery
In this section we suggest short, medium and long term considerations for a delivering iDRT in DRTville. While specific to our context, many are globally applicable.
The lifecycle of iDRT
Short Term: Overcoming Barries and Harnessing Enablers
Medium Term: Integration to Mobility as a Service (MaaS)
Long Term: Embracing Disruptors
Austerity drives risk aversion to new investments by city leadership – but devolution presents creative franchising opportunities to deliver iDRT and cut costs.
iDRT is an ideal mode for first and last mile legs of multimodal journeys, so will be a valuable connection in a MaaS age.
Electrifying iDRT could slightly reduce operating costs. Operational innovations may be necessary to avoid down time – e.g. inductive charging pads at certain virtual stops.
iDRT’s outcomes align with the objectives of DRTville’s smart city strategy. However, poor IT literacy and lower smart phone ownership is more prevalent in LF bus users, so universal access to iDRT requires careful consideration.
In a world of lower car ownership, the operational reliability of iDRT will be crutial for maintaining urban mobility at a cost lower than cars-as-a-service or taxis.
AVs in iDRT could massively reduce the costs of the system – but this may need to be considered against the appeal of human interaction. Private ownership of AVs may compete with iDRT.
iDRT implementation must sensitively consider the perspective of bus and taxi staff. In parallel, operators need to avoid overestimating operational factors for which solutions exist (e.g. intoxicated users).
With subscription models, iDRT may interact more with MaaS intermediaries than the passengers themselves. Contracts with these parties may make achieving a certain performance mandatory to payment.
With rises in online retail and subscription services, iDRT may find the distribution of personal freight to sub-urban areas a viable area of diversification.
Political: Devolution & Austerity
Last Mile Integration
Electrification of Transport
Digital: Smart Agendas and the Digital Divide
Moving Away from Car Ownership
Autonomous Vehicles (AV)
Logistical: Employment & Distractions
Mobility Marketplaces
eCommerce
(owned)
(as-a-service)
(as-a-service)iDRT
User
MaaS Broker
User needsReal time auction
Monthly payments Travel data
The challenges facing an iDRT system are diverse, and are expected to change over time with wider political, transport and technological trends.
City A
City B
DRT
DRT
Rail
HF Bus

33
6 Global Application

34
6.1 Global Application
While our findings here are drawn on our context of a UK medium-sized city, we believe their applicability reaches far. Based on analysis of other developed cities across the world, we have identified four factors that influence the case for, and best implementation of iDRT. On balance, more serve as caveats to the exact benefit, rather than major barriers.
iDRT Beyond DRTville
Urban Layouts
Commercial Landscape
Metro Systems
Staff Costs
Publically-owned vs. Deregulated
Public Transport Perceptions
Non-arterial Layouts Level of Digital Innovation
Pre-existing Ride Hailing Services Active Travel Culture
Density Quality of Public Transport
Congestion Levels Car-as-Service Interaction
Transport Policy
Transport Cultures
For cities with advanced metro networks, iDRT integration with trains may be as, or more important than integration with HF buses.
iDRT is sensitive to staff costs – in areas of very high labour service will be notably more expensive to run, but may still be a cheaper alternative to LF buses, depending on staff ratios.
iDRT requires collaboration – while possible in almost any context, this is likely to be achieved faster in networks entirely public owned or managed by an integrated authority.
iDRT services will need to have careful branding to be favourably perceived in contexts where car ownership has strong connotations with social status.
iDRT operational zones may take different shapes in alternate urban layouts – e.g. segment-shaped, for a city with a ring road HF network.
In some cities, multiple-occupancy ride hailing DRT attempts to fill the LF bus void. iDRT may be superior in this role, but competition with these services may be prohibitively fierce.
Cities that have begun to consider and invest in digital infrastructure and smart city strategies are more likely have internal capabilities and capacity to shepherd change.
Where active travel is popular, iDRT may have less impact, as ‘shuttle’ journeys are of a viable cycling distance if infrastructure permits.
Areas of very high density areas may benefit more from a traditional HF bus; lower density areas may need smaller vehicles to maintain coverage – increasing costs.
iDRT is limited by traffic on roads. In DRTville suburban areas have low congestion, but in some cities segregated modes may be a preferable option.
In a very few cities, high frequency transport modes may adequately provide for all users, removing the need for iDRT – at least as envisaged here.
iDRT may be a competitor to as-a-service cars. However iDRT is likely to have a lower cost and environmental impact for ‘shuttle’ trips and a far lower critical mass.
iDRT has strong global applicability, but a range of factors must be considered to ensure relevancy and an appropriate implementation.

35
6.2 Global City Recommendations
City authorities have a key role in bringing about change in their urban areas – such as iDRT. For these stakeholders, five recommendations can be drawn from our work, categorised into identifying a need and delivering a system.
Driving Change
Identifying a Need
Delivering a System
Think Mode, not Tech Identify Weaknesses
Shaping Change Be Bold
The Missing MaaS Link
• Cities should strive to avoid technological hype, as it leads to a view of DRT as a technological novelty, rather than a strategic mode. Digital innovation enables iDRT, but need should come first.
• By considering DRT with the same possibility and rigour as that of bus, rail and road systems, the public sector may more easily find compelling propositions for the use of an iDRT at scale.
• Local authorities should strive to orchestrate collaborative discussions with a range of private and public stakeholders, highlighting value propositions to both.
• It is likely DRT innovation will continue at pace regardless, and the public sector has a unique position to shape a service that maximises public benefits – tackling issues such as public transport cannibalisation.
• Traditional methods – planning policy, restricted transport zones – and digital actions – targeted subsidies, data sharing – present levers for change.
• We have shown that iDRT systems have critical masses, and cities should aim to experiment at scale accordingly.
• Experiments that are unprofitable should not be seen as pilots that have failed. Market education is a valuable achievement that does not immediately appear on a balance sheet.
• Services should not shy away from commercial innovation – experimenting with service levels and pricing levels. Pilots are a unique time to evaluate customer appetite before expectations are fixed.
• Areas of significant public transport subsidy may immediately point to a case for iDRT.
• Poor patronage on services, such as an sub-urban rail line, may benefit from the improved catchment effects of an iDRT system.
• Areas of poor transport accessibility may benefit from iDRT as a bespoke intervention, e.g. industrial or academic campuses out of the urban centre.
• Many cities have identified the public benefits of mobility as service to urban systems.
• First mile and last mile journeys are likely to be a key obstacle to journeys being affordable and sustainable in a MaaS world – iDRT may be a solution.
To deliver an iDRT system, cities need to adjust their perspectives on what DRT is, what needs it can address, and how it should be implemented.

36

37
7 Conclusions
38
7.1 Conclusions
1.
2.
3.
4.
5.
6.
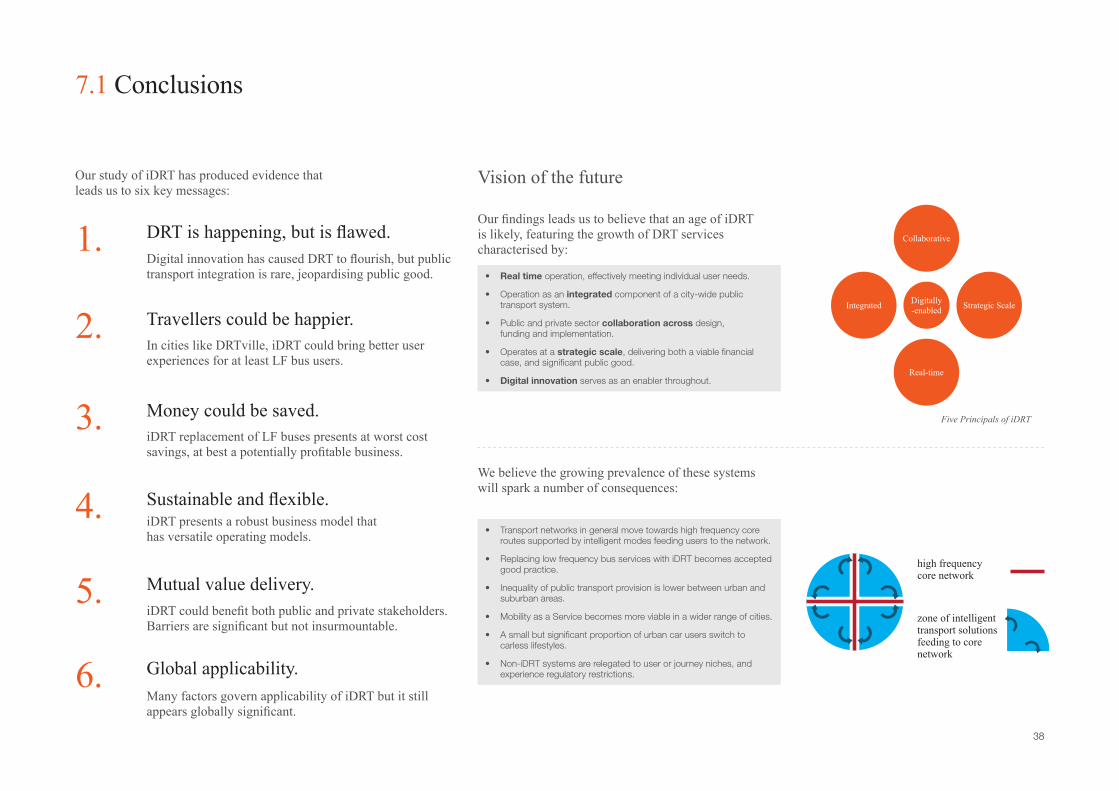
Our study of iDRT has produced evidence that leads us to six key messages:
DRT is happening, but is flawed.
Travellers could be happier.
Money could be saved.
Sustainable and flexible.
Mutual value delivery.
Global applicability.
Digital innovation has caused DRT to flourish, but public transport integration is rare, jeopardising public good.
We believe the growing prevalence of these systems will spark a number of consequences:
Our findings leads us to believe that an age of iDRT is likely, featuring the growth of DRT services characterised by:
In cities like DRTville, iDRT could bring better user experiences for at least LF bus users.
iDRT replacement of LF buses presents at worst cost savings, at best a potentially profitable business.
iDRT presents a robust business model that has versatile operating models.
iDRT could benefit both public and private stakeholders. Barriers are significant but not insurmountable.
Many factors govern applicability of iDRT but it still appears globally significant.
Vision of the future
• Real time operation, effectively meeting individual user needs.
• Operation as an integrated component of a city-wide public transport system.
• Public and private sector collaboration across design, funding and implementation.
• Operates at a strategic scale, delivering both a viable financial case, and significant public good.
• Digital innovation serves as an enabler throughout.
• Transport networks in general move towards high frequency core routes supported by intelligent modes feeding users to the network.
• Replacing low frequency bus services with iDRT becomes accepted good practice.
• Inequality of public transport provision is lower between urban and suburban areas.
• Mobility as a Service becomes more viable in a wider range of cities.
• A small but significant proportion of urban car users switch to carless lifestyles.
• Non-iDRT systems are relegated to user or journey niches, and experience regulatory restrictions.
Collaborative
Strategic Scale
Real-time
Digitally -enabledIntegrated
Five Principals of iDRT
high frequencycore network
zone of intelligenttransport solutionsfeeding to core network

39
7.2 The Way Forward
Provocations
Key Questions
Many ride hailing apps are opting to turn over a new leaf with the public sector, collaborating to create public good on a small scale. This new approach appears to be delivering commercial benefits. If this strategy increases at scale, iDRT may arrive at the negotiation table sooner.
Delivering on iDRT requires the alignment of staunchly different worldviews and value systems. Few are as ideally placed to foster these discussions than local authorities. A common solidarity as contributors to a city’s functionality needs to be reached. Other third parties, such as universities, are likely to be useful allies in this pursuit.
Many LF bus services are in decline. Subsidies are under threat. Citizens demanding better may be swayed to multiple occupancy ride-hailing apps. Low frequency bus companies may be forced to abandon further routes, damaging commercial positions and potentially leading to increased consolidation in the marketplace.
Many research publications place widespread adoption of AVs at least 15 years away. If predictions are maintained, this presents a significant intermediary period when iDRT could flourish. Furthermore, if developed early, when AVs do emerge, iDRT is more likely to have the foundations to be able to adjust and maintain relevance.
Will digital new entrants collaborate?
Lobby for Legislative Change
Transfrom Social Care Transport
Form Catchment Strategies Digitise a Dial-a-Ride
Will cities rise to the challenge of the orchestrator?
Will bus operators jump before they are pushed?
How long do we
have until AVs arrive?
Regulatory issues are an important consideration. Bus companies could lead
the vanguard on campaigning for the right to operate emerging services such as iDRT. Historically, lobbying for policy change has enabled digital innovation,
for example, changing regulation around electricity retailing supporting electric
vehicle charging.
Taxis regularly form a crucial part of social care transportation. Implemented sensitiviely, similar iDRT principals could be tested at a lower risk in this market,
where demand is often known with greater notice.
Ride hailing apps can benefit from the use of concentrated areas of demand – such as metro stations. Discussions with owners of major transport infrastructure
may identify mutually benefical catchment strategies.
Local authorities are unlikely to have the capability to develop digital infrastructure for innovating their own iDRT systems.
However, many may be ideally positioned to capture grant funding to develop this
capability in partnership with others.
The future of iDRT implementations appears governed by several key questions, explored below. Reflecting on these uncertainties, we present several provocations targetted at specific transport stakeholders. More genearlly, our vision of how the iDRT scenarios may be achieved is laid out in an illustrative roadmap.

40

41
8 About Arup
42
8.1 Who we are
Arup is an independent firm of designers, planners, engineers, consultants and technical specialists working across every aspect of today’s built environment. Together we help clients solve their most complex challenges, turning exciting ideas into tangible reality as we strive to find a better way to shape a better world.Established in 1946, Arup has over 12,000 employees based in more than 92 offices across 40 countries, working on up to 10,000 projects at any one time. Its unique structure, with the firm held in trust on behalf of our employees, gives us complete independence. We live in a digital world that continues to evolve at an astonishing pace. The ever-changing digital built environment presents new opportunities to enhance the way we live and work. At Arup, we bring together detailed sector experience with a strategic understanding of the possibilities of digital innovation, to shape innovations that create value for our clients. Going the Distance draws on expertise from our Digital Strategy, Economics and Transport Planning groups. We would be delighted to discuss your challenges and opportunities.
Gwyn EphraimProject DrectorGoing the [email protected]
Project DirectorGwyn Ephraim
Project ManagerPeter Cooper
Delivery TeamPhilippa IvensGerallt Dafydd Thomas Winton
Graphic DesignLuke Graham Powell
Acknowledgments

43