good morning chair young and members of the board. my … · however, the decision to list or...
TRANSCRIPT

1
Good morning Chair Young and Members of the Board. My name is Kevin Lunde and I work in the Planning Division. I manage the surface water monitoring program, which collects water quality data throughout our watersheds.
Today I will be presenting information on a resolution proposing to remove two water bodies from California’s Impaired water bodies list: the Napa River and Sonoma Creek, which are both listed as impaired for nutrients. During this presentation, I will talk about how we assess nutrient-related water quality and walk you through our analysis of nutrients in these two water bodies.
2
How do we assess water quality? Under the Federal Clean Water Act, each State is required to assess the quality of its waters.
We followed the process outlined in the State Water Board’s 2004 Listing Policy to add, modify, or remove waters from the impaired list.
Water quality assessments are water body-pollutant specific. This means that within a given water body, such as the Napa River, we specifically examine all available data for a single pollutant, or, in the case of nutrients, we look at a class of pollutants to see whether they are exceeding water quality standards.
Waters that are not meeting current water quality standards are placed on list of impaired water bodies, called the 303(d) list, after the Clean Water Section that requires it.
When a water body is listed as impaired, we will then prepare a plan to fix the impairment—usually by developing a Total Maximum Daily Load, or TMDL, which is a plan to improve water quality.
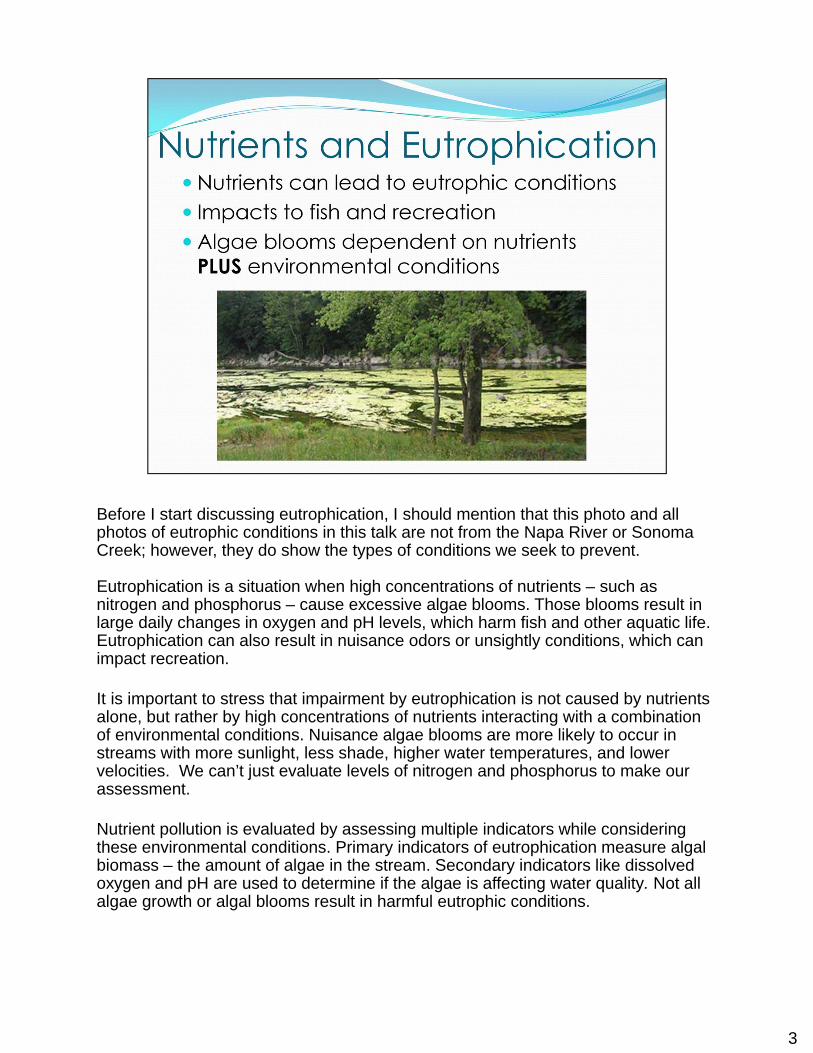
Before I start discussing eutrophication, I should mention that this photo and all photos of eutrophic conditions in this talk are not from the Napa River or Sonoma Creek; however, they do show the types of conditions we seek to prevent.
Eutrophication is a situation when high concentrations of nutrients – such as nitrogen and phosphorus – cause excessive algae blooms. Those blooms result in large daily changes in oxygen and pH levels, which harm fish and other aquatic life. Eutrophication can also result in nuisance odors or unsightly conditions, which can impact recreation.
It is important to stress that impairment by eutrophication is not caused by nutrients alone, but rather by high concentrations of nutrients interacting with a combination of environmental conditions. Nuisance algae blooms are more likely to occur in streams with more sunlight, less shade, higher water temperatures, and lower velocities. We can’t just evaluate levels of nitrogen and phosphorus to make our assessment.
Nutrient pollution is evaluated by assessing multiple indicators while considering these environmental conditions. Primary indicators of eutrophication measure algal biomass – the amount of algae in the stream. Secondary indicators like dissolved oxygen and pH are used to determine if the algae is affecting water quality. Not all algae growth or algal blooms result in harmful eutrophic conditions.
3
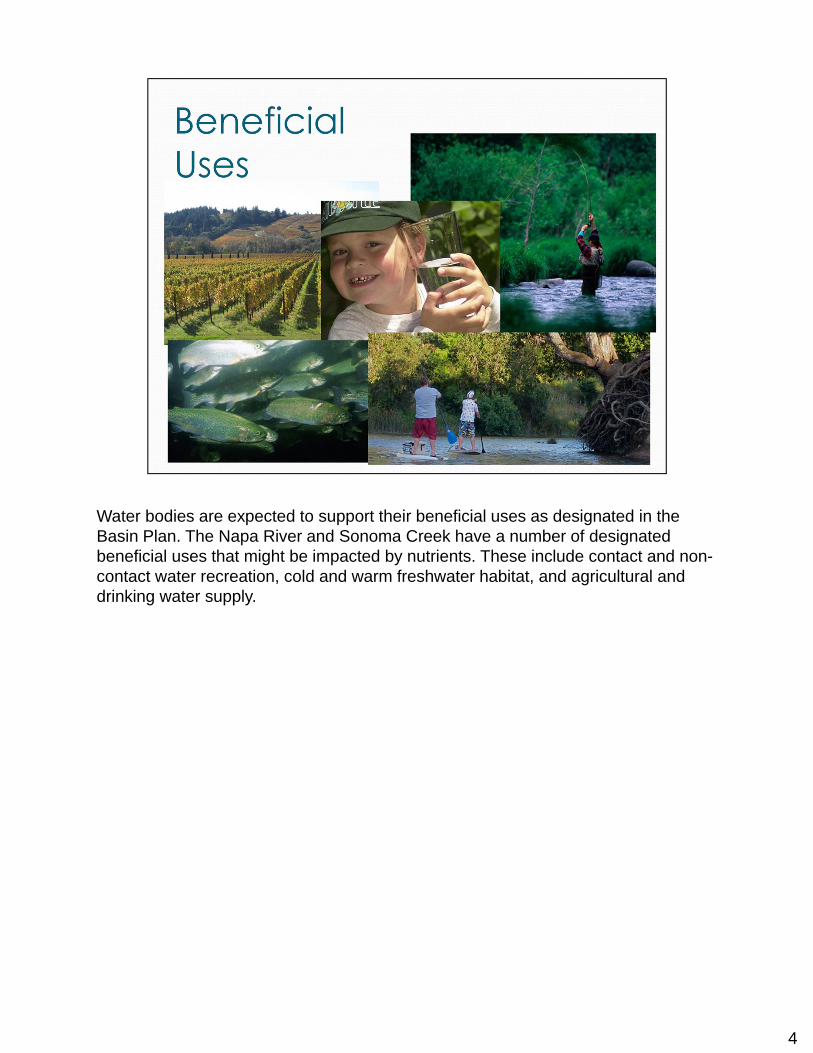
Water bodies are expected to support their beneficial uses as designated in the Basin Plan. The Napa River and Sonoma Creek have a number of designated beneficial uses that might be impacted by nutrients. These include contact and non-contact water recreation, cold and warm freshwater habitat, and agricultural and drinking water supply.
4
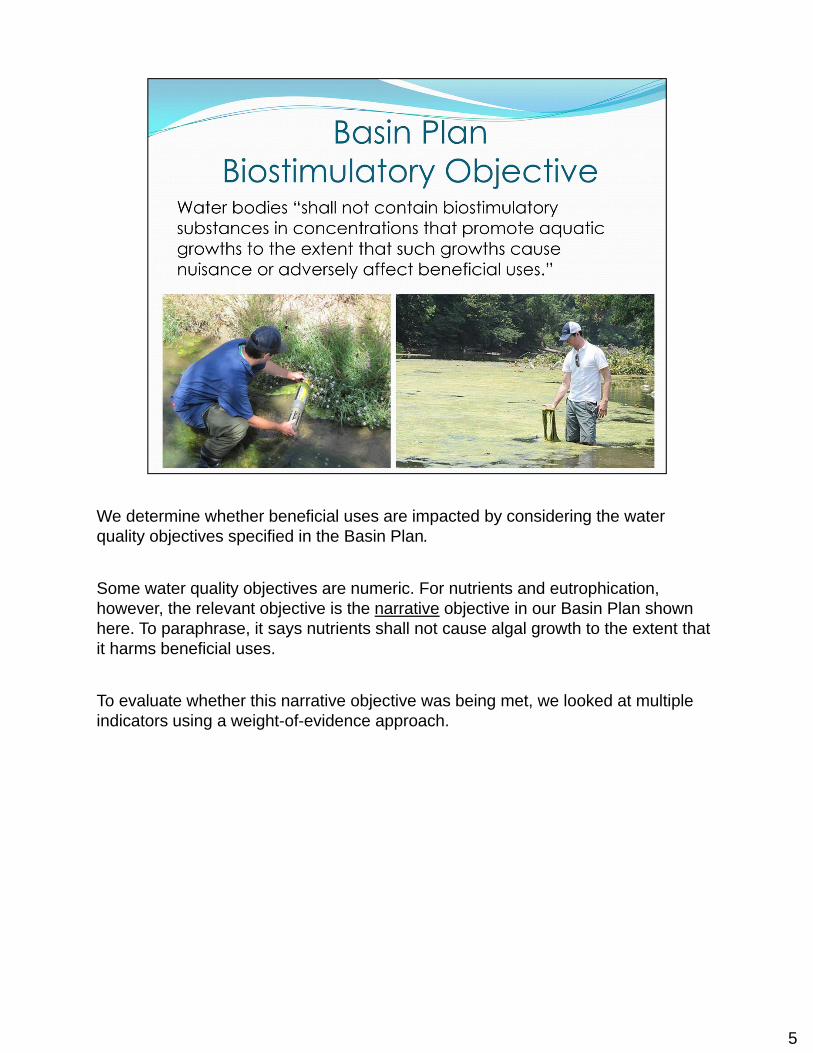
We determine whether beneficial uses are impacted by considering the water quality objectives specified in the Basin Plan.
Some water quality objectives are numeric. For nutrients and eutrophication, however, the relevant objective is the narrative objective in our Basin Plan shown here. To paraphrase, it says nutrients shall not cause algal growth to the extent that it harms beneficial uses.
To evaluate whether this narrative objective was being met, we looked at multiple indicators using a weight-of-evidence approach.
5

Both the Napa River and Sonoma Creek main stems (highlighted in red) were determined to be Water Quality Limited in the 1975 Regional Basin Plan. That Basin Plan described problematic concentrations of nutrients and biological oxygen demanding substances, much of which was attributed to wastewater treatment plants, although there was recognition that there were other unspecified sources.
Both of these water bodies are on our current 303(d) list for nutrients and we have been working to develop TMDLs to address the listings. That effort led to a significant collection of data and to a better understanding of the current state of water quality in these water bodies.
6
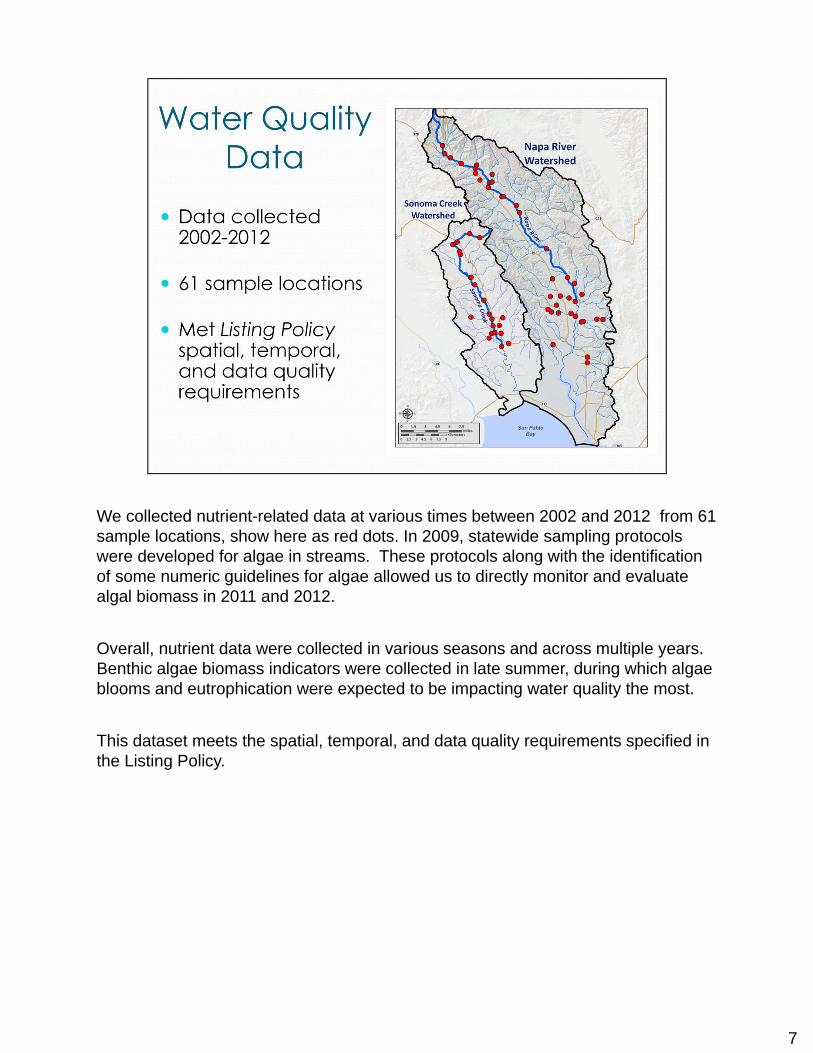
We collected nutrient-related data at various times between 2002 and 2012 from 61 sample locations, show here as red dots. In 2009, statewide sampling protocols were developed for algae in streams. These protocols along with the identification of some numeric guidelines for algae allowed us to directly monitor and evaluate algal biomass in 2011 and 2012.
Overall, nutrient data were collected in various seasons and across multiple years. Benthic algae biomass indicators were collected in late summer, during which algae blooms and eutrophication were expected to be impacting water quality the most.
This dataset meets the spatial, temporal, and data quality requirements specified in the Listing Policy.
7

Because nutrient impairment is governed by a narrative, rather than a numeric objective, we used a weight-of-evidence approach in reviewing the collected data.
This table shows the eight lines of evidence we evaluated. The top two analytes shaded in green, benthic chlorophyll a and percent macroalgae cover, are the best direct indicators of eutrophication in streams. These two metrics are being considered by the State Board as part of its policy for nutrients in freshwater perennial wadeable streams. Water column chlorophyll a is another measure we considered. pH, is a secondary indicator of eutrophication. The remaining four analytes, nitrite, nitrite + nitrate, and ammonia, are forms of nutrients we evaluated to see if they were causing aquatic and human health toxicity.
8

Here are the results of our assessment. As you can see, we observed very few exceedances of the direct eutrophication indicators shaded in green. At the 3 sites with high algal biomass according to either benthic chlorophyll a or percent macroalgae cover, the other indicator often was not showing an exceedance or the site was not in exceedance for both years. In addition, continuous monitoring pH and dissolved oxygen data collected at those three sites did not exceed eutrophication benchmarks.
Likewise, all spot measurements of pH showed no readings outside of the levels that are harmful to wildlife, such as salmonids. Finally, we observed no exceedances for the toxicity-based indicators: nitrite, nitrite+nitrate, or ammonia.
9

Nutrient-related water quality in the Napa River and Sonoma Creek has improved significantly since the 1970s. The reasons for the improvement are:
1) Most municipal wastewater treatment plants added secondary treatment during the 1970s. Additionally, NPDES permits since the 1980s prohibit discharge to shallow waters from May through October, when algae blooms are more likely to occur. Treatment plants now store wastewater to discharge at the appropriate time, or recycle it by distributing it to agricultural users such as vineyards or using it for on-site irrigation.
2) There have been shifts away from types of agriculture that rely on greater fertilizer use or are sources of nutrients in the watershed. Over the past 30 years, beef production decreased substantially in both counties and there is less grazing and fewer dairies and confined animal facilities.
3) Land owners have also implemented improved environmental best management practices (BMPs) for both grazing and confined animal facilities.
4) Last, although vineyard use has increased over the past 30 years, vineyards use less nitrogen per acre than other regional crops. In addition, improved vineyard sediment controls and cover crops have reduced sediment and nutrient runoff.
10

We received 4 comment letters in the 30-day public comment period, including two from representatives of the Living Rivers Council and Chris Malan.
The first letter submitted on behalf of the Living Rivers Council expressed concern that the proposed delisting did not follow the environmental review procedures required under the California Environmental Quality Act commonly called CEQA. However, the decision to list or delist water bodies on the 303(d) List is not a “project” as defined by CEQA and approval of the 303(d) list modification will not cause a physical change in the environment and is, therefore, not subject to CEQA. In response to this letter, we added a CEQA finding to the tentative resolution.
The second comment letter, submitted by a fisheries biologist on behalf of the Living Rivers Council, included an in-depth re-analysis of the data used by Board staff to support the delisting recommendations. The letter expressed concern that the data showed that nutrients were present in amounts that were causing eutrophication and expressed concern about flows in the Napa River and the relationship between flow and water quality. The commenter asked that the Napa River be listed as impaired for flow. We responded to all the comments and demonstrate that the Napa River and Sonoma Creek are meeting all current water quality standards for nutrients.
11

Issues regarding flow are separate from the action before you today. Algal biomass data collected in 2011 and 2012 reflect current flows, and based on our analysis of water quality data in the River and Creek we didn’t observe impairment for nutrients given current flow conditions.
Finally, we received comments from the Napa County Farm Bureau and Napa County Flood Control and Water Conservation District. Both supported the proposed delisting.
11

In conclusion, we found the Napa River and Sonoma Creek are meeting all numeric and narrative water quality objectives related to nutrients. None of their beneficial uses are directly or indirectly impaired by nutrients. Therefore, staff’s recommendation is to approve the revised tentative resolution to delist the non-tidal sections of the Napa River and Sonoma Creek water bodies- shown here in blue -for nutrient impairment. The impairment status of the tidal sections of both water bodies - shown here in red - would not change. The tidal sections will be addressed when we have developed an assessment framework for nutrients in estuarine waters, as part of the regional nutrient strategy for the Bay.
The next steps are that the Board’s recommendation to delist would go to State Board for its approval. State Board would then transmit the delisting to US EPA for its approval or disapproval.
I also want to let the Board know that the schedule for bringing a comprehensive assessment of water quality in the Region to the Board is currently expected to be 2015. However, where we begin work on TMDLs and we determine that water bodies are in fact meeting water quality standards, we intend to bring recommendations for delisting to the Board as soon as possible after our evaluation is completed. For example, we are currently circulating a delisting recommendation for pathogens at Muir Beach which we intend to bring before the Board in May.
12

Thank you for your time, and I would be pleased to answer any questions from the Board.
13

These are the three sites with exceedances for primary indicators of eutrophication. Cells were highlighted red if the observed data exceeded evaluation guidelines for benthic chlorophyll a or percent macroalgae cover. Eutrophication evaluation guidelines for continuous monitoring data (pH and dissolved oxygen mean daily range) were not exceeded at these sites.
14