google analytics premium for better data-driven decisions with swapnil sinha
TRANSCRIPT
3:00pm
23JUN
1. Google Analytics Premium Overview
2. Accumulate
3. Analyze
4. Act & Case Studies
Agenda

GA PREMIUM
Overview
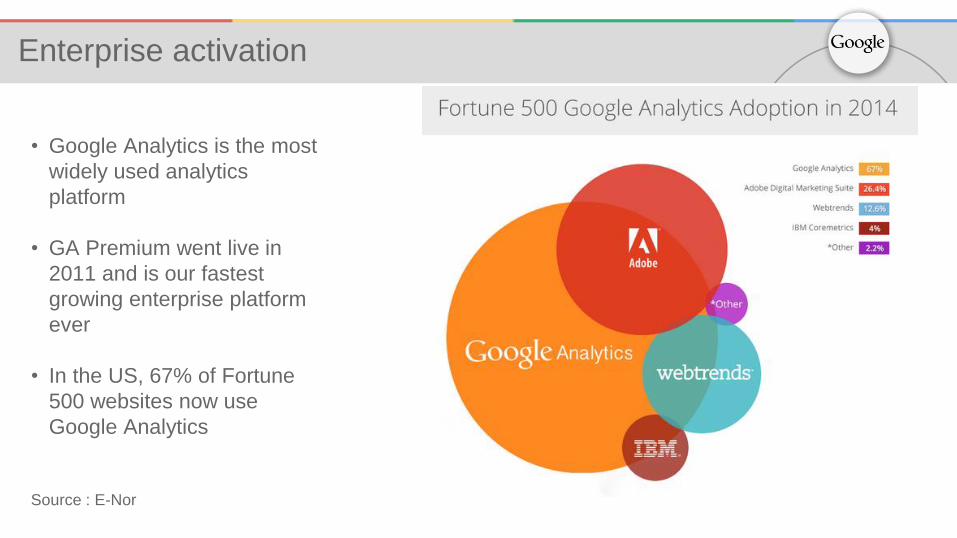
Enterprise activation
• Google Analytics is the most
widely used analytics
platform
• GA Premium went live in
2011 and is our fastest
growing enterprise platform
ever
• In the US, 67% of Fortune
500 websites now use
Google Analytics
Source : E-Nor
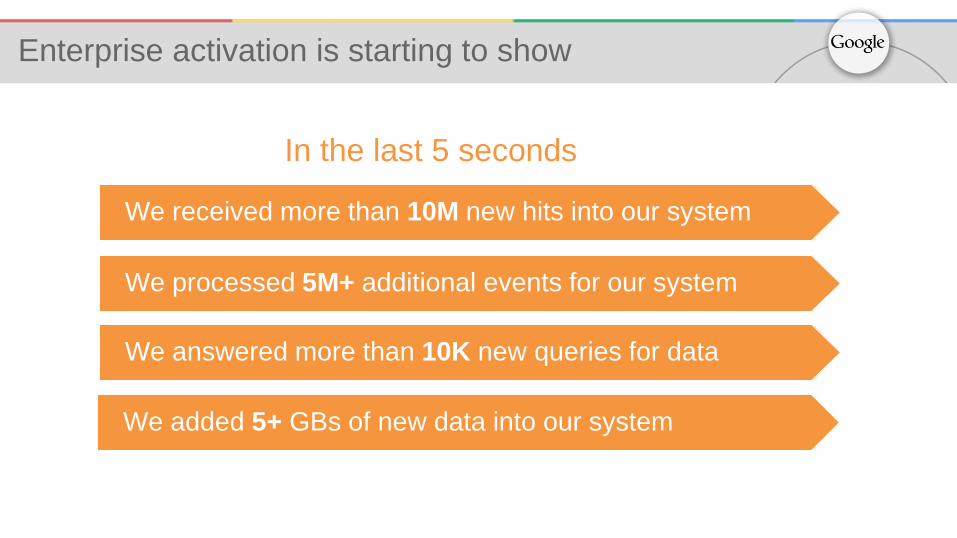
Enterprise activation is starting to show
We received more than 10M new hits into our system
We answered more than 10K new queries for data
We added 5+ GBs of new data into our system
We processed 5M+ additional events for our system
In the last 5 seconds
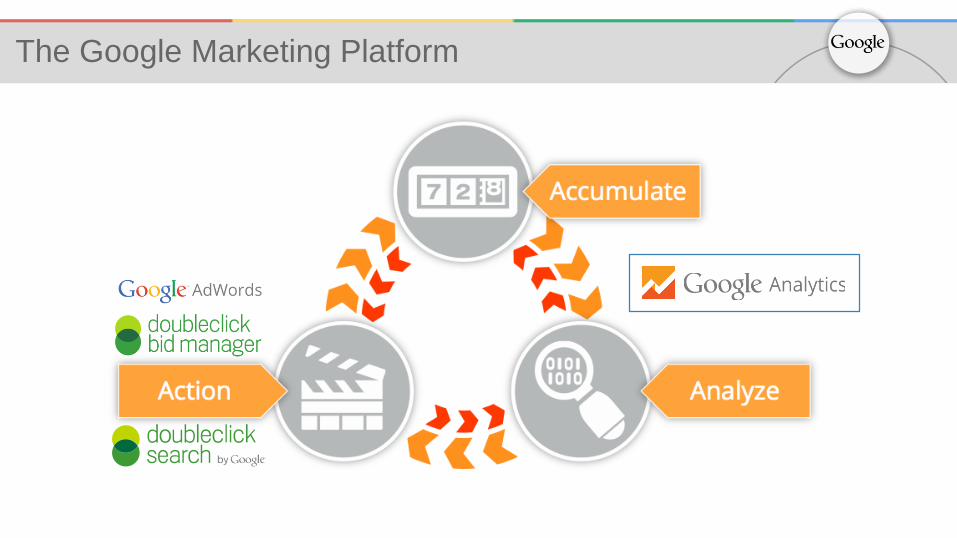
The Google Marketing Platform
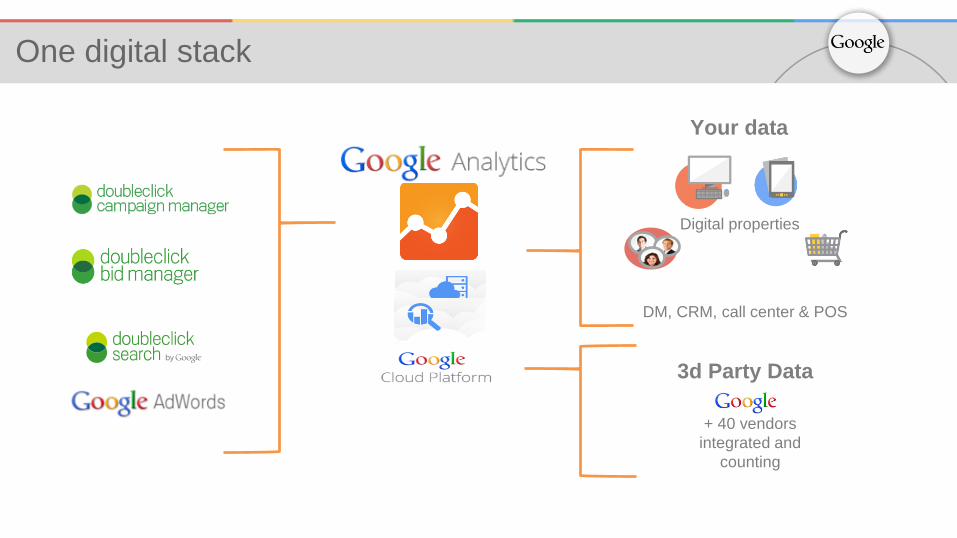
Digital properties
DM, CRM, call center & POS
3d Party Data
+ 40 vendors
integrated and
counting
Your data
One digital stack
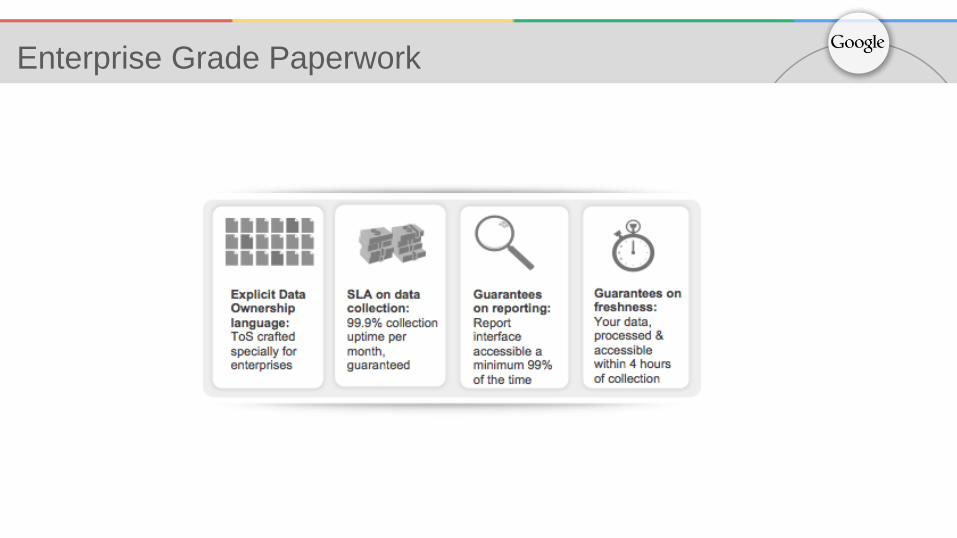
Enterprise Grade Paperwork

Enterprise Grade Support
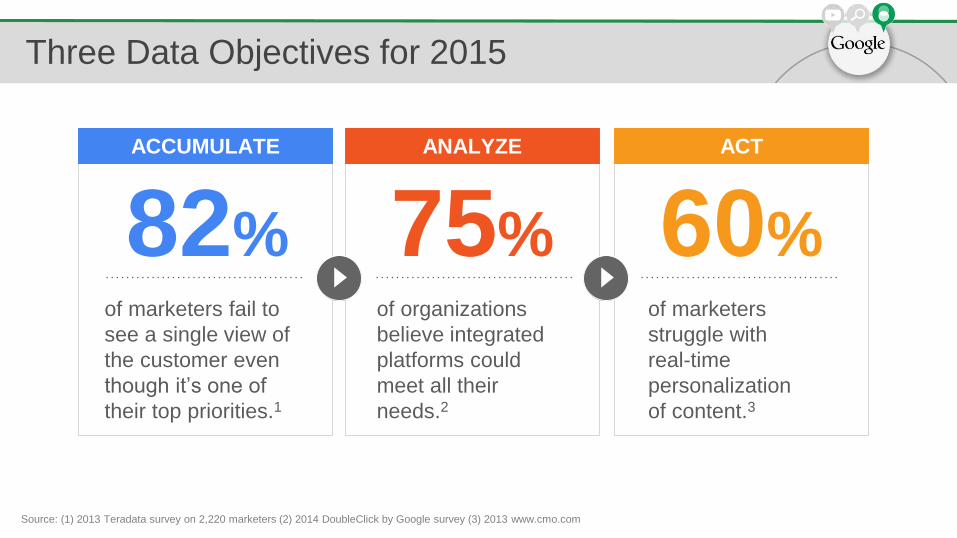
Three Data Objectives for 2015
of marketers fail to
see a single view of
the customer even
though it’s one of
their top priorities.1
of organizations
believe integrated
platforms could
meet all their
needs.2
of marketers
struggle with
real-time
personalization
of content.3
82% 75% 60%
ACCUMULATE ANALYZE ACT
Source: (1) 2013 Teradata survey on 2,220 marketers (2) 2014 DoubleClick by Google survey (3) 2013 www.cmo.com
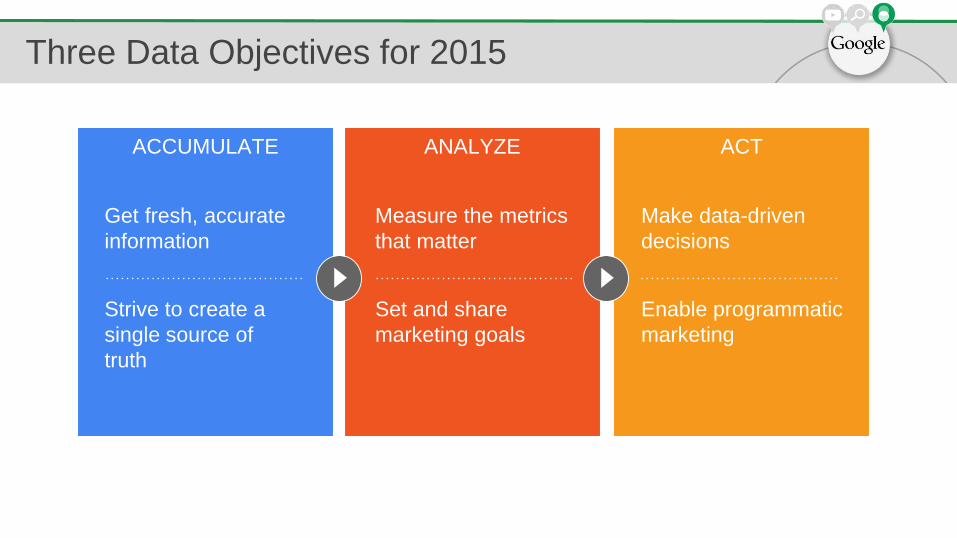
ACCUMULATE ANALYZE ACT
Strive to create a
single source of
truth
Get fresh, accurate
information
Set and share
marketing goals
Measure the metrics
that matter
Enable programmatic
marketing
Make data-driven
decisions
Three Data Objectives for 2015
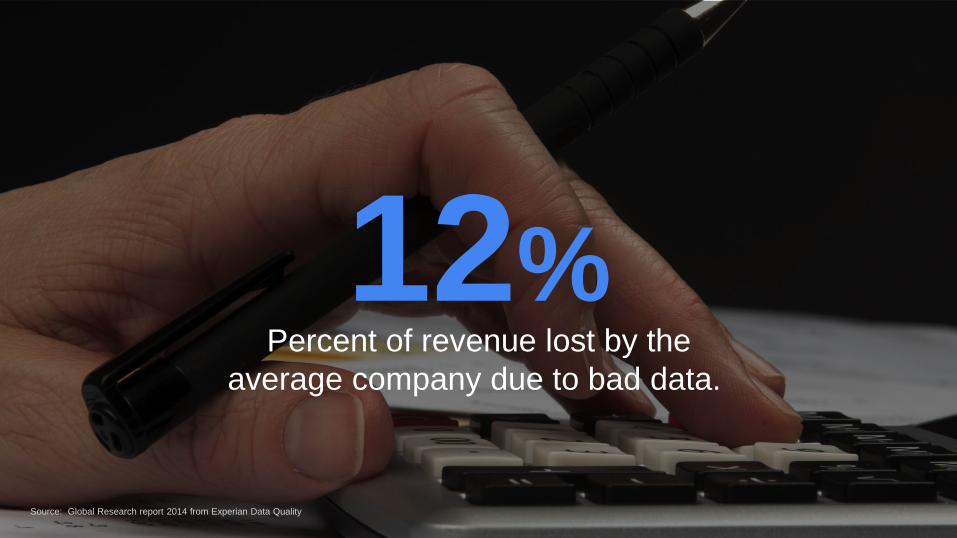
12%Percent of revenue lost by the
average company due to bad data.
Source: Global Research report 2014 from Experian Data Quality
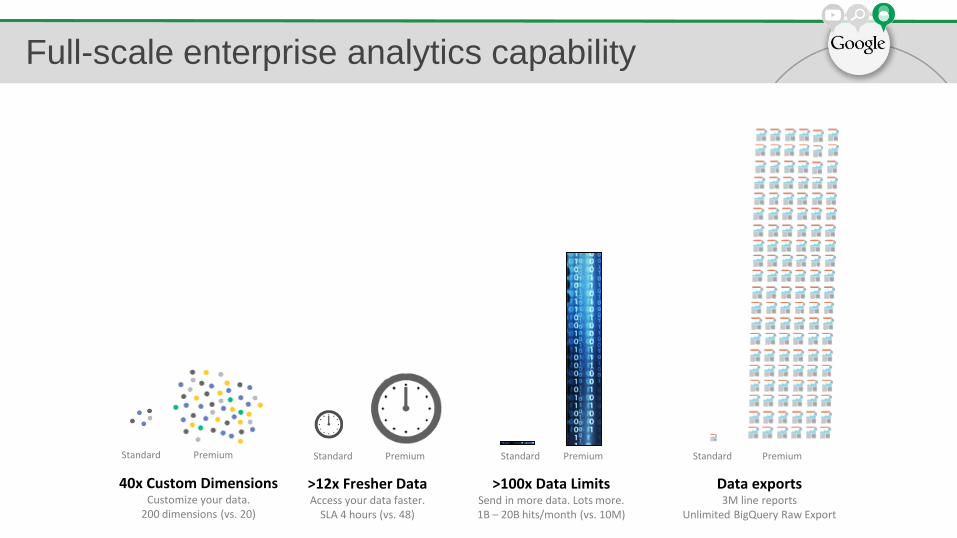
Full-scale enterprise analytics capability
40x Custom DimensionsCustomize your data.
200 dimensions (vs. 20)
Standard Premium
>100x Data LimitsSend in more data. Lots more.1B – 20B hits/month (vs. 10M)
Data exports3M line reports
Unlimited BigQuery Raw Export
>12x Fresher DataAccess your data faster.
SLA 4 hours (vs. 48)
Standard Premium Standard Premium Standard Premium
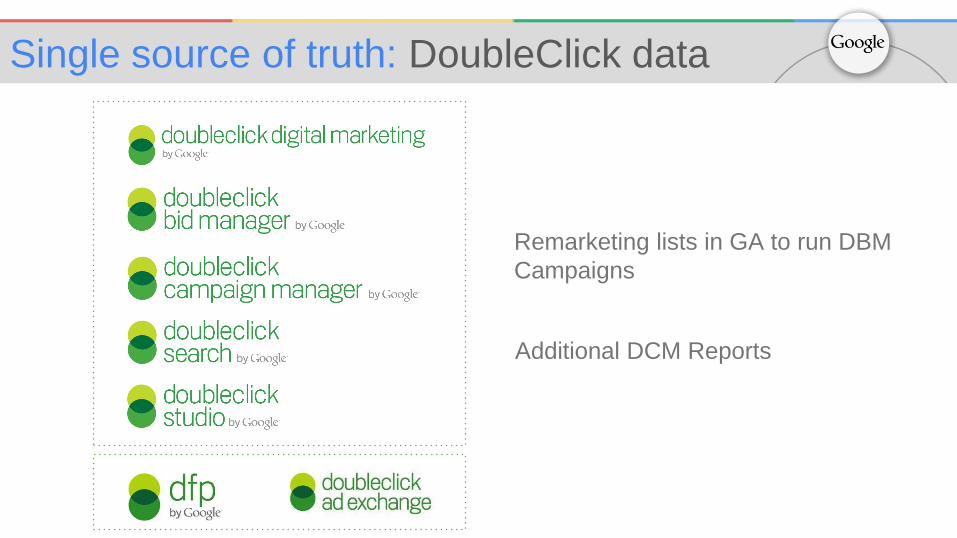
Additional DCM Reports
Remarketing lists in GA to run DBM
Campaigns
Single source of truth: DoubleClick data

Actionable Google Data
• Google Play
• Demographic and Interest Data
• Industry Benchmarking
• More Advertising spend information
Google data sources
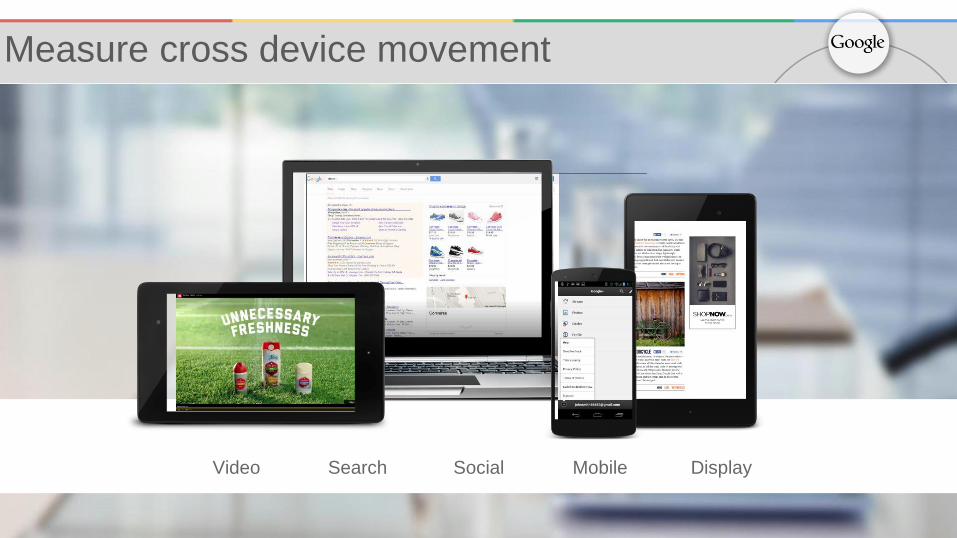
Measure cross device movement
Video Search DisplaySocial Mobile
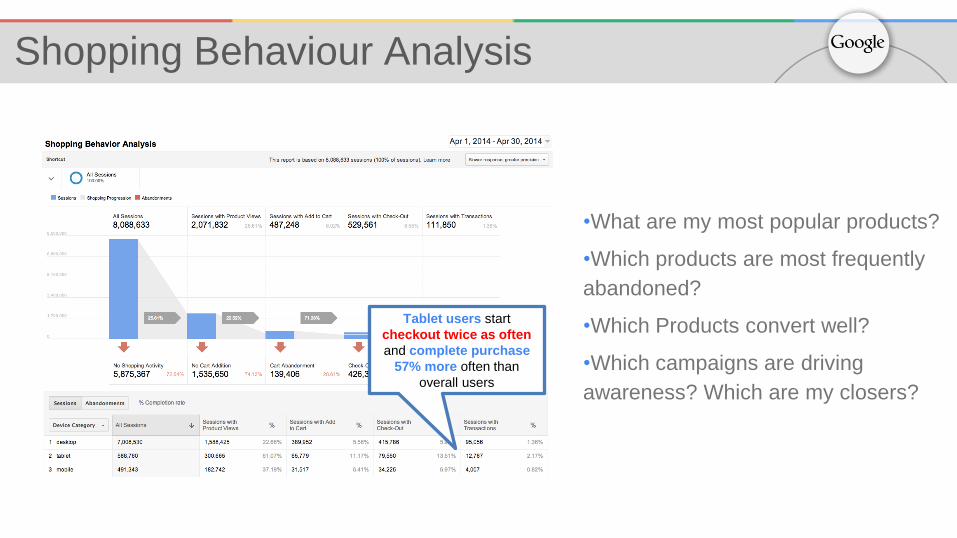
Shopping Behaviour Analysis
Tablet users start
checkout twice as often
and complete purchase
57% more often than
overall users
•What are my most popular products?
•Which products are most frequently
abandoned?
•Which Products convert well?
•Which campaigns are driving
awareness? Which are my closers?
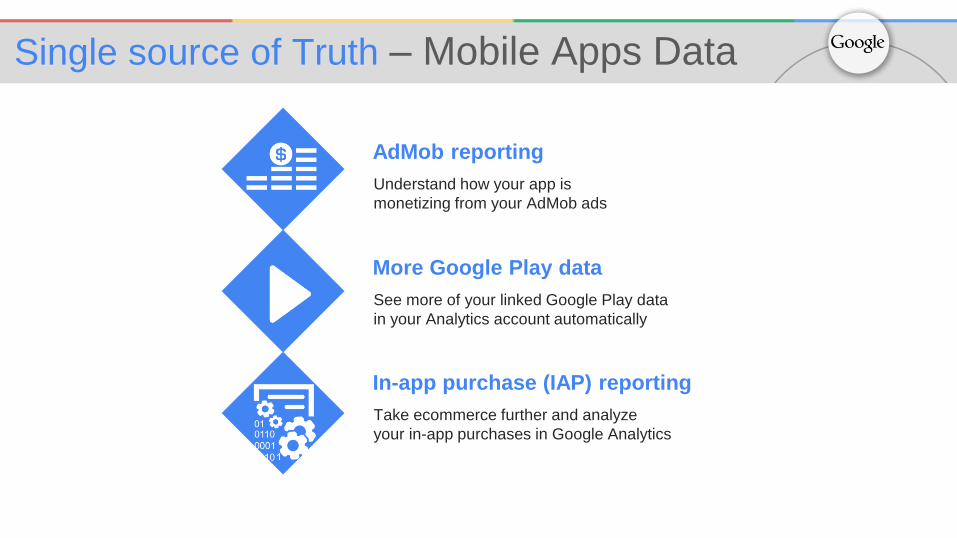
Single source of Truth – Mobile Apps Data
AdMob reporting
Understand how your app is
monetizing from your AdMob ads
More Google Play data
See more of your linked Google Play data
in your Analytics account automatically
In-app purchase (IAP) reporting
Take ecommerce further and analyze
your in-app purchases in Google Analytics
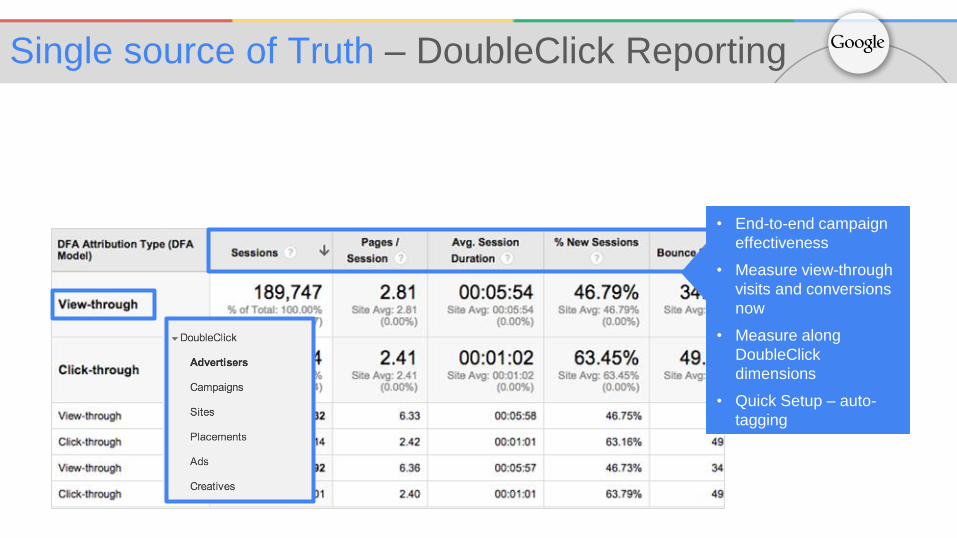
• End-to-end campaign
effectiveness
• Measure view-through
visits and conversions
now
• Measure along
DoubleClick
dimensions
• Quick Setup – auto-
tagging
Single source of Truth – DoubleClick Reporting
Analyzing data

56%of companies rated data analytics as ‘very’ or ‘critically’
important to their strategy this year.
Source: KPMG and CGF Global Consumer Executive Top of Mind Survey 2014.
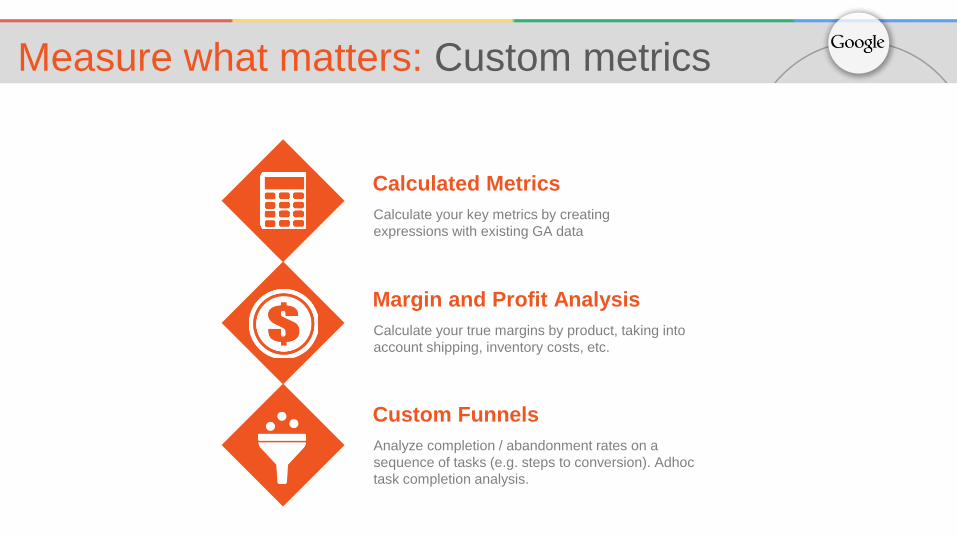
Measure what matters: Custom metrics
Calculated Metrics
Calculate your key metrics by creating
expressions with existing GA data
Margin and Profit Analysis
Calculate your true margins by product, taking into
account shipping, inventory costs, etc.
Custom Funnels
Analyze completion / abandonment rates on a
sequence of tasks (e.g. steps to conversion). Adhoc
task completion analysis.
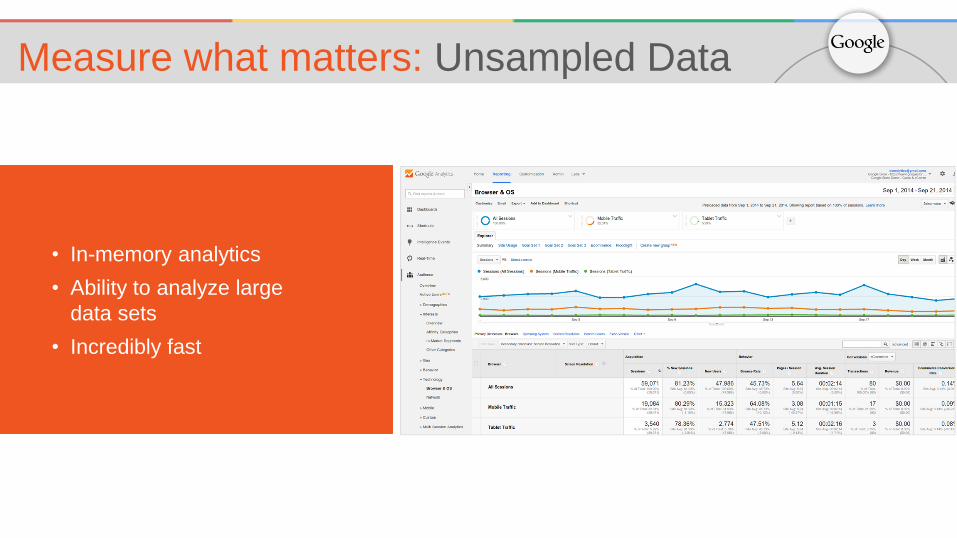
Measure what matters: Unsampled Data
• In-memory analytics
• Ability to analyze large
data sets
• Incredibly fast
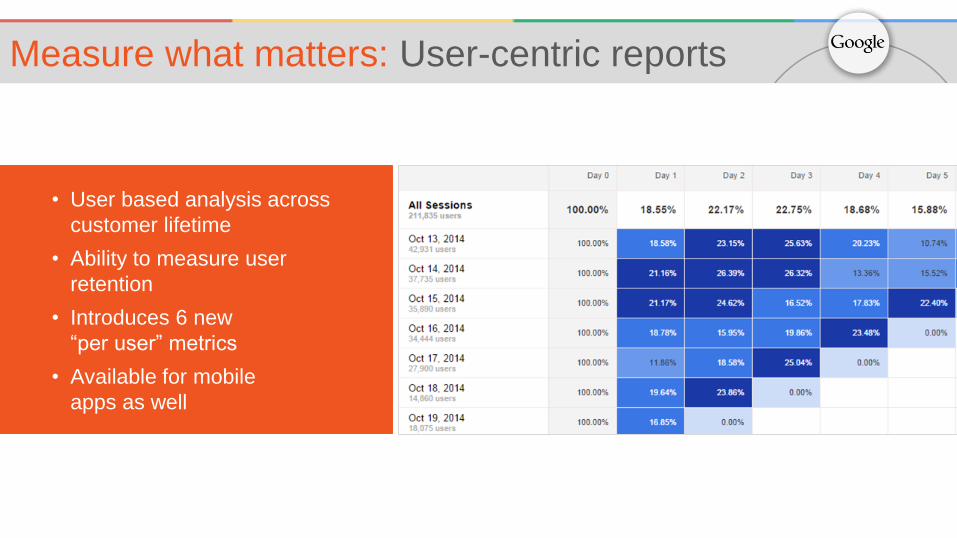
Measure what matters: User-centric reports
• User based analysis across
customer lifetime
• Ability to measure user
retention
• Introduces 6 new
“per user” metrics
• Available for mobile
apps as well
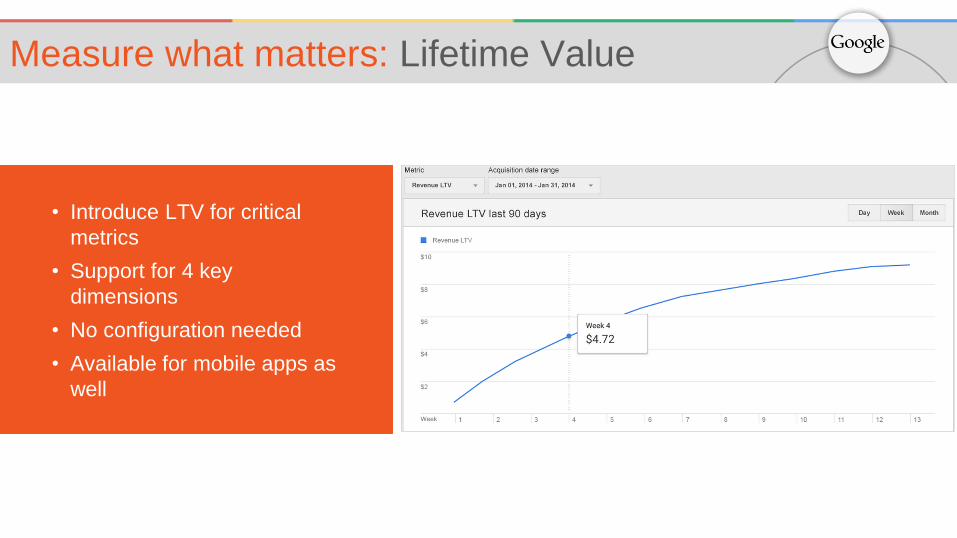
Measure what matters: Lifetime Value
• Introduce LTV for critical
metrics
• Support for 4 key
dimensions
• No configuration needed
• Available for mobile apps as
well
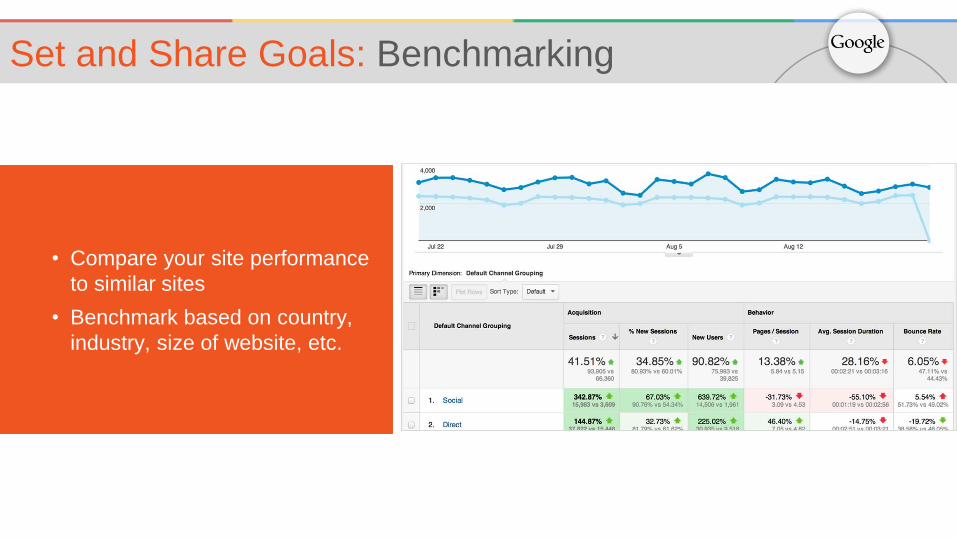
Set and Share Goals: Benchmarking
• Compare your site performance
to similar sites
• Benchmark based on country,
industry, size of website, etc.
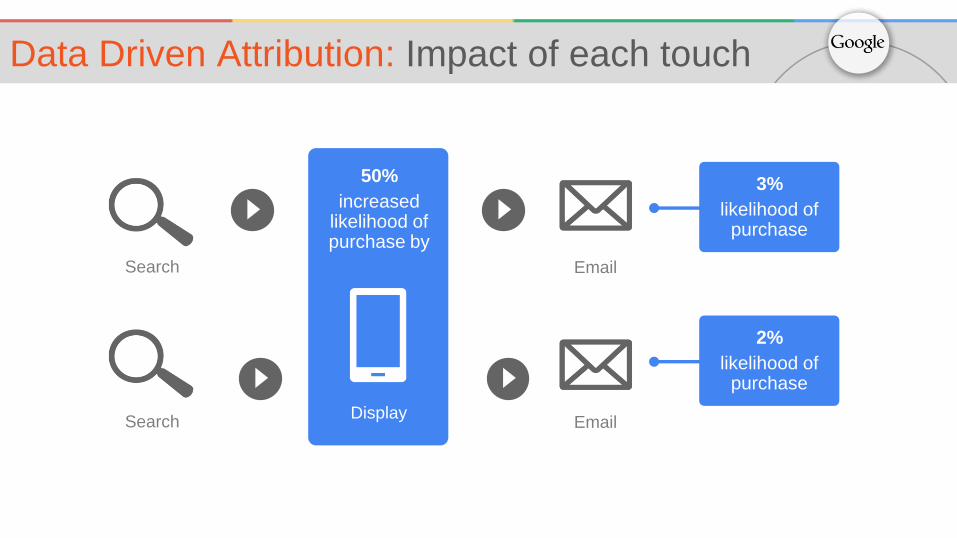
Data Driven Attribution: Impact of each touch
Search Email
DisplaySearch Email
3%
likelihood of purchase
2%
likelihood of purchase
50%
increased likelihood of purchase by
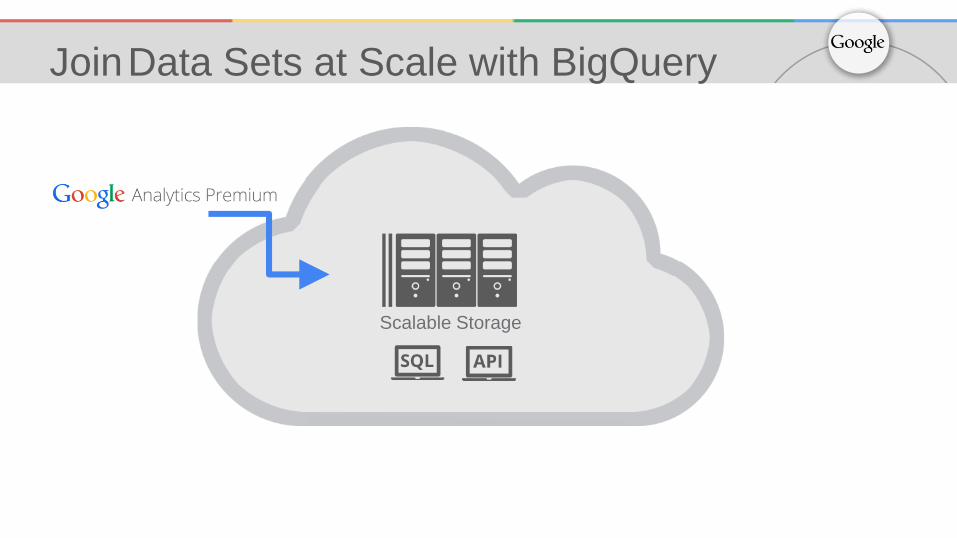
Scalable Storage
JoinData Sets at Scale with BigQuery
Scalable Storage
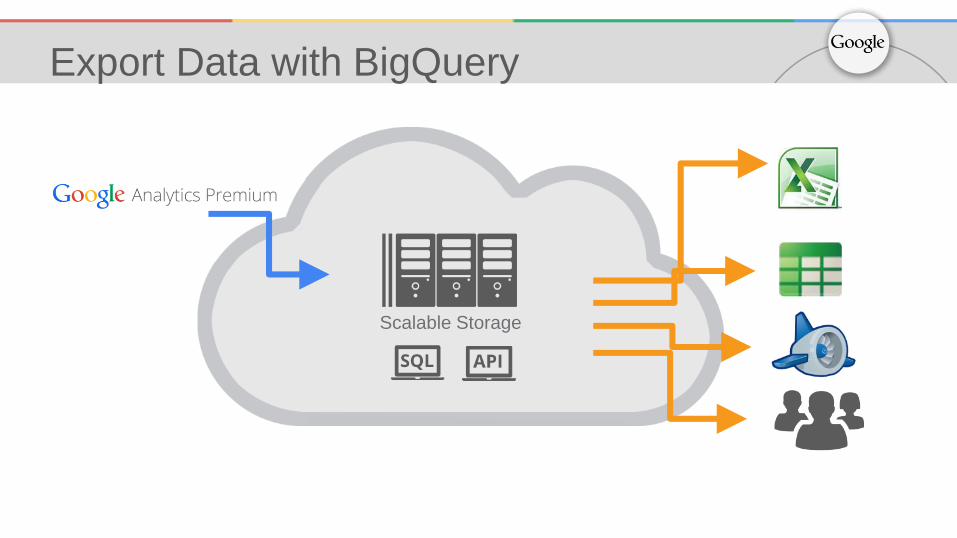
Export Data with BigQuery
Scalable Storage
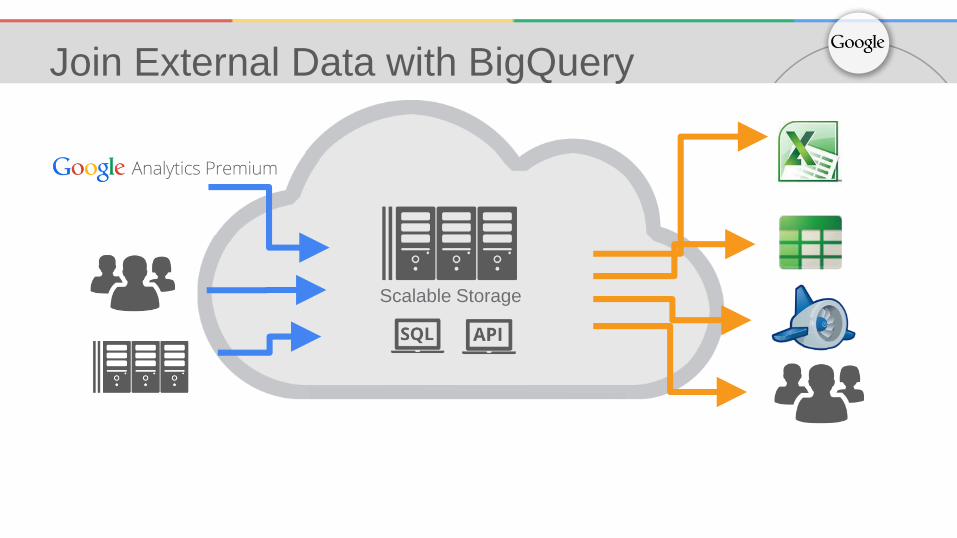
Join External Data with BigQuery
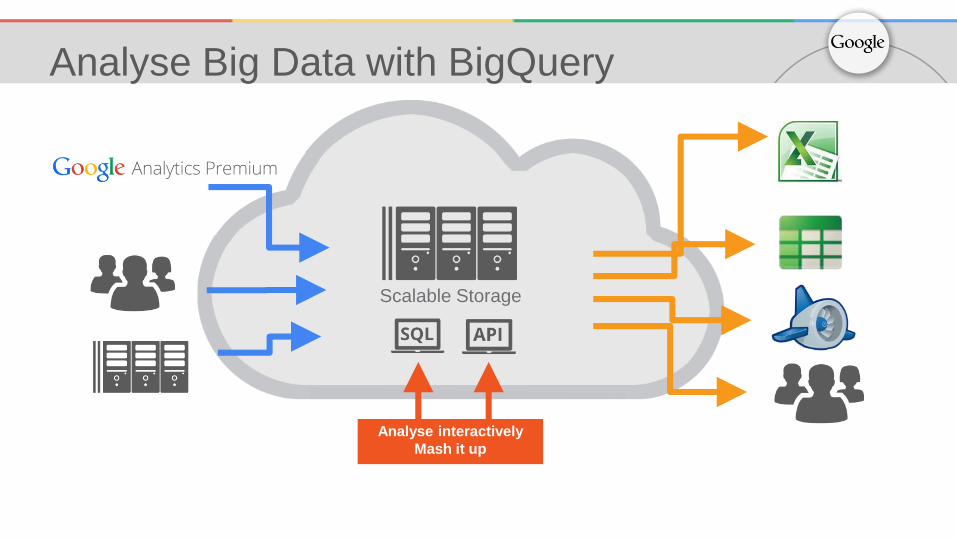
Scalable Storage
Analyse interactively
Mash it up
Analyse Big Data with BigQuery

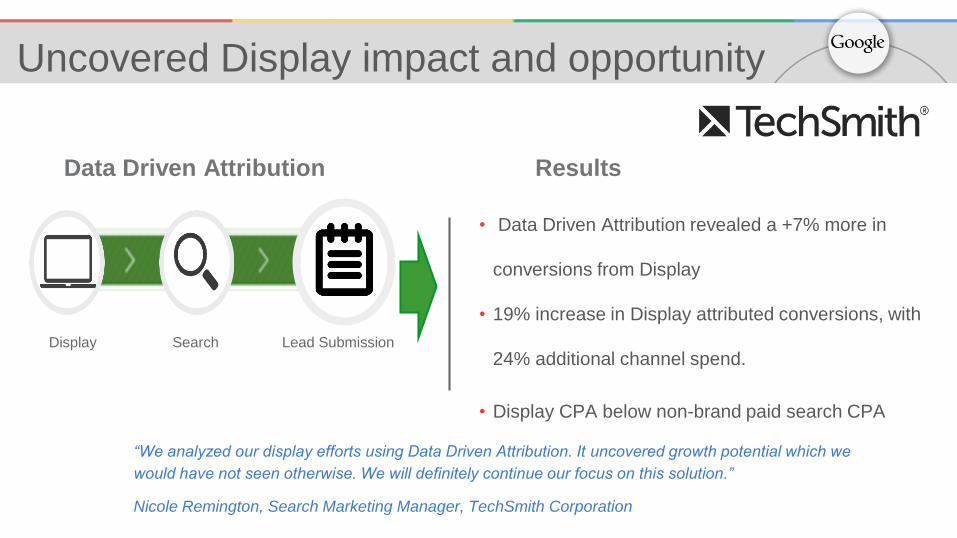
Display Lead SubmissionSearch
• Data Driven Attribution revealed a +7% more in
conversions from Display
• 19% increase in Display attributed conversions, with
24% additional channel spend.
• Display CPA below non-brand paid search CPA
Uncovered Display impact and opportunity
“We analyzed our display efforts using Data Driven Attribution. It uncovered growth potential which we
would have not seen otherwise. We will definitely continue our focus on this solution.”
Nicole Remington, Search Marketing Manager, TechSmith Corporation
Data Driven Attribution Results
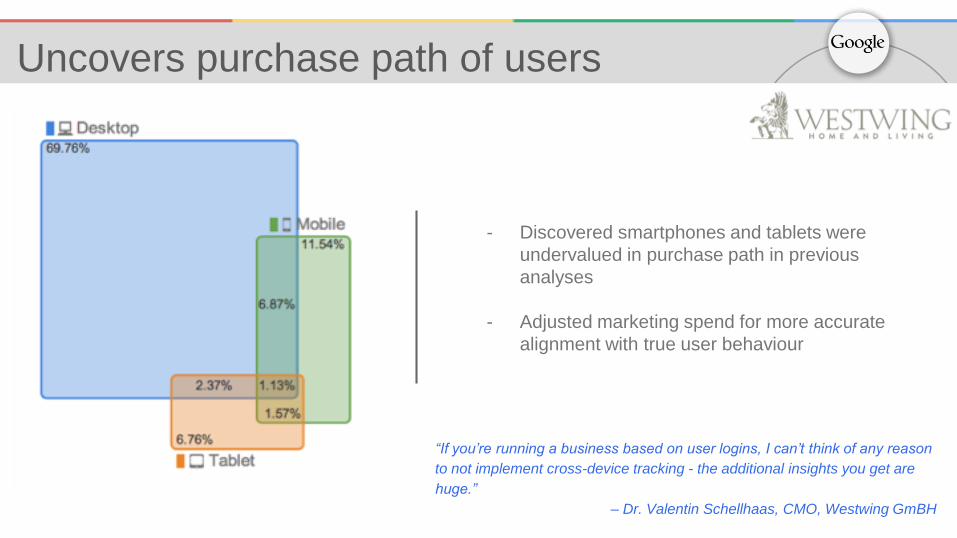
“If you’re running a business based on user logins, I can’t think of any reason
to not implement cross-device tracking - the additional insights you get are
huge.”
– Dr. Valentin Schellhaas, CMO, Westwing GmBH
Uncovers purchase path of users
- Discovered smartphones and tablets were
undervalued in purchase path in previous
analyses
- Adjusted marketing spend for more accurate
alignment with true user behaviour
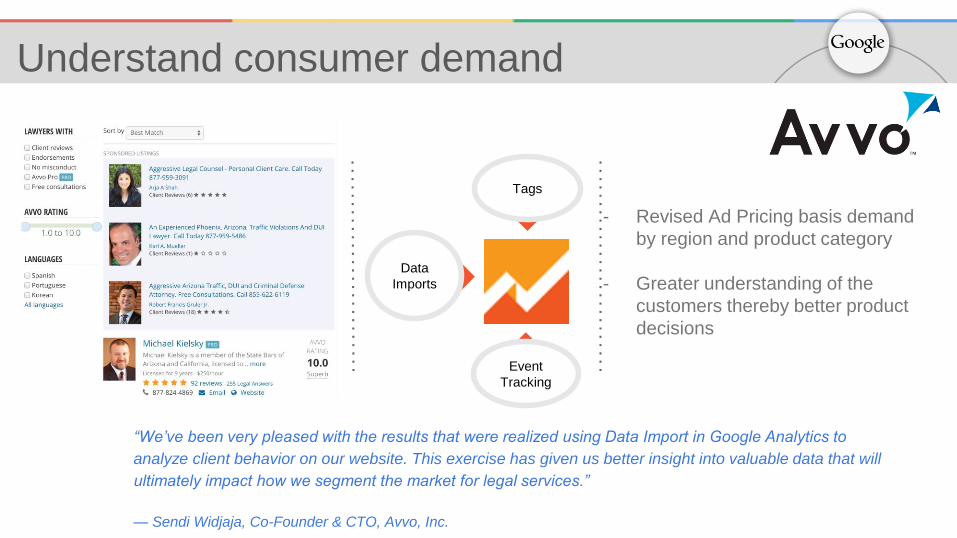
- Revised Ad Pricing basis demand
by region and product category
- Greater understanding of the
customers thereby better product
decisions
Understand consumer demand
“We’ve been very pleased with the results that were realized using Data Import in Google Analytics to
analyze client behavior on our website. This exercise has given us better insight into valuable data that will
ultimately impact how we segment the market for legal services.”
— Sendi Widjaja, Co-Founder & CTO, Avvo, Inc.
Tags
Event
Tracking
Data
Imports

Acting on your data with remarketing
Remarketing in DBM
Remarketing in DFP
Remarketing lists for search
CRM remarketing
Dynamic remarketing
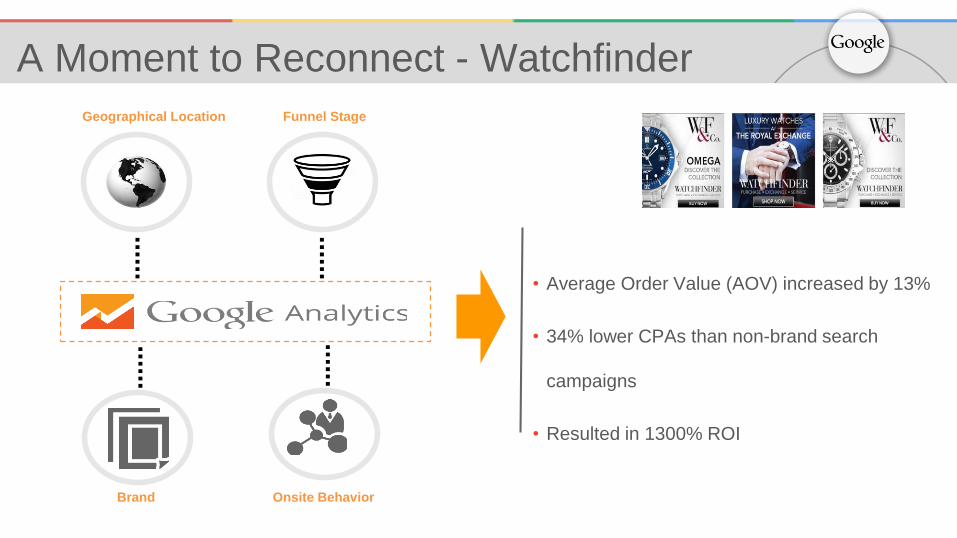
A Moment to Reconnect - Watchfinder
Funnel StageGeographical Location
Onsite BehaviorBrand
• Average Order Value (AOV) increased by 13%
• 34% lower CPAs than non-brand search
campaigns
• Resulted in 1300% ROI
......
......
......
......
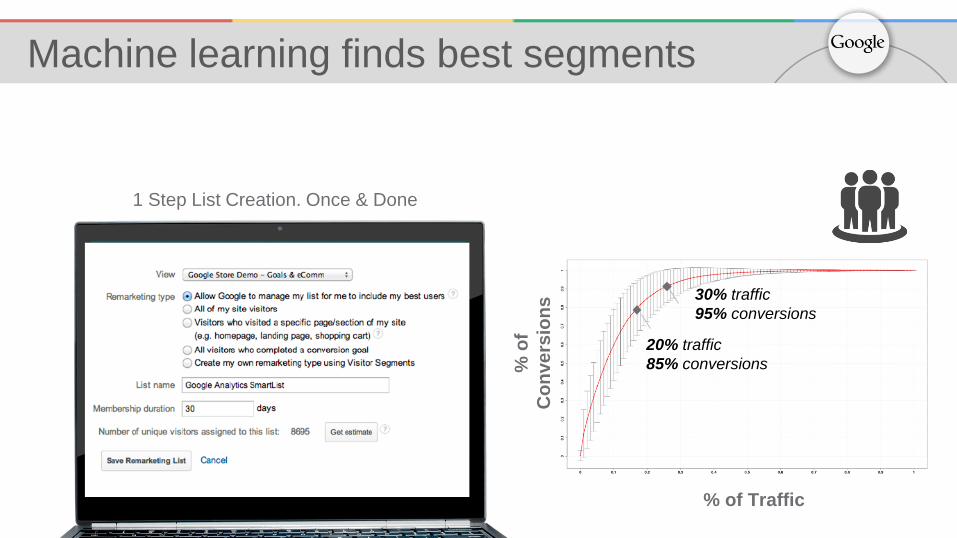
1 Step List Creation. Once & Done
Machine learning finds best segments
% o
f
Co
nve
rsio
ns
% of Traffic
20% traffic
85% conversions
30% traffic
95% conversions

Questions!