google data studio - first impressions @ measurecamp
TRANSCRIPT

Google Data Studio
Special thanks to for these slides
1. Role of visualiaation in decision-making
2. How to visualisation using Google Data Studio
3. Examples of Google Data Studio reports
4. Quiz
Agenda

1.Role of visualisation in
decision-making

Why use data visualisation ?
1. 90% of the information a person perceives is through sight.
2. 70% of the sensory receptors are located in the eyes.
3. About 50% of human brain neurons are involved in the processing of visual
information.
4. Human productivity is 17% higher when working with visual information.
5. A person understand 323% better if the answer contains illustration.
6. A person understand visual information 60,000 times faster comparison to the same information as text.

Who earned the most medals in Rio ?

Who earned the most medals in Rio ?

Who earned the most medals in Rio ?

Requirements for a visualization tool
1. Combining data from different sources
2. Data formulas & functions
(computed metrics & parameters)
3. A wide selection of widgets & graphs
4. Style, design, interactive reports
5. Access to the record management
6. Simple intuitive interface

2. Google Data Studio

Data Studio part of Google Analytics 360 Suite
Tag Manager 360 - Data Collection
Data Studio 360 Data Analysis and Visualization
Analytics 360 Customer Insights
Attribution 360 Marketing
Measurement
Optimize 360 Site Testing and Personalization
Audience Center 360 Audience
Management

What you need to know about Google Data Studio
1. 2nd June 2016 - US Public Beta
2. You can create reports and sources via a VPN
3. Five reports per account in free version.
4. Unlimited number of data sources.
5. Unlimited number of tabs in per report.
6. Ability to copy reports.

We need to learn three simple steps

Available connectors
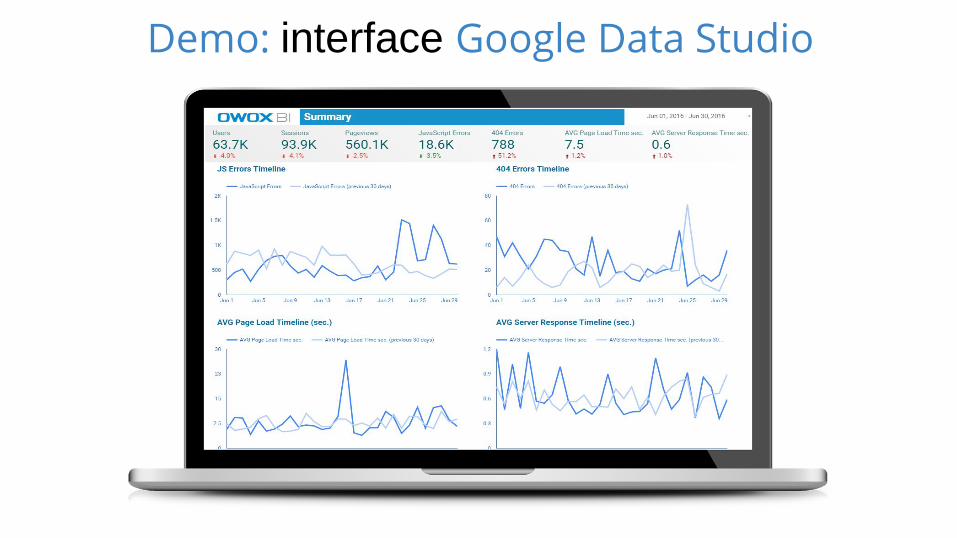
Demo: interface Google Data Studio

Access control Action Can view Can edit Is owner
View data in the report x x x
Copy the report and store on Google Drive x x x
Share / stop sharing the report with others x x
Modify the report x x
Add and modify data from attached data sources x x
Attach / remove data sources x x
Create / delete the report x

Notes so far: 1. Beta-issues (fixed soon):
- Currency defaults to USD
- Sometimes see service error
- Quality Score missing from Adwords integration
- Must be loggedin to a google account to view report.
2. You can`t natively create a filter on a metric
(unless you use an if statement calculated field)
3. Default date ranges are missing 4weekly & half year.
4. Only possible to join date using date field
5. Currently no ETL / transform function
(but this can be done in BigQuery)

3. Examples of reports in Google Data Studio

Sample reports
1. Technical performance indicators for your website
2. YouTube Channel Report
3. What happened to M Night Shyamalan?
4. AdWords Report
5. Marketing Attribution Dashboard
6. TV Ad Perfomance
7. World Population

4. Quiz

bit.ly/data-studio-quiz

Top members from Quiz

Thank you