government of keralaecostat.kerala.gov.in/images/pdf/publications/agriculture_census/... ·...
TRANSCRIPT

Government of Kerala
REPORT
ON 9th AGRICULTURAL CENSUS
2010-11
Department of Economics and Statistics
Government of Kerala www.ecostat.kerala.gov.in
2014

PREFACE
In view of the imperative need for detailed data on structure
and other characteristics of Agricultural Holdings, Ministry of Agriculture,
Department of Agriculture and co-operation, Government of India decided to
conduct quinquennial Agriculture census since 1970-71 in collaboration with
state governments and Union Territories in conformity with the concepts &
definitions used in world Agriculture census. For Agriculture census the land
which is actually cultivated/operated by a person/group of persons/institution
is considered as a basic unit of enumeration and the expression “Operational
Holding” is used collection of data.
The 9hAgriculture census was carried out in Kerala during 2010-
11 as the reference year. The field work was done by the investigators of the
department supervised by the officers of the department. The data processing
was done by the computer division of the Directorate.
The results of 9th Agriculture Census 2010-11 in the state are
presented in this report. The first 2 chapters contain introduction, concepts,
definitions, methodology. Results are presented with summary findings
analytical notes, tables, etc in chapter III. I would like to appreciate the efforts
put in by the Agriculture Census division for bringing out this publication had
taken the responsibility of preparing the report with the help of Smt. S.C.Soni
and K.S Vishvanath Research Assistants ,Sri. P.K Ravi., Statistical Assitant
Grade-I ,Sri.B.Nadirsha, Statistical Assistant Grade.II under the guidance of
Sri.T.Gorkey Jose,Additional Director,Sri.A.Rajan,Joint Director &State Technical
officer and Sri.A Murugan Assistant Director of Agriculture Census Division.
I hope that this publication is capable of throwing light on the structure
and pattern of agriculture in the state which in turn helps the planners, policy
makers, decision makers, researchers etc.
Suggestions, if any are most welcome.
Thiruvananthapuram
30-08-2014 Sd/-
V.Ramachandran
Director General

CONTENTS
Page No.
CHAPTER I
Introduction
1
CHAPTER II
9th
Agricultural Census
12
CHAPTER III
Results of the Census
14
Appendices
Tables
42

1
CHAPTER-1 INTRODUCTION
Government of India have been conducting Agriculture census once in
five years regularly since 1970-71,following the broad guidelines of the World
Agricultural Census. World Agriculture Census is conducted by the FAO of United
Nations. Agricultural Census is a large scale statistical operation for the collection and
compilation of quantitative information about the structure of agriculture in the country.
An agricultural operational holding is the ultimate unit for decision making for
development of agriculture at micro level. So an operational holding is taken as the
statistical unit of data collection for describing the structure of agriculture.
Agriculture Census is implemented in three distinct Phases which are
statistically linked together. Each Phase focus on different aspects of Agricultural
Statistics. First phase consists of listing of operational holdings with area and social
characteristics of holders. Details of Agricultural characteristics of holding are collected
from selected wards in the second phase. In phase 3, data on input use pattern are
collected from selected holdings in selected wards. Thus the whole operations of
Agricultural Census in India is not really a complete Census. In fact it is a combination
of census and Sample Survey.
The first comprehensive country wide Agriculture Census was organized in
India by the Ministry of Agriculture during the year 1970-71 which was followed by
reference years 1976-77, 1980-81, 1985-86, 1990-91, 1995-96, 2000-01, 2005-06 and
2010-11. This report relates for the 9th Agriculture Census 2010-11. This is a 100%
centrally sponsored scheme.
2
The main objectives of the Census are as follows.
1. To describe Agricultural Statistics and related characteristics of agriculture by
providing statistical data on operational holdings, including Land utilization,
Live Stock, Agricultural machinery and implements, Use of chemical fertilizers
etc.
2. To provide data needed for formulating new agricultural development
programmes and for evaluating the progress.
3. To provide basic frames of households and operational holdings for carrying out
future surveys.
4. To lay down a basis for developing an integrated programme for current
Agricultural Statistics.
As in the former Census the mode of sample survey (Simple Random Method) is
used in this round also.
Approach for Data Collection
The basic unit for collecting data on Agricultural Statistics is the operational
holding i.e., the holding of the actual cultivator who need not be the owner is the unit
for collection of data. As comprehensive land records are not available in the non land
record states like Kerala the required data would be collected from the operational
holders through sample surveys by adopting enquiry method. The data is collected from
the operational holders in selected wards in the prescribed schedules by visiting every
house holds/institutions.

3
Schedules
The following schedules are used for the conduct of Agriculture Census.
Schedule L1 : List of Households and operational holdings in the sample ward.
Schedule L2 : List of Institutional holdings in the sample ward (Complete enumeration in the sample ward). Schedule L3 : Ward summary.
Schedule L4 : List of operational holdings in the sample ward and sample
selection of holdings.
Schedule T1 : Abstract of Number and Area of operational holdings by
different size classes classified according to sex wise, social
group wise Individual/Joint/Institutional wise.
Schedule SS : Sample Selection Summary.
Schedule H : Particulars of Operational Holders.
Item coverage
Data on the following main aspects were collected during the Agriculture
Census with the agriculture year 2010-11 (July 2010 to June 2011) as the reference
year. During Phase 1, viz, the listing phase, data on number and area of operational
holdings according to prescribed size classes for different social group and sex were
collected. In the 1st phase, data on basic agricultural infrastructure available in the
sample wards were also collected. In Phase 2, which is the main census operation,
though only for selected holdings in the selected wards, the data on the following five
aspects were collected.

4
1. Dispersal of holdings
2. Tenancy
3. Land utilization
4. Irrigation status and Source wise area irrigated
5. Crop wise area irrigated
All the data were compiled separately for the operational holdings of
four groups, viz., Scheduled Caste, Scheduled Tribes, Others and Institutional, and
also for the total of this groups. The Priority Table-1, which related to Number and
Area of holdings by various size classes was prepared sex wise, social group wise
and individual; joined, institutional wise.
Sampling Design
A stratified two stage sampling design is recommended for Agriculture Census
in the non-land record states. In view of the increasing demand for Agricultural Census
data at Block level, it has been decided that the community Development Block or some
other similar homogeneous administrative units (Municipality and Corporation) should
be taken as stratum. The first stage unit within the stratum will be the ward and the
second stage unit will be the operational holdings.
For the 2010-11 census a stratified two stage sampling design was recommended
in the non-land record states like Kerala. The stratum is block. The first stage unit
within that was the Panchayat ward and the second stage was the operational holdings.
In view of the increasing demand for Agriculture Census data at Block level, it was
suggested that the community Development Block should be the stratum in the rural
area and Municipalities/Corporation in Urban area. From each stratum 20% of the
wards in each block and 20% of the wards/divisions from each
Municipality/Corporation area were selected using circular systematic random sampling
method. A total of 3847 Wards/Divisions were selected for the survey. In each selected

5
ward all the operational holders were listed in Schedule L1. A separate list of
institutional holdings was also prepared for each sample ward during the time of listing
in Schedule L2. During the time of listing some basic agriculture information for the
sample ward was also collected in Schedule L3.
For detailed survey 20% of the holdings are selected from the size class 0-246
Cents i.e., below 1 ha, 50% from above 1ha, and below 10 ha, 100% from 10 ha and
above. Schedule L4 is used to prepare the sampling frame for the selection of the
required number of holdings for collecting detailed information in Schedule H. All the
institutional holdings in the selected wards were included in the sample for filling
Schedule H, i.e., no sampling has done for institutional holdings.
Primary field work
The primary field work consists of collecting information in respect of resident
cultivators in the sample wards. Non-resident cultivators are not be covered in the
survey as it may be difficult to approach them. A separate list of institutional holding
are also prepared for each sample ward.
Concepts, Definitions and Methodology
In Agriculture Census data is to be collected on the basis of “de-facto” (by fact)
position rather than “de-jure” (by right) position.
1. Operational Holdings
All land which is used wholly or partly for agricultural production and is operated
as one technical unit by one person alone or with others without regard to title, legal
form, size or location.
2. Technical Units
A technical unit has been defined as that unit which is under the same
management and has the same means of production such as labour force, machinery and
animals.
6
3. Operated Area
Operated area would include both cultivated and uncultivated area, provided part
of it is put to agricultural production during the reference period.
The Operated area may be comprise of
a) Land owned and self operated
b) Land Leased in
c) Land otherwise operated
a) Land owned and self operated
Land for which the cultivator has the right to permanent heritable
possession would be considered as owned. This would include.
Land held from Government or others under grant or lease or assignment
with right of permanent heritable possession with or without right of
transfer.
Land operated under perpetual lease.
Self-operated land would include.
Self cultivation
Land cultivated through members of the family.
Land cultivated with the help of hired labour.
Note: Land owned and self-operated should not include land leased out to
others.
b) Leased in
Area leased in is defined as land taken on lease from others without any
permanent right of possession for the lessee. Land may be leased in for.

7
I. Fixed money
II. Fixed produce
III. Share of produce
IV. Usufructuary mortgage
Under (iv), the ownership of the property is with the mortgager but the
possession is with the mortgage (i.e. The person to whom the mortgage is made
or given), income from the property accrues to the Mortgage and the mortgage is
terminated as soon as the full amount is released.
c) Area otherwise operated
An operational Holder is the person who has the responsibility for the
operation of the agricultural holding and who exercise the technical initiative
and is responsible for its operation. He may have full economic responsibility or
may share it with others.
4. Operational Holder
An operational holder is the person who has the responsibility for the
operation of the agricultural holdings and who exercise the technical initiative
and is responsible for its operation. He may have full economic responsibility or
it may share with others. The operational holder may be
individual/Joint/Institutional.
I. Individual: If the holding is being operated either by one person alone or by
group of persons who are the members of the same households, it will be
considered as an individual holdings.
II. Joint: If two or more persons belonging to different households share jointly as
partners in the economic and technical responsibility for the operation of an
agricultural holding, such holding would be considered as joint.

8
III. Institutional: Holding such as government farms, sugarcane factories farms, co-
operative farms, lands managed by trust would be treated as institutional.
5) Agricultural Production
Agricultural production includes growing of field crops, fruits, seeds, tree
nurseries (except those of forest trees) vegetables and flowers, production of coffee,
tea, cocoa, rubber, jute, oil seeds, fodder grass etc. If efforts is made for raising
grass, it will be treated as agricultural operation.
6) Resident and Non-resident operational holder
All the cultivators residing in particular Panchayat, Municipality/Corporation
ward cultivating some land are resident cultivators of that sample ward irrespective
of fact whether they are cultivating land within that village or outside. A resident
cultivator may have (i) entire area of the holding located in the sample ward of his
residence, (ii) partly within the sample ward of residence and partly outside; and (iii)
entirely outside the ward of residence.
7) Complete/Part Holding
A holding is said to be complete holding if the entire operated area of that
holding is located in the same ward. If the operated area spread over in more than
one ward, it would be considered as part holding.
8) Wholly irrigated, partly irrigated and wholly unirrigated holdings.
If the entire net area sown in an operational holding is equal to net area irrigated,
such holding is considered as wholly irrigated holding. In case part of the net sown
area is irrigated, it will be partly irrigated; and if the entire sown area has not
received any irrigation during the year of reference, such holding would be wholly
un irrigated.
9
9. Land Utilisation
Operated area would be classified in to six broad categories:
i. Net area sown
ii. Current fallow
iii. Fallow land other than current fallow
iv. Other uncultivated land excluding fallow
v. Cultivatable waste
vi. Not available for cultivation
I. Net area sown
Total area sown with crops and orchards, counting area sown more than once in
the same year, only once.
II. Current fallow
Cropped areas, which are kept fallow during the current year. For example, if
any seedling area is not cropped in the same year, it may be treated as current
fallow:
III..Fallow other than current fallow
All lands which are taken up for cultivation but area temporarily out of
cultivation for a period of not less than one year and not more than five years.
The reasons for keeping such lands fallow may be one or more of the following.
i. Poverty of the cultivator
ii. Inadequate supply of water.
iii. Malarial climate
iv. Silting of canals and river
v. Un-remunerative nature of farming

10
IV. Other uncultivated land excluding fallow
This will include
a) All gazing lands, whether they are permanent pastures and mead ows or
not. Village common grazing lands would, however, be excluding.
b) Land under miscellaneous tree corps
Cultivable land which is not included in the net area sown but is put to
some agricultural use. Land under casuarinas trees, thatching grasses,
Bamboo bushes and other groves for fuel which are not included under
‘orchards’ would be covered under this category.
V. Cultivatable Waste
All lands available for cultivation, whether or not taken up for cultivation once
but not cultivated during the current year and last five years or more in
succession for one reason or the other. Such lands may be either wholly or
partly covered with shrubs and jungles, which are not put to any use. Land once
cultivated but not cultivated for five years in succession would also be included.
VI .Not available for cultivation
This would include forest, area under non agricultural use, barren and
uncultivable land
a) Forest
All lands classed as ‘Forest’ under any legal enactment dealing with
forests or administered as forests, whether State owned private and
whether wooded or maintained as potential forest. The area of crops
raised in the forest and grazing lands or areas open for gracing within
the forest would under the forest area. Only private forest would be
covered for the purpose of Agricultural Census.
b) Area under non-agricultural use
All lands occupied by buildings or ponds,or lands put to uses other
than agriculture, such lands within the cultivated holdings should be
covered in the Census.
c) Barren and uncultivable land
All barren and uncultivable land within the cultivated holding

11
Methodology
The basic unit for the collection of data in Agriculture Census is the operational
holding. The holding of the actual cultivator, not the owner is the unit for collection of
data. The data for the entire land operated by the cultivator were collected and no outer
limit was fixed for pooling all the parcels of an operational holding. As there are no
comprehensive land records in the non-land record states, like Kerala, the required data
were collected through sample survey by adopting enquiry method, from the operational
holders of the selected sample wards.
Limitations
The main problem encountered during the analysis of data was under
reporting. This was visible in the area reported under the operational holdings as well
as under various crops. This is mainly due to the enquiry method adopted for the
survey. The cultivators, the majority of them not keeping any account, were furnishing
information from their memory. This resulted in incorrect information especially in the
case of fertilizers and pesticides, crops for different seasons for the year etc. Any how
much care has been taken in collecting correct information through probing by
investigators. The ceiling provisions of an individual family under the Kerala Land
Reforms Act were another reason for under reporting by the holder of the land. In the
case of mixed cropping pattern, area under cultivation of different crops can be written
only by counting the number of trees and then converting the same into area using
standard conversion factors. This trend of under reporting is a common feature in a
census of this type since it is the only method of collection of data at micro level at
lesser cost Data can be made use of after giving proper allowance to the estimates
knowing the limitation and deficiencies of the census data.

12
CHAPTER – II
9th AGRICULTURE CENSUS
The Ninth Agriculture Census 2010-11 was conducted in Kerala during the
period August 2011. The field work of the 9th census was carried out by the
investigators of the Economics and statistics department. The whole census operations
were supervised by the nucleus staff at state headquarters consisting of
Joint Director 1
Assistant Director
Administrative Assistant
1
1
Research Assistant 2
Confidential Assistant 1
Typist 1
Statistical Assistant Grade-I
Statistical Assistant Grade-II
1
1
Peon 1
Government of Kerala vide GO (Rt) No. 201/11/plg dated 30.06.2011 had
issued, sanction for the implementation of this Centrally Sponsored Scheme with 100%
Central Assistance. The field work of the Census was completed by 2011. The
tabulation and processing of data was done in the computer division of the department.
The personnel from the Agricultural Census division had rendered all assistance during
data entry work especially during concurrent clarification of doubts regarding filled in
schedules. The first sets of tables were forwarded to Government of India by March
2011. The final tables were forwarded to the Director of Agriculture Census,
Government of India by 2013-14. The final tables were approved by the Government of
India by 2014, as per D.O No.11015/05/2013-ACU (T) dated 03/01/2014 .The CD
containing final tables of 2010-11 agriculture census was handed over to the state
during the end of 2013 from the Director of Agriculture Census, Government of India.

13
The final Table are generated block wise, district wise and for the state for all
the social groups Institutional and scheduled caste, scheduled tribes and other categories
separately.
Field organization at State Level
The field work was done by the Investigators of this Department.
Statistical Inspectors/Taluk Statistical Officers/Additional District Officers/Price
Supervisory Officers and Deputy Directors of the districts provided the leadership at the
district level under the technical guidance from the Head Office.
Before the commencement of the 2010-11 census, intensive training was given
to all personnel involved in the field work. Wide publicity through media was also
given for dispelling the fear of the farmers that they can furnish correct information to
the enumerators. It was also made clear that individual information about operational
holding would not be released. For the accuracy of the data intensive periodical
inspections were conducted by the supervisors. Senior officers from headquarters also
conducted intensive inspection.
The tabulation of the census data was done in the computer division of the
department. The Senior Officers of the scheme provided necessary technical guidance
in this regard. The concept and definitions adopted for the conduct of the census with
detailed explanation have been included in instructions to the Investigators prepared in
Malayalam. Analysis of data has been made separately for Scheduled Caste, Scheduled
Tribes and other categories

14
CHAPTER III
RESULTS OF THE CENSUS
According to the Agricultural Census 2010-11 the total number
of operational holdings in Kerala has been estimated 68.31 lakhs out of which
individual holdings accounted for 67.68 lakhs. This accounted for 99.08%. The
remaining 0.92% are institutional and joint holdings. There are 6274 joint holdings
reported during 2010-11 Census.
Table-1
Type of operational holdings No. of operational holdings Area operated (Ha)
Individual 6768257 1392022
Joint 6274 4922
Institutional 56258 113872
Total 6830789 1510816
Number of operational holdings
6768257
627456258
0
10000002000000
30000004000000
5000000
60000007000000
8000000
Individual Joint Institutional

15
The 68.31 lakhs operational holdings accounted for an operated
area of 15.11 lakhs hectares out of which 13.92 lakhs hectares were the operational area
of individual holdings. Institutional holdings, accounted for 0.82% of the total number
of holdings accounted for an area of 7.54% of the total operated area in the state;
showing a comparatively very high average size of the holding for them. With regard to
joint holdings, 0.09% of the total number of holdings, have accounted for an area of
0.33% of the total operated area in Kerala.

16
Comparison with 2000-01,2005-06,2010-11 Census
TABLE-1I
NUMBER AND AREA OF OPERATIONAL HOLDINGS DURING
2000-01, 2005-06, 2010-11
Type Number of Operational holdings Area in Hectares
2000-01 2005-06 2010-11 2000-01 2005-06 2010-11
Individual 6568383 6833448 6768257 1456543 1436394 1392022
Joint 7589 4455 6274 4110 3953 4922
Institutional 80660 66389 56258 108885 114479 113872
Total 6656632 6904292 6830789 1569538 1554826 1510816

17
A comparative analysis of 2000-01, 2005-06 and 2010-11 Census figures
shows that the total number of holdings under all categories together as increased from
66.57 lakhs in 2000-01 to 69.04 lakhs in 2005-06 and decreased to 68.31 lakhs in
2010-11 recording a percentage increase of 3.72 in 2005-06 and a percentage decrease
of 1.1 in 2010-11.
Area of Operational Holdings 2000- 01, 2005- 06, 2010-11
1456543 1436394 1392022
4110
3953
4922
108885
114479
113872
1300000
1350000
1400000
1450000
1500000
1550000
1600000
2000-01 2005-06 2010-11
Area in Hectares
Individual Joint Institutional
As far as the number of individual holdings are concerned, the
percentage increase was 4.04 in 2005-06 and a decrease of 0.95 in 2010-11.
Institutional holdings are decreased by 17.69% in 2005-06 and 15.26 in 2010-11. There
is a diminishing trend in area from 2000-01 to 2005-06 and from 2005-06 to 2010-11
for individual holdings.

18
TABLE-III
Social Group No. of Operational Holdings Area Operated(Ha)
Institutional 56258 113872
Scheduled Caste 532005 35247
Scheduled Tribe 95161 34442
Others 6147365 1327255
Total 6830789 1510816

19
Table III reveals the fact that out of the total of 6830789
holdings 6147365 holdings are belonging to ‘Others’ category i.e., 89.99% of the total.
Only 7.79% for Scheduled Caste, 1.39% for Scheduled Tribe and 0.82% for
Institutional holdings. The corresponding percentages of area are Others 87.85%,
Scheduled Caste 2.33%, Scheduled Tribe 2.28% and Institutional 7.54.
20
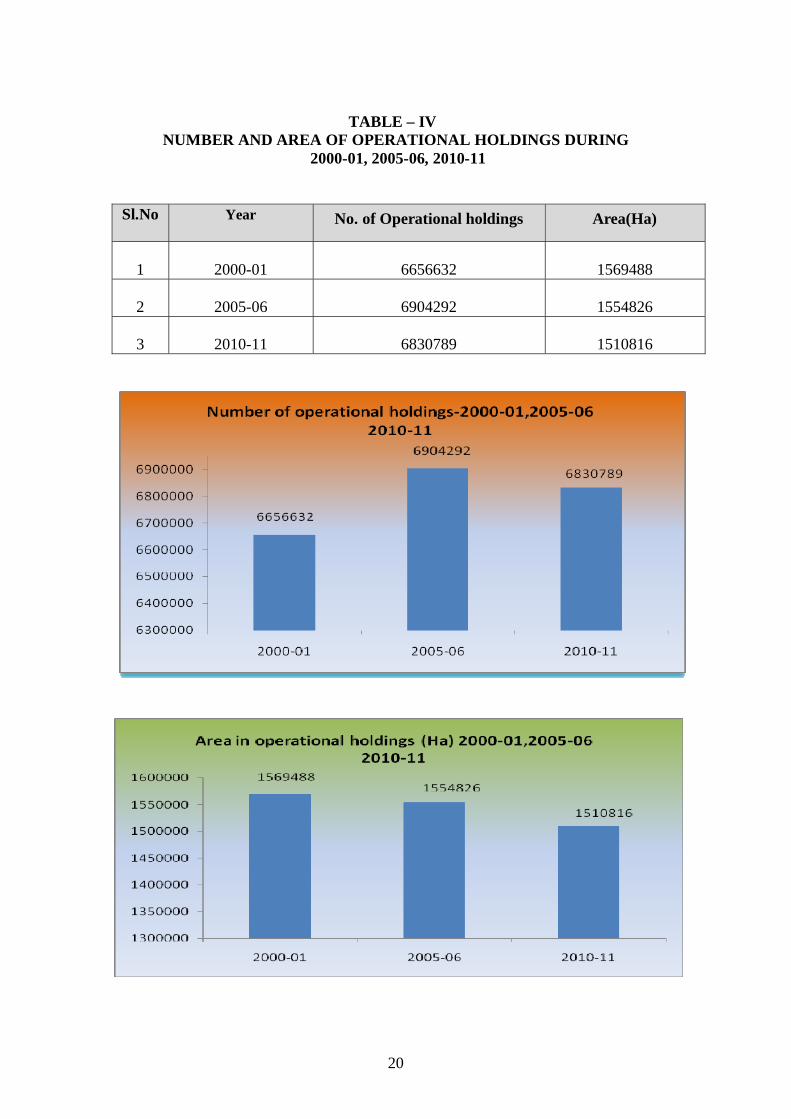
TABLE – IV NUMBER AND AREA OF OPERATIONAL HOLDINGS DURING
2000-01, 2005-06, 2010-11
Sl.No Year No. of Operational holdings Area(Ha)
1
2000-01
6656632
1569488
2
2005-06
6904292
1554826
3
2010-11
6830789
1510816

21
It is obvious from the above table that an increasing trend in the number
of operational holdings from 2000-01 to 2005-06 and decreasing trend in 2010-11,
whereas a diminishing trend is observed in the corresponding area operated.
The land holdings were classified in to 10 size classes according to size
and detailed tables in respect of the estimated number and area of operational holdings
have been prepared. But for detailed discussion, comparison and analysis of the census
results, these 10 size classes have been grouped up to five size groups.
1 .Below 1 hectare (marginal)
2. 1 to 2 hectares (small)
3. 2 to 4 hectares (semi-medium)
4. 4 to 10 hectares (Medium)
5. 10 hectares and above (large)
Type of holding
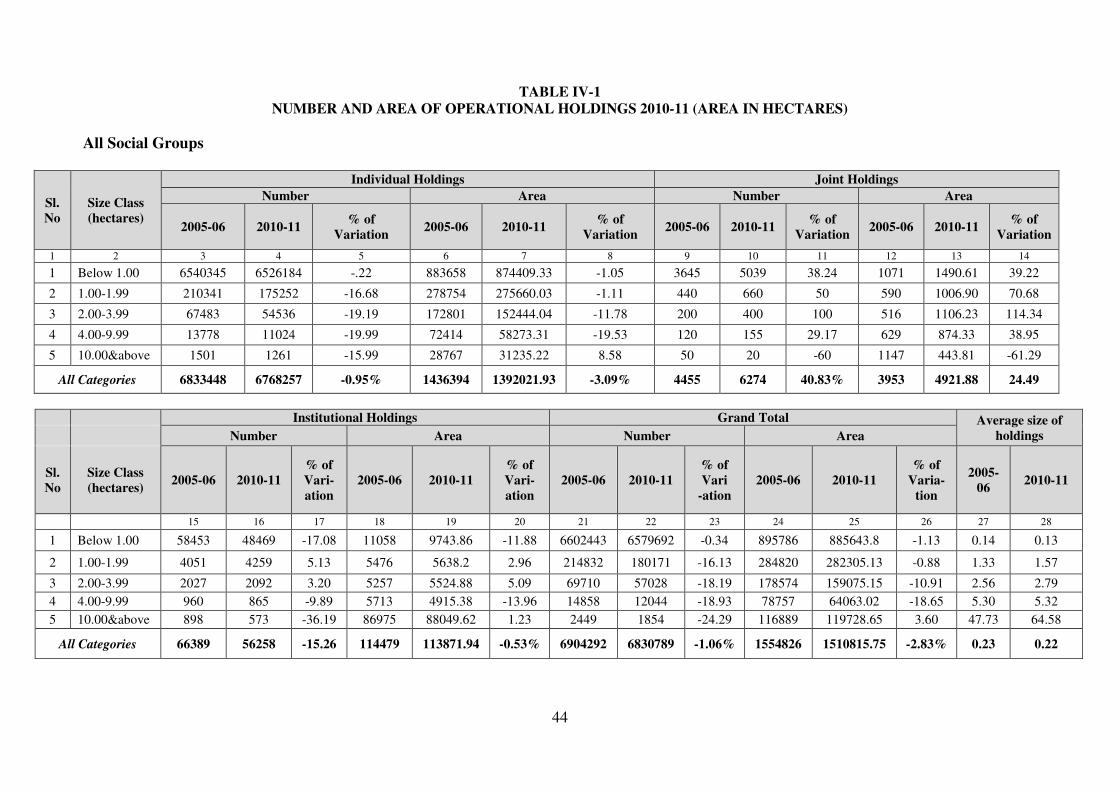
Table IV 1 in the Appendix gives the distribution pattern of operational
holdings under individual, institutional and joint. Out of the total holdings of 68.31
lakhs, the size group below 1 hectare account for 65.80 lakhs which is the 96.33% of the
total number of holdings. The total area operated by these holdings is 885644 hectares
which works out to 58.62% of the total area. The average size of the group is 0.13
hectares. Next to marginal holders, the holders in the group of small, numbering to 1.80
lakhs which is the 2.64% of the total number of holdings with an operated area of
282305 hectares which is 18.69% of total operated area with an average size class of
1.57 hectares. As in the case of past censuses, the larger size class constitute the lower
number of operational holder and larger area of operational holding with average size of
operational holding 64.58 hectares

22
Average size
TABLE-1V-1
Sl.No Size Class hectare
No of Operational
holders (in lakhs)
Area of Operation (hectares)
Average size of holders (hectares)
1 Below 1 hectare 65.80 885644 0.13
2 1 to 2 hectares 1.80 282305 1.57
3 2 to 4 hectares 0.57 159075 2.79
4 4 to 10 hectares 0.12 64063 5.33
5 10 hectares and above 0.02 119729 64.58
All 68.31 1510816 0.22
The average size of an operational holding was 0.22 hectare in 2010-11. This was against 0.24 hectare in 2000-01 and 0.23 hectare in 2005-06.
TABLE IV-2
Average size of individual and joint holdings during 2000-01, 2005-06, 2010-11
Sl.No Size Class 2000-01 2005-06 2010-11
1 2 3 4 5
1 Below 1 hectare 0.14 0.14 0.13 2 1.00-1.99 1.32 1.33 1.57 3 2.00-3.99 2.51 2.56 2.79 4 4.00-9.99 5.3 5.25 5.32 5 10.00 and above 37.31 58.44 64.58
Total 0.24 0.23 0.22
Scheduled Caste
Table IV. 1 (a) Appendix reveals the number and area operated by operational
holders belonging to Scheduled Caste. The details reveals that the total number of
holdings in this category for all size classes decreased from 579188 in 2005-06 to
532005 during 2010-11, recording a decrease of 47183 i.e. 8.15%.

23
Regarding area of the operational holders of this social group, the same has
decreased from, 39618 hectares to 35247, which shows a percentage decrease of
11.03%.
Scheduled Tribe
Table IV – 1(b) Appendix shows the number and area operated by
operational holders belonging to Scheduled Tribe. The figures shows that the total
number of holdings in this social group for all size classes increased from 87307 in
2005-06 to 95161 in 2010-11 recording a increase of 9%, correspondingly operated area
increased from 30197 hectares in 2005-06 to 34442 hectares in 2010-11. The average
size of holdings increased in this social group.
Distribution of holdings according to social groups
Table IV 3 below gives the number and area of operational holdings according
to major social groups i.e. Scheduled Castes, Scheduled Tribes and others under
different size classes. The inter percentages are given in brackets.
TABLE IV- 3 NUMBER AND AREA OF OPERATIONAL HOLDINGS ACCORDING TO
MAJOR SOCIAL GROUP
Sl. No
Size class( Ha) Number of operational holdings Area operated (Hectares)
All SC ST Others All SC ST Others
1 Marginal
(Below 1.00)
6579692
(96.32)
529419
(99.51)
86041
(90.42)
5964232
(96.14) 885643.80
(58.62)
30927.18
(87.74)
17154.68
(49.82)
837558.94
(58.12)
2 Small
(1.00-1.99)
180171
(2.64)
1975
(.37)
6117
(6.43)
172079
(2.77)
282305.13
(18.69)
2541.37
(7.21)
8056.99
(23.39)
271706.77
(18.85)
3 Semi-medium
(2.00-3.99)
57028
(0.83)
516
(0.10)
2555
(2.68)
53957
(0.87)
159075.15
(10.53)
1329.21
(3.77)
6139.07
(17.82)
151606.87
(10.52)
4 Medium
(4.00-9.99)
12044
(0.18)
95
(0.02)
428
(0.45)
11521
(0.19)
64063.02
(4.24)
449.02
(1.28)
2303.06
(6.69)
61310.94
(4.25)
5 Large
(10.00&above)
1854
(0.03) 0
20
(0.02)
1834
(0.03)
119728.65
(7.92) 0
785.31
(2.28)
118943.34
(8.26)
All Sizes 6830789 (100)
532005 (100)
95161 (100)
6203623 (100)
1510815.75 (100)
35246.78 (100)
34442.11 (100)
1441126.86(100)

24
It is seen from the above Table that 99.51% of the Scheduled Caste operational holders
(below 1 hectare) operated 87.74% of the total area of that category, 0.37% of the
holders (1.00 to 1.99 hectare) operated 7.21% of the operated area, 0.10% (2.00 to
3.99hectares) operated 3.77% of the operated area etc with regard to Scheduled Tribe
90.42% operational holders of this social group, belongs to below 1 hectare operate
49.82% of the operated area 6.43% of (in the size class 1 to 1.99 hectare) of the
operational holders operate 23.39% of the area operated by them.
The concentration is higher in the marginal operators of other social
group 96.14% in number and operated area 58.12%. The other concentration is in small
(1.00 – 1.99 hectares) operates 2.77% and semi medium (2.00 to 3.99 hectare) 0.87%
operating an area of 18.85% and 10.52% respectively.
A social group wise comparison of the results shows that out of the total
operational holders, scheduled caste operational holders constitute only 7.79% and
scheduled tribe operational holders constitute 1.39%. 90.82% of operational holders are
in other social group. In the case of operated area also, i.e. scheduled caste 2.33% and
scheduled tribe 2.28% and operational holders of general category constitute 95.39%.
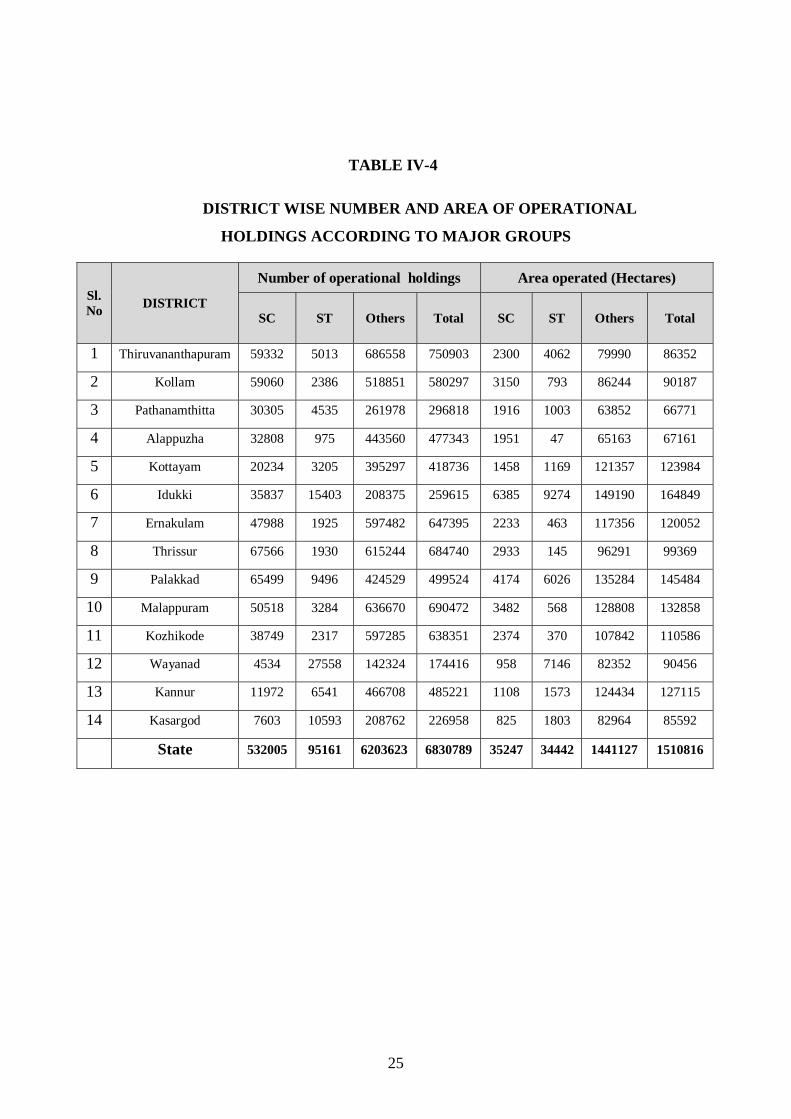
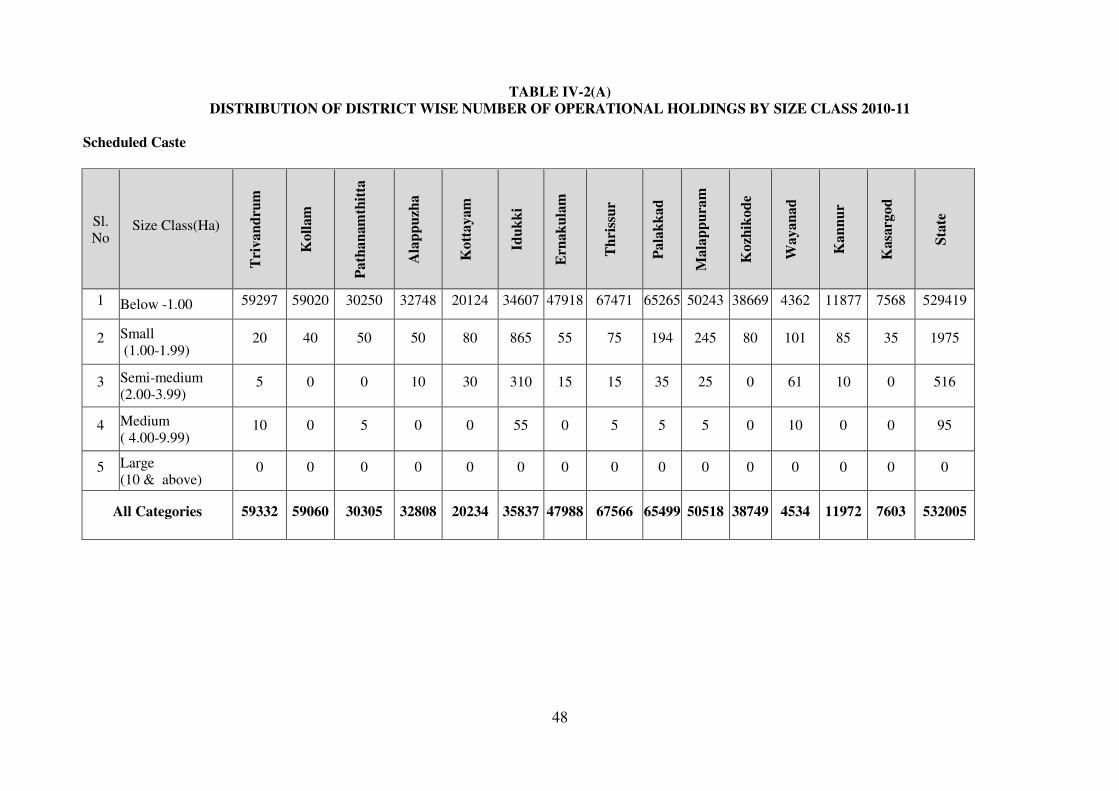
Table IV (4) shows district-wise distribution of operational holding and area
according to social group. Scheduled caste operational holders are largest in Thrissur
district and it is lowest in Wayanad district. Operated area is largest in Idukki and
lowest in Kasargod. ST operators are highest in Wayanad and 2nd Idukki. The operated
area operated by Scheduled Tribe, operational holders are highest in Idukki and 2nd
Wayanad. Operators from other categories are highest in Thiruvananthapuram district,
whereas the operated area is highest in Idukki district.
25
TABLE IV-4
DISTRICT WISE NUMBER AND AREA OF OPERATIONAL
HOLDINGS ACCORDING TO MAJOR GROUPS
Sl. No DISTRICT
Number of operational holdings Area operated (Hectares)
SC ST Others Total SC ST Others Total
1 Thiruvananthapuram 59332 5013 686558 750903 2300 4062 79990 86352
2 Kollam 59060 2386 518851 580297 3150 793 86244 90187
3 Pathanamthitta 30305 4535 261978 296818 1916 1003 63852 66771
4 Alappuzha 32808 975 443560 477343 1951 47 65163 67161
5 Kottayam 20234 3205 395297 418736 1458 1169 121357 123984
6 Idukki 35837 15403 208375 259615 6385 9274 149190 164849
7 Ernakulam 47988 1925 597482 647395 2233 463 117356 120052
8 Thrissur 67566 1930 615244 684740 2933 145 96291 99369
9 Palakkad 65499 9496 424529 499524 4174 6026 135284 145484
10 Malappuram 50518 3284 636670 690472 3482 568 128808 132858
11 Kozhikode 38749 2317 597285 638351 2374 370 107842 110586
12 Wayanad 4534 27558 142324 174416 958 7146 82352 90456
13 Kannur 11972 6541 466708 485221 1108 1573 124434 127115
14 Kasargod 7603 10593 208762 226958 825 1803 82964 85592
State 532005 95161 6203623 6830789 35247 34442 1441127 1510816

26
Tenancy Status
Table IV- 2A give the distribution of number of holdings and area operated
according to Tenancy Status.
TABLE 1V-2A
DISTRIBUTION OF NUMBER OF HOLDINGS AND AREA OPERATED ACCORDING TO TENANCY STATUS 2010-11
Sl. No.
Category of Holdings and size
group(Ha)
Number of Holdings Area operated (in hectares)
who
lly
owne
d a
nd s
elf
oper
ated
who
lly
leas
ed in
who
lly
othe
rwis
e
oper
ated
part
ly o
wne
d, p
artl
y le
ased
in a
nd p
artl
y o
ther
wis
e op
erat
ed
who
lly
owne
d a
nd s
elf
oper
ated
who
lly
leas
ed in
who
lly
oth
erw
ise
ope
rate
d
part
ly o
wne
d,
part
ly le
ased
in a
nd
part
ly o
ther
wis
e o
pera
ted
1 2 3 4 5 6 7 8 9 10
1 Marginal (Below 1.00)
6526605 3856 16614 159 868350.83 1429.68 2163.23 116.47
2 Small (1.00 - 1.99)
173556 350 573 76 271929.87 483.08 839..78 128.92
3 Semi-medium (2.00-3.99)
54591 320 292 0 152387.60 860.06 599.58 0
4 Medium (4.00 - 9.99)
11279 192 5 7 59924.93 1093.38 30.84 29.81
5 Large (10 & above)
1745 38 0 0 115111.08 1906.24 0 0
All Categories 6767776 4756 17484 242 1467704.31 5772.44 3633.43 275.20
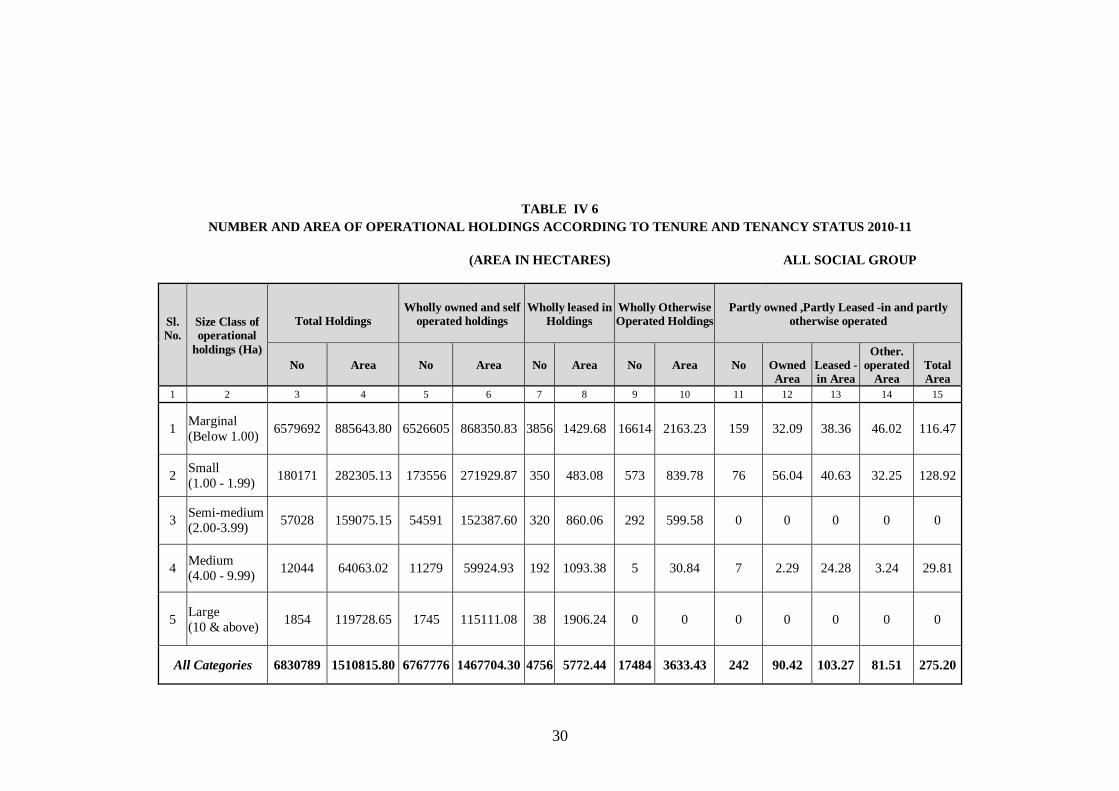
Regarding the tenancy status of operational holding out of the total 6830789
operational holding 6767776 (99.08%) are wholly owned and self-operated holding.
The percentage of area is 97.15% Wholly leased in, wholly otherwise operated and
partly owned and partly leased in and partly otherwise operated area is only 9680
hectare. The percentage of area is 0.6. The size class wise composition of the number

27
of operational holding wholly owned and self operated is in marginal 96.44%, small
2.56%, semi-medium 0.81%, Medium 0.17%, larger and above 0.03%. 59.16% of
wholly owned operated area is in the size class below 1 hectare, 18.53% area is in the
size class of 1.00 to 2.00 hectare. 10.38% is semi- medium (2.00-3.99), 4.08% comes
under medium size class and 7.8% is in larger and above size class. The leased in
operational holding is only 4756 numbers which is only 0.07% of the total operational
holding of the state.
TABLE 1V-2B DISTRIBUTION OF LEASED AREA BY TERMS OF LEASING 2010-11
Sl. No.
Category of holdings
Area leased in for (in hectares ) Total Fixed
money Fixed
produce Share of produce
Usufructuary Mortage
Other terms
1 2 3 4 5 6 7 8
1 Marginal (Below 1.00)
6189.75 795.08 989.75 46.26 864.04 8884.88
2 Small (1.00 - 1.99)
3501.87 448.47 683.47 26.99 334.59 4995.39
3 Semi-medium (2.00-3.99)
2141.31 149.07 325.29 22.00 990.06 3627.73
4 Medium (4.00 - 9.99)
1538.59 159.86 65.06 0.00 1126.19 2889.70
5 Large (10 & above)
2677.41 73.34 0 0.00 1749.71 4500.46
All Categories 16048.93 1625.82 2063.57 95.25 5064.59 24898.16
Regarding the terms of leasing, “fixed money” constitute the majority 64.46%.
Fixed produce comes only 6.53% of the total. Under usufructuary mortgage 95 hectares
operated i.e., 0.38%. Area under other terms of leasing is 5065 hectares i.e. 20.3%.
Higher is the concentration of area under marginal group who operate on the basis of
fixed money (6190 hectare).

28
Land utilization and Comparison with previous census
Table IV 5 below gives the statement of land utilization which reveals that
84.91% of the area used for cultivation during the census period, which is about 1.26
greater than the last census (83.65%). Land not available for cultivation has decreased
by 0.27 than the last census. This shows a positive sign in the recent scenario of
Agriculture.
TABLE 1V - 5 LAND UTILIZATION PATTREN - OPERATIONAL HOLDINGS APPROACH 2010 - 11
( AREA IN HECTARES )
Sl. No
Land Use pattern in operational holdings
2000-01 2005-06 2010-11
Area Percentage Area Percentage Area Percentage
1 2 3 4 5 6 7 8
1 Net Area sown 1311566 83.57 1300601 83.65 1282759.4 84.91
2 Area under current
fallow 26561 1.69 26382 1.70 11793.68 0.78
3 Other Uncultivated land excluding fallow land
47919 3.05 12504 0.80 12096.08 0.80
4 Fallow and other than
current fallow 16307 1.04 14771 0.95 11120.10 0.74
5 Cultivable waste land 25249 1.61 25191 1.62 26643.08 1.76
6 Land not available for
cultivation 141886 9.04 175380 11.28 166403.42 11.01
Total 1569488 100.00 1554826 100.00 1510815.8 100.00
29
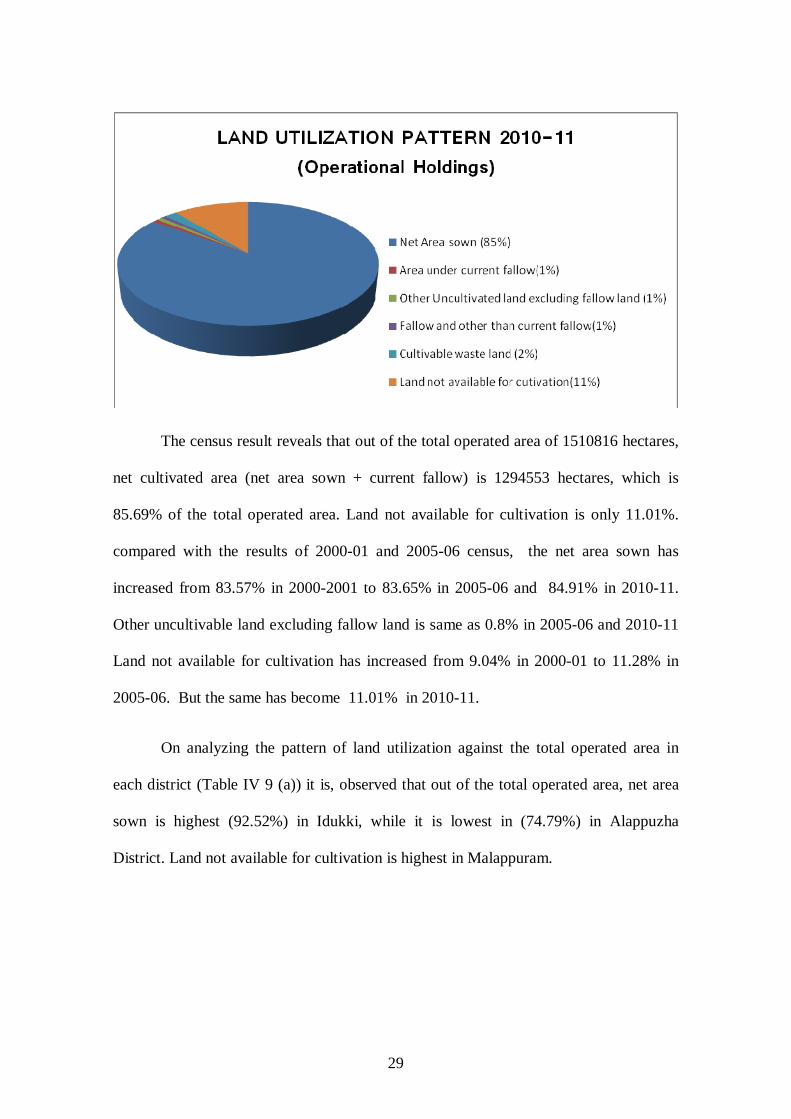
The census result reveals that out of the total operated area of 1510816 hectares,
net cultivated area (net area sown + current fallow) is 1294553 hectares, which is
85.69% of the total operated area. Land not available for cultivation is only 11.01%.
compared with the results of 2000-01 and 2005-06 census, the net area sown has
increased from 83.57% in 2000-2001 to 83.65% in 2005-06 and 84.91% in 2010-11.
Other uncultivable land excluding fallow land is same as 0.8% in 2005-06 and 2010-11
Land not available for cultivation has increased from 9.04% in 2000-01 to 11.28% in
2005-06. But the same has become 11.01% in 2010-11.
On analyzing the pattern of land utilization against the total operated area in
each district (Table IV 9 (a)) it is, observed that out of the total operated area, net area
sown is highest (92.52%) in Idukki, while it is lowest in (74.79%) in Alappuzha
District. Land not available for cultivation is highest in Malappuram.
30
TABLE IV 6 NUMBER AND AREA OF OPERATIONAL HOLDINGS ACCORDING TO TENURE AND TENANCY STATUS 2010-11
(AREA IN HECTARES)
ALL SOCIAL GROUP
Sl. No.
Size Class of operational
holdings (Ha)
Total Holdings
Wholly owned and self operated holdings
Wholly leased in Holdings
Wholly Otherwise Operated Holdings
Partly owned ,Partly Leased -in and partly otherwise operated
No Area No Area No Area No Area No Owned Area
Leased -in Area
Other. operated
Area Total Area
1 2 3 4 5 6 7 8 9 10 11 12 13 14 15
1 Marginal (Below 1.00)
6579692 885643.80 6526605 868350.83 3856 1429.68 16614 2163.23 159 32.09 38.36 46.02 116.47
2 Small (1.00 - 1.99)
180171 282305.13 173556 271929.87 350 483.08 573 839.78 76 56.04 40.63 32.25 128.92
3 Semi-medium (2.00-3.99)
57028 159075.15 54591 152387.60 320 860.06 292 599.58 0 0 0 0 0
4 Medium (4.00 - 9.99)
12044 64063.02 11279 59924.93 192 1093.38 5 30.84 7 2.29 24.28 3.24 29.81
5 Large (10 & above)
1854 119728.65 1745 115111.08 38 1906.24 0 0 0 0 0 0 0
All Categories 6830789 1510815.80 6767776 1467704.30 4756 5772.44 17484 3633.43 242 90.42 103.27 81.51 275.20

31
A comparative analysis of district wise percentage distribution of land utilization
Table IV 9 (b) of appendix with the data of previous census shows that no abnormal
variation is noticed in net area sown during 2000-01, 2005-06 and 2010-11. It is almost
same in all the districts during the previous censuses. Some variation is noticed
between districts in the case of current fallow during 2000-01, 2005-06 and 2010-11
census. Current fallow is the highest in Malappuram district during 2010-11censuses.
It is least in Kozhikode district Kottayam district is having highest percentage in other
uncultivable land. Fallow land other than current fallow is highest in Palakkad district.
Malapppuram district is having highest percentage of land not available for cultivation.
Table 10 in the appendix reveals the percentage of area under main land use to
total operated area district wise during 2000-01, 2005-06 and 2010-11. Out of the total
operated area in the state 85.26% land is cultivated in 2000-01, 84.81% in 2005-06 and
85.69% in 2010-11 respectively. Uncultivated land is 5.70%, 3.49% and 3.3% in the
state during 2000-01, 2005-06 and 2010-11. Land not available for cultivation is
9.04%, 11.72% and 11.01% in the state during these census period respectively.

32
TABLE IV -7
PERCENTAGE OF AREA UNDER MAIN LAND USE TO THE TOTAL OPERATED AREA BY THE STATE, 2000-01 & 2005-06, 2010-11
Sl.No Size class (hectares)
Percentage of area under
Net cultivated area Un cultivated land Land not available
for cultivation Total
00-01 05-06 10-11 00-01 05-06 10-11 00-01 05-06 10-11 00-01 05-06 10-11 1 2 3 4 5 6 7 8 9 10 11 12 13 14
1 Marginal (Below 1.00)
82.44 81.72 81.47 6.24 3.00 3.10 11.32 15.28 15.43 100 100 100
2 Small (1.00 - 1.99)
90.21 90.75 91.19 4.80 3.81 3.71 4.98 5.44 5.10 100 100 100
3 Semi-medium (2.00-3.99)
90.06 91.52 91.18 4.96 3.86 4.32 4.98 4.62 4.50 100 100 100
4 Medium (4.00 - 9.99)
89.46 89.96 90.26 5.36 4.29 4.96 5.18 5.75 4.78 100 100 100
5 Large (10 & above)
82.85 87.40 94.11 5.35 3.82 1.64 11.81 8.78 4.25 100 100 100
All Categories 85.26 85.35 85.69 5.70 3.37 3.30 9.04 11.28 11.01 100 100 100
33
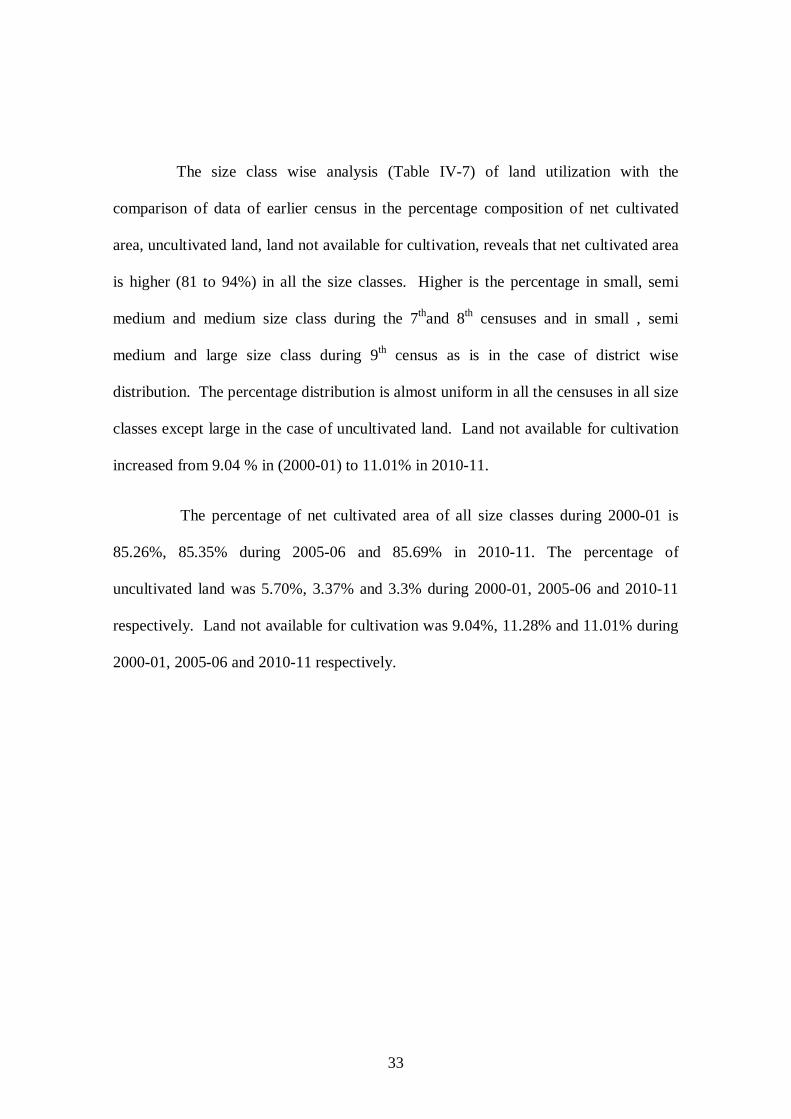
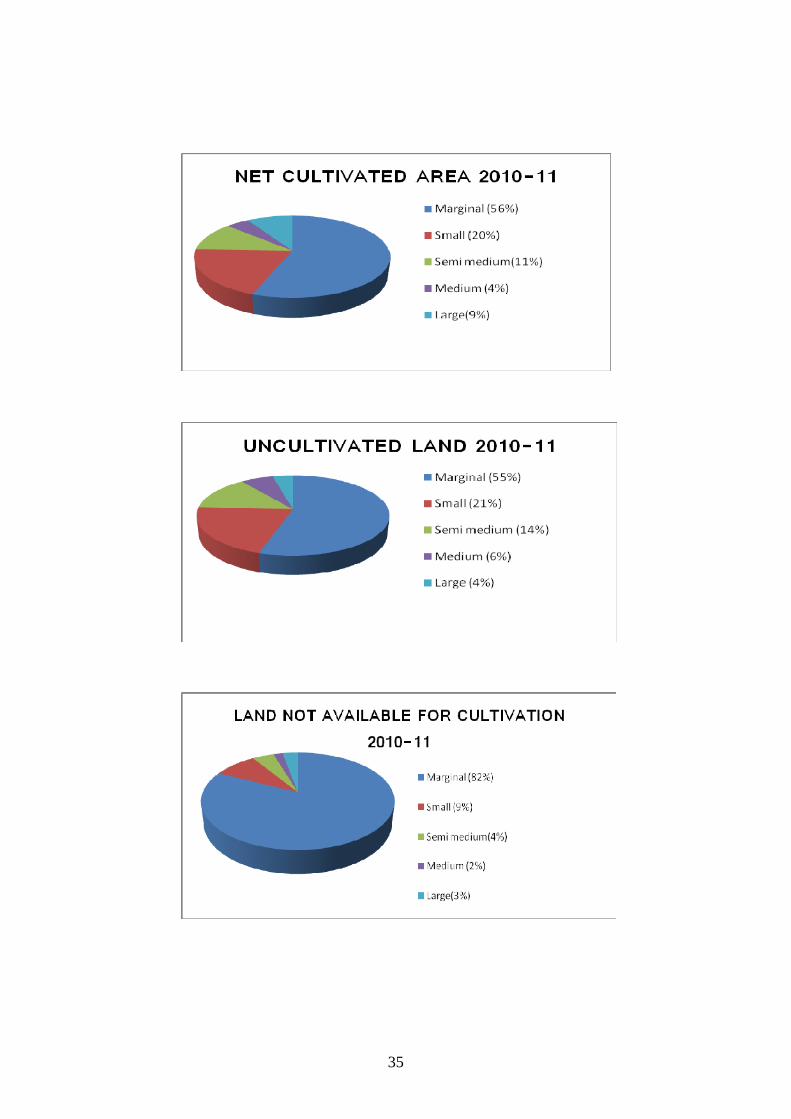
The size class wise analysis (Table IV-7) of land utilization with the
comparison of data of earlier census in the percentage composition of net cultivated
area, uncultivated land, land not available for cultivation, reveals that net cultivated area
is higher (81 to 94%) in all the size classes. Higher is the percentage in small, semi
medium and medium size class during the 7thand 8th censuses and in small , semi
medium and large size class during 9th census as is in the case of district wise
distribution. The percentage distribution is almost uniform in all the censuses in all size
classes except large in the case of uncultivated land. Land not available for cultivation
increased from 9.04 % in (2000-01) to 11.01% in 2010-11.
The percentage of net cultivated area of all size classes during 2000-01 is
85.26%, 85.35% during 2005-06 and 85.69% in 2010-11. The percentage of
uncultivated land was 5.70%, 3.37% and 3.3% during 2000-01, 2005-06 and 2010-11
respectively. Land not available for cultivation was 9.04%, 11.28% and 11.01% during
2000-01, 2005-06 and 2010-11 respectively.

34
TABLE IV - 8
PERCENTAGE OF NET CULTIVATED AREA ,TOTAL UNCULTIVATED AREA AND LAND AVAILABLE FOR CULTIVATION 2000-01, 2005-06 & 2010-11
Sl. No Size class (hectares)
Net cultivated area Uncultivated land Land not available for cultivation
00-01 05-06 10-11 00-01 05-06 10-11 00-01 05-06 10-11 1 2 3 4 5 6 7 8 9 10 11
1
Marginal (Below 1.00)
54.37 55.17 55.74 61.57 51.18 54.90 70.38 78.04 82.14
2
Small (1.00 - 1.99)
20.21 19.48 19.89 16.10 20.71 21.00 10.52 8.82 8.65
3
Semi-medium (2.00-3.99)
12.82 12.31 11.24 10.57 13.15 13.80 6.68 4.71 4.32
4
Medium (4.00 - 9.99)
5.67 5.34 4.43 5.08 6.44 6.37 3.10 2.58 1.84
5
Large (10 & above)
6.93 7.70 8.70 6.69 8.52 3.93 9.32 5.85 3.05
All Categories 100 100 100 100 100 100 100 100 100
35

36
Table IV-8 is percentage of net cultivated area, total uncultivated area and land
available for cultivation in 2000-01, 2005-06 and 2010-11. The percentage of net
cultivated area, uncultivated land and land not available for cultivation among various
size class group shows that ‘marginal’ size class constitute the largest group. It is
increasing during every census, i.e., it was 54.37% in 2000-01 , 55.17% in 2005-06 and
55.74% in 2010-11, which means that sub division and fragmentation of operational
holding is higher in the State.Net cultivated area decreased in semi-medium and
Medium Size classes. A little increase is noticed in small and Large Size class, i.e., from
19.48% in 2005-06 to 19.89% in 2010-11 in small size class and from 7.7% in 2005-06
to 8.7% in 2010-11 in large size class.
Cropping Pattern
Gross cropped area enumerated during the 9th Agricultural Census were
1552554 hectares. The cropping pattern is entirely different in the state compared to
other Indian States. Food crops are cultivated mainly along with commercial crops in
the same land. Multiplicity of crops and intensity of cropping exists in the state. In the
same plot both seasonal, annual and perennial crops are cultivated. Totally there are
158 crops covered in the census. However data on the selected crops are collected for
analyzing crops wise percentage distribution of gross cropped area during 2000-01,
2005-06 and 2010-11. Paddy cultivated area decreased from 12.06% in 1995-96 to
11.21% in 2000-01 to 10.72% in 2005-06 and to 8.8% in 2010-11.
37
The percentage of coconut cultivated area decreased from 31.36% in 1995-96 to
25.70% in 2000-01 and decreased to 24.66% in 2005-06 and increased to 25.22% in
2010-11. Percentage of Rubber cultivated area also shows an increase in all the
censuses.
While looking into percentage distribution of area under principal crops in
different size classes during the 2010-11 census (Table IV- 13) it is seen that marginal
operators contributes larger percentage of area under paddy (42.54%) coconut (67.72%)
Tapioca (74.49%) Rubber (41.74%) Cashew (49.53%) Tea (8.53%) Pepper (53.49%)
Coffee (34.14%) Arecanut (57.66%) Mango (81.90%) and Banana (58.75%). The
percentage of small, semi medium cultivators cultivating the above crops are almost
same. Whereas tea is a plantation crops contributing 80.52% of area under larger size
class.
Cropping Intensity
Intensity of cropping refers to the ratio of gross cropped area and net area sown
multiplied by 100 (it is expressed in percentage). The state intensity of cropping is
121.03%. Intensity of cropping is highest in Idukki and it is lowest in Ernakulam .
An analysis of gross area under selected crops in the state in size class wise
distribution shows rubber occupies 1st position among selected crops followed by
coconut and paddy. Though tea is a plantation crop, the percentage of gross cropped
area of tea under all size class except large is less than 1%. However the percentage
under larger group is 8.76%.

38
Irrigation Status
In the Agricultural Census 2010-11 details of irrigation was also collected. Out
of the total holdings 2.78% are wholly irrigated and 65.10% are partly irrigated holdings
wholly unirrigated holding is 32.12%. Net irrigated area is 26.23%. Inter cropping and
multiple cropping is the special feature of cropping pattern in Kerala. On the same
agricultural holding certain crops are irrigated where as some other crops are not
irrigated.
The comparison of district wise distribution of wholly irrigated holdings, partly
irrigated holdings and wholly unirrigated holdings through census i.e. 7th, 8th and 9th
censuses is given under table 16. The table reveals that the percentage of number of
holdings was decreased from 5.67% in 2000-01 to 3.07% in 2005-06 and it is decreased
to 2.78% in 2010-11 partly irrigated holdings were 49.44%, 55.09% and 65.10%
respectively. The partly irrigated area 21.61, 22.99 and 23.46 respectively in each
census. In the state out of the total net area sown net irrigated area was 27.28% in
2000-01, 26.23% in both census i.e. 2005-06, 2011-12
Analysing the sources of irrigation to different size classes compared with the
result of previous census the percentage of irrigated area is higher in marginal followed
by small, semi medium, medium from all sources, viz. Canal, Tank, Well, Tube well
and other sources. This characteristic is same during the earlier census results also.
Among the various sources, well and tube well is highest in marginal size class,
i.e. 63.42%, 69.36%, 68.75% and 54.79%, 49.20%, 58.21% during 2000-01, 2005-06

39
and 2010-11 respectively. Table 16 (a) in the appendix given various percentage of
source wise and size class wise irrigation during 7th, 8th and 9th census.
Table 16(b) shows the percentage distribution of irrigation from different source,
to various size classes. Well irrigation is the largest source of irrigation. The census
result reveals that tube well irrigation percentage is least in the State in all the periods of
census. It is only 5.27% in 2000-01, 6.26% in 2005-06 and 6.42% in 2010-11.
Table 16 (c) shows the district wise distribution of holdings receiving irrigation
by different sources. The different sources listed are canal, tank, well, tube wells and
other sources.
Out of the 3918240 irrigated holdings canal irrigated holdings are 172098, tank
irrigated holding 111098, well irrigated holdings 2431408, Tube well irrigated holdings
are 290997 and other sources irrigated holdings are 912639.
The distribution of district wise area irrigated by different sources revealed from
2010-11 census is given under Table 16 (d). The percentage of canal irrigated area is
largest in Palakkad 55.59% and lowest in Kannur Districts, i.e. 0.13%. Tank irrigated
area is largest in Idukki 45.4%. Among the districts used for wells for irrigation
purpose, Thrissur stands first 19.86% and Kollam is the least 1.32% Tube well irrigated
area is highest in Kasargod 29.73% and the least in Pathanamthitta 0.11%. It is also
below 1% in Kollam (0.14%), Wayanad (0.70%) Irrigation from other sources is highest
in Wayanad(20.96%) and least in Pathanamthitta (0.81%).
40
A comparative analysis of percentage of area irrigated from different sources in
each district during 2000-01 , 2005-06 and 2010-11 are given in table 16 (f). The
census reveals that in the state the percentage of canal irrigated area is decreasing
i.e. 18.08%, 15.81%, and 15.35% in 2000-01, 2005-06 and 2010-11 respectively. The
percentage of well-irrigated area shows a increase in 2010-11. It is increased from
33.11% in 2005-06 to 37.52% in 2010-11. Tube well irrigation is not prominent in all
the census period except in Alappuzha.
Irrigation Source
Table 16 (g) gives the number of wells and tube wells used for irrigation. There
are 1661405 wells and 249832 Tube wells with pump set and 482227 wells without
pump set used for irrigation in the state as revealed in the census during 2010-11. Out
of the total number of wells used for irrigation 1630654 are electric connected and
30751 are diesel connected. Tube wells connected with electricity are 245670 and
diesel tube wells are 4162. There are 1543520 wells connected with pump set, 469243
wells without pump set and 234608 tube wells used for irrigation in marginal size class.
Under large size class (10 hectare and above) there are 1343 wells and 291 Tube wells
used for irrigation.
Distribution of district wise number of wells and tube wells are given in table 16
(h). The largest number of wells with pump set are in Thrissur (247998) district and
lowest in Wayanad (19238) district. Wells without pump set are higher in
Thiruvananthapuram 82568. Majority of wells with pump set is electric connected.
41
Wells with diesel pump set are 30751 in the state. Tube wells are largest in Alappuzha
(126061) district. Electric connected tube wells are also largest in Alappuzha district
125343. Diesel connected tube wells are highest in Alappuzha District (718).
Intensity of Irrigation
Table 17 reveals the intensity of irrigation. The intensity of irrigation is
measured as a ratio of gross irrigated area to net irrigated area and is expressed as
percentage. The census reveals that the percentage of intensity of irrigation is 121.03
The intensity of irrigation during 2000-01 and 2005-06 is 109.25 and 110.21
respectively. The distribution among various size classes are almost the same. It is
118.01% in marginal size class. The intensity of irrigation shows an increasing trend
when compared with the 8th Agriculture Census.
The district wise percentage distribution of gross cropped area according to
irrigation status Table 17 (a) shows that percentage of irrigated area in the state is only
23.53%. The unirrigated area is 76.47% out of the gross cropped area. The percentage
of gross cropped area irrigated is highest in Thrissur 51.68% and lowest in Kollam
3.39%. The percentage of gross cropped area unirrigated is highest in Kollam 96.61%
and lowest in Thrissur 48.32%.
42
APPENDICES
Table No. TABLE CONTENTS Page
No.
Table IV- 1 Number and area of operational holdings (Total) 44
Table IV1-(a) Number and area of operational holdings (Scheduled Caste) 45
Table IV-1(b) Number and area of operational holdings (Scheduled Tribe) 46
Table IV-2 Distribution of district wise number of operational holdings by size class (All Social Groups)
47
Table IV-2(a) Distribution of district wise number of operational holdings by size class (Scheduled Caste)
48
Table IV-2(b) Distribution of district wise number of operational holdings by size class (Scheduled Tribe)
49
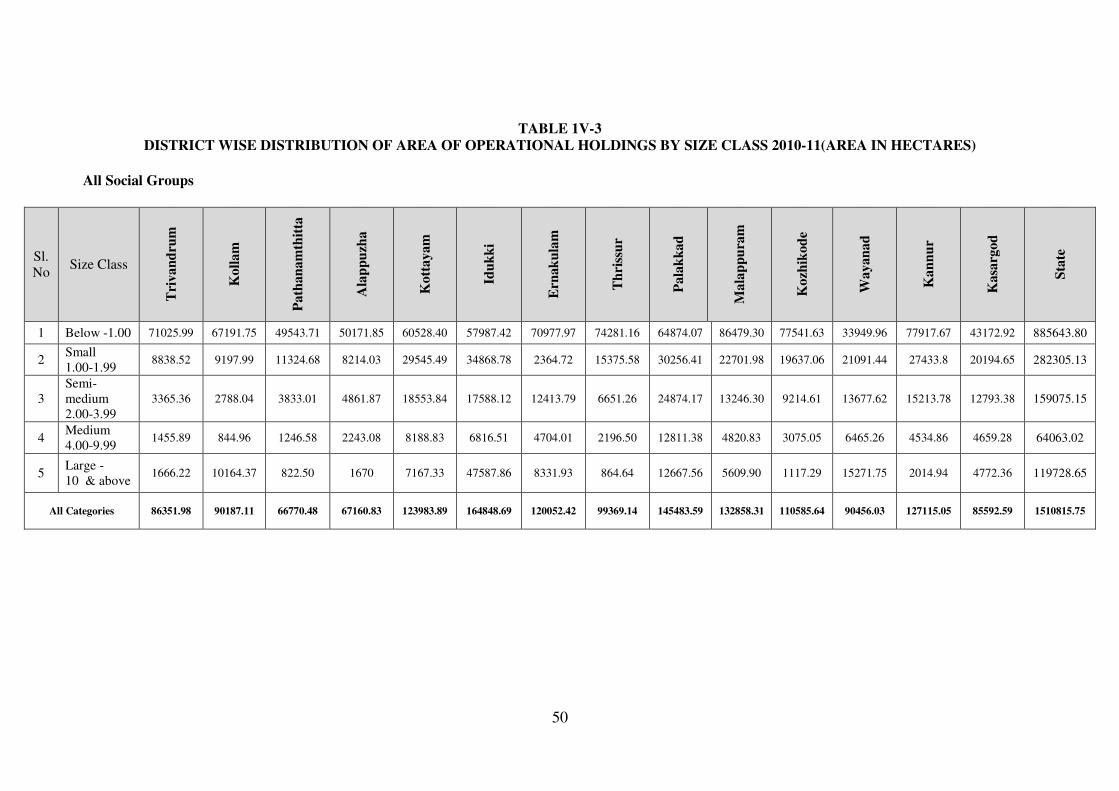
Table IV- 3 District wise distribution of area of operational holdings by size class
(All social group)
50
Table IV-3(a) District wise distribution of area of operational holdings by size class (Scheduled Caste)
51
Table IV-3(b) District wise distribution of area of operational holdings by size class (Scheduled Tribe)
52
Table IV-3(c) District wise average size of holdings 53
Table IV- 4 Size class wise distribution of number, area & percentage of operational holdings according to major social groups
55
Table IV- 5 District wise number and area of operational holdings according to major social groups
56
Table IV- 6 Number and area of operational holdings according to tenure and tenancy status (All Social Groups)
57
Table IV-6(a) Number and area of operational holdings according to tenure and tenancy status (Scheduled Caste)
58
Table IV-6(b) Number and area of operational holdings according to tenure and tenancy status (Scheduled Tribe)
59
Table IV- 7 Size class wise distribution of number of holdings and area operated according to tenancy status
60
Table IV- 8 Distribution of leased in area by terms of leasing 61
Table IV- 9 Land utilization pattern 2000-01, 2005-06 and 2010-11 62
Table IV-9(a) District wise distribution of land utilization (All Social Groups) 63
Table IV-9(b) District wise percentage distribution of land utilization 64

43
Table IV- 10 Percentage of area under main land use to the total operated area by the districts 2000-01,2005-06 and 2010-11
66
Table IV- 10(a) Percentage of area under main land use to the total operated area by the State 2000-01,2005-06 and 2010-11
67
Table IV- 11 Percentage of net cultivated area total uncultivated area and land available for cultivation in 2000-01,2005-06 and 2010-11
68
Table IV- 11(a) Percentage of area under land available for cultivation, net cultivated area and land uncultivated by districts 2000-01,2005-06 and 2010-11
69
Table IV- 12 Crop wise percentage distribution of gross cropped area during 2000-01 , 2005-06 and 2010-11
70
Table IV- 13 Percentage distribution of area under principal crops in different size classes 2010-11
71
Table IV- 14 District wise intensity of cropping 2010-11 72
Table IV- 15 Percentage of Gross cropped area under selected crops 73
Table IV- 16 District wise percentage distribution of area of holdings according to irrigation status 2000-01,2005-06 and 2010-11
74
Table IV- 16(a) Percentage of area irrigated from different sources of irrigation by major size groups 2000-01,2005-06 and 2010-11
76
Table IV- 16(b) Percentage distribution of size class wise area irrigated by different sources 2000-01,2005-06 and 2010-11
78
Table IV- 16(c) Distribution of district wise holdings receiving irrigation by different sources in 2010-11
80
Table IV- 16(d) Distribution of district wise area irrigated by different sources 2010-11 81
Table IV- 16(e) Percentage of number of holdings irrigated by different sources in each district 2010-11
82
Table IV- 16(f) Percentage of area irrigated by different sources in each district 2000-01 2005-06 and 2010-11
83
Table IV- 16(g) Number of wells and tube wells used for irrigation in different size classes 85
Table IV- 16(h) Distribution of district wise number of wells and tube wells 86
Table IV- 17 Intensity of irrigation 87
Table IV- 17(a) District wise percentage distribution of gross cropped area according to irrigation status 2010-11
88
44
TABLE IV-1
NUMBER AND AREA OF OPERATIONAL HOLDINGS 2010-11 (AREA IN HECTARES)
All Social Groups
Sl.
No
Size Class
(hectares)
Individual Holdings Joint Holdings
Number Area Number Area
2005-06 2010-11 % of
Variation 2005-06 2010-11
% of
Variation 2005-06 2010-11
% of
Variation 2005-06 2010-11
% of
Variation
1 2 3 4 5 6 7 8 9 10 11 12 13 14
1 Below 1.00 6540345 6526184 -.22 883658 874409.33 -1.05 3645 5039 38.24 1071 1490.61 39.22
2 1.00-1.99 210341 175252 -16.68 278754 275660.03 -1.11 440 660 50 590 1006.90 70.68
3 2.00-3.99 67483 54536 -19.19 172801 152444.04 -11.78 200 400 100 516 1106.23 114.34
4 4.00-9.99 13778 11024 -19.99 72414 58273.31 -19.53 120 155 29.17 629 874.33 38.95
5 10.00&above 1501 1261 -15.99 28767 31235.22 8.58 50 20 -60 1147 443.81 -61.29
All Categories 6833448 6768257 -0.95% 1436394 1392021.93 -3.09% 4455 6274 40.83% 3953 4921.88 24.49
Institutional Holdings Grand Total Average size of
holdings Number Area Number Area
Sl.
No
Size Class
(hectares) 2005-06 2010-11
% of
Vari-
ation
2005-06 2010-11
% of
Vari-
ation
2005-06 2010-11
% of
Vari
-ation
2005-06 2010-11
% of
Varia-
tion
2005-
06 2010-11
15 16 17 18 19 20 21 22 23 24 25 26 27 28
1 Below 1.00 58453 48469 -17.08 11058 9743.86 -11.88 6602443 6579692 -0.34 895786 885643.8 -1.13 0.14 0.13
2 1.00-1.99 4051 4259 5.13 5476 5638.2 2.96 214832 180171 -16.13 284820 282305.13 -0.88 1.33 1.57
3 2.00-3.99 2027 2092 3.20 5257 5524.88 5.09 69710 57028 -18.19 178574 159075.15 -10.91 2.56 2.79
4 4.00-9.99 960 865 -9.89 5713 4915.38 -13.96 14858 12044 -18.93 78757 64063.02 -18.65 5.30 5.32
5 10.00&above 898 573 -36.19 86975 88049.62 1.23 2449 1854 -24.29 116889 119728.65 3.60 47.73 64.58
All Categories 66389 56258 -15.26 114479 113871.94 -0.53% 6904292 6830789 -1.06% 1554826 1510815.75 -2.83% 0.23 0.22

45
TABLE 1V-1 (A)
NUMBER AND AREA OF OPERATIONAL HOLDINGS 2010-11 (AREA IN HECTARES)
Scheduled Caste
Sl.
No.
Size class
(hectares)
Individual Holdings Joint Holdings
Number Area Number Area
2005-06 2010-11 % of
Variation 2005-06 2010-11
% of
Variation
2005-
06 2010-11
% of
Variation 2005-06 2010-11
% of
Variation 1 2 3 4 5 6 7 8 9 10 11 12 13 14
1 Below 1.00 576588 529123 -8.23 35688 30848.20 -13.56 95 296 211.58 21 78.98 276.1
2 1.00-1.99 2084 1950 -6.43 2748 2503.54 -8.89 0 25 - 0 37.83 -
3 2.00-3.99 371 506 36.39 916 1307.14 42.7 10 10 0 21 22.07 5.1
4 4.00-9.99 40 95 137.5 224 449.02 100.46 0 0 0 0 0 0
5 10.00&above 0 0 0 0 0 0 0 0 0 0 0 0
All Categories 579083 531674 -8.19% 39576 35107.9 -11.29% 105 331 215.24% 42 138.88 231.06%
Sl.
No.
Size Class
(hectares)
Institutional Holdings Grand Total Average
size of
holdings Number Area Number Area
2005
-06
2010
-11
% of
variation
2005
-06
2010
-11
% of
Variation 2005-06 2010-11
% of
Variation 2005-06 2010-11
% of
Variation 2005-06
2010-
11
15 16 17 18 19 20 21 22 23 24 25 26 27 28
1 Below 1.00 - - - - - - 576683 529419 -8.2 35709 30927.18 -13.39 0.06 0.05
2 1.00-1.99 - - - - - - 2084 1975 -5.23 2748 2541.37 -7.52 1.32 1.29
3 2.00-3.99 - - - - - - 381 516 35.43 937 1329.21 41.86 2.46 2.58
4 4.00-9.99 - - - - - - 40 95 137.5 224 449.02 100.46 5.6 4.73
5 10.00 & above - - - - - - 0 0 0 0 0 0 0 0
All Categories - - - - - - 579188 532005 -8.15% 39618 35246.78 -11.03% 0.07 0.07

46
TABLE IV - 1 (B)
NUMBER AND AREA OF OPERATIONAL HOLDINGS 2010-11(AREA IN HECTARES)
Scheduled Tribe
Sl.
No Size class
(hectares)
Individual Holdings Joint Holdings
Number Area Number Area
2005-06 2010-
11
% of
Variation 2005-06 2010-11
% of
Variation 2005-06 2010-11
% of
Variation 2005-06 2010-11
% of
Variation
1 2 3 4 5 6 7 8 9 10 11 12 13 14
1 Below 1.00 78990 85826 8.65 16349 17060.72 4.35 208 215 3.37 83 96.96 16.82
2 1.00-1.99 6155 6011 -2.34 8039 7904.22 -1.68 10 106 960 13 152.77 1075.15
3 2.00-3.99 1629 2520 54.7 4019 6049.13 50.51 15 35 133.33 37 89.94 143.08
4 4.00-9.99 280 418 49.29 1354 2254.65 66.51 5 10 100 20 48.41 142.05
5 10.00& above 15 20 33.33 283 785.31 177.49 0 0 0 0 0 0
All Categories 87069 94795 8.87% 30044 34054.03 13.35% 238 366 53.78% 153 388.08 153.96%
Sl.
No.
Institutional Holdings Grand Total Average size of
holdings
Size Class
(hectares)
Number Area Number Area
2005
-06
2010
-11
% of
Variation
2005
-06
2010
-11
% of
Variation 2005-06 2010-11
% of
Variation 2005-06 2010-11
% of
Variation
2005-
06
2010-
11
15 16 17 18 19 20 21 22 23 24 25 26 27 28
1 Below 1.00 - - - - - - 79198 86041 8.64 16432 17157.68 4.42 0.21 0.20
2 1.00-1.99 - - - - - - 6165 6117 -0.78 8052 8056.99 0.06 1.31 1.32
3 2.00-3.99 - - - - - - 1644 2555 55.41 4056 6139.07 51.36 2.47 2.40
4 4.00-9.99 - - - - - - 285 428 50.18 1374 2303.06 67.62 4.82 5.38
5 10.00&above - - - - - - 15 20 33.33 283 785.31 177.5 18.87 39.26
All Categories - - - - - - 87307 95161 9% 30197 34442.11 14.06% 0.35 0.36

47
TABLE 1V-2
DISTRIBUTION OF DISTRICT WISE NUMBER OF OPERATIONAL HOLDINGS BY SIZE CLASS 2010-11
All Social Groups
Sl.
No Size Class
Tri
van
dru
m
Koll
am
Path
an
am
thit
ta
Ala
pp
uzh
a
Kott
ayam
Idu
kk
i
Ern
ak
ula
m
Th
riss
ur
Pala
kk
ad
Mala
pp
ura
m
Kozh
ikod
e
Wayan
ad
Kan
nu
r
Kasa
rgod
Sta
te
1 Below -1.00 743341 573022 287778 469853 391649 228410 626985 672009 469021 670231 621943 154863 461662 208925 6579692
2 Small
(1.00-1.99) 5948 6074 7366 5285 18658 23051 14900 9853 19031 14513 12467 13341 17170 12514 180171
3 Semi-medium
( 2.00-3.99) 1300 991 1393 1712 6652 6536 4451 2380 8831 4703 3287 4832 5435 4525 57028
4 Medium
( 4.00-9.99) 274 170 236 408 1502 1263 884 453 2393 897 599 1177 879 909 12044
5 Large -
(10 & above) 40 40 45 85 275 355 175 45 248 128 55 203 75 85 1854
All Categories 750903 580297 296818 477343 418736 259615 647395 684740 499524 690472 638351 174416 485221 226958 6830789
48
TABLE IV-2(A)
DISTRIBUTION OF DISTRICT WISE NUMBER OF OPERATIONAL HOLDINGS BY SIZE CLASS 2010-11
Scheduled Caste
Sl.
No Size Class(Ha)
Tri
van
dru
m
Koll
am
Path
an
am
thit
ta
Ala
pp
uzh
a
Kott
ayam
Idu
kk
i
Ern
ak
ula
m
Th
riss
ur
Pala
kk
ad
Mala
pp
ura
m
Kozh
ikod
e
Wayan
ad
Kan
nu
r
Kasa
rgod
Sta
te
1 Below -1.00 59297 59020 30250 32748 20124 34607 47918 67471 65265 50243 38669 4362 11877 7568 529419
2 Small
(1.00-1.99) 20 40 50 50 80 865 55 75 194 245 80 101 85 35 1975
3 Semi-medium
(2.00-3.99) 5 0 0 10 30 310 15 15 35 25 0 61 10 0 516
4 Medium
( 4.00-9.99) 10 0 5 0 0 55 0 5 5 5 0 10 0 0 95
5 Large
(10 & above) 0 0 0 0 0 0 0 0 0 0 0 0 0 0 0
All Categories 59332 59060 30305 32808 20234 35837 47988 67566 65499 50518 38749 4534 11972 7603 532005

49
TABLE IV-2(B)
DISTRIBUTION OF DISTRICT WISE NUMBER OF OPERATIONAL HOLDINGS BY SIZE CLASS 2010-11
Scheduled Tribe
Sl.
No
Size Class
(Ha)
Tri
van
dru
m
Koll
am
Path
an
am
thit
ta
Ala
pp
uzh
a
Kott
ayam
Idu
kk
i
Ern
ak
ula
m
Th
riss
ur
Pala
kk
ad
Mala
pp
ura
m
Kozh
ikod
e
Wayan
ad
Kan
nu
r
Kasa
rgod
Sta
te
1 Below -1.00 3758 2242 4419 975 2922 12264 1824 1930 7445 3129 2267 26073 6335 10458 86041
2 Small
1.00-1.99 916 144 106 0 218 2085 45 0 1214 35 50 1033 146 125 6117
3 Semi-medium
2.00-3.99 314 0 10 0 50 884 56 0 669 110 0 397 55 10 2555
4 Medium
4.00-9.99 20 0 0 0 15 165 0 0 163 10 0 50 5 0 428
5 Large -
10 & above 5 0 0 0 0 5 0 0 5 0 0 5 0 0 20
All Categories 5013 2386 4535 975 3205 15403 1925 1930 9496 3284 2317 27558 6541 10593 95161
50
TABLE 1V-3
DISTRICT WISE DISTRIBUTION OF AREA OF OPERATIONAL HOLDINGS BY SIZE CLASS 2010-11(AREA IN HECTARES)
All Social Groups
Sl.
No Size Class
Tri
van
dru
m
Koll
am
Path
an
am
thit
ta
Ala
pp
uzh
a
Kott
ayam
Idu
kk
i
Ern
ak
ula
m
Th
riss
ur
Pala
kk
ad
Mala
pp
ura
m
Kozh
ikod
e
Wayan
ad
Kan
nu
r
Kasa
rgod
Sta
te
1 Below -1.00 71025.99 67191.75 49543.71 50171.85 60528.40 57987.42 70977.97 74281.16 64874.07 86479.30 77541.63 33949.96 77917.67 43172.92 885643.80
2 Small
1.00-1.99 8838.52 9197.99 11324.68 8214.03 29545.49 34868.78 2364.72 15375.58 30256.41 22701.98 19637.06 21091.44 27433.8 20194.65 282305.13
3
Semi-
medium
2.00-3.99
3365.36 2788.04 3833.01 4861.87 18553.84 17588.12 12413.79 6651.26 24874.17 13246.30 9214.61 13677.62 15213.78 12793.38 159075.15
4 Medium
4.00-9.99 1455.89 844.96 1246.58 2243.08 8188.83 6816.51 4704.01 2196.50 12811.38 4820.83 3075.05 6465.26 4534.86 4659.28 64063.02
5 Large -
10 & above 1666.22 10164.37 822.50 1670 7167.33 47587.86 8331.93 864.64 12667.56 5609.90 1117.29 15271.75 2014.94 4772.36 119728.65
All Categories 86351.98 90187.11 66770.48 67160.83 123983.89 164848.69 120052.42 99369.14 145483.59 132858.31 110585.64 90456.03 127115.05 85592.59 1510815.75

51
TABLE 1V-3 (A)
DISTRICT WISE DISTRIBUTION OF AREA OF OPERATIONAL HOLDINGS BY SIZE CLASS 2010-11 (AREA IN HECTARE)
Scheduled Caste
Sl.
No Size class (Ha)
Tri
van
dru
m
Koll
am
Path
an
am
thit
ta
Ala
pp
uzh
a
Kott
ayam
Idu
kk
i
Ern
ak
ula
m
Th
riss
ur
Pala
kk
ad
Mala
pp
ura
m
Kozh
ikod
e
Wayan
ad
Kan
nu
r
Kasa
rgod
Sta
te
1 Below -1.00 2216.80 3102.99 1820.80 1864.66 1274.27 4285.36 2118.71 2775.79 3798.11 3055.74 2272.33 603.22 966.93 771.47 30927.18
2 Small
1.00-1.99 26.83 46.67 65.01 63.89 107.82 1069.76 69.72 95.94 260.35 330.25 101.56 134.32 115.42 53.83 2541.37
3 Semi-medium
2.00 -3.99 12.60 0 0 21.92 76.05 788.86 44.57 41.51 95.12 71.67 0 151.13 25.78 0 1329.21
4 Medium
4.00-4.99 44.16 0 29.82 0 0 241.40 0 20.10 20 24.25 0 69.29 0 0 449.02
5 Large -10 above 0 0 0 0 0 0 0 0 0 0 0 0 0 0 0
All Categories 2300.39 3149.66 1915.63 1950.47 1458.14 6385.38 2233.00 2933.34 4173.58 3481.91 2373.89 957.96 1108.13 825.30 35246.78

52
TABLE IV-3 (B)
DISTRICT WISE DISTRIBUTION OF AREA OF OPERATIONAL HOLDINGS BY SIZE CLASS 2010-11
Scheduled Tribe
Sl.
No Size Class
Tri
van
dru
m
Koll
am
Path
an
am
thit
ta
Ala
pp
uzh
a
Kott
ayam
Idu
kk
i
Ern
ak
ula
m
Th
riss
ur
Pala
kk
ad
Mala
pp
ura
m
Kozh
ikod
e
Wayan
ad
Kan
nu
r
Kasa
rgod
Sta
te
1 Below -1.00 1535.32 615.94 847.52 47.33 687.75 3387.29 287.91 144.67 1965.67 197.92 308.06 4291.09 1210.25 1630.96 1715.68
2 Small
1.00-1.99 1199.57 177.27 132.94 - 299.79 2765.61 61.93 0 1561.94 50.61 61.59 1398.58 197.30 149.87 8056.99
3 Semi-Medium
2.00-3.99 685.09 0 22.61 - 107.24 2107.42 113.51 0 1639.51 271.57 0 1041.01 128.86 22.25 6139.07
4 Medium
4.00-9.99 127.46 0 0 - 74.63 956.79 0 0 798.62 48.35 0 260.81 36.40 0 2303.06
5 Large –
10 and above 513.94 0 0 - 0 56.65 0 0 60.24 0 0 154.48 0 0 785.31
All Categories 4061.38 793.21 1003.07 47.33 1169.41 9273.76 463.34 144.67 6025.98 568.45 369.65 7145.97 1572.81 1803.08 34442.11

53
TABLE IV-3 (C)
DISTRICT WISE AVERAGE SIZE OF HOLDINGS 2010-11
SL. No District
Below 1.00 Small 1.00-1.99 Semi Medium 2.00-3.99
2005-06 2010-11 Difference 2005-06 2010-11 Difference 2005-06 2010-11 Difference
1 2 3 4 5 6 7 8 9 10 11
1 Thiruvananthapuram 0.09 0.10 -0.01 1.29 1.49 -0.20 2.46 2.59 -0.13
2 Kollam 0.11 0.12 -0.01 1.28 1.51 -0.23 2.56 2.81 -0.25
3 Pathanamthitta 0.18 0.17 0.01 1.31 1.54 -0.23 2.46 2.75 -0.29
4 Alappuzha 0.11 0.11 0.00 1.34 1.55 -0.21 2.57 2.84 -0.27
5 Kottayam 0.16 0.15 0.01 1.34 1.58 -0.24 2.56 2.79 -0.23
6 Idukki 0.24 0.25 -0.01 1.29 1.51 -0.22 2.48 2.69 -0.21
7 Ernakulam 0.11 0.11 0.00 1.32 0.16 1.16 2.54 14.04 -11.50
8 Thrissur 0.12 0.11 0.01 1.33 1.56 -0.23 2.57 2.79 -0.22
9 Palakkad 0.15 0.14 0.01 1.37 1.59 -0.22 2.61 2.82 -0.21
10 Malappuram 0.14 0.13 0.01 1.27 1.56 -0.29 2.58 2.82 -0.24
11 Kozhikode 0.13 0.12 0.01 1.32 1.58 -0.26 2.55 2.80 -0.25
12 Wayanad 0.21 0.22 -0.01 1.36 1.58 -0.22 2.58 2.83 -0.25
13 Kannur 0.17 0.17 0.00 1.34 1.60 -0.26 2.54 2.80 -0.26
14 Kasargod 0.21 0.21 0.00 1.35 1.61 -0.26 2.61 2.83 -0.22
State 0.14 0.13 0.01 1.33 1.57 -0.24 2.56 2.79 -0.23
(Contd……)

54
TABLE IV-3 (C)
DISTRICT WISE AVERAGE SIZE OF HOLDINGS 2010-11
SL. No District
Medium 4.00-9.99 Large 10 & above All Categories
2005-06 2010-11 Difference 2005-06 2010-11 Difference 2005-06 2010-11 Difference
12 13 14 15 16 17 18 19 20
1 Thiruvananthapuram 5.63 5.31 0.32 18.35 41.66 -23.31 0.10 0.11 -0.01
2 Kollam 5.35 4.97 0.38 37.91 254.11 -216.20 0.14 0.16 -0.02
3 Pathanamthitta 5.96 5.28 0.68 20.27 18.28 1.99 0.24 0.22 0.02
4 Alappuzha 5.48 5.50 -0.02 30.38 19.65 10.73 0.15 0.14 0.01
5 Kottayam 5.37 5.45 -0.08 19.04 26.06 -7.02 0.30 0.30 0.00
6 Idukki 5.43 5.40 0.03 103.67 134.05 -30.38 0.60 0.63 -0.03
7 Ernakulam 5.16 5.32 -0.16 24.03 47.61 -23.58 0.17 0.19 -0.02
8 Thrissur 5.31 4.85 0.46 30.20 19.21 10.99 0.15 0.15 0.00
9 Palakkad 5.28 5.35 -0.07 30.22 51.08 -20.86 0.31 0.29 0.02
10 Malappuram 5.21 5.37 -0.16 17.28 43.83 -26.55 0.21 0.19 0.02
11 Kozhikode 5.31 5.13 0.18 24.87 20.31 4.56 0.18 0.17 0.01
12 Wayanad 5.40 5.49 -0.09 65.75 75.23 -9.48 0.55 0.52 0.03
13 Kannur 5.11 5.16 -0.05 16.88 26.87 -9.99 0.28 0.26 0.02
14 Kasargod 5.11 5.13 -0.02 27.68 56.15 -28.47 0.39 0.38 0.01
State 5.30 5.32 -0.02 47.73 64.58 -16.85 0.23 0.22 0.01

55
TABLE IV- 4
SIZE CLASS WISE DISTRIBUTION OF NUMBER, AREA AND PERCENTAGE OF OPERATIONAL HOLDINGS
ACCORDING TO MAJOR SOCIAL GROUPS 2010-11
Sl.
No. Size class (Ha)
Number Of Operational Holdings Area operated (hectares)
All Sch. Caste Sch. Tribe Others All Sch. Caste Sch. Tribe Others
1 Below 1.00 6579692
(96.32)
529419
(99.51)
86041
(90.42)
5964232
(96.14)
885643.80
(58.62)
30927.18
(87.74)
17154.68
(49.82)
837558.94
(58.12)
2 Small
(1.00-1.99)
180171
(2.64)
1975
(.37)
6117
(6.43)
172079
(2.77)
282305.13
(18.69)
2541.37
(7.21)
8056.99
(23.39)
271706.77
(18.85)
3 Semi medium
(2.00-3.99) 57028
(0.83)
516
(0.10)
2555
(2.68)
53957
(0.87)
159075.15
(10.53)
1329.21
(3.77)
6139.07
(17.82)
151606.87
(10.52)
4 Medium
(4.00-9.99) 12044
(0.18)
95
(0.02)
428
(0.45)
11521
(0.19)
64063.02
(4.24)
449.02
(1.28)
2303.06
(6.69)
61310.94
(4.25)
5 Large
(10.00& above)
1854
(0.03) 0
20
(0.02)
1834
(0.03)
119728.65
(7.92) 0
785.31
(2.28)
118943.34
(8.26)
All Categories 6830789
(100)
532005
(100)
95161
(100)
6203623
(100)
1510815.75
(100)
35246.78
(100)
34442.11
(100)
1441126.86
(100)
*Figures in brackets are the percentage to the all sizes

56
TABLE 1V-5
DISTRICT WISE NUMBER AND AREA OF OPERATIONAL HOLDINGS ACCORDING TO MAJOR SOCIAL GROUPS 2010-11
Sl.
No DISTRICT
Number of Operational Holdings Area operated (Hectares)
Sch. Caste Sch. Tribe Others Total Sch. Caste Sch. Tribe Others Total
1 Thiruvananthapuram 59332 5013 686558 750903 2300 4062 79990 86352
2 Kollam 59060 2386 518851 580297 3150 793 86244 90187
3 Pathanamthitta 30305 4535 261978 296818 1916 1003 63852 66771
4 Alappuzha 32808 975 443560 477343 1951 47 65163 67161
5 Kottayam 20234 3205 395297 418736 1458 1169 121357 123984
6 Idukki 35837 15403 208375 259615 6385 9274 149190 164849
7 Ernakulam 47988 1925 597482 647395 2233 463 117356 120052
8 Thrissur 67566 1930 615244 684740 2933 145 96291 99369
9 Palakkad 65499 9496 424529 499524 4174 6026 135284 145484
10 Malappuram 50518 3284 636670 690472 3482 568 128808 132858
11 Kozhikode 38749 2317 597285 638351 2374 370 107842 110586
12 Wayanad 4534 27558 142324 174416 958 7146 82352 90456
13 Kannur 11972 6541 466708 485221 1108 1573 124434 127115
14 Kasargod 7603 10593 208762 226958 825 1803 82964 85592
State 532005 95161 6203623 6830789 35247 34442 1441127 1510816

57
TABLE IV 6
NUMBER AND AREA OF OPERATIONAL HOLDINGS ACCORDING TO TENURE AND TENANCY STATUS 2010-11(AREA IN HECTARES)
All social group
Sl.
No
Size Class of
operational
holdings (Ha)
Total holdings Wholly owned and self operated
holdings
Wholly leased in
Holdings
Wholly Otherwise
Operated
Holdings
Partly owned ,Partly Leased -in and partly
otherwise operated
No Area No Area No Area No Area No Owned
Area
Leased
in Area
Other
operated
Area
Total
Area
1 2 3 4 5 6 7 8 9 10 11 12 13 14 15
1 Marginal
(Below 1.00) 6579692 885643.8 6526605 868350.83 3856 1429.68 16614 2163.23 159 32.09 38.36 46.02 116.47
2 Small
(1.00 - 1.99) 180171 282305.1 173556 271929.87 350 483.08 573 839.78 76 56.04 40.63 32.25 128.92
3 Semi-medium
(2.00-3.99) 57028 159075.2 54591 152387.60 320 860.06 292 599.58 0 0 0 0 0
4 Medium
(4.00 - 9.99) 12044 64063.02 11279 59924.93 192 1093.38 5 30.84 7 2.29 24.28 3.24 29.81
5 Large
(10 & above) 1854 119728.7 1745 115111.08 38 1906.24 0 0 0 0 0 0 0
All Categories 6830789 1510816 6767776 1467704.31 4756 5772.44 17484 3633.43 242 90.42 103.27 81.51 275.2

58
TABLE IV - 6(A)
NUMBER AND AREA OF OPERATIONAL HOLDINGS ACCORDING TO TENURE AND TENANCY STATUS 2010-11(AREA IN HECTARES)
Scheduled Caste
Sl.
No
Size Class of
operational
holdings (Ha)
Total holdings
Wholly owned and
self operated
holdings
Wholly leased
in Holdings
Wholly Otherwise
Operated
Holdings
Partly owned ,Partly Leased -in and
partly other wise operated
No Area No Area No Area No Area No Owned
Area
Leased
-in Area
Other
operated
Area
Total
Area
1 2 3 4 5 6 7 8 9 10 11 12 13 14 15
1 Marginal
(Below 1.00) 529419 30927.18 523218 29558.44 211 39.98 1851 91.78 6 0.49 0.94 1.65 3.08
2 Small
(1.00 - 1.99) 1975 2541.37 1699 2180.56 13 18.16 0 0 0 0.00 0 0 0
3 Semi-medium
(2.00-3.99) 516 1329.21 441 1131.03 5 18.49 0 0 0 0.00 0.00 0.00 0.00
4 Medium
(4.00 - 9.99) 95 449.02 90 425.16 0 0 0 0 0 0.00 0.00 0.00 0.00
5 Large
(10 & above) 0 0 0 0 0 0 0 0 0 0.00 0.00 0.00 0.00
All Categories 532005 35246.78 525448 33295.19 229 76.63 1851 91.78 6 0.49 0.94 1.65 3.08

59
TABLE IV - 6(B)
NUMBER AND AREA OF OPERATIONAL HOLDINGS ACCORDING TO TENURE AND TENANCY STATUS 2010-11
(AREA IN HECTARES)
Scheduled tribe
Sl.
No
Size Class of
operational
holdings (Ha)
Total Holdings Wholly owned and self
operated holdings
Wholly
leased in
Holdings
Wholly
Otherwise
Operated
Holdings
Partly owned ,Partly Leased -in and
partly other wise operated
No Area No Area No Area No Area No Owned
Area
Leased
-in
Area
Other
operated
Area
Total
Area
1 2 3 4 5 6 7 8 9 10 11 12 13 14 15
1 Marginal
(Below 1.00) 86041 17157.68 83250 16262.81 163 52.51 1724 423.25 18 2.66 6.48 6.48 15.62
2 Small
(1.00 - 1.99) 6117 8056.99 5613 7349.94 39 53.93 230 323.35 0.00 0.00 0.00 0.00 0.00
3 Semi-medium
(2.00-3.99) 2555 6139.07 2044 4935.42 191 516.84 268 546.24 0.00 0.00 0.00 0.00 0.00
4 Medium
(4.00 - 9.99) 428 2303.06 297 1517.9 126 754.32 5 30.84 0.00 0.00 0.00 0.00 0.00
5 Large
(10 & above) 20 785.31 15 728.66 5 56.65 0 0 0.00 0.00 0.00 0.00 0.00
All Categories 95161 34442.11 91219 30794.73 524 1434.25 2227 1323.68 18.00 2.66 6.48 6.48 15.62

60
TABLE IV- 7
SIZE CLASS WISE DISTRIBUTION OF NUMBER OF HOLDINGS AND AREA OPERATED
ACCORDING TO TENANCY STATUS 2010-11
Sl.
No
Siz
e cl
ass
of
Op
era
tio
na
l
ho
ldin
gs
(Ha
) Number of Holdings Area operated (in hectares)
Wh
oll
y o
wn
ed a
nd
sel
f
op
era
ted
ho
ldin
gs
wh
oll
y l
ease
d
in h
old
ing
s
Wh
oll
y O
ther
wis
e
op
era
ted
ho
ldin
gs
Pa
rtly
ow
ned
, p
art
ly L
ease
d i
n a
nd
pa
rtly
oth
erw
ise
op
era
ted
Wh
oll
y o
wn
ed a
nd
sel
f
op
era
ted
ho
ldin
gs
Wh
oll
y l
ease
d i
n
Ho
ldin
gs
Wh
oll
y o
ther
wis
e
op
era
ted
ho
ldin
gs
Pa
rtly
ow
ned
, p
art
ly
Lea
sed
in
an
d p
art
ly
oth
erw
ise
op
era
ted
1 2 3 4 5 6 7 8 9 10
1 Marginal
(Below 1.00) 6526605 3856 16614 159 868350.83 1429.68 2163.23 116.47
2 Small
(1.00 - 1.99) 173556 350 573 76 271929.87 483.08 839.78 128.92
3 Semi-medium
(2.00-3.99) 54591 320 292 0 152387.6 860.06 599.58 0
4 Medium
(4.00 - 9.99) 11279 192 5 7 59924.93 1093.38 30.84 29.81
5 Large
(10 & above) 1745 38 0 0 115111.08 1906.24 0 0
All Categories 6767776 4756 17484 242 1467704.31 5772.44 3633.43 275.2

61
TABLE IV 8
DISTRIBUTION OF LEASED IN AREA BY TERMS OF LEASING 2010-11
Sl.No Size class in
hectare
Fixed
money
Fixed
produce
Share of
produce
Usufructuary
Mortgage
Other
Terms Total
1 2 3 4 5 6 7 8
1 Marginal
(Below 1.00) 6189.75 795.08 989.75 46.26 864.04 8884.88
2 Small
(1.00 - 1.99) 3501.87 448.47 683.47 26.99 334.59 4995.39
3 Semi-medium
(2.00-3.99) 2141.31 149.07 325.29 22.00 990.06 3627.73
4 Medium
(4.00 - 9.99) 1538.59 159.86 65.06 0.00 1126.19 2889.70
5 Large
(10 & above) 2677.41 73.34 0.00 0.00 1749.71 4500.46
All Categories 16048.93 1625.82 2063.57 95.25 5064.59 24898.16

62
TABLE IV - 9
LAND UTILIZATION PATTERN 2001-01, 2005-06 AND 2010-11 (AREA IN HECTARES)
Sl.
No Land use Pattern
2000-01 2005-06 2010-11
Area Percentage Area Percentage Area Percentage
1 2 3 4 5 6 7 8
1 Net area sown 1311566 83.57 1300601 83.65 1282759 84.91
2 Area under current fallow 26561 1.69 26382 1.70 11793.68 0.78
3 Other uncultivated land excluding fallow land 47919 3.05 12501 0.80 12096.08 0.80
4 Fallow land other than current fallow 16307 1.04 14771 0.95 11120.1 0.74
5 Cultivable waste land 25249 1.61 25191 1.62 26643.08 1.76
6 Land not available for cultivation 141886 9.04 175380 11.28 166403.4 11.01
Total Area of holdings 1569488 100.00 1554826 100.00 1510816 100.00

63
TABLE 1V-9(A)
DISTRICT WISE DISTRIBUTION OF LAND UTILIZATION 2010-11
Sl.No District
Net
are
a
sow
n
Cu
rren
t f
all
ow
Oth
er
un
cult
iva
ted
la
nd
Fa
llo
w l
an
d o
ther
tha
n c
urr
ent
fall
ow
Cu
ltiv
ab
le w
ast
e
La
nd
no
t a
va
ila
ble
for
cult
iva
tio
n
To
tal
1 2 3 4 5 6 7 8 9
1 Thiruvananthapuram 72212.91 389.62 116.99 240.18 197.54 13194.74 86351.98
2 Kollam 76758.37 446.80 837.58 284.13 621.35 11238.88 90187.11
3 Pathanamthitta 55666.15 705.21 93.95 637.39 973.13 8694.65 66770.48
4 Alappuzha 50232.67 995.34 762.47 1049.02 3072.89 11048.44 67160.83
5 Kottayam 107456.66 854.38 5652.98 1045.87 1404.00 7570.00 123983.89
6 Idukki 152519.07 818.64 1219.36 330.05 508.46 9453.11 164848.69
7 Ernakulam 97523.30 1640.13 522.41 1467.56 2057.82 16841.20 120052.42
8 Thrissur 79576.11 791.79 723.75 1289.90 1251.40 15736.19 99369.14
9 Palakkad 119909.32 1458.66 509.28 1815.96 7164.64 14625.73 145483.59
10 Malappuram 109478.36 1773.80 490.31 1548.11 1605.54 17962.19 132858.31
11 Kozhikode 95938.53 306.94 249.40 333.57 1128.57 12628.63 110585.64
12 Wayanad 82800.80 669.48 299.28 327.76 461.58 5897.13 90456.03
13 Kannur 110522.36 570.09 412.80 397.26 2060.76 13151.78 127115.05
14 Kasargod 72164.78 372.80 205.52 353.34 4135.40 8360.75 85592.59
State 1282759.39 11793.68 12096.08 11120.10 26643.08 166403.42 1510815.75

64
TABLE –IV-9(B) DISTRICT WISE PERCENTAGE DISTRIBUTION OF LAND UTILIZATION 2010-11 (AREA IN HECTARES)
Sl No District Net area sown Current fallow Other uncultivated land
00 -01 05-06 10-11 00-01 05-06 10-11 00-01 05-06 10-11
1 2 3 4 5 6 7 8 9 10 11
1 Thiruvananthapuram 5.55 5.09 5.63 3.37 4.09 3.3 20.03 14.42 0.97
2 Kollam 5.58 5.41 5.98 4.92 3.49 3.79 5.47 2.27 6.92
3 Pathanamthitta 4.55 4.54 4.34 4.72 3.87 5.98 6.85 2.67 0.78
4 Alappuzha 4.15 4.24 3.92 10.17 10.75 8.44 4.28 9.18 6.3
5 Kottayam 8.49 8.4 8.38 7.2 5.92 7.24 2.5 1.07 46.73
6 Idukki 10.93 12.33 11.89 6.37 5.19 6.94 5.96 17.44 10.08
7 Ernakulam 7.44 7.29 7.6 4.75 8.06 13.91 9.19 5.22 4.32
8 Thrissur 7.09 6.42 6.2 4.31 8.22 6.71 12.99 5.5 5.98
9 Palakkad 9.7 10.51 9.35 25.22 16.14 12.37 9.09 5.68 4.21
10 Malappuram 8.41 8.37 8.53 11.16 12.23 15.04 8.1 10.39 4.05
11 Kozhikode 6.92 7.02 7.48 1.98 3.64 2.6 1 2.06 2.06
12 Wayanad 6.29 5.97 6.45 2.3 3.54 5.68 1.23 1.62 2.47
13 Kannur 9.42 9.17 8.62 9.42 5.23 4.83 3.89 2.33 3.41
14 Kasargod 5.47 5.24 5.63 4.11 9.63 3.16 9.41 20.14 1.7
State 100 100 100 100 100 100 100 100 100
Contd………

65
TABLE-IV-9(B)
DISTRICT WISE PERCENTAGE DISTRIBUTION OF LAND UTILIZATION 2010-11 (AREA IN HECTARES)
Sl.No. District
Fallow land other
than current fallow Cultivable waste
Land not available
for cultivation
00-01 05-06 10-11 00-01 05-06 10-11 00-01 05-06 10-11
12 13 14 15 16 17 18 19 20
1 Thiruvananthapuram 2.53 2.13 2.16 1.95 0.99 0.74 2.30 7.32 7.93
2 Kollam 2.18 6.74 2.56 3.10 1.02 2.33 6.54 7.55 6.75
3 Pathanamthitta 5.72 8.41 5.73 2.42 3.59 3.65 3.96 4.86 5.23
4 Alappuzha 11.67 11.30 9.43 6.97 12.50 11.53 6.12 6.22 6.64
5 Kottayam 6.62 7.68 9.41 5.90 6.35 5.27 8.49 7.85 4.55
6 Idukki 5.73 3.40 2.97 4.45 9.70 1.91 7.24 7.24 5.68
7 Ernakulam 5.72 9.70 13.20 5.18 6.09 7.72 8.30 8.60 10.12
8 Thrissur 11.60 7.02 11.60 10.94 3.79 4.70 6.87 8.09 9.46
9 Palakkad 16.38 16.31 16.33 17.09 17.67 26.89 9.02 8.51 8.79
10 Malappuram 10.50 13.60 13.92 9.76 9.84 6.03 9.67 9.37 10.79
11 Kozhikode 3.46 2.92 3.00 1.96 2.10 4.24 9.40 7.66 7.59
12 Wayanad 3.50 1.19 2.95 4.98 3.37 1.73 5.24 3.84 3.54
13 Kannur 7.32 4.98 3.57 9.32 6.96 7.73 10.71 7.93 7.90
14 Kasargod 7.08 4.62 3.18 15.96 16.03 15.52 6.15 4.80 5.02
State 100 100 100 100 100 100 100 100 100

66
TABLE 1V-10
PERCENTAGE OF AREA UNDER MAIN LAND USE TO THE TOTAL OPERATED AREA BY THE DISTRICTS 2000-01, 2005-06 & 2010-11
Sl
No District
Net area cultivated Un cultivated land Land not available
for cultivation Total
2000-01 2005-06 2010-11 2000-01 2005-06 2010-11 2000-01 2005-06 2010-11 2000-01 2005-06 2010-11
1 2 4 5 6 7 8 9 10 11 12 14 15 16
1 Thiruvananthapuram 84.26 81.86 84.08 12.00 2.87 0.64 3.74 15.57 15.28 100 100 100
2 Kollam 85.10 82.84 85.61 4.30 1.78 1.93 10.61 15.38 12.46 100 100 100
3 Pathanamthitta 85.38 84.51 84.43 6.76 3.49 2.55 7.86 12.00 13.02 100 100 100
4 Alappuzha 79.87 77.46 76.28 7.99 7.97 7.27 12.14 14.57 16.45 100 100 100
5 Kottayam 87.76 86.95 87.35 2.92 2.25 6.55 9.33 10.80 6.10 100 100 100
6 Idukki 90.52 90.07 93.02 3.07 2.86 1.25 6.41 7.07 5.73 100 100 100
7 Ernakulam 84.29 83.82 82.60 5.67 3.13 3.37 10.04 13.05 14.03 100 100 100
8 Thrissur 82.04 83.55 80.88 9.47 2.62 3.28 8.49 13.83 15.84 100 100 100
9 Palakkad 84.73 86.24 83.43 7.18 4.63 6.52 8.10 9.13 10.05 100 100 100
10 Malappuram 83.88 83.45 83.74 5.97 4.31 2.74 10.15 12.24 13.52 100 100 100
11 Kozhikode 85.99 86.05 87.03 1.45 1.14 1.55 12.56 12.84 11.42 100 100 100
12 Wayanad 89.40 90.79 92.28 2.60 1.43 1.20 8.00 7.78 6.52 100 100 100
13 Kannur 85.94 87.85 87.39 3.69 2.02 2.26 10.37 10.13 10.35 100 100 100
14 Kasargod 79.83 81.88 84.75 10.62 8.38 5.48 9.56 9.74 9.77 100 100 100
State 85.26 84.81 85.69 5.70 3.49 3.30 9.04 11.72 11.01 100 100 100

67
TABLE IV - 10 (A)
PERCENTAGE OF AREA UNDER MAIN LAND USE TO THE TOTAL OPERATED AREA
OF THE STATE 2000-01, 2005-06 & 2010-11
Sl.No Size class
(hectares)
Percentage of area under
Net cultivated area Un cultivated land Land not available
for cultivation Total
00-01 05-06 10-11 00-01 05-06 10-11 00-01 05-06 10-11 00-01 05-06 10-11
1 2 3 4 5 6 7 8 9 10 11 12 13 14
1 Marginal
(Below 1.00) 82.44 81.72 81.48 6.24 3.00 3.09 11.32 15.28 15.43 100 100 100
2 Small
(1.00 - 1.99) 90.21 90.75 91.20 4.80 3.81 3.71 4.98 5.44 5.09 100 100 100
3 Semi-medium
(2.00-3.99) 90.06 91.52 91.16 4.96 3.86 4.32 4.98 4.62 4.52 100 100 100
4 Medium
(4.00 - 9.99) 89.46 89.46 90.26 5.36 4.29 4.97 5.18 5.75 4.77 100 100 100
5 Large
(10 & above) 82.85 87.40 94.11 5.35 3.82 1.64 11.81 8.78 4.25 100 100 100
All Categories 85.26 85.35 85.69 5.70 3.37 3.30 9.04 11.28 11.01 100 100 100

68
TABLE IV - 11
PERCENTAGE OF NET CULTIVATED AREA ,TOTAL UNCULTIVATED AREA AND LAND NOT
AVAILABLE FOR CULTIVATION 2000-01, 2005-06 & 2010-11
Sl.No Size class
(hectares)
Net cultivated
area
Uncultivated
land
Land not available for
cultivation
00-01 05-06 10-11 00-01 05-06 10-11 00-01 05-06 10-11
1 2 3 4 5 6 7 8 9 10 11
1 Marginal
(Below 1.00) 54.37 55.17 55.74 61.57 51.18 54.90 70.38 78.04 82.14
2 Small
(1.00 - 1.99) 20.21 19.48 19.89 16.10 20.71 20.99 10.52 8.82 8.64
3 Semi-medium
(2.00-3.99) 12.82 12.31 11.20 10.57 13.15 13.80 6.68 4.71 4.32
4 Medium
(4.00 - 9.99) 5.67 5.34 4.47 5.08 6.44 6.38 3.10 2.58 1.84
5 Large
(10 & above) 6.93 7.70 8.70 6.69 8.52 3.93 9.32 5.85 3.06
All Categories 100 100 100 100 100 100 100 100 100
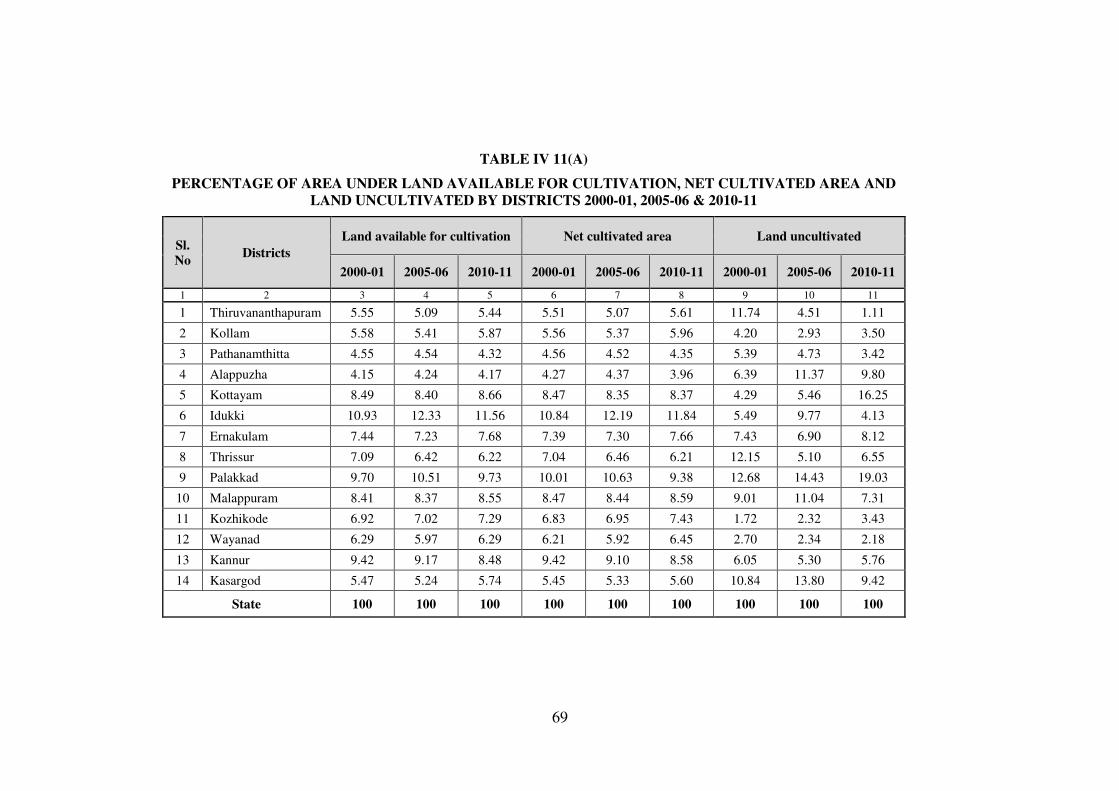
69
TABLE IV 11(A)
PERCENTAGE OF AREA UNDER LAND AVAILABLE FOR CULTIVATION, NET CULTIVATED AREA AND
LAND UNCULTIVATED BY DISTRICTS 2000-01, 2005-06 & 2010-11
Sl.
No Districts
Land available for cultivation Net cultivated area Land uncultivated
2000-01 2005-06 2010-11 2000-01 2005-06 2010-11 2000-01 2005-06 2010-11
1 2 3 4 5 6 7 8 9 10 11
1 Thiruvananthapuram 5.55 5.09 5.44 5.51 5.07 5.61 11.74 4.51 1.11
2 Kollam 5.58 5.41 5.87 5.56 5.37 5.96 4.20 2.93 3.50
3 Pathanamthitta 4.55 4.54 4.32 4.56 4.52 4.35 5.39 4.73 3.42
4 Alappuzha 4.15 4.24 4.17 4.27 4.37 3.96 6.39 11.37 9.80
5 Kottayam 8.49 8.40 8.66 8.47 8.35 8.37 4.29 5.46 16.25
6 Idukki 10.93 12.33 11.56 10.84 12.19 11.84 5.49 9.77 4.13
7 Ernakulam 7.44 7.23 7.68 7.39 7.30 7.66 7.43 6.90 8.12
8 Thrissur 7.09 6.42 6.22 7.04 6.46 6.21 12.15 5.10 6.55
9 Palakkad 9.70 10.51 9.73 10.01 10.63 9.38 12.68 14.43 19.03
10 Malappuram 8.41 8.37 8.55 8.47 8.44 8.59 9.01 11.04 7.31
11 Kozhikode 6.92 7.02 7.29 6.83 6.95 7.43 1.72 2.32 3.43
12 Wayanad 6.29 5.97 6.29 6.21 5.92 6.45 2.70 2.34 2.18
13 Kannur 9.42 9.17 8.48 9.42 9.10 8.58 6.05 5.30 5.76
14 Kasargod 5.47 5.24 5.74 5.45 5.33 5.60 10.84 13.80 9.42
State 100 100 100 100 100 100 100 100 100
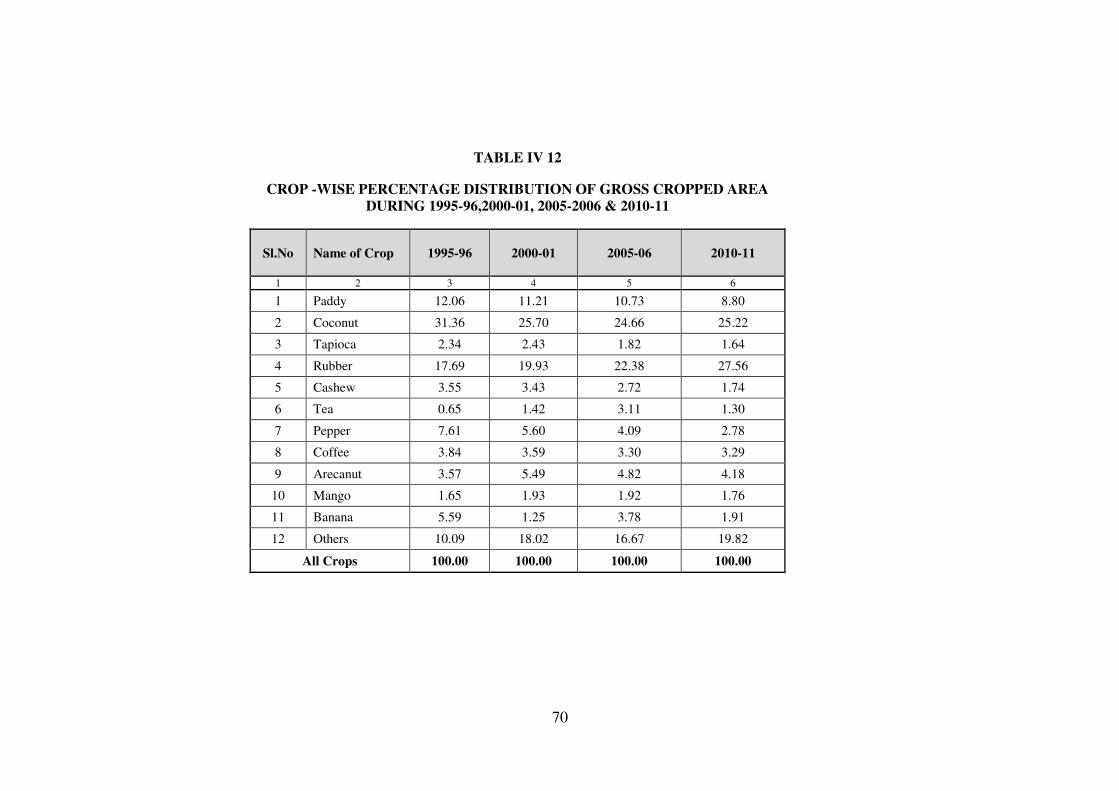
70
TABLE IV 12
CROP -WISE PERCENTAGE DISTRIBUTION OF GROSS CROPPED AREA
DURING 1995-96,2000-01, 2005-2006 & 2010-11
Sl.No Name of Crop 1995-96 2000-01 2005-06 2010-11
1 2 3 4 5 6
1 Paddy 12.06 11.21 10.73 8.80
2 Coconut 31.36 25.70 24.66 25.22
3 Tapioca 2.34 2.43 1.82 1.64
4 Rubber 17.69 19.93 22.38 27.56
5 Cashew 3.55 3.43 2.72 1.74
6 Tea 0.65 1.42 3.11 1.30
7 Pepper 7.61 5.60 4.09 2.78
8 Coffee 3.84 3.59 3.30 3.29
9 Arecanut 3.57 5.49 4.82 4.18
10 Mango 1.65 1.93 1.92 1.76
11 Banana 5.59 1.25 3.78 1.91
12 Others 10.09 18.02 16.67 19.82
All Crops 100.00 100.00 100.00 100.00

71
TABLE 1V 13
PERCENTAGE DISTRIBUTION OF AREA UNDER PRINCIPAL CROPS IN DIFFERENT SIZE CLASSES 2010 - 11
Sl.No Size class
(Hectares) Paddy Coconut Tapioca Rubber Cashew Tea Pepper coffee Arecanut Mango Banana
1 2 3 4 5 6 7 8 9 10 11 12 13
1 Marginal
(0.00-0.99) 42.54 67.72 74.49 41.74 49.53 8.53 53.49 34.14 57.66 81.90 58.75
2 Small
(1.00-1.99) 27.02 13.00 15.65 24.74 18.00 6.00 21.15 19.56 20.69 9.97 22.74
3 Semi medium
(2.00-3.99) 18.33 6.29 7.06 14.35 10.33 3.52 9.77 12.32 12.69 5.34 12.11
4 Medium
(4.00-9.99) 8.41 2.20 2.06 5.29 3.81 1.43 3.75 7.28 4.87 1.90 4.51
5 Large
(10.00& above) 3.70 10.79 0.74 13.88 18.33 80.52 11.84 26.70 4.09 0.89 1.88
All Categories 100.00 100.00 100.00 100.00 100.00 100.00 100.00 100.00 100.00 100.00 100.00

72
TABLE IV 14
DISTRICT WISE INTENSITY OF CROPPING 2010-11 ( AREA IN HECTARE)
Sl.No District Net area sown Gross cropped Area Intensity of cropping
1 2 3 4 5
1 Thiruvananthapuram 72212.91 84533.89 117.06
2 Kollam 76758.37 92416.48 120.40
3 Pathanamthitta 55666.15 64505.74 115.88
4 Alappuzha 50232.67 59939.80 119.32
5 Kottayam 107456.66 121945.86 113.48
6 Idukki 152519.07 213975.28 140.29
7 Ernakulam 97523.30 107071.40 109.79
8 Thrissur 79576.11 91709.80 115.25
9 Palakkad 119909.32 159451.23 132.98
10 Malappuram 109478.36 125467.78 114.61
11 Kozhikode 95938.53 115693.42 120.59
12 Wayanad 82800.80 106846.51 129.04
13 Kannur 110522.36 125798.03 113.82
14 Kasargod 72164.78 83198.72 115.29
State 1282759.39 1552553.94 121.03

73
TABLE IV 15
PERCENTAGE OF GROSS CROPPED AREA UNDER SELECTED CROPS 2010-11
Sl.
No
Size class
(Hectares) Paddy Pepper Banana Mango Cashew Tapioca coconut Aracanut Tea Coffee Rubber Others
All
Crops
1 2 3 4 5 6 7 8 9 10 11 12 13 14 15
1 Marginal
(Below1.00) 6.89 2.73 2.07 2.65 1.59 2.25 31.43 4.44 0.20 2.07 21.18 22.5 100.00
2 Small
(1.00 - 1.99) 12.59 3.11 2.30 0.93 1.66 1.36 17.37 4.59 0.41 3.41 36.13 16.14 100.00
3
Semi-
medium
(2.00-3.99)
15.19 2.55 2.18 0.88 1.69 1.09 14.94 5.00 0.43 3.81 37.24 14.99 100.00
4 Medium
(4.00 - 9.99) 17.39 2.45 2.03 0.79 1.56 0.80 13.03 4.79 0.44 5.63 34.32 16.79 100.00
5
Large
(10 &
above)
2.73 2.76 0.30 0.13 2.68 0.10 22.82 1.43 8.76 7.36 32.08 18.84 100.00
All Categories 8.80 2.78 1.91 1.76 1.74 1.64 25.22 4.18 1.30 3.29 27.56 19.82 100.00
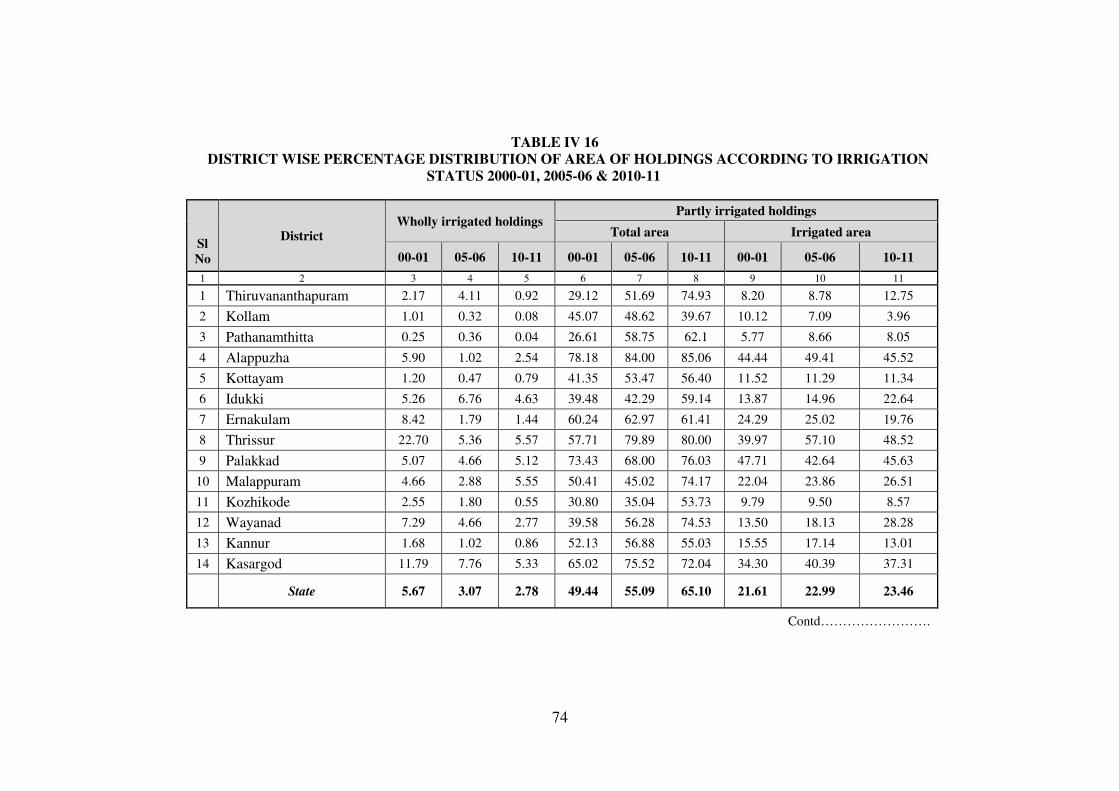
74
TABLE IV 16
DISTRICT WISE PERCENTAGE DISTRIBUTION OF AREA OF HOLDINGS ACCORDING TO IRRIGATION
STATUS 2000-01, 2005-06 & 2010-11
Sl
No
District Wholly irrigated holdings
Partly irrigated holdings
Total area Irrigated area
00-01 05-06 10-11 00-01 05-06 10-11 00-01 05-06 10-11
1 2 3 4 5 6 7 8 9 10 11
1 Thiruvananthapuram 2.17 4.11 0.92 29.12 51.69 74.93 8.20 8.78 12.75
2 Kollam 1.01 0.32 0.08 45.07 48.62 39.67 10.12 7.09 3.96
3 Pathanamthitta 0.25 0.36 0.04 26.61 58.75 62.1 5.77 8.66 8.05
4 Alappuzha 5.90 1.02 2.54 78.18 84.00 85.06 44.44 49.41 45.52
5 Kottayam 1.20 0.47 0.79 41.35 53.47 56.40 11.52 11.29 11.34
6 Idukki 5.26 6.76 4.63 39.48 42.29 59.14 13.87 14.96 22.64
7 Ernakulam 8.42 1.79 1.44 60.24 62.97 61.41 24.29 25.02 19.76
8 Thrissur 22.70 5.36 5.57 57.71 79.89 80.00 39.97 57.10 48.52
9 Palakkad 5.07 4.66 5.12 73.43 68.00 76.03 47.71 42.64 45.63
10 Malappuram 4.66 2.88 5.55 50.41 45.02 74.17 22.04 23.86 26.51
11 Kozhikode 2.55 1.80 0.55 30.80 35.04 53.73 9.79 9.50 8.57
12 Wayanad 7.29 4.66 2.77 39.58 56.28 74.53 13.50 18.13 28.28
13 Kannur 1.68 1.02 0.86 52.13 56.88 55.03 15.55 17.14 13.01
14 Kasargod 11.79 7.76 5.33 65.02 75.52 72.04 34.30 40.39 37.31
State 5.67 3.07 2.78 49.44 55.09 65.10 21.61 22.99 23.46
Contd…………………….
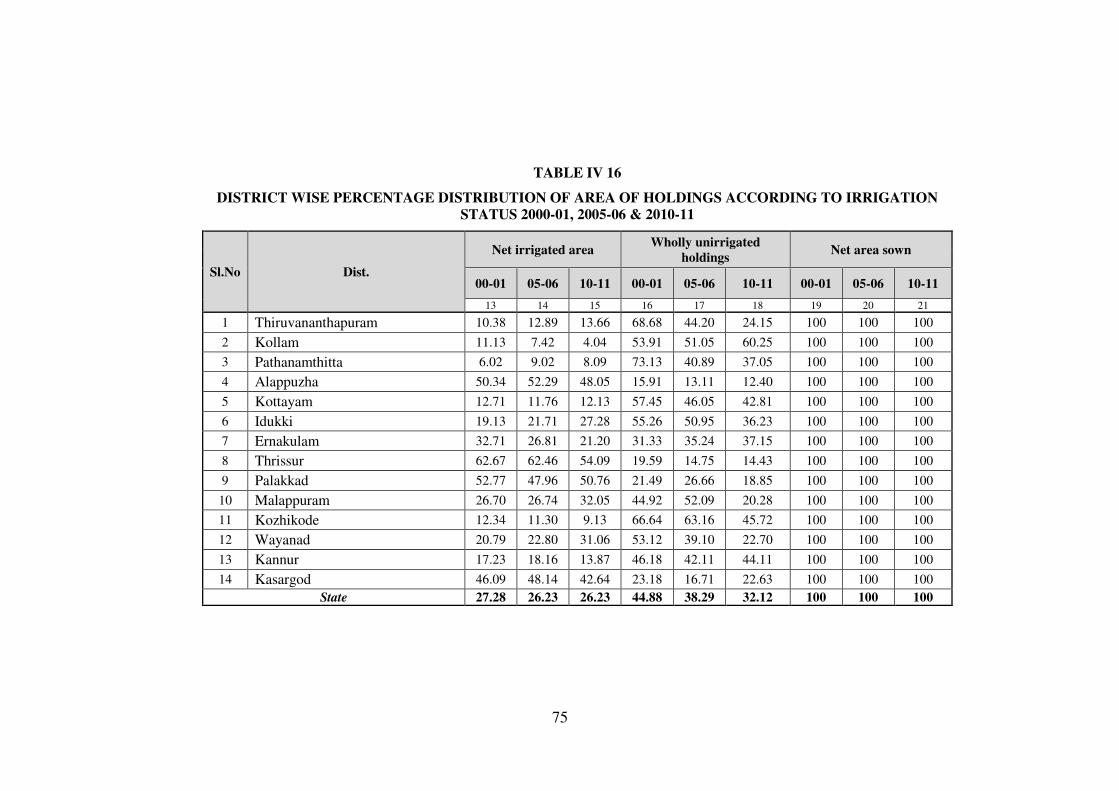
75
TABLE IV 16
DISTRICT WISE PERCENTAGE DISTRIBUTION OF AREA OF HOLDINGS ACCORDING TO IRRIGATION
STATUS 2000-01, 2005-06 & 2010-11
Sl.No Dist.
Net irrigated area Wholly unirrigated
holdings Net area sown
00-01 05-06 10-11 00-01 05-06 10-11 00-01 05-06 10-11
13 14 15 16 17 18 19 20 21
1 Thiruvananthapuram 10.38 12.89 13.66 68.68 44.20 24.15 100 100 100
2 Kollam 11.13 7.42 4.04 53.91 51.05 60.25 100 100 100
3 Pathanamthitta 6.02 9.02 8.09 73.13 40.89 37.05 100 100 100
4 Alappuzha 50.34 52.29 48.05 15.91 13.11 12.40 100 100 100
5 Kottayam 12.71 11.76 12.13 57.45 46.05 42.81 100 100 100
6 Idukki 19.13 21.71 27.28 55.26 50.95 36.23 100 100 100
7 Ernakulam 32.71 26.81 21.20 31.33 35.24 37.15 100 100 100
8 Thrissur 62.67 62.46 54.09 19.59 14.75 14.43 100 100 100
9 Palakkad 52.77 47.96 50.76 21.49 26.66 18.85 100 100 100
10 Malappuram 26.70 26.74 32.05 44.92 52.09 20.28 100 100 100
11 Kozhikode 12.34 11.30 9.13 66.64 63.16 45.72 100 100 100
12 Wayanad 20.79 22.80 31.06 53.12 39.10 22.70 100 100 100
13 Kannur 17.23 18.16 13.87 46.18 42.11 44.11 100 100 100
14 Kasargod 46.09 48.14 42.64 23.18 16.71 22.63 100 100 100
State 27.28 26.23 26.23 44.88 38.29 32.12 100 100 100

76
TABLE IV 16 (A)
PERCENTAGE OF AREA IRRIGATED FROM DIFFERENT SOURCES OF IRRIGATION BY MAJOR SIZE
GROUPS 2000-01, 2005-06 & 2010-11
Sl.No Category of holdings
size group
Canal Tank Well
00-01 05-06 10-11 00-01 05-06 10-11 00-01 05-06 10-11
4 5 6 7 8 9 10 11 12
1 Marginal
(Below 1.00) 45.92 47.34 44.37 31.64 33.71 32.00 63.42 69.36 68.75
2 Small
(1.00 - 1.99) 24.42 24.06 26.30 19.86 24.44 23.61 18.20 16.64 14.83
3 Semi-medium
(2.00-3.99) 19.48 17.67 17.37 15.77 19.95 16.35 10.59 9.50 7.31
4 Medium
(4.00 - 9.99) 8.74 8.58 8.65 12.55 11.10 7.86 4.33 3.31 2.74
5 Large
(10 & above) 1.45 2.35 3.31 20.18 10.80 20.18 3.46 1.19 6.37
All Categories 100 100 100 100 100 100 100 100 100
Cntd………….
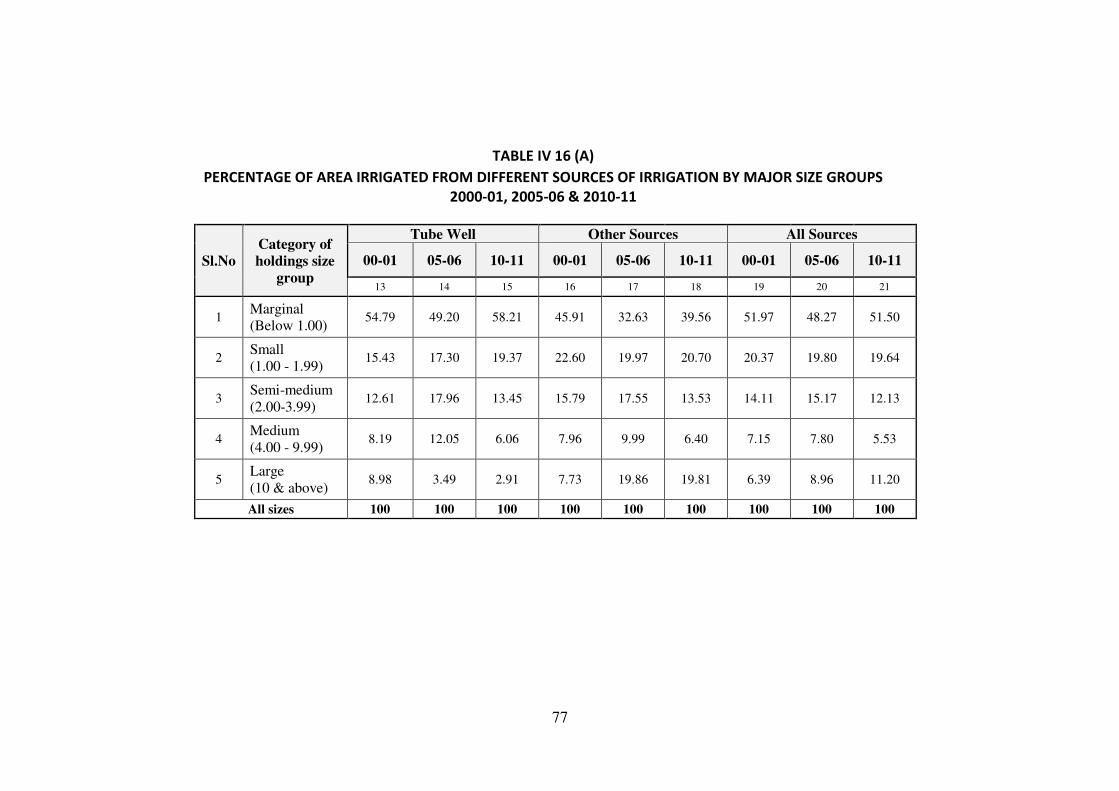
77
TABLE IV 16 (A)
PERCENTAGE OF AREA IRRIGATED FROM DIFFERENT SOURCES OF IRRIGATION BY MAJOR SIZE GROUPS
2000-01, 2005-06 & 2010-11
Sl.No
Category of
holdings size
group
Tube Well Other Sources All Sources
00-01 05-06 10-11 00-01 05-06 10-11 00-01 05-06 10-11
13 14 15 16 17 18 19 20 21
1 Marginal
(Below 1.00) 54.79 49.20 58.21 45.91 32.63 39.56 51.97 48.27 51.50
2 Small
(1.00 - 1.99) 15.43 17.30 19.37 22.60 19.97 20.70 20.37 19.80 19.64
3 Semi-medium
(2.00-3.99) 12.61 17.96 13.45 15.79 17.55 13.53 14.11 15.17 12.13
4 Medium
(4.00 - 9.99) 8.19 12.05 6.06 7.96 9.99 6.40 7.15 7.80 5.53
5 Large
(10 & above) 8.98 3.49 2.91 7.73 19.86 19.81 6.39 8.96 11.20
All sizes 100 100 100 100 100 100 100 100 100

78
TABLE IV 16(B)
PERCENTAGE DISTRIBUTION OF SIZE CLASS WISE AREA IRRIGATED BY DIFFERENT SOURCES
2000-01, 2005-06 & 2010-11
Sl.No Category of holdings
size group
Canal Tank Well
00-01 05-06 10-11 00-01 05-06 10-11 00-01 05-06 10-11
1 2 3 4 5 6 7 8 9 10 11
1 Marginal
(Below 1.00) 15.97 15.50 13.23 7.42 7.07 7.76 51.10 47.90 50.08
2 Small
(1.00 - 1.99) 21.67 19.22 20.56 11.88 12.50 15.01 37.41 27.82 28.34
3 Semi-medium
(2.00-3.99) 24.96 18.41 21.98 13.63 13.31 16.83 31.43 20.73 22.60
4 Medium
(4.00 - 9.99) 22.08 17.39 24.00 21.40 14.41 17.73 25.36 14.06 18.61
5 Large
(10 & above) 4.10 4.14 4.54 38.50 12.20 22.52 22.69 4.40 21.36
All Categories 18.08 15.81 15.38 12.19 10.13 12.48 41.88 33.11 37.52
Contd………………..

79
TABLE IV 16(B)
PERCENTAGE DISTRIBUTION OF SIZE CLASS WISE AREA IRRIGATED BY DIFFERENT SOURCES
2000-01, 2005-06 & 2010-11
Sl.No
Category of
holdings size
group
Tube well Other Sources All Sources
00-01 05-06 10-11 00-01 05-06 10-11 00-01 05-06 10-11
12 13 14 15 16 17 18 19 20
1 Marginal
(Below 1.00) 5.55 6.38 7.27 19.95 23.46 21.66 100.00 100.00 100.00
2 Small
(1.00 - 1.99) 3.99 5.47 6.35 25.05 34.99 29.74 100.00 100.00 100.00
3 Semi-medium
(2.00-3.99) 4.71 7.41 7.13 25.27 40.14 31.46 100.00 100.00 100.00
4 Medium
(4.00 - 9.99) 6.04 9.68 7.03 25.12 44.46 32.63 100.00 100.00 100.00
5 Large
(10 & above) 7.40 2.44 1.68 27.31 76.82 49.90 100.00 100.00 100.00
All Categories 5.27 6.26 6.42 22.58 34.69 28.20 100.00 100.00 100.00

80
TABLE IV-16(C)
DISTRIBUTION OF DISTRICT WISE HOLDINGS RECEIVING IRRIGATION BY DIFFERENT SOURCES 2010 -11
Sl.
No District
Source of irrigation
canal tank well Tube wells other sources Total
No % No % No % No % No % No %
1 2 3 4 5 6 7 8 9 10 11 12 13 14
1 Thiruvananthapuram 6802 3.95 3396 3.06 337015 13.86 9630 3.31 124005 13.59 480848 12.27
2 Kollam 46886 27.24 1562 1.41 115050 4.73 1672 0.57 43372 4.75 208542 5.32
3 Pathanamthitta 5045 2.93 715 0.64 153541 6.31 1235 0.42 16616 1.82 177152 4.52
4 Alappuzha 4830 2.81 18822 16.94 111404 4.58 168136 57.78 65650 7.19 368842 9.41
5 Kottayam 453 0.26 3541 3.19 113173 4.65 4361 1.50 26648 2.92 148176 3.78
6 Idukki 3134 1.82 22618 20.36 58174 2.39 5890 2.02 81570 8.94 171386 4.37
7 Ernakulam 29313 17.03 9375 8.44 192430 7.91 17737 6.10 65969 7.23 314824 8.03
8 Thrissur 24027 13.96 9835 8.85 354484 14.58 5040 1.73 79805 8.74 473191 12.08
9 Palakkad 41630 24.19 9461 8.52 118720 4.88 20026 6.88 136985 15.01 326822 8.34
10 Malappuram 3511 2.04 11366 10.23 290753 11.96 14009 4.81 144701 15.86 464340 11.85
11 Kozhikode 3155 1.83 1828 1.65 200466 8.24 5639 1.94 20754 2.27 231842 5.92
12 Wayanad 1810 1.05 1972 1.78 27904 1.15 1327 0.46 60082 6.58 93095 2.38
13 Kannur 1112 0.65 4147 3.73 224753 9.24 5084 1.75 31379 3.44 266475 6.80
14 Kasargod 390 0.23 12460 11.22 133541 5.49 31211 10.73 15103 1.65 192705 4.92
State 172098 100.00 111098 100.00 2431408 100.00 290997 100.00 912639 100.00 3918240 100.00
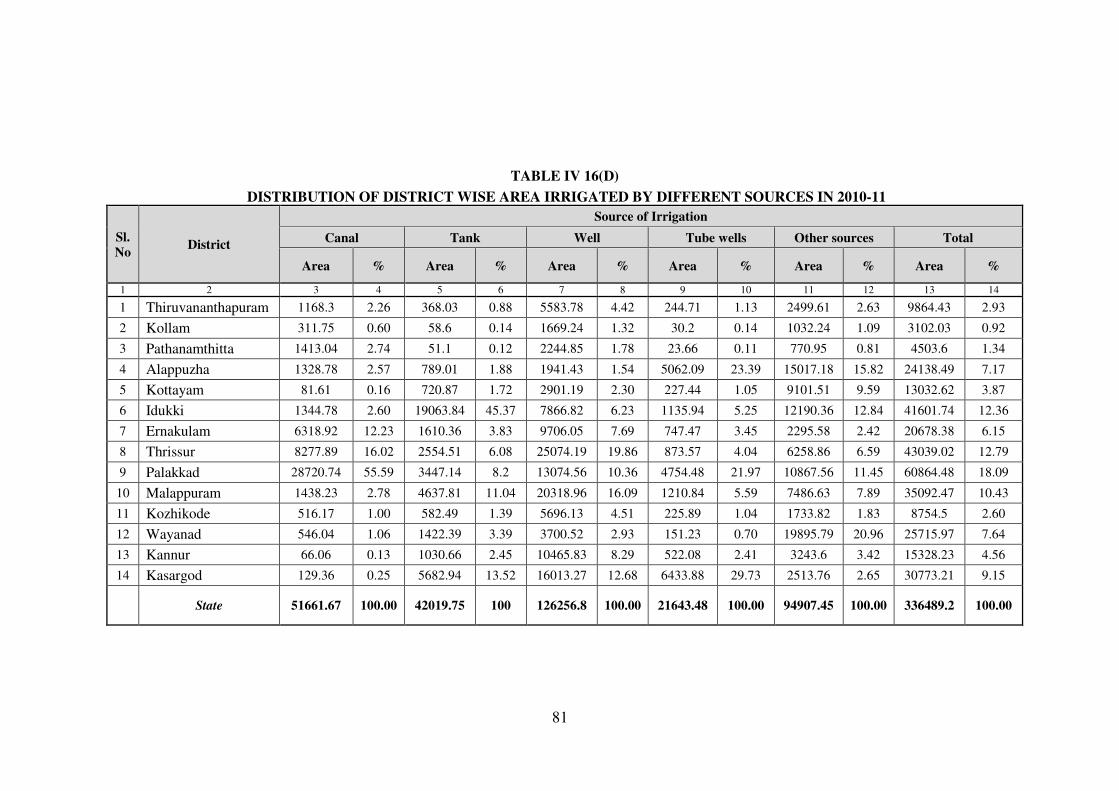
81
TABLE IV 16(D)
DISTRIBUTION OF DISTRICT WISE AREA IRRIGATED BY DIFFERENT SOURCES IN 2010-11
Sl.
No District
Source of Irrigation
Canal Tank Well Tube wells Other sources Total
Area % Area % Area % Area % Area % Area %
1 2 3 4 5 6 7 8 9 10 11 12 13 14
1 Thiruvananthapuram 1168.3 2.26 368.03 0.88 5583.78 4.42 244.71 1.13 2499.61 2.63 9864.43 2.93
2 Kollam 311.75 0.60 58.6 0.14 1669.24 1.32 30.2 0.14 1032.24 1.09 3102.03 0.92
3 Pathanamthitta 1413.04 2.74 51.1 0.12 2244.85 1.78 23.66 0.11 770.95 0.81 4503.6 1.34
4 Alappuzha 1328.78 2.57 789.01 1.88 1941.43 1.54 5062.09 23.39 15017.18 15.82 24138.49 7.17
5 Kottayam 81.61 0.16 720.87 1.72 2901.19 2.30 227.44 1.05 9101.51 9.59 13032.62 3.87
6 Idukki 1344.78 2.60 19063.84 45.37 7866.82 6.23 1135.94 5.25 12190.36 12.84 41601.74 12.36
7 Ernakulam 6318.92 12.23 1610.36 3.83 9706.05 7.69 747.47 3.45 2295.58 2.42 20678.38 6.15
8 Thrissur 8277.89 16.02 2554.51 6.08 25074.19 19.86 873.57 4.04 6258.86 6.59 43039.02 12.79
9 Palakkad 28720.74 55.59 3447.14 8.2 13074.56 10.36 4754.48 21.97 10867.56 11.45 60864.48 18.09
10 Malappuram 1438.23 2.78 4637.81 11.04 20318.96 16.09 1210.84 5.59 7486.63 7.89 35092.47 10.43
11 Kozhikode 516.17 1.00 582.49 1.39 5696.13 4.51 225.89 1.04 1733.82 1.83 8754.5 2.60
12 Wayanad 546.04 1.06 1422.39 3.39 3700.52 2.93 151.23 0.70 19895.79 20.96 25715.97 7.64
13 Kannur 66.06 0.13 1030.66 2.45 10465.83 8.29 522.08 2.41 3243.6 3.42 15328.23 4.56
14 Kasargod 129.36 0.25 5682.94 13.52 16013.27 12.68 6433.88 29.73 2513.76 2.65 30773.21 9.15
State 51661.67 100.00 42019.75 100 126256.8 100.00 21643.48 100.00 94907.45 100.00 336489.2 100.00

82
TABLE 16 (E)
PERCENTAGE OF NUMBER OF HOLDINGS IRRIGATED BY DIFFERENT SOURCES IN EACH DISTRICT-
2010-2011
Sl.
No. District
Source of Irrigation
Canal tank well tube well other sources Total
No % No % No % No % No % No %
1 2 3 4 5 6 7 8 9 10 11 12 13 14
1 Thiruvananthapuram 6802 1.41 3396 0.71 337015 70.09 9630 2.00 124005 25.79 480848.00 100.00
2 Kollam 46886 22.48 1562 0.75 115050 55.17 1672 0.80 43372 20.80 208542.00 100.00
3 Pathanamthitta 5045 2.85 715 0.40 153541 86.67 1235 0.70 16616 9.38 177152.00 100.00
4 Alappuzha 4830 1.31 18822 5.10 111404 30.20 168136 45.58 65650 17.80 368842.00 100.00
5 Kottayam 453 0.31 3541 2.39 113173 76.38 4361 2.94 26648 17.98 148176.00 100.00
6 Idukki 3134 1.83 22618 13.20 58174 33.94 5890 3.44 81570 47.59 171386.00 100.00
7 Ernakulam 29313 9.31 9375 2.98 192430 61.12 17737 5.63 65969 20.95 314824.00 100.00
8 Thrissur 24027 5.08 9835 2.08 354484 74.91 5040 1.07 79805 16.87 473191.00 100.00
9 Palakkad 41630 12.74 9461 2.89 118720 36.33 20026 6.13 136985 41.91 326822.00 100.00
10 Malappuram 3511 0.76 11366 2.45 290753 62.62 14009 3.02 144701 31.16 464340.00 100.00
11 Kozhikode 3155 1.36 1828 0.79 200466 86.47 5639 2.43 20754 8.95 231842.00 100.00
12 Wayanad 1810 1.94 1972 2.12 27904 29.97 1327 1.43 60082 64.54 93095.00 100.00
13 Kannur 1112 0.42 4147 1.56 224753 84.34 5084 1.91 31379 11.78 266475.00 100.00
14 Kasargod 390 0.20 12460 6.47 133541 69.30 31211 16.20 15103 7.84 192705.00 100.00
State 172098 4.39 111098 2.84 2431408 62.05 290997 7.43 912639 23.29 3918240.00 100.00

83
TABLE IV 16 (F)
PERCENTAGE OF AREA IRRIGATED BY DIFFERENT SOURCES IN EACH DISTRICT
2000-01, 2005-06 & 2010-11
Sl.No District
Source of Irrigation
Canal Tank Well
00-01 05-06 10-11 00-01 05-06 10-11 00-01 05-06 10-11
1 2 3 4 5 6 7 8 9 10 11
1 Thiruvananthapuram 13.76 4.4 11.84 6.15 5.11 3.73 57.37 53.9 56.61
2 Kollam 2.51 1.82 10.05 4.33 3.34 1.89 70.5 59.53 53.81
3 Pathanamthitta 5.62 15.55 31.38 7.4 1.75 1.13 31.7 39.69 49.85
4 Alappuzha 11.84 8.02 5.50 7.96 7.96 3.27 15.07 10.01 8.04
5 Kottayam 8.4 0.75 0.63 6.96 5.19 5.53 25.02 18.95 22.26
6 Idukki 4.97 5.26 3.23 42.41 28.33 45.82 29.2 7.81 18.91
7 Ernakulam 29.28 31.57 30.56 7.68 6.54 7.79 47.93 38.52 46.94
8 Thrissur 16.69 13.87 19.23 9.42 7.84 5.94 52.2 54.5 58.26
9 Palakkad 50.75 46.61 47.19 5.36 4.66 5.66 24.03 21.78 21.48
10 Malappuram 4.72 5.62 4.10 11.5 10.68 13.22 59.94 43.71 57.90
11 Kozhikode 8.11 5.81 5.90 7.42 6.89 6.65 61.2 53.72 65.07
12 Wayanad 3.97 3.55 2.12 21.97 9.24 5.53 22.48 5.12 14.39
13 Kannur 4.23 1.34 0.43 11.92 9.22 6.72 60.48 49.69 68.28
14 Kasargod 1.28 2.63 0.42 17.21 17.31 18.47 59.96 47.89 52.04
State 18.08 15.81 15.35 12.19 10.13 12.49 41.88 33.11 37.52
Contd……………

84
TABLE IV 16 (F)
PERCENTAGE OF AREA IRRIGATED BY DIFFERENT SOURCES IN EACH DISTRICT
2000-01, 2005-06 & 2010-11
Sl.No District
Source of Irrigation
Tube Wells Other Sources Total
00-01 05-06 10-11 00-01 05-06 10-11 00-01 05-06 10-11
12 13 14 15 16 17 18 19 20
1 Thiruvananthapuram 1.91 5.71 2.48 20.81 30.88 25.34 100 100 100
2 Kollam 0.81 0.33 0.97 21.86 34.97 33.28 100 100 100
3 Pathanamthitta 1.36 0.82 0.53 53.91 42.2 17.12 100 100 100
4 Alappuzha 17.99 17.53 20.97 47.14 56.48 62.21 100 100 100
5 Kottayam 1.15 0.76 1.75 58.46 74.34 69.84 100 100 100
6 Idukki 3.17 0.88 2.73 20.25 57.72 29.30 100 100 100
7 Ernakulam 2.63 3.14 3.61 12.49 20.22 11.10 100 100 100
8 Thrissur 5.76 3.65 2.03 15.93 20.14 14.54 100 100 100
9 Palakkad 6.19 9.56 7.81 13.67 17.4 17.86 100 100 100
10 Malappuram 3.81 4.29 3.45 20.03 35.7 21.33 100 100 100
11 Kozhikode 2.03 2.12 2.58 21.23 31.46 19.80 100 100 100
12 Wayanad 1.49 0.54 0.59 50.09 81.56 77.37 100 100 100
13 Kannur 1.57 1.77 3.41 21.79 37.99 21.16 100 100 100
14 Kasargod 7.08 15.28 20.91 14.47 16.89 8.17 100 100 100
State 5.27 6.26 6.43 22.58 34.69 28.21 100 100 100
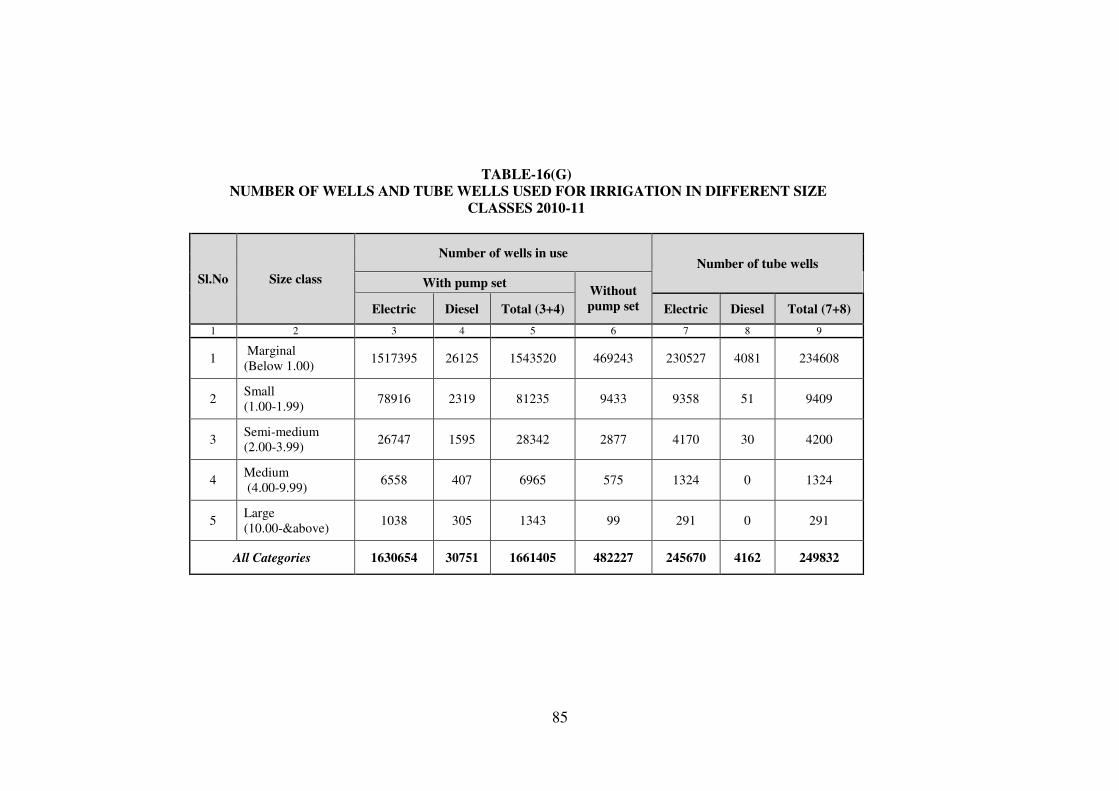
85
TABLE-16(G)
NUMBER OF WELLS AND TUBE WELLS USED FOR IRRIGATION IN DIFFERENT SIZE
CLASSES 2010-11
Sl.No Size class
Number of wells in use Number of tube wells
With pump set Without
pump set Electric Diesel Total (3+4) Electric Diesel Total (7+8)
1 2 3 4 5 6 7 8 9
1 Marginal
(Below 1.00) 1517395 26125 1543520 469243 230527 4081 234608
2 Small
(1.00-1.99) 78916 2319 81235 9433 9358 51 9409
3 Semi-medium
(2.00-3.99) 26747 1595 28342 2877 4170 30 4200
4 Medium
(4.00-9.99) 6558 407 6965 575 1324 0 1324
5 Large
(10.00-&above) 1038 305 1343 99 291 0 291
All Categories 1630654 30751 1661405 482227 245670 4162 249832

86
TABLE IV 16(H)
DISTRIBUTION OF DISTRICT WISE NUMBER OF WELLS AND TUBE WELLS 2010 - 11
Sl.
No District
Number of wells in Use Number of tube wells
With pump set Without
pump set Electric Diesel Total Electric Diesel Total(7+8)
1 2 3 4 5 6 7 8 9
1 Thiruvananthapuram 153379 1823 155202 82568 5190 193 5383
2 Kollam 96623 1339 97962 49878 1065 184 1249
3 Pathanamthitta 113423 2167 115590 44152 9645 116 9761
4 Alappuzha 72181 2244 74425 53508 125343 718 126061
5 Kottayam 90895 1490 92385 25239 3888 156 4044
6 Idukki 42033 3533 45566 12176 3009 181 3190
7 Ernakulam 182576 1059 183635 19379 15458 196 15654
8 Thrissur 245517 2481 247998 22090 6809 647 7456
9 Palakkad 81529 856 82385 27666 14951 564 15515
10 Malappuram 237694 5278 242972 59514 16932 371 17303
11 Kozhikode 102591 1786 104377 29478 5444 198 5642
12 Wayanad 18748 490 19238 4732 901 107 1008
13 Kannur 80116 2580 82696 26977 4356 152 4508
14 Kasargod 113349 3625 116974 24870 32679 379 33058
State 1630654 30751 1661405 482227 245670 4162 249832

87
TABLE IV- 17
INTENSITY OF IRRIGATION 2010-11
Sl No Size Class
(Hectares)
Intensity of irrigation
(Gross Area Concept)
2000-01 2005-06 2010-11
1 2 3 4 5
1 Marginal
(Below 1.00) 111.05 111.1 118.01
2 Small
(1.00-1.99) 108.53 110.09 115.05
3 Semi-medium
(2.00-3.99) 107.6 109.38 114.79
4 Medium
(4.00-9.99) 107.17 107.69 115.44
5 Large
(10.00-&above) 102.9 109.34 164.59
All Categories 109.25 110.21 121.03
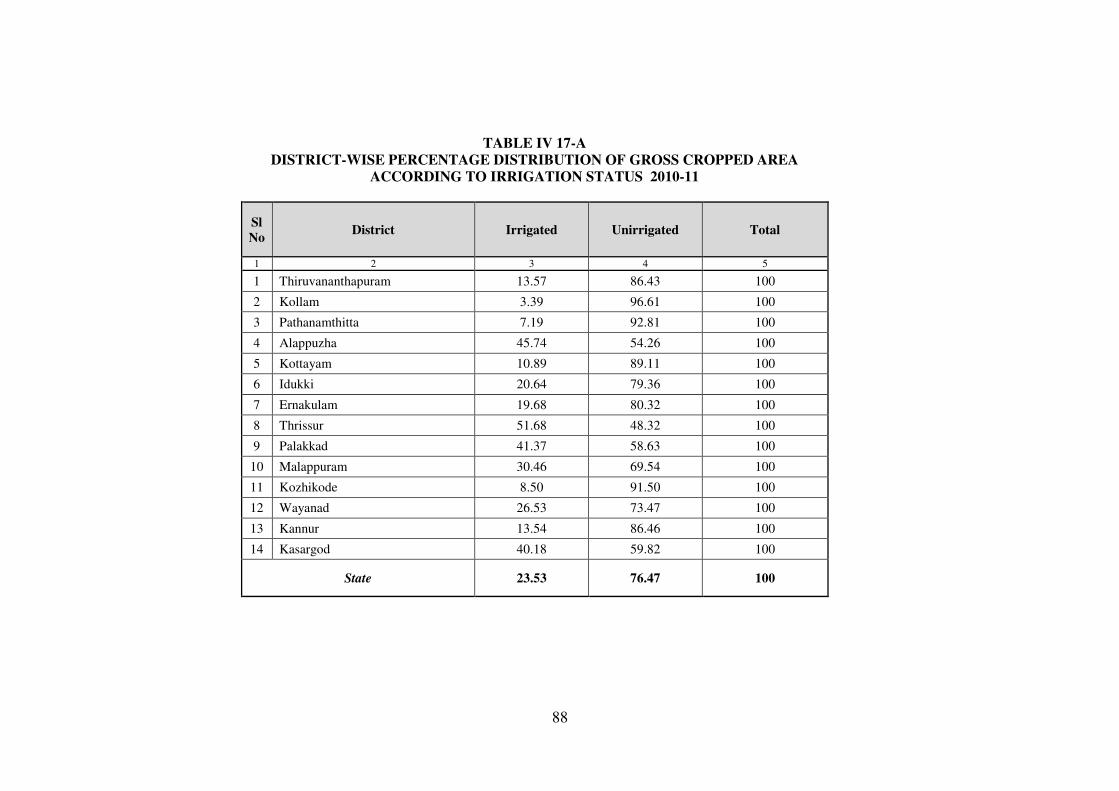
88
TABLE IV 17-A
DISTRICT-WISE PERCENTAGE DISTRIBUTION OF GROSS CROPPED AREA
ACCORDING TO IRRIGATION STATUS 2010-11
Sl
No District Irrigated Unirrigated Total
1 2 3 4 5
1 Thiruvananthapuram 13.57 86.43 100
2 Kollam 3.39 96.61 100
3 Pathanamthitta 7.19 92.81 100
4 Alappuzha 45.74 54.26 100
5 Kottayam 10.89 89.11 100
6 Idukki 20.64 79.36 100
7 Ernakulam 19.68 80.32 100
8 Thrissur 51.68 48.32 100
9 Palakkad 41.37 58.63 100
10 Malappuram 30.46 69.54 100
11 Kozhikode 8.50 91.50 100
12 Wayanad 26.53 73.47 100
13 Kannur 13.54 86.46 100
14 Kasargod 40.18 59.82 100
State 23.53 76.47 100