gps operations at olkiluoto, kivetty and romuvaara in 2010
TRANSCRIPT

P O S I V A O Y
O l k i l u o t o
F I -27160 EURAJOKI , F INLAND
Tel +358-2-8372 31
Fax +358-2-8372 3809
U l l a Ka l l i o
Son ja Nyberg
Hannu Ko ivu la
Jorma Joke la
Markku Poutanen
November 2011
Work ing Repor t 2011 -75
GPS Operations at Olkiluoto,Kivetty and Romuvaara in 2010

November 2011
Working Reports contain information on work in progress
or pending completion.
Ul la Ka l l i o
Son ja Nyberg
Hannu Ko ivu la
Jorma Joke la
Markku Poutanen
F inn ish Geode t i c I ns t i tu te
Work ing Report 2011 -75
GPS Operations at Olkiluoto,Kivetty and Romuvaara in 2010
Base maps: ©National Land Survey, permission 41/MML/11
ABSTRACT
The Finnish Geodetic Institute (FGI) has studied crustal deformations in co-operation with the Posiva Oy since 1994, when a network of ten pillars for GPS observations was established at Olkiluoto. In 2010 the local GPS network at Olkiluoto consisted of 14 concrete pillars. The whole network has been measured twice a year in the static GPS campaigns with 24 h sessions. The four new pillars were established in 2010 and the permanent measurements on them will start in 2011. The network of seven GPS pillars was built at Kivetty and Romuvaara during the year 1996. One pillar in each investigation area belongs to the Finnish permanent GPS network, FinnRef®. A total of 28 GPS measurement campaigns have been carried out at Olkiluoto since 1995, and 18 campaigns at Kivetty and Romuvaara. At Olkiluoto a baseline for electronic distance measurements (EDM) was built in 2002. The baseline has been measured in connection to the GPS observations using the EDM instrument Kern ME5000 Mekometer. The GPS operations in 2010 included the two GPS campaigns at Olkiluoto, GPS campaigns at Kivetty and Romuvaara, EDM baseline measurements at Olkiluoto, and the control marker measurements with the tachymeter at Olkiluoto. All GPS data history was reprocessed with Bernese GPS software using the new processing strategy tested in 2009. The results were analysed by computing the change rates of the baselines and estimating horizontal velocities for the pillars using the barycenter of the velocities as a reference. In the Olkiluoto inner network 80 percent of the change rates were smaller than 0.10 mm/a. Roughly one fourth of the change rates could be considered as statistically significant (change rate larger than 3�). The statistically significant change rates were mainly related to the Olkiluoto permanent station (GPS1) and to the pillar GPS5, which had also the maximum change rate (0.21 ± 0.03 mm/a). In Olkiluoto outer network the maximum and statistically significant change rates are larger compared to the inner network (max 0.42 ± 0.07 mm/a for GPS1-GPS11) but more uncertain due to shorter time series. At Kivetty one third of the change rates could be considered as statistically significant, and the maximum change rate was 0.18 ± 0.03 mm/a for GPS3–GPS4. The horizontal velocities were of the same order of magnitude as in the Olkiluoto network. At Romuvaara the change rates were of the same order of magnitude than in Kivetty and Olkiluoto (less than 0.2 mm/a), but none of the change rates were statistically significant. After four control marker measurement campaigns we can estimate the reproducibility of our angle and distance measurements in micro networks. The standard deviations of horizontal angles, height differences and distances in our micro networks were 0.0028 gon, 0.0007 m and 0.0005 m respectively. As a conclusion of the control measurements we cannot say anything about possible deformations of the pillars – the precision of our observations is not sufficient for the purpose, but we can ensure that any bigger damages have not happened at any pillar. According to the nine years long time series of EDM measurements GPS gives us on the average 1.3 mm longer distances between pillars GPS7 and GPS8 than EDM. The reason for the difference is unmodelled or dismodelled offsets in GPS observations and

the scale difference between GPS and EDM. The trends of EDM and GPS distance time series are similar. FGI will continue geodetic observations at Olkiluoto, Kivetty and Romuvaara. The Olkiluoto network is under major modernization for permanent tracking during upcoming years. We aim to start the permanent tracking in four new stations and four old stations in autumn 2011. Keywords: Deformation studies, GPS measurements, crustal movements.

OLKILUODOSSA, KIVETYSSÄ JA ROMUVAARASSA VUONNA 2010 TEHTYJEN GPS-MITTAUSTEN TULOKSET
TIIVISTELMÄ
GPS-satelliittipaikannukseen perustuvaa deformaatiotutkimusta on tehty Posivan tutkimusalueilla vuodesta 1995 lähtien, jolloin Olkiluotoon perustettiin kymmenen pilaria käsittävä paikallisverkko. Romuvaaralle ja Kivettyyn rakennettiin seuraavana vuonna seitsemän pilarin GPS-verkot. Kaikista tutkimusalueista yksi pilari kuuluu Suomen pysyvään GPS-verkkoon (FinnRef ®), jossa rekisteröintiä tehdään jatkuvasti. Olkiluodon verkko on mitattu 28 kertaa vuodesta 1995 lähtien. Romuvaaralla ja Kivetyssä mittauksia on kertynyt 18. Laajennusten jälkeen Olkiluodon verkko käsittää nykyisin 14 pilaria. Vuoden 2010 aikana alueelle rakennettiin vielä neljä uutta pilaria, jotka varustetaan pysyviksi GPS-asemiksi vuoden 2011 aikana. Olkiluodon tutkimusalueelle rakennettiin v. 2002 perusviiva, jonka pituus on mitattu elektronisilla etäisyydenmittauslaitteilla (EDM) GPS-mittauskampanjoiden yhteydessä. Perusviivalla tehtävien EDM-mittausten tarkoituksena on seurata GPS-vektoreiden systemaattista muuttumista mittauskampanjasta toiseen. Vuoden 2010 mittaukset pitivät sisällään kaksi GPS kampanjaa Olkiluodossa ja yhden kampanjan Kivetyssä ja Romuvaaralla. Lisäksi mitattiin perusviiva Olkiluodossa molempien GPS kampanjoiden aikana ja tehtiin varamerkkimittaukset Olkiluodon pilareilla. Koko GPS-datahistoria on prosessoitu uudelleen Bernese GPS-ohjelmistolla vuonna 2009 kehitetyllä strategialla. Aikasarjoista on laskettu pilarien välisten etäisyyksien muutos ja pisteittäiset vaakaliikkeet. Olkiluodon sisemmässä verkossa 80 prosentilla pisteistä etäisyyden muutos on alle 0.10 mm/a. Tilastollisesti merkitsevät muutokset kuuluvat suurimmaksi osaksi pilariväleille, joiden toinen päätepiste on joko GPS1 tai GPS5. Noin neljäsosalla pilariväleistä on tilastollisesti merkitsevää liikettä ja maksimiliike on 0.21 ± 0.03 mm/a. Olkiluodon ympäristön verkossa maksimiliike on 0.42 ± 0.07 mm/a pistevälillä GPS1–GPS11. Kivetyssä kolmasosalla pilariväleistä etäisyys muuttuu tilastollisesti merkitsevästi, maksimin ollessa 0.18 ± 0.03 mm/a pilarivälillä GPS3–GPS4. Romuvaaran verkossa yhdenkään pilarivälin etäisyys ei muutu tilastollisesti merkitsevästi. Neljän varamerkkimittauskampanjan jälkeen voidaan arvioida saavutettua toistetta-vuutta. Kulmahavaintojen, vaakaetäisyyksien ja korkeuserojen keskivirheiksi saatiin kaikkien kampanjoiden datasta laskettuna 0.0028 gon, 0.0007 m ja 0.0005 m. Mittauksien perusteella ei voida sanoa mitään pilarien mahdollisista liikkeistä, mutta pilarien vahingoittuminen voidaan sulkea pois. Perusviivamittauksien aikasarjat kattavat yhdeksän vuotta. Niiden perusteella pistevälin GPS7-GPS8 EDM:llä mitattu etäisyys poikkeaa GPS-etäisyydestä 1.3 mm. Trendi on lähes sama.

Geodeettinen laitos jatkaa mittauksia Olkiluodon verkossa. Pisteet tullaan muuttamaan pysyviksi GPS-asemiksi. Vuoden 2011 aikana varustetaan neljä uutta ja neljä vanhaa pilaria pysyvillä vastaanottimilla.
Avainsanat: Deformaatiotutkimus, GPS-mittaukset, maankuoren liikkeet.

1
TABLE OF CONTENTS
ABSTRACT TIIVISTELMÄ
1� INTRODUCTION .................................................................................................... 3�
2� OPERATIONS AT THE PERMANENT GPS STATIONS IN 2010 .......................... 5�
3� GPS OPERATIONS AT THE LOCAL NETWORKS ............................................... 9�
3.1� The local networks ........................................................................................ 9�
3.1.1� Olkiluoto networks ............................................................................. 9�
3.1.2� Kivetty and Romuvaara networks ................................................... 10�
3.2� The measurement campaigns in 2010 ........................................................ 12�
3.2.1� The measurements at Olkiluoto ...................................................... 12�
3.2.2� The measurements at Kivetty and Romuvaara ............................... 13�
4� DATA ANALYSIS OF THE LOCAL NETWORKS ................................................. 15�
4.1� Introduction ................................................................................................. 15�
4.2� Data processing .......................................................................................... 15�
4.3� Analysis of Olkiluoto networks .................................................................... 17�
4.3.1� Olkiluoto inner network ................................................................... 17�
4.3.2� Olkiluoto outer network ................................................................... 20�
4.4� Analysis of Kivetty network ......................................................................... 22�
4.5� Analysis of Romuvaara network .................................................................. 24�
5� CONTROL MARKERS.......................................................................................... 27�
5.1� Control markers at Olkiluoto ........................................................................ 27�
5.2� Measurements ............................................................................................ 27�
5.3� Instruments ................................................................................................. 28�
5.4� Calculation .................................................................................................. 28�
5.5� Error sources............................................................................................... 28�
5.6� Conclusions and further operations ............................................................ 29�
6� EDM BASELINE AT OLKILUOTO ........................................................................ 31�
6.1� Background ................................................................................................. 31�
6.2� Instruments ................................................................................................. 31�
6.3� Electronic distance measurements ............................................................. 31�
6.4� Computation ................................................................................................ 31�
6.5� Results ........................................................................................................ 32�
7� FUTURE PLANS .................................................................................................. 35�
8� SUMMARY ........................................................................................................... 37�
9� ACKNOWLEDGEMENTS ..................................................................................... 39�
REFERENCES ............................................................................................................. 41�

2
APPENDICES ............................................................................................................... 45�
Appendix 1. Baseline lengths at Olkiluoto inner network (deviation from mean in mm). .......................................................................... 45�
Appendix 2. Baseline lengths at Olkiluoto outer network (deviation from mean in mm). .......................................................................... 47�
Appendix 3. Change rates at Olkiluoto networks (deviation from mean in mm). ............................................................................................ 49�
Appendix 4. Baseline lengths at Kivetty (deviation from mean in mm). ...... 51�
Appendix 5. Baseline lengths at Romuvaara (deviation from mean in mm). ................................................................................................ 53�
Appendix 6. Baseline lengths at Romuvaara (deviation from mean in mm). ................................................................................................ 55�
Appendix 7. Angles and distances in micro networks ................................. 57�

3
1 INTRODUCTION
The Finnish Geodetic Institute (FGI) has studied crustal deformations in co-operation with the Posiva Oy. The studies have been carried out at the investigation areas, which were selected as candidates for the final disposal sites of spent nuclear fuel. The studies started in 1994, when a network of ten pillars for GPS observations was established at Olkiluoto. In 1995 the GPS networks of seven pillars were built at Kivetty and at Romuvaara. One pillar at each investigation area belongs to the Finnish permanent GPS network FinnRef� and is used for continuous GPS observations.
The measurements started at Olkiluoto in 1995, while the first observations were carried out at Romuvaara and Kivetty in 1996. The baselines between GPS pillars (0.5-3.5 km) have been observed twice a year except the year 2000 because of high ionospheric activity. The studies are now concentrated at Olkiluoto, because the final waste disposal site is being built near the nuclear power stations. Since 2002, observations were carried out at Kivetty and at Romuvaara only annually and since 2008 every second year. We have not terminated the studies at these investigation areas, because those areas are the reference networks for Olkiluoto. The time series of the GPS observations provide the relative movements of the GPS pillars, which are then used to determine the local deformations.
Every GPS pillar has two control markers. We determine regularly the distances and angles between the pillars and their control markers in order to check the stability of the concrete pillars. The measurements have been made using tacheometer in 2001, 2004, 2007 and 2010.
We have also established a 511 m long baseline for electronic distance measurement (EDM) between the pillars GPS7 and GPS8 at Olkiluoto in order to monitor the possible scaling error of the GPS observations, which is mainly caused by the ionosphere refraction and its modelling. The distance has been measured with Kern ME5000 Mekometer, owned by the Department of Surveying, Helsinki University of Technology. ME5000 is the most accurate EDM instrument for the purpose. The Mekometer has been calibrated at the Nummela Standard Baseline every year to ensure the quality of the results. The electronic distance measurements have been performed during the GPS observations since 2002.
The pillar GPS10 was destroyed when Teollisuuden Voima Oy started to build a new nuclear power station at Olkiluoto in the end of year 2003. The pillar GPS10 was replaced with a new one (GPS13), locating about 300 m to the west from the original pillar.
In 2003 Posiva decided to expand the Olkiluoto GPS network to the north. The purpose is to monitor possible crustal movements at an old fracture zone, which is passing from NW to SE along Eurajoensalmi. Two new pillars were established in August 2003 at Kuivalahti and at Iso Pyrekari. The distances to the permanent GPS station are about 8.5 and 4.8 km, respectively.

4
Local crustal deformations have been studied also in the GeoSatakunta project (Ahola and Poutanen 2006, Poutanen and Ahola 2010, Poutanen et al. 2010). The GeoSatakunta GPS network is located in the Cities of Pori and Rauma and their neighbouring municipalities. Two new pillars have been established near Olkiluoto investigation area in October 2005. They are located at Hankkila and Taipalmaa. The distances from the Olkiluoto permanent GPS station are about 7.9 and 5.7 km respectively. Measurements at these pillars connect the Olkiluoto and GeoSatakunta networks.
GPS measurements are suitable to determine horizontal deformations, but the accuracy of height determination is not adequate. The FGI started to determine possible vertical deformations at Olkiluoto with precise levelling in 2003. Levelling campaigns are performed every second year and they are reported in a separate working report (Lehmuskoski 2004, 2006, 2008, 2009 and 2010).
In 2009 the FGI by the request of the Posiva Oy made a plan to expand the Olkiluoto GPS network to southeast. Four new pillars were built in summer and autumn 2010.
The GPS operations in 2010 included the two GPS campaigns at Olkiluoto, GPS campaigns at Kivetty and Romuvaara, EDM baseline measurements at Olkiluoto, and the control marker measurements at Olkiluoto. The levelling campaigns performed in 2010 will be explained in a separate working report.
5
2 OPERATIONS AT THE PERMANENT GPS STATIONS IN 2010
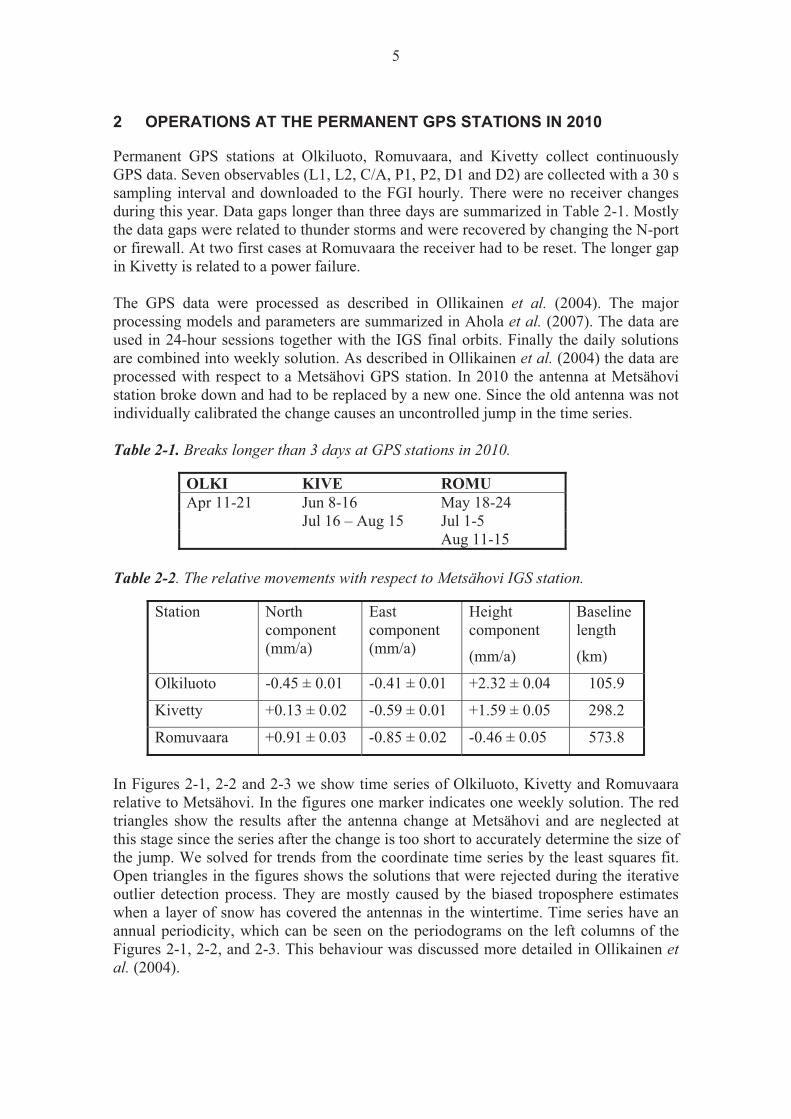
Permanent GPS stations at Olkiluoto, Romuvaara, and Kivetty collect continuously GPS data. Seven observables (L1, L2, C/A, P1, P2, D1 and D2) are collected with a 30 s sampling interval and downloaded to the FGI hourly. There were no receiver changes during this year. Data gaps longer than three days are summarized in Table 2-1. Mostly the data gaps were related to thunder storms and were recovered by changing the N-port or firewall. At two first cases at Romuvaara the receiver had to be reset. The longer gap in Kivetty is related to a power failure. The GPS data were processed as described in Ollikainen et al. (2004). The major processing models and parameters are summarized in Ahola et al. (2007). The data are used in 24-hour sessions together with the IGS final orbits. Finally the daily solutions are combined into weekly solution. As described in Ollikainen et al. (2004) the data are processed with respect to a Metsähovi GPS station. In 2010 the antenna at Metsähovi station broke down and had to be replaced by a new one. Since the old antenna was not individually calibrated the change causes an uncontrolled jump in the time series. Table 2-1. Breaks longer than 3 days at GPS stations in 2010.
OLKI KIVE ROMU Apr 11-21 Jun 8-16 May 18-24 Jul 16 – Aug 15 Jul 1-5 Aug 11-15
Table 2-2. The relative movements with respect to Metsähovi IGS station.
Station North component (mm/a)
East component (mm/a)
Height component
(mm/a)
Baseline length
(km)
Olkiluoto -0.45 ± 0.01 -0.41 ± 0.01 +2.32 ± 0.04 105.9
Kivetty +0.13 ± 0.02 -0.59 ± 0.01 +1.59 ± 0.05 298.2
Romuvaara +0.91 ± 0.03 -0.85 ± 0.02 -0.46 ± 0.05 573.8
In Figures 2-1, 2-2 and 2-3 we show time series of Olkiluoto, Kivetty and Romuvaara relative to Metsähovi. In the figures one marker indicates one weekly solution. The red triangles show the results after the antenna change at Metsähovi and are neglected at this stage since the series after the change is too short to accurately determine the size of the jump. We solved for trends from the coordinate time series by the least squares fit. Open triangles in the figures shows the solutions that were rejected during the iterative outlier detection process. They are mostly caused by the biased troposphere estimates when a layer of snow has covered the antennas in the wintertime. Time series have an annual periodicity, which can be seen on the periodograms on the left columns of the Figures 2-1, 2-2, and 2-3. This behaviour was discussed more detailed in Ollikainen et al. (2004).

6
The velocity components for Olkiluoto, Kivetty and Romuvaara are summarized in the Table 2-3. In GPS solutions the height component is known to be weaker than horizontal ones. This can be explained with modelling of atmosphere and satellite geometry. Any biases in atmospheric estimates or modelling are mainly seen in the height component. Also for height determination we have satellites only above the point leading to poorer observation geometry and therefore weaker solution.
Figure 2-1. Time series of Metsähovi-Olkiluoto vector components. Right: Series of height, East and North components. Left: Periodograms of the time series.Red triangles indicate the times after the antenna change in Metsähovi and is not used in trend estimation.

7
Figure 2-2. Time series of Metsähovi-Kivetty vector components. Right: Series of height, East and North components. Left: Periodograms of the time series. Red triangles indicate the times after the antenna change in Metsähovi and is not used in trend estimation.
Figure 2-3. Time series of Metsähovi-Romuvaara vector components. Right: Series of height, East and North components. Left: Periodograms of the time series. Red triangles indicate the times after the antenna change in Metsähovi and is not used in trend estimation.

8

9
3 GPS OPERATIONS AT THE LOCAL NETWORKS
3.1 The local networks
3.1.1 Olkiluoto networks
The Olkiluoto GPS monitoring network was established in 1994 (Chen and Kakkuri 1995). The original network includes ten reinforced concrete pillars (GPS1-GPS10). The pillars are attached to the solid bedrock, and according to geological studies they are located on different geological blocks. The distances between pillars range from 0.5 to 3.5 km. The station GPS1 belongs to the Finnish permanent GPS network, FinnRef�
(Koivula et al. 1999), in which the abbreviation OLKI is used for the station.
The pillar GPS10 was destroyed at the end of year 2003 when Teollisuuden Voima Oy started to build a new nuclear power station at Olkiluoto. A new pillar GPS13 was established about 300 m west from the pillar GPS10 in August 2003. Previously the name GPS10B was used for the pillar (Ollikainen et al. 2004), but it was renamed GPS13 in 2005. The network including points GPS1-GPS9 and GPS13 (Figure 3-1) is referred here as the Olkiluoto inner network.
In 2003 Posiva decided to expand the Olkiluoto GPS network to the north for monitoring possible crustal movements at an old fracture zone, which is passing from NW to SE along Eurajoensalmi. Two new pillars were established in August 2003. They are located at Kuivalahti (GPS11) and in the islet Iso Pyrekari (GPS12) 8.5 and 4.8 km from the Olkiluoto GPS station. However, Iso Pyrekari (GPS12) has been very difficult to reach since weather or ice conditions. It has been observed only in 10 campaigns compared to 25 of other outer network points. .
Local crustal deformations have been studied in GeoSatakunta project, too (Ahola and Poutanen 2006, Poutanen and Ahola 2010, Poutanen et al. 2010). The GPS network is located in the Cities of Pori and Rauma and in their neighbour municipalities. Two new pillars, GPS14 and GPS15, have been established near Olkiluoto investigation area in October 2005. They are located to the east and to the south from Olkiluoto, at Hankkila and Taipalmaa villages (Figure 3-1). The distances from the permanent GPS station of Olkiluoto are about 7.9 and 5.7 km. The construction of the pillars is same as the pillars established in 2003. The repeated measurement campaigns at the new pillars connect the Olkiluoto and GeoSatakunta networks. The network including points GPS11, GPS12, GPS14 and GPS15 (Figure 3-1) is referred here as Olkiluoto outer network.
The construction work and different pillar types (GPS1-GPS15) were described in Ollikainen et al. 2004. Four new pillars were established in summer and autumn 2010 (Figures 3-1 and 3-2). The pillars will be occupied with permanent GPS receivers.

10
Figure 3-1. The local GPS monitoring networks at the investigation area of Olkiluoto. Black: Original network has been established in 1994 (GPS13 in 2003). Red: Pillars have been established in 2003 and 2005. Blue: new pillars for permanent GPS stations have been established in 2010.
3.1.2 Kivetty and Romuvaara networks
The networks at Kivetty (Figure 3-2) and Romuvaara (Figure 3-3) were established in 1995 (Chen and Kakkuri 1996). Both networks consist of seven pillars built using the same principles than at Olkiluoto. One of the stations (GPS1) at both of the investigation areas belongs to the Finnish permanent GPS network, FinnRef�.

11
Iso-Salminen 152
Ala-Kivetty 157
Heinälampi 161
Kumpunen 170
Suoli-Kumpunen 175
185
180
180
160
200
165
N
GPS1 GPS2
GPS3
GPS4 GPS5
GPS6
GPS7
PERMANENT GPS ST A TION
LOCAL GPS STATION
LEGEND
Figure 3-2. The local GPS network at Kivetty.
Särkkälampi 202,7
Romulampi 210,2
Mustavetinenlampi 206,3 210
220
195
200
200
N
GPS1
GPS2
GPS3
GPS4
GPS5
GPS6 GPS7
PERMANENT GPS ST A TION
LOCAL GPS STATION
LEGEND
Figure 3-3. The local GPS network at Romuvaara.

12
3.2 The measurement campaigns in 2010
3.2.1 The measurements at Olkiluoto
The local GPS monitoring network at Olkiluoto has been observed twice a year since 1995 with the exception of year 2000 (Chen and Kakkuri 1996, 1997 and 1998, Ollikainen and Kakkuri 1999 and 2000, Ollikainen et al. 2001, 2002 and 2004, Ahola et al. 2005, 2006, 2007 and 2008, Kallio et al. 2009, 2010).
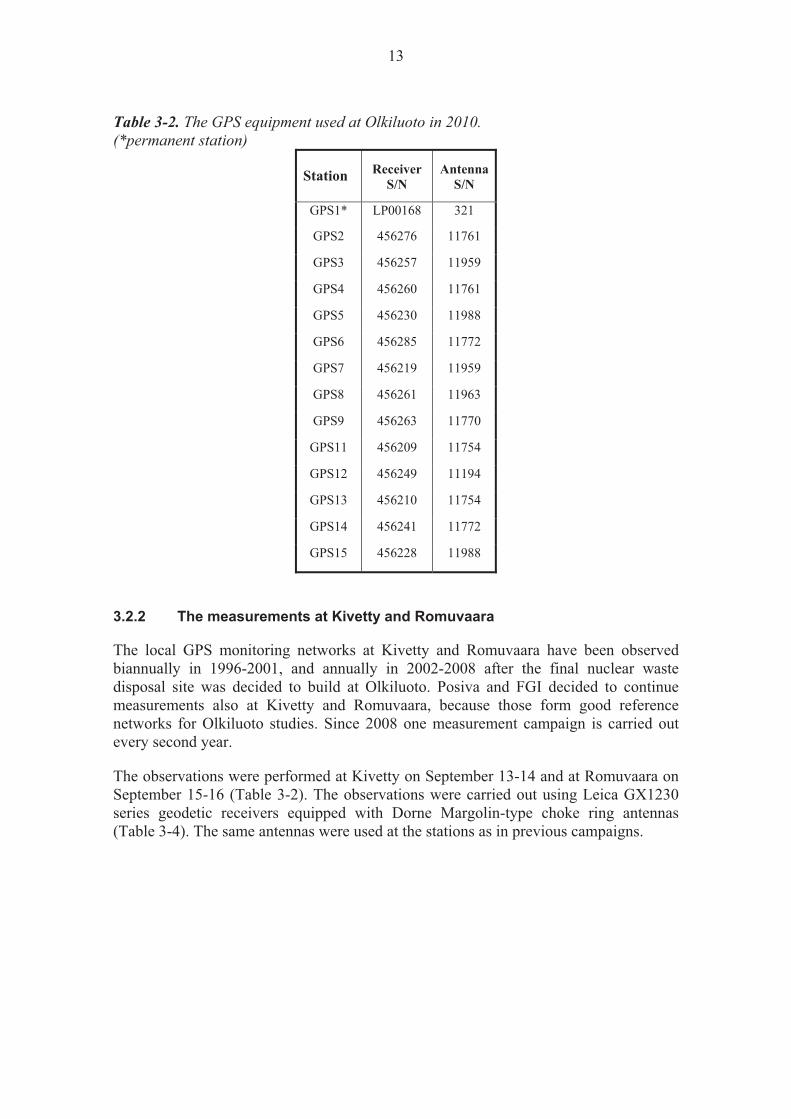
As in the previous years, two GPS measurement campaigns were carried out at Olkiluoto in 2010. The first measurements were performed on May 4-9 and the second one on October 26-31 (Table 3-1). In both campaigns the observations were carried out using Leica GX1230 series geodetic receivers equipped with Dorne Margolin-type choke ring antennas (Table 3-2). The same antennas were used at the stations as in previous campaigns.
In the both campaigns the session I included observations at outer network pillars GPS1, GPS11, GPS12 (only autumn), GPS14 and GPS15. In addition, we also carried out measurement on pillar GPS9 during the session I in order to better tie the outer and inner networks.
Session II and III included observations at inner network: session II pillars GPS1, GPS4, GPS5, GPS6, GPS7, GPS8, GPS9 ja GPS13 and session III pillars GPS1, GPS2, GPS3, GPS5, GPS6, GPS8, GPS9 and GPS13. The pillar GPS12 has been observed only once in 2010. The pillar locates on an island in the nature conservation area, and we could not carry out measurement before the nesting period of birds due to the ice conditions.
Table 3-1. Observation sessions for the GPS measurements at Olkiluoto in 2010.
Campaign Session Observation day Observation
Calendar day GPS day windows (UT)
I / 2010 I* 4 May 124 13.00-24.00 5 May 125 0.00-24.00 6 May 126 0.00-12.20 II 7 May 127 9.40-24.00 8 May 128 0.00-9.50 III 8 May 128 11.00-24.00 9 May 129 0.00-11.20
II / 2010 I 26 October 299 13.45-24.00 27 October 300 0.00-24:00 28 October 301 0.00-11.45 II 29 October 302 9.50-24.00 30 October 303 0.00-10.00 III 30 October 303 11.00-24.00 31 October 304 0.00-11.10
*GPS12 has not been observed during the first campaign.
13
Table 3-2. The GPS equipment used at Olkiluoto in 2010. (*permanent station)
Station Receiver S/N
Antenna S/N
GPS1* LP00168 321
GPS2 456276 11761
GPS3 456257 11959
GPS4 456260 11761
GPS5 456230 11988
GPS6 456285 11772
GPS7 456219 11959
GPS8 456261 11963
GPS9 456263 11770
GPS11 456209 11754
GPS12 456249 11194
GPS13 456210 11754
GPS14 456241 11772
GPS15 456228 11988
3.2.2 The measurements at Kivetty and Romuvaara
The local GPS monitoring networks at Kivetty and Romuvaara have been observed biannually in 1996-2001, and annually in 2002-2008 after the final nuclear waste disposal site was decided to build at Olkiluoto. Posiva and FGI decided to continue measurements also at Kivetty and Romuvaara, because those form good reference networks for Olkiluoto studies. Since 2008 one measurement campaign is carried out every second year.
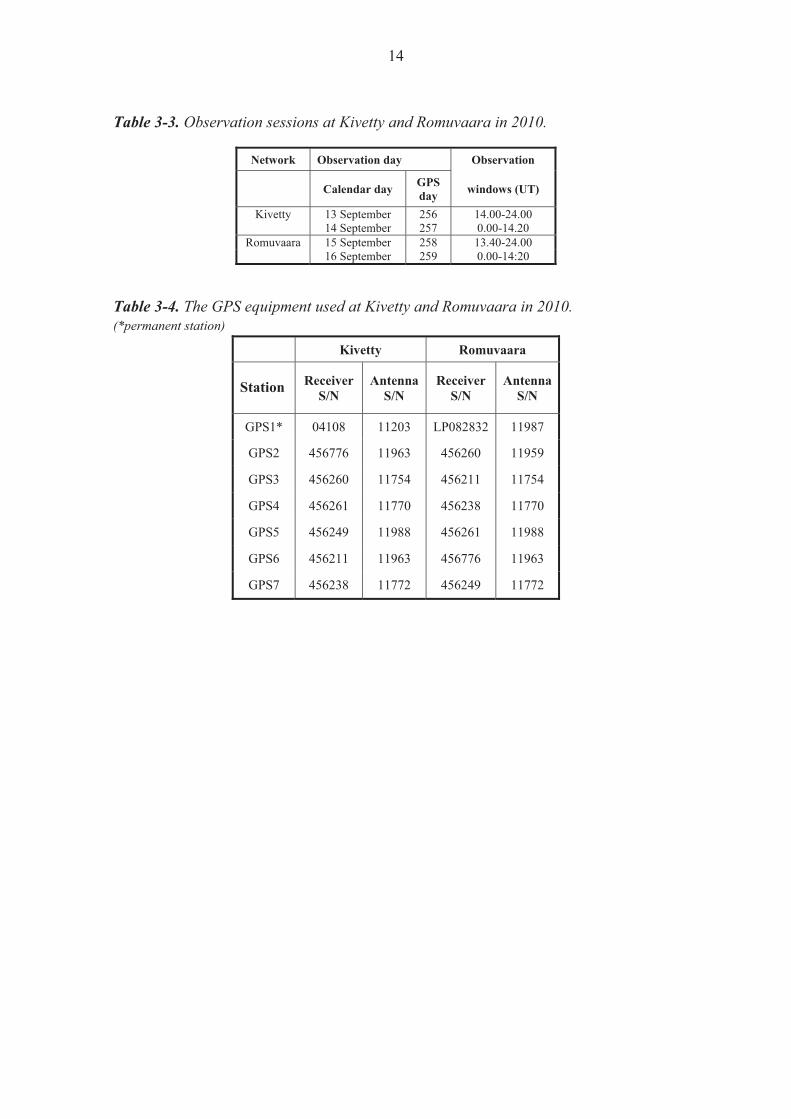
The observations were performed at Kivetty on September 13-14 and at Romuvaara on September 15-16 (Table 3-2). The observations were carried out using Leica GX1230 series geodetic receivers equipped with Dorne Margolin-type choke ring antennas (Table 3-4). The same antennas were used at the stations as in previous campaigns.
14
Table 3-3. Observation sessions at Kivetty and Romuvaara in 2010.
Network Observation day Observation
Calendar day GPS day windows (UT)
Kivetty 13 September 256 14.00-24.00 14 September 257 0.00-14.20
Romuvaara 15 September 258 13.40-24.00 16 September 259 0.00-14:20
Table 3-4. The GPS equipment used at Kivetty and Romuvaara in 2010. (*permanent station)
Kivetty Romuvaara
Station Receiver S/N
Antenna S/N
Receiver S/N
Antenna S/N
GPS1* 04108 11203 LP082832 11987
GPS2 456776 11963 456260 11959
GPS3 456260 11754 456211 11754
GPS4 456261 11770 456238 11770
GPS5 456249 11988 456261 11988
GPS6 456211 11963 456776 11963
GPS7 456238 11772 456249 11772

15
4 DATA ANALYSIS OF THE LOCAL NETWORKS
4.1 Introduction
The Olkiluoto network has been processed with Bernese GPS software. The data has been reprocessed every time after changes, e.g. in the software version or operating system, have occurred. The current version in use is Bernese 5.0 (Dach et al. 2007). Thus far we have carried out a total of 30 campaigns. The amount of the data will increase remarkably in the near future, when new permanent GPS stations at Olkiluoto will start to operate in 2011. We have automated the processing of the campaign data by using the Bernese processing engine (BPE) together with our own Perl scripts, which enables fast repeat of computation for determining the best possible processing strategy and parameters. The automation should also work with minor modifications for the upcoming processing of the permanent data. The whole data history of Olkiluoto, Kivetty and Romuvaara networks were reprocessed including the measurement in 2010. Here we present the main results of the data processing and analysis.
4.2 Data processing
We used the same data processing strategies, which were tested in connection to the previous computation (Kallio et al. 2010). Short baselines (Olkiluoto inner network, Kivetty and Romuvaara) were computed using L1 observables together with local ionosphere model. For the short baselines we also tested the use of both L1 and L2 observables together with local ionosphere model and ionosphere modelling using data from the Olkiluoto pillar GPS9. Olkiluoto outer network was computed using ionosphere free L3 linear combination and QIF ambiguity resolution. In addition to the Olkiluoto campaigns, the data from the Geo-Satakunta campaigns (years 2005-2008, pillars GPS11, GPS14 and GPS15) were included in the processing. The data from the pillar GPS9 observed this year was included in the processing, but not yet further analysed. During the data pre-processing we recognised that the principle “the same antenna on the same pillar” was applied not until year 2000, which mainly explains the larger scatter before that year in the baseline length time series, detected in previous analysis (Kallio et al. 2010). Thus, the whole data history of Olkiluoto, Kivetty and Romuvaara networks were reprocessed using individually and absolutely calibrated antenna correction tables. In addition, the question of reliability of the antenna (s/n 11963) calibration results, which was discussed in previous report (Kallio et al. 2010), was resolved by the recalibration of the antenna. Thus, we also applied the new values for the antenna in this computation. We detected only minor difference in the L1 solution compared to the use of both L1 and L2 observables. The rms of the baseline length time series was on average slightly smaller in the case of L1. We obtained also smaller variation of the height component of

16
the NEU-time series by using only L1, whereas the horizontal components were nearly identical (Figure 4-1). The NEU-time series in Figure 4-1 are calculated the point GPS1 as a reference. The role of ionosphere modelling is a significant issue, when using L1 observables, which are delayed due to the atmospheric conditions. The ionosphere modelling has been considered as a potential reason for the observed difference between GPS and Mekometer results (Par. 6.3). The local ionosphere model is created from observations of a single station. We have used Olkiluoto permanent station as a reference station, which is covered by a dome. Therefore we tested the effect of the reference station selection on the ionosphere model using station GPS9 as a reference. The ionosphere model was nearly independent on the reference station or the dome.
Figure 4-1. An example of the difference between L1 and L1&L2 solutions. Baseline length time series on the left, North-East-Up time series on the right. �
17
4.3 Analysis of Olkiluoto networks
The results were analysed by computing baseline lengths from three-dimensional coordinates obtained from the GPS processing of each campaign. The baseline lengths enable us to determine the change rates of the baselines. The analysis of the change rates represents only deformation between pillar pairs. In order to get insight into the total deformation, we also estimated horizontal velocities for the pillars using the deformation analysis method described in (Kallio et al. 2009).
4.3.1 Olkiluoto inner network
The baseline length time series and the change rates are given in Appendices 1. Figures 4-2 and 4-3 summarise the main features of the baseline length time series. The first observations (1996-2000) fit well to the other observations, that indicates correct use of individual antenna calibration tables and allow us to determine the change rates using the whole data set. Otherwise the baseline time series results are uniform with the previous computations (Kallio et al. 2010). The seasonal variation, i.e. the difference in baseline lengths between spring and autumn campaigns, is not as clearly visible in the last observations as in the previous years (Figure 4-2). The rms values of the baseline length time series varies from 0.2 to 1.1 mm (Figure 4-3). The baseline change rates are given in Appendices 3. The estimated change rates are slightly smaller than the previous estimates: 80 percent of them are smaller than 0.10 mm/a. Roughly one fourth of the change rates can be considered as statistically significant (change rate larger than 3�). The statistically significant change rates are mainly related to the Olkiluoto permanent station (GPS1) and to the pillar GPS5, which has also the maximum change rate (0.21 ± 0.03 mm/a) (Figure 4-2). The pillar GPS13 has larger standard deviations because of the shorter time series (pillar established in 2003). The estimated horizontal velocities are given in Table 4-1 and illustrated in Figure 4-4. We could reach the 0.03 mm/a detection level for a single station movement (except GPS13). The estimated velocities are slightly smaller compared to the previous estimates, but also more reliable, as we could use the whole time series for the analysis. The largest velocities are observed inside the triangle formed by the pillars GPS1, GPS5 and GPS6, consistently with the maximum change rates of the baseline time series analysis.

18
Figure 4-2. Time series of baseline lengths at Olkiluoto. The change rates varies from -0.09 to 0.21 mm/a. All baselines from a single station in the right.

19
Figure 4-3. Summary of the baseline length time series. Standard deviations varies from 0.2 to 1.1 mm at Olkiluoto (OLKI), from 0.2 to 1.0 mm at Kivetty (KIVE), and from 0.3 to 1.7 mm at Romuvaara (ROMU). Table 4-1. Olkiluoto horizontal velocities.
Pillar
1 �0.07 0.01 0.05 0.01
2 0.05 0.02 0.00 0.01
3 �0.05 0.01 �0.03 0.01
4 0.02 0.01 �0.02 0.01
5 �0.06 0.01 0.11 0.01
6 �0.04 0.01 0.05 0.01
7 0.04 0.01 �0.03 0.01
8 0.01 0.01 �0.03 0.01
9 0.05 0.01 �0.06 0.01
13 0.05 0.04 �0.04 0.03
EastVelocity��mm/a
St.dev�mm/a
NorthVelocity�mm/a
St.dev�mm/a

20
Figure 4-4. Illustration of Olkiluoto horizontal velocities.
4.3.2 Olkiluoto outer network
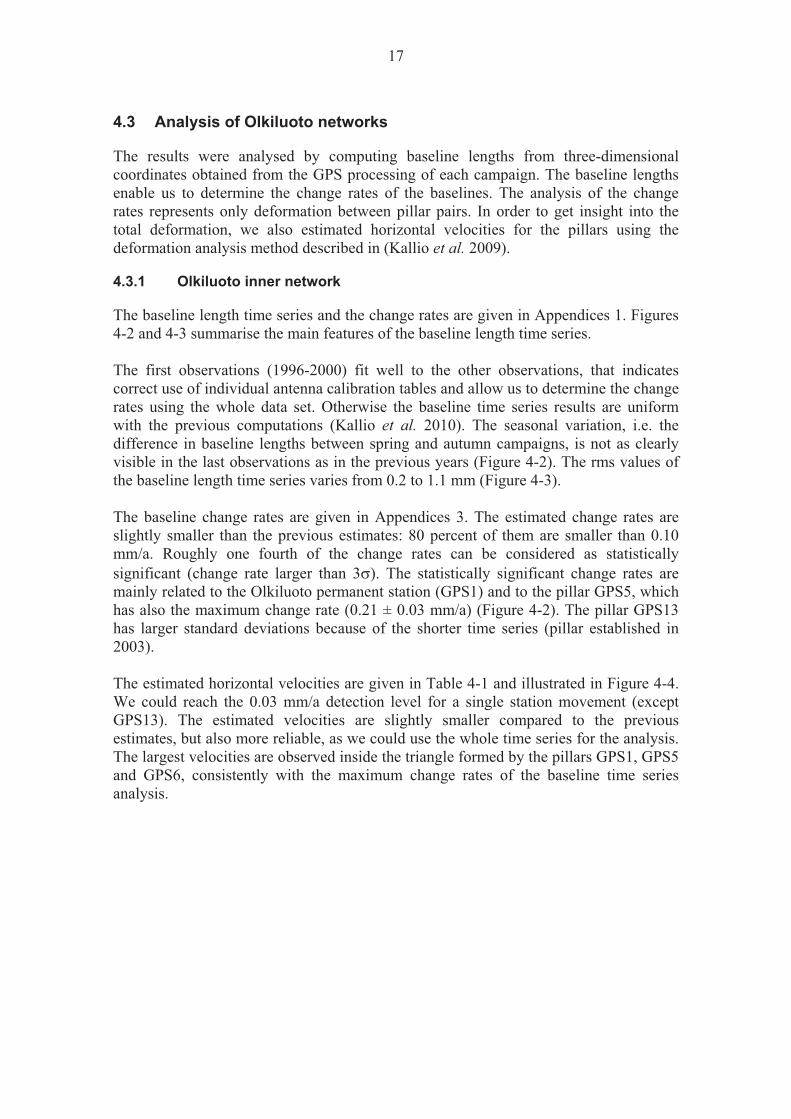
The baseline length time series and the change rates are given in Appendices 2 and 3, and the horizontal velocities in Table 4-1. The Geo-Satakunta observations fit well to the Olkiluoto data enabling more reliable preliminary analysis of short time series. The pillar 12 is especially uncertain with only few observations. The maximum and statistically significant change rates are between GPS1–GPS11 (0.42 � 0.07 mm/a) and GPS11–GPS12 (-0.25 � 0.07 mm/a) (Figure 4-5). However, the change rate between GPS1–GPS12 is zero. The estimated horizontal velocity of the Olkiluoto permanent station can also be considered as statistically significant (Figure 4-6). The baseline GPS1–GPS11 crosses an old fracture zone locating in the direction of the Eurajoensalmi, which might be a reason for the deformation. On the other hand, the Onkalo excavations in the vicinity of the Olkiluoto permanent station (GPS1) may cause some movement. However, more measurements are needed to confirm the deformations.

21
Figure 4-5. Baseline length time series of Olkiluoto outer network. Data from the Geo-Satakunta campaigns (label GEOS) are included in the time series (pillars GPS11, GPS14 and GPS15). Table 4-1. Olkiluoto outer network horizontal velocities.
Pillar
1 0.14 0.03 0.28 0.03
11 0.07 0.04 �0.14 0.03
12 �0.10 0.05 0.01 0.04
14 �0.16 0.05 �0.12 0.0415 0.04 0.05 �0.04 0.05
North EastVelocity�mm/a
St.dev�mm/a
Velocity��mm/a
St.dev�mm/a
22
Figure 4-6. Illustration of Olkiluoto outer network horizontal velocities.
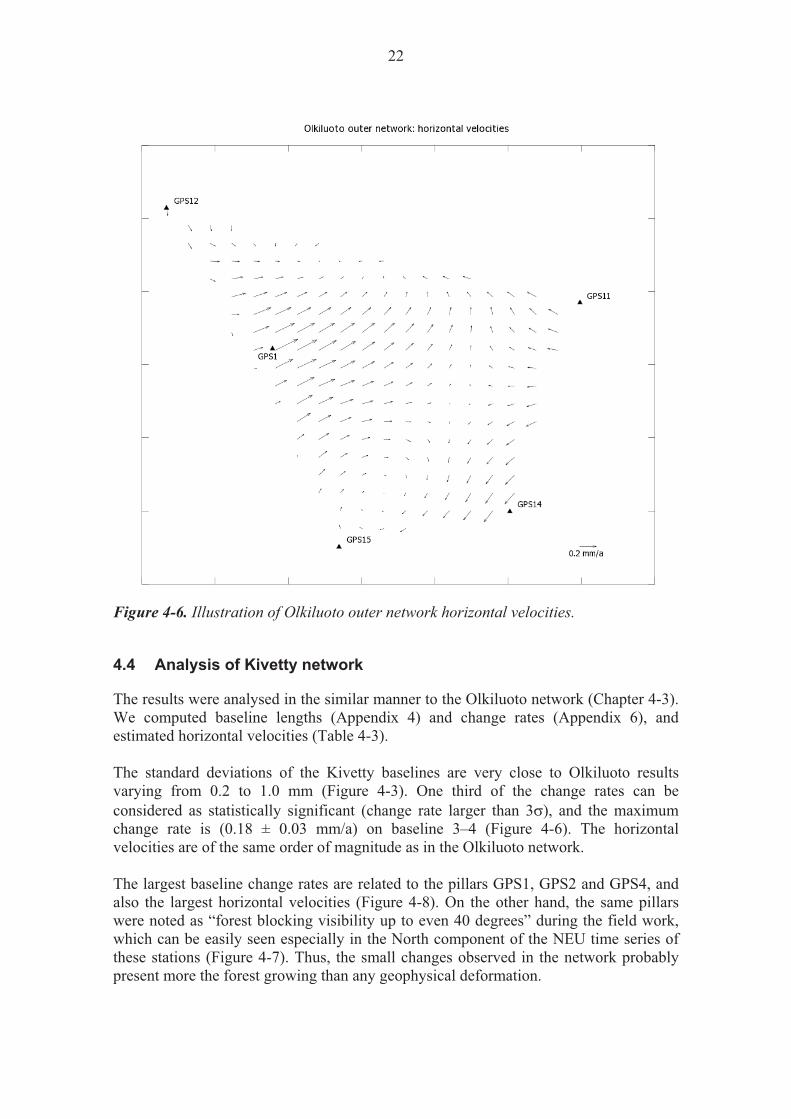
4.4 Analysis of Kivetty network
The results were analysed in the similar manner to the Olkiluoto network (Chapter 4-3). We computed baseline lengths (Appendix 4) and change rates (Appendix 6), and estimated horizontal velocities (Table 4-3). The standard deviations of the Kivetty baselines are very close to Olkiluoto results varying from 0.2 to 1.0 mm (Figure 4-3). One third of the change rates can be considered as statistically significant (change rate larger than 3�), and the maximum change rate is (0.18 ± 0.03 mm/a) on baseline 3–4 (Figure 4-6). The horizontal velocities are of the same order of magnitude as in the Olkiluoto network. The largest baseline change rates are related to the pillars GPS1, GPS2 and GPS4, and also the largest horizontal velocities (Figure 4-8). On the other hand, the same pillars were noted as “forest blocking visibility up to even 40 degrees” during the field work, which can be easily seen especially in the North component of the NEU time series of these stations (Figure 4-7). Thus, the small changes observed in the network probably present more the forest growing than any geophysical deformation.

23
Figure 4-6. Examples of Kivetty baseline length time series.
Figure 4-7. Forest growing is clearly visible in the NEU time series at GPS2 pillar (Kivetty).

24
Table 4-3. Kivetty horizontal velocities.
Pillar
1 �0.11 0.01 �0.03 0.01
2 �0.05 0.01 0.04 0.01
3 �0.06 0.02 0.03 0.01
4 0.14 0.02 �0.01 0.01
5 �0.03 0.01 �0.03 0.01
6 0.12 0.02 0.01 0.01
7 �0.01 0.01 �0.01 0.01
North EastVelocity�mm/a
St.dev�mm/a
Velocity��mm/a
St.dev�mm/a
Figure 4-8. Illustration of Kivetty horizontal velocities.
4.5 Analysis of Romuvaara network
The results were analysed in the similar manner to the Olkiluoto network (Chapter 4-3). We computed baseline lengths (Appendix 5) and change rates (Appendix 6), and estimated horizontal velocities (Table 4-4). The standard deviations of the Romuvaara baselines were larger compared to Olkiluoto results varying from 0.3 to 1.7 mm (Figure 4-3). The change rates were of the same order of magnitude than in Kivetty and Olkiluoto (less than 0.2 mm/a), but none of the change rates were statistically significant (change rate larger than 3�). However, we could estimate statistically significant horizontal velocities for the pillars GPS3, GPS4 and GPS7 (Figure 4-11).

25
The forest growing causes also major problems at Romuvaara (Figure 4-10), and therefore the estimated horizontal velocities are probably not as reliable as the rms values show. There seems to be small movements in all directions.
Figure 4-9. Examples of Romuvaara baseline length time series.
Figure 4-10. Forest growing is clearly visible in the NEU time series at Romuvaara pillars.

26
Table 4-4. Romuvaara horizontal velocities.
Pillar
1 0.05 0.02 �0.03 0.02
2 �0.03 0.02 0.00 0.02
3 �0.11 0.02 �0.02 0.02
4 0.02 0.02 0.16 0.02
5 0.00 0.02 �0.01 0.02
6 0.03 0.02 �0.03 0.02
7 0.05 0.03 �0.07 0.02
North EastVelocity�mm/a
St.dev�mm/a
Velocity��mm/a
St.dev�mm/a
Figure 4-11. Illustration of Romuvaara horizontal velocities.

27
5 CONTROL MARKERS
5.1 Control markers at Olkiluoto
Each GPS pillar has at least two control markers: the older pillars have two and in 2010 established new pillars will have three. The benchmarks are founded in solid bedrock near the station. The distances between pillars and control markers are from 4.5 m to 12.5 m.
The control markers and the pillar point form a micro net of three points. In order to control the possible movements between points in the micro nets we have measured angles and distances in the nets since 2001 every three years. The time series of angles and distances include now the years 2001, 2004, 2007 and 2010 for the points GPS1-GPS9 except the point GPS4. The control marker of the pillar GPS4 is behind the fence of steel truss and the setting up the instrument at the point is impossible. The control marker is also slightly damaged. That is why measurements in 2007 were not carried out at GPS4. In 2010 we performed the measurements at GPS4 using indirect measurement strategy. The time series of angles and distances at the points GPS11 and GPS13 include the years 2003, 2007 and 2010. At the pillar GPS15 we have made angle and distance measurements in 2007 and 2010. It has been impossible to make observations at the pillar GPS14 because it is situated under a high voltage electric line, which damaged our instruments when we tried it. No control marker measurements were made either for the pillar GPS12 at Iso Pyrekari.
5.2 Measurements
The measurement procedure was principally the following
� Setting up the instrument and prism at the points � Horizontal direction set in two faces � Zenith angles and distances point by point in two faces � Temperature and air pressure � Instrument height and prism height
�At all points the setting up was made twice with new centering and levelling. The target was the center of the prism – the GPR1 prisms are excellent targets when distances are short. In addition, if there was a line of sight we also pointed directly to the markers – the pointing to the marker is not as accurate as pointing to the prism. The older pillars are over two meters height and only GPS7 and GPS8 have observation platform around the pillar. We decided not to measure from ladder and that is why at some pillars the measurements were made only at control markers. At the pillar GPS4 we used the method of free stations which may be better than setting up the instrument at the marker if the lines of sight from the instrument to the control markers are clear. We did not set up the instruments at the control markers, but used three free instrument points for indirect measurements of the pillar point and control markers (Figure 5-1). The micro net had some additional temporal points for instrument orientation. The geometry was not the best one. The positions of free stations were

28
chosen so that the control marker behind the fence could be observed. For distance measurement we set up the prisms at the control markers.
5.3 Instruments
Instruments used in our control marker measurements in 2010 were � Tachymeter TC2003 S/N 439351 � Five Wild GPR1 prisms in GPH1P prism holder � Wild GZR3 optical plummets used for leveling the prism � Wild tribraches under the tachymeter and prism holder under the prism � Wild NL (type 344299) automatic nadir plummet S/N 95685 � Thies Clima psychrometers (S/N 6544 / 6527) � Thommen Hoehenmesser aneroid (S/N 164610).
5.4 Calculation
The calculation procedure was principally the following � Station adjustment of horizontal directions – means of the sets � Means of horizontal directions of prisms and directly to markers readings � The first velocity correction to the distances � Calculation of approximate coordinates � Calculation of instrument and prism heights � Error model: individual centering errors and apriori variances for each
observation (horizontal angles, zenith angles and distances, in the adjustment individual weighting)
� 3D network adjustment for each micro net separately � Calculation of adjusted horizontal angles, distances and height differences from
adjusted coordinates
The beauty of 3D adjustment is that we don’t need to reduce observations from marker to marker but from the instrument reference point to the target reference point is sufficient. The instrument and target heights are included in adjustment model. The time series of the horizontal angles, distances and height differences between the control markers are given in Appendix 7.
5.5 Error sources
The main error sources of the horizontal angles are the centering of the instrument and the pointing error. The standard deviation of the horizontal angles from all four campaigns was 0.0028 gon. The standard deviation of the angle readings is about one tenth of that and the remaining part comes from the centering of the instrument and the prisms and naturally from pointing to the target. The horizontal components of the centering error are approximately 0.0002-0.0005 m at each set up of the instrument or the prism. The centering error propagates inversely proportional to the horizontal distances: 0.0002 m standard deviation in centering at both ends propagates to 0.002 gon standard deviation of a direction if the horizontal distance is 10 m.

29
In order to better control the centering of the instruments and prisms we used in 2010 Wild NL (type 344299) automatic nadir plummet (S/N 95685) as a centering device.
The main error source for height differences is the centering errors of the instrument and prisms in vertical direction. The instrument and prisms heights were measured with a roll-up tape measure. To control the vertical eccentricity measurements we measured angles to the prisms and directly to the markers when it was possible. The standard deviation of the height differences from all the four campaign was 0.0007 m. The means of our trigonometric height differences differs from the levelled height differences maximum 0.0009 m. Some systematic or personal errors can be seen in height differences if we compare the four measurement campaigns. This is due to the instrument and prism height measurements.
The standard deviation of adjusted distances from all four campaigns was 0.0005 m. In Figure 5-2 are shown the deviation of distances from mean of the all campaigns.
5.6 Conclusions and further operations
As a conclusion of the control measurements we cannot say anything about possible deformations of the pillar – the precision of our observations is not sufficient for the purpose, but we can ensure that any bigger damages have not happened at any pillar.
We will continue the measurements at the reserve markers in three years intervals. The control measurements of the new pillar points will be carried out in summer 2011 but otherwise the next measurements will be carried out at Olkiluoto in 2013.
The indirect measurements from free stations may improve the precision because there will be no centering errors of the instrument. If the calibrated levelling rod is available it can be used in height transfer from marker to the intersection point of the axes of the tachymeter.
Figure 5-1. The micro network at GPS4. Red: free stations. GPS4 is the point 40. The control markers are 41 and 42. Points 1-6 are temporal additional points. There is a fence between 42 and the other points.

30
Figure 5-2. The standard deviation of the distances of all the campaigns is 0.5 mm.

31
6 EDM BASELINE AT OLKILUOTO
6.1 Background
We started the electronic distance measurements (EDM) at Olkiluoto in 2002, because we have noticed that all vector lengths in some GPS sessions are systematically longer or shorter than the mean of all observations (Ollikainen and Kakkuri, 1999). If the most of the baseline lengths behave similar we cannot interpret the change of the distance to be any deformation. It seems that there is a scale difference between campaigns mainly caused by errors in ionosphere modelling. To control the GPS distances the FGI and Posiva have established a baseline for electronic distance measurements (EDM) between the pillars GPS7 and GPS8 in 2002. The baseline has been measured twice a year during both GPS measurement campaigns since 2002 except in spring 2006.
6.2 Instruments
In our baseline measurement we have used an EDM instrument Kern ME5000 Mekometer (S/N 357094) and Kern prism reflector (S/N 374414) borrowed from the Aalto University. The Mekometer has been calibrated every year in Nummela baseline. In 2010 the calibration measurements were made in Nummela on September 1st and 9th and we refer to the certificate of calibration 17/2010. The weather observations were made at the Mekometer site and at the reflector site. Dry and wet temperatures have been observed with Thies Clima psychrometers (S/N 6530 / 6540 and S/N 6544 / 6527) and air pressure with Thommen Hoehenmesser aneroids (S/N 164610 and S/N 126533 ).
6.3 Electronic distance measurements
The measurements in 2010 were performed on May 5-6 by Pasi Häkli and Sonja Nyberg and on October 27-28 by Hannu Koivula and Veikko Saaranen. We observed 30 single distances in six series from both observation pillars during the campaigns. The instrument and the reflector were centered and adjusted between each series. The weather conditions were measured during every single distance measurement at the instrument site and every two minutes (which is a time a single distance measurement approximately takes) at the reflector site. Between the series we had a half an hour break. The psychrometers and aneroids were kept approximately at the height of the instrument and the reflector. We used shadows at both ends.
6.4 Computation
The results of Mekometer measurements depend on weather conditions. Therefore, the first velocity correction is applied on every single distance observations. The mean of the temperatures and air pressures measured at the instrument site and at the reflector site at the time of distance observation were used. The computation of the refractive index of the air and formulas applied on the observations of the year 2010 are based on the Ciddor’s set of formulae for the refractive index (Ciddor 1996, 1999). The same formulas were applied also on the calibration measurements of the Mekometer. In the earlier computations the closed formulas resolved by IAG in 1999 were used. The

32
computation in detail was explained in Ollikainen et al. 2004. The difference in the results of the distances in 2010 between the two approaches is 0.04 mm.
511 255.0
511 255.5
511 256.0
511 256.5
511 257.0
511 257.5
511 258.0
511 258.5
2001 2002 2003 2004 2005 2006 2007 2008 2009 2010 2011 2012
Dis
tanc
e [m
m]
GPS7-GPS8
GPS
EDM
Linear (GPS)
Linear (EDM)
Figure 6-1. The GPS and the EDM results from the baseline GPS7-GPS8.
6.5 Results
The results of electronic distance measurements at the baseline GPS7-GPS8 are the means of observed distances after the first velocity corrections. These values with standard errors (1�) are given in Table 6-1. In addition to the standard deviation, the standard uncertainty includes the uncertainties of the centring and adjusting of instruments (� 0.1 mm), the calibration of the instruments (� 0.1 mm) and the determination of the refraction correction (� 0.1 mm).
The electronic distance measurements are traceable to the definition of the metre through the Nummela Standard Baseline, which has been measured with the Väisälä light interference method. The latest interference measurements were performed in 2005 and 2007 (Jokela and Häkli 2010). Latest Mekometer calibrations in Nummela have been performed in October 2010. The procedures meet the requirements of the standards ISO 9001 and ISO 17025. The results are given also in Certificates of Calibration of the National Standards Laboratory of the Finnish Geodetic Institute. Since 2003 the results are given with expanded uncertainty (2-�), which is two times the total standard uncertainty.
In the trend fitting the estimated standard deviation of the unit weight was ±0.26 mm which is an estimate of one distance measurement in time series. It is same as our total uncertainty in calibration results. For the GPS distances the same was ±0.31 mm.
The comparison of the EDM and GPS results is given in Figure 6-1. In processing of the GPS network we used the individual absolute calibration values for each antenna. We questioned the calibration values of the antenna (11963) in Kallio et al. 2010. Now the antenna is re-calibrated and the new values of the antenna phase center offset and variation were applied in our calculations.

33
Table 6-1. The space distances between the pillars GPS7-GPS8 measured using the GPS and the Kern Mekometer ME5000. The mean of the GPS observations includes 28 measurement campaigns since 1995.
Measurement Distance (mm)
Standard deviation (mm)
Total standard uncertainty (mm)
Certificate of Calibration
Mean of GPS obs. 511256.0 � 0.3 - - Apr 28 2002 511256.4 � 0.3 � 0.3 5 / 2002 Oct 12-13 2002 511255.7 � 0.1 � 0.2 9 / 2002 Apr 26-27 2003 511256.1 � 0.1 � 0.2 5 / 2003 Oct 11-12 2003 511256.6 � 0.1 � 0.2 19 / 2003 Apr 4-5 2004 511256.5 � 0.1 � 0.3 19 / 2004 Oct 9-10 2004 511255.9 � 0.1 � 0.2 20 / 2004 Apr 10-11 2005 511256.1 � 0.3 � 0.3 20 / 2005 Oct 5-6 2005 511256.1 � 0.2 � 0.3 32 / 2005 Oct 15-16 2006 511255.5 � 0.2 � 0.3 16 / 2006 May 11-12 007 511255.9 � 0.3 � 0.3 8 / 2007 Sept 28-29 2007 511255.9 � 0.3 � 0.3 28 / 2007 Apr 11-12 2008 511255.9 � 0.2 � 0.3 12/2009 Oct 23-24 2008 511256.0 � 0.2 � 0.3 13/2009 May 7-8 2009 511256.2 � 0.3 � 0.4 5/2010 Oct 20-21 2009 511255.6 � 0.2 � 0.3 6/2010 May 5-6 2010 511255.8 � 0.3 � 0.3 2/2011 Oct 27-28 2010 511255.6 � 0.2 � 0.3 3/2011
The difference between the GPS and Mekometer measurements is obvious. Based on 17 measurements in nine years, the trends of the two time series seems to be similar. This indicates real changes between two pillars. The correlation of the variations in the two time series is 0.43. Due to unmodelled or dismodelled geometrical offsets and the scale difference between GPS measurements and EDM there is about 1.3 mm difference between distances GPS7-GPS8 derived from GPS measurements and EDM. The influence of the local circumstances (a high voltage electric line near the pillar GPS8) to the phase variation of the GPS antenna may be one reason to the difference.
We noticed that in the EDM results the geometrical correction due to the instrument and reflector heights above the markers have not been included. In our measurements the instrument height is approximately same as the reflector height (0.33 m). The small differences come from the process of levelling the instrument and the reflector. The plumb lines at the ends of the baseline are not collinear. Distances from marker to marker are 0.03 mm shorter than distances from instrument reference point to prism and the correction can be neglected from the results. The more serious is the difference in heights above the markers. The error depends on the height difference of the markers which in case of the pillars GPS8 and GPS7 is about 6.6 m. The difference between instrument and reflector heights above the markers causes an error to the distance shown in the table 6-2. The correction is more than 0.16 mm if the difference of the heights above the markers is more than 10 mm, which is about the maximum we can have with our tribraches. The practical maximum in our measurements is 5 mm (the extreme positions of the screws are hardly ever used) and it makes an error of 0.1 mm to the measured distance. The part of the error cancels out when we take the average of our series.

34
It is not possible to calculate any correction to the GPS co-ordinates based on one baseline distance only but the baseline is still very good control for the GPS measurements. We will continue the electronic distance measurements in connection to the GPS measurements also in the future.
Table 6-2. The error in distance due to the difference in instrument and reflector heights above the marker.

35
7 FUTURE PLANS
According to our quality manual (Kallio 2011) and the consultations between Posiva and the FGI we will continue geodetic observations at Olkiluoto twice a year and Kivetty and Romuvaara every second year. The Olkiluoto network is under modernization for permanent tracking. Four new pillars were built in 2010 and the old pillars GPS2, GPS6, GPS9 and GPS13 will be equipped for permanent tracking, too. The modernizing of the rest of the pillars will follow up later. The studies of each year will be reported in Posiva working report series. The permanent FinnRef® stations (OLKI, KIVE, ROMU) will continue observations at the investigation areas. The Olkiluoto station is situated in the area where it is in danger to be destroyed or construction work may cause some deformation. It will be replaced during the renewal of the whole FinnRef® network. The old Olkiluoto local GPS network – including those pillars not yet tracking permanently – will be measured twice a year. We hope to start the permanent tracking in four new stations in autumn 2011. Even if the studies are concentrated at Olkiluoto, one measurement campaign will be carried out at Kivetty and Romuvaara every two years. The EDM baseline GPS7-GPS8 at Olkiluoto will be measured with the Mekometer during every GPS campaign to improve the reliability of the GPS results. The Mekometer will be calibrated at the Nummela Standard Baseline at least once a year to ensure the quality of the results. Two new EDM/GPS baselines are planned in connection to the extension of the network. EW and SN baselines will help to better control the stability on the network scale and track the temporal variation.
Every GPS station has two control markers. We will determine the distances and the angles between the stations and the control markers in order to check the stability of the concrete pillars at Olkiluoto in three years interval. Next measurements will be carried out in 2013. Angles and distances at new permanent station will be measured before antennas will be attached although in the new pillars the prism holders and levelling control mark will be on the side of the pillar.
The heights of Olkiluoto GPS network have been measured with precise levelling in 2003, 2005, 2007 and 2009 (Lehmuskoski 2004, 2006, 2008 and 2010). The levelling is the most accurate method to observe the possible vertical deformations at the investigation area. The levelling campaigns will be performed every second year and results will be published in a separate working report of Posiva. We established two levelling networks at Olkiluoto in 2006 for specific deformation studies. The networks are located above the excavation area of the ONKALO and the repository for low- and medium-level waste (the VLJ repository). We will observe these micro networks annually.
We have started to develop and automate data processing and deformation analysis for the upcoming data from permanent GPS stations. The GPS data analyses, deformation analyses and automation of the process will be explained in details in a special report, when the data from new permanent stations is available.

36

37
8 SUMMARY
The Finnish Geodetic Institute (FGI) has studied crustal deformations in co-operation with Posiva Oy since 1995. At the beginning the studies have been carried out at three investigation areas (Olkiluoto, Kivetty and Romuvaara), which were selected as candidates for the final disposal sites of spent nuclear fuel. The studies are now concentrated at Olkiluoto, where the final waste disposal site is being built, but we have also continued the measurement at Kivetty and Romuvaara as reference measurement for Olkiluoto studies.
A total of 28 GPS observation campaigns have been carried out at Olkiluoto inner network biannually since 1995 and 25 campaigns at Olkiluoto outer network since 2003. The Kivetty and Romuvaara networks have been measured biannually 1996-2000, annually 2001-2008 and every second year since 2008 making a total of 18 campaigns thus far. All data history was reprocessed with new processing strategy tested in 2009 (Kallio et al. 2010) using the new antenna calibration corrections. The results were analysed by computing the change rates of the baselines and estimating horizontal velocities for the pillars using the barycenter of the velocities as a reference. In the Olkiluoto inner network 80 percent of the change rates were smaller than 0.10 mm/a. Roughly one fourth of the change rates could be considered as statistically significant (change rate larger than 3�). The statistically significant change rates were mainly related to the Olkiluoto permanent station (GPS1) and to the pillar GPS5, which had also the maximum change rate (0.21 ± 0.03 mm/a). The maximum horizontal velocity component was -0.07 ± 0.01 mm/a for pillar GPS1, and we could reach the 0.03 mm/a detection level for a single station movement (except GPS13). The estimated velocities were slightly smaller compared to the previous estimates, but also more reliable, as we could use the whole time series for the analysis. The largest velocity values are observed inside the triangle formed by the pillars GPS1, GPS5 and GPS6, consistently with the maximum change rates of the baseline time series analysis. In the illustration of the horizontal velocities (Figure 4-4) we could detect stretches between the northwest and the southeast part of the island, but we must consider that velocities are under 0.1 mm level. In Olkiluoto outer network the maximum and statistically significant change rates are larger compared to the inner network (max 0.42 � 0.07 mm/a for GPS1-GPS11) but more uncertain due to shorter time series. Especially the pillar GPS12 (Pyrekari) is problematic as observed only in 10 campaigns. The estimated horizontal velocity components were statistically insignificant for all stations except GPS1 (0.28 ± 0.03 mm/a). The baseline GPS1–GPS11 crosses an old fracture zone locating in the direction of the Eurajoensalmi, which might be a reason for the deformation. On the other hand, the ONKALO excavations in the vicinity of the Olkiluoto permanent station (GPS1) may cause some movement. However, more measurements are needed to confirm the deformations. The standard deviations of the Kivetty baselines were very close to Olkiluoto results varying from 0.2 to 1.0 mm. One third of the change rates could be considered as

38
statistically significant (change rate larger than 3�), and the maximum change rate was 0.18 ± 0.03 mm/a for GPS3–GPS4. The horizontal velocities were of the same order of magnitude as in the Olkiluoto network. In the case of Romuvaara, the standard deviations of the baselines were larger compared to Olkiluoto results varying from 0.3 to 1.7 mm. The change rates were of the same order of magnitude than in Kivetty and Olkiluoto (less than 0.2 mm/a), but none of the change rates were statistically significant. However, we could estimate statistically significant horizontal velocities for the pillars GPS3, GPS4 and GPS7. The forest growing causes major problems at Kivetty and Romuvaara. The effect on the time series can be easily detected, especially in the up component, but also in the baseline lengths. For example the largest change rates at Kivetty are related to the pillar, which was noted as “forest blocking visibility up to even 40 degrees” during the field work. Thus the changes observed in the network probably present more the forest growing than any geophysical deformation. If those networks will be used in the future as references for Olkiluoto, the trees near the pillars must be cut off. After four control marker measurement campaigns we can estimate the reproducibility of our angle and distance measurements in micro networks. The standard deviations of horizontal angles, height differences and distances in our micro networks were 0.0028 gon, 0.0007 m and 0.0005 m respectively. Electronic distance measurements were performed at Olkiluoto at the baseline GPS7-GPS8 using the Mekometer since 2002. The measurements have been carried out simultaneously with GPS campaigns to improve the reliability of the GPS results. The new calibration values for the antenna (s/n 11963) of the pillar GPS8 were applied in GPS computation. According to nine years measurement GPS gives us on the average 1.3 mm longer distances between pillars GPS7 and GPS8 than EDM. The reason for the difference is unmodelled or dismodelled offsets in GPS observations and the scale difference between GPS and EDM. The trends of EDM and GPS distance time series are similar.
FGI we will continue geodetic observations at Olkiluoto, Kivetty and Romuvaara. The Olkiluoto network is under major modernization for permanent tracking during upcoming years. We aim to start the permanent tracking in four new stations and four old stations in autumn 2011. The old Olkiluoto local GPS network – including those pillars not yet tracking permanently – will be measured biannually as thus far, as well as the EDM baseline. We will also carry out measurements at Kivetty and Romuvaara every second year supposing the improvement of the visibility of the points of those networks.

39
9 ACKNOWLEDGEMENTS
The Department of Surveying, Aalto University is acknowledged for giving us access to their accurate electronic distance measurement device Kern Mekometer ME5000. We acknowledge all persons who have taken part to the field work at Olkiluoto, Kivetty and Romuvaara.

40

41
REFERENCES
Ahola, J., H. Koivula, M. Poutanen and J. Jokela (2007): GPS operations at Olkiluoto, Kivetty and Romuvaara in 2006. Working Report 2007-56. POSIVA Oy, Olkiluoto. 178 pages.
Ahola, J., H. Koivula, J. Jokela (2008): GPS operations at Olkiluoto, Kivetty and Romuvaara in 2007. Working Report 2008-35. POSIVA Oy, Olkiluoto. 189 pages.
Ahola, J., M. Ollikainen, H. Koivula and J. Jokela (2005): GPS operations at Olkiluoto, Kivetty and Romuvaara in 2004. Working Report 2005-41. POSIVA Oy, Olkiluoto. 288 pages.
Ahola, J., M. Ollikainen, H. Koivula and J. Jokela (2006): GPS operations at Olkiluoto, Kivetty and Romuvaara in 2005. Working Report 2006-63. POSIVA Oy, Olkiluoto. 172 pages.
Ahola, J. and M. Poutanen (2006): GPS-mittaukset Satakunnassa. GeoSatakunta 2005, Geologian tutkimuskeskus, Raportti P 34.4.043, Ed. Huhta, P., Espoo. Pages 8-16. (In Finnish)
Chen, R. and J. Kakkuri (1995): GPS Work at Olkiluoto for the Year of 1994. Work Report PATU-95-30e, Teollisuuden Voima Oy. Helsinki. 11 pages.
Chen, R. and J. Kakkuri (1996): GPS Operations at Olkiluoto, Kivetty, and Romuvaara in 1995. Work report PATU-96-07e. POSIVA Oy. Helsinki. 68 pages.
Chen, R. and J. Kakkuri (1997): GPS Operations at Olkiluoto, Kivetty, and Romuvaara for 1996. Work Report PATU-96-65e. POSIVA Oy. Helsinki. 139 pages.
Chen, R and J. Kakkuri (1998): GPS operations at Olkiluoto, Kivetty and Romuvaara for 1997. Working Report PATU-98-08e. POSIVA Oy. Helsinki. 266 pages.
Ciddor, Philip E.(1996): Refractive index of air: new equations for the visible and the near infrared, Applied Optics, Vol. 35, Issue 9, pp. 1566-1573 (1996).
Ciddor, Philip E., Hill, Reginald J.(1999): Refractive index of air. 2. Group index, Applied Optics, Vol. 38, Issue 9 (1999).
Dach. R.. U. Hugentobler. P. Fridez and M. Meindl, 2007. Bernese GPS Software. Version 5.0. Astronomical Institute. University of Bern.
Jokela, J. and P. Häkli (2006): Current research and development at the Nummela Standard Baseline. Conference proceedings. Shaping the Change, XXIII FIG Congress, Munich, Germany, October 8-13, 2006. 15 pages.
Kallio, U., Ahola, J., Koivula, H., Poutanen, M. (2009): GPS operations at Olkiluoto, Kivetty and Romuvaara in 2008. Working Report 2009-75. POSIVA Oy, Olkiluoto.

42
Kallio, U., Nyberg, S., Koivula, H., Jokela J., Poutanen, M. & Ahola, J. 2010. GPS Operations at Olkiluoto in 2009. Posiva Working Report 2010-39. POSIVA Oy, Olkiluoto. 35 pages.
Kallio, U. (2011): Geodeettisen laitoksen toimeksiantokohtainen laatusuunnitelma Posiva Oy:lle tehtävään kallioperän liikkeiden määrittämiseen geodeettisten mittausten avulla vuonna 2011. The Finnish Geodetic Institute. Kirkkonummi. (In Finnish)
Kallio, U., M. Poutanen, H. Koivula, P. Lehmuskoski, J. Jokela, J., Ruotsalainen H., Bilker-Koivula, M., Häkli, P. (2009): Olkiluodon geodeettisten mittausten kehittämissuunnitelma (In Finnish). Not published.
Koivula, H., M. Ollikainen and M. Poutanen (1999): The Finnish Permanent GPS Network – FinnRef. The XIII General Meeting of the Nordic Geodetic Commission, May 25.-29., 1998, Gävle, Sweden. LMV. Rapport 1999:12.
Lehmuskoski, P. (2004): Precise Levelling of the Olkiluoto GPS Network in 2003. Working Report 2004-07. POSIVA Oy, Olkiluoto. 125 pages.
Lehmuskoski, P. (2006): Precise Levelling of the Olkiluoto GPS Network in 2005. Working Report 2006-27. POSIVA Oy, Olkiluoto. 143 pages.
Lehmuskoski, P. (2008): Precise Levelling of the Olkiluoto GPS Network in 2007. Working Report 2008-19. POSIVA Oy, Olkiluoto.
Lehmuskoski, P. (2010): Levelling campaigns at Olkiluoto in 2008-2009. Posiva Working Report. Submitted.
Ollikainen, M. and J. Kakkuri (1999): GPS operations at Olkiluoto, Kivetty and Romuvaara for 1998. Working Report 99-31. Posiva Oy, Helsinki, 134 pages.
Ollikainen M. and J. Kakkuri (2000): GPS operations at Olkiluoto, Kivetty and Romu-vaara for 1999. Working Report 2000-18. POSIVA Oy, Helsinki. 151 pages.
Ollikainen M., H. Koivula and J. Kakkuri (2001): GPS operations at Olkiluoto, Kivetty and Romuvaara for 2000. Working Report 2001-16. POSIVA Oy, Helsinki. 35 pages.
Ollikainen, M., J. Ahola and H. Koivula (2002): GPS operations at Olkiluoto, Kivetty and Romuvaara for 2001. Working Report 2002-16. POSIVA Oy, Helsinki. 215 pages.
Ollikainen, M., J. Ahola and H. Koivula (2004): GPS operations at Olkiluoto, Kivetty and Romuvaara in 2002-2003. Working Report 2004-12. POSIVA Oy, Olkiluoto. 268 pages.
Poutanen M. and J. Ahola (2010): Maankuoren liiketutkimukset Satakunnassa GPS-mittausten avulla. (in Finnish) – coming to GSF publication series.
Poutanen, M., S. Nyberg and J. Ahola (2010): GPS measurements in Satakunta area. Posiva Working Report. Submitted.

43
Rüeger, J.M. (1996). Electronic Distance Measurement. An Introduction, Fourth Edition, Springer-Verlag Berlin Heidelberg New York 1996.

44

45
APPENDICES
Appendix 1. Baseline lengths at Olkiluoto inner network (deviation from mean in mm).
mean�(m) 1996.3 1996.8 1997.3 1997.8 1998.3 1998.8 1999.3 1999.8 2001.3 2001.7 2002.3 2002.8 2003.3 2003.8 2004.3
1 2 1355.862 0.0 1.1 0.1 0.5 �0.2 0.9 0.2 0.4 0.0 1.2 0.9 0.4 �0.6 �0.1 �0.6
3 1006.192 0.5 �0.2 0.0 0.2 1.4 0.1 0.0 0.4 0.2 0.3 0.3 �1.3 �0.2 0.2 �0.6
4 643.449 �0.3 �0.6 �0.4 �0.3 0.1 �0.7 �2.5 0.0 �0.2 �0.5 �0.4 1.0 0.0 0.2 0.4
5 1131.620 �0.2 0.8 0.1 0.7 �0.4 0.7 �0.9 0.4 �0.2 1.2 �0.5 0.3 �0.3 0.0 �0.4
6 1264.825 0.2 0.0 0.1 �0.2 �0.5 0.1 0.1 �0.3 0.1 0.2 0.6 0.0 0.2 0.3 0.4
7 1482.994 �0.9 �0.8 �0.1 �0.8 �0.6 �0.5 �0.1 �0.9 0.1 �0.6 0.0 0.0 0.0 0.2 0.8
8 1594.502 0.2 �0.9 �0.4 �0.7 �1.2 �0.7 �0.4 �0.9 �0.3 �0.5 0.1 0.3 �0.3 0.2 0.6
9 2343.597 0.3 �1.2 �0.7 �0.8 �1.2 �0.6 �0.3 �0.9 �0.1 �0.5 0.0 �0.2 �0.4 0.1 0.3
13 2407.027
2 3 1609.847 0.5 0.3 0.2 0.0 0.8 �0.2 �0.1 �0.3 1.0 1.1 1.0 0.2 �0.5 �0.2 0.1
4 1856.924 �0.4 0.5 �0.2 0.1 0.0 0.3 �2.2 0.1 0.0 1.1 0.9 1.3 �0.7 0.1 �0.1
5 1477.355 0.9 1.6 1.1 1.1 0.0 0.7 �0.6 0.2 �0.9 0.4 0.0 �1.1 �0.2 �0.1 �0.6
6 2436.724 0.1 0.9 0.3 0.3 �0.7 0.8 0.4 �0.1 0.0 0.6 1.2 �0.3 �0.3 �0.1 �0.2
7 2811.674 �1.0 0.3 �0.1 �0.4 �0.9 0.3 0.0 �0.5 0.0 0.5 0.7 0.3 �0.6 0.1 0.2
8 2949.497 0.2 0.3 �0.3 �0.2 �1.4 0.3 �0.3 �0.5 �0.2 0.7 1.0 0.7 �0.9 0.0 0.0
9 3649.886 0.1 �0.3 �0.7 �0.3 �1.5 0.1 �0.2 �0.5 �0.3 0.5 0.8 0.1 �0.9 0.1 �0.4
13 3597.908
3 4 756.324 �0.2 0.2 0.0 0.2 1.0 0.8 �0.3 0.2 �0.1 1.0 0.9 �1.3 �0.6 0.5 �0.8
5 2094.203 0.5 0.6 0.3 0.8 1.1 0.4 �1.0 0.5 0.0 1.3 �0.3 �1.1 �0.5 0.1 �0.7
6 2126.843 0.5 0.2 0.0 0.2 0.8 0.8 0.0 0.5 0.0 1.1 0.9 �1.0 �0.1 0.8 �0.5
7 2073.049 �0.4 �0.2 0.1 �0.2 0.6 0.9 0.4 0.0 0.3 0.3 0.7 �1.1 �0.4 0.2 �0.1
8 1924.579 0.4 0.2 0.0 0.0 �0.4 0.8 �0.1 �0.3 �0.4 0.3 0.5 �0.7 �0.7 0.1 �0.3
9 2914.436 0.7 �0.5 �0.5 �0.1 0.0 0.8 0.0 �0.1 0.1 0.4 0.3 �1.1 �0.8 0.2 �0.7
13 3159.423
4 5 1734.652 �0.6 0.2 �0.5 0.4 �0.4 0.0 �3.1 0.7 �0.4 0.8 �1.1 1.5 �0.2 0.1 �0.1
6 1418.664 0.4 0.0 �0.2 0.0 �0.4 0.0 �0.8 0.5 �0.2 0.2 �0.2 1.1 0.4 0.6 0.3
7 1317.485 �0.2 �0.4 0.2 �0.4 �0.3 0.1 0.8 �0.2 0.5 �0.7 �0.2 0.1 0.2 �0.2 0.6
8 1216.240 0.8 �0.1 0.1 �0.2 �1.2 �0.1 1.1 �0.6 �0.1 �0.5 �0.2 0.0 �0.1 �0.3 0.3
9 2165.878 1.0 �0.7 �0.5 �0.3 �0.9 �0.1 0.6 �0.4 0.2 �0.5 �0.5 �0.1 �0.3 �0.2 0.0
13 2406.326
5 6 1284.566 �1.2 �0.4 �0.7 �0.2 �1.1 0.2 0.3 �0.2 0.5 0.3 0.2 0.2 �0.2 �0.3 0.0
7 1894.753 �2.2 �0.8 �1.3 �0.7 �1.5 �0.4 �0.7 �0.1 �0.2 0.6 �0.7 1.1 �0.4 0.4 0.2
8 2256.071 �1.0 �0.9 �1.4 �0.5 �1.6 �0.1 �0.9 0.1 �0.4 0.8 �0.3 1.3 �0.6 0.5 0.0
9 2571.612 �1.4 �1.7 �2.0 �0.9 �2.1 �0.6 �0.6 �0.1 �0.3 0.5 �0.2 1.1 �0.6 0.5 0.0
13 2326.729
6 7 683.010 �0.9 �0.4 �0.8 �0.6 �0.6 �0.6 �1.0 0.3 �0.9 0.6 �0.7 1.2 0.0 1.2 0.0
8 1157.815 �0.1 �0.9 �1.1 �0.6 �0.6 �0.3 �0.8 0.6 �0.8 0.7 0.0 1.4 0.0 1.4 0.1
9 1290.280 �0.2 �1.3 �1.2 �0.7 �1.0 �0.7 �0.9 0.0 �0.8 0.1 �0.4 0.8 �0.4 0.7 �0.1
13 1166.024
7 8 511.257 0.3 �0.7 �0.3 �0.2 0.3 0.3 0.5 0.4 0.3 0.0 0.7 0.2 �0.1 0.2 0.1
9 868.576 1.2 �0.4 �0.7 0.0 �0.6 �0.2 �0.3 �0.1 �0.2 0.1 �0.1 �0.1 �0.4 0.0 �0.6
13 1126.413
8 9 1057.916 0.4 �0.7 �0.7 �0.2 0.3 0.2 0.2 0.2 0.4 0.0 �0.2 �0.1 �0.3 0.2 �0.4
13 1520.689
9 13 665.040

46
Appendix 1. Baseline lengths at Olkiluoto inner network (deviation from mean in mm) (Cont.)
mean�(m) 2004.8 2005.3 2005.8 2006.3 2006.8 2007.3 2007.8 2008.3 2008.8 2009.4 2009.8 2010.3 2010.9 rms
1 2 1355.862 0.5 �0.5 0.1 �1.3 0.5 �1.0 �0.3 �1.0 �0.7 �0.6 0.2 �0.5 �1.2 0.7
3 1006.192 0.3 �0.7 �0.4 �0.9 0.1 0.1 �0.4 0.3 0.1 0.3 �0.1 0.6 0.0 0.5
4 643.449 �0.7 0.0 �0.1 0.6 �0.4 0.7 0.3 1.4 0.5 0.6 1.1 0.7 0.5 0.8
5 1131.620 1.3 �0.9 1.1 �1.0 0.2 �1.0 0.5 �1.3 �0.5 �0.4 0.6 0.2 0.1 0.7
6 1264.825 0.1 0.1 �0.1 �0.3 �0.4 0.1 �0.2 �0.5 0.0 �0.2 �0.2 0.0 �0.2 0.3
7 1482.994 0.3 0.8 0.3 0.8 0.1 0.7 �0.1 �0.2 0.5 0.3 0.6 0.9 0.7 0.5
8 1594.502 0.1 0.5 0.3 1.4 �0.1 0.5 0.0 0.0 0.6 0.4 1.1 1.3 0.8 0.6
9 2343.597 0.6 0.3 0.5 1.4 0.4 0.4 0.5 0.1 0.8 0.1 1.1 1.0 0.9 0.7
13 2407.027 0.0 0.0 �0.1 0.2 0.1 0.1 �0.3 0.2 �0.3 0.2 0.3 0.3 0.2
2 3 1609.847 1.2 �0.4 �0.1 �0.5 �0.4 �0.6 �1.3 �0.9 �1.0 �0.3 0.6 0.1 �1.0 0.7
4 1856.924 0.1 �0.3 0.2 �0.5 0.2 �0.4 �0.2 �0.5 �0.4 �0.1 1.1 0.2 �0.7 0.7
5 1477.355 0.3 �0.8 0.4 �1.9 0.7 �0.7 0.3 �0.4 �0.1 �0.5 0.3 �0.4 �0.1 0.8
6 2436.724 0.1 �0.4 �0.4 �1.3 0.2 �0.3 �0.3 �0.2 �0.2 �0.4 0.2 0.1 �0.8 0.5
7 2811.674 0.7 0.2 0.3 �0.4 0.7 �0.1 �0.3 �0.8 0.0 �0.2 0.9 0.6 �0.2 0.5
8 2949.497 0.7 0.0 0.4 0.2 0.4 �0.5 �0.4 �1.0 �0.1 �0.3 1.2 0.8 �0.4 0.6
9 3649.886 1.0 �0.2 0.4 0.1 1.0 �0.3 0.4 �0.5 0.4 �0.4 1.4 0.8 0.1 0.6
13 3597.908 �0.3 0.1 �1.1 1.1 �0.3 0.3 �0.3 0.2 �0.5 0.8 0.4 0.1 0.6
3 4 756.324 0.2 �0.4 0.1 �1.1 0.9 �0.1 0.1 �1.0 0.1 0.1 �0.4 0.3 �0.1 0.6
5 2094.203 1.5 �1.4 0.7 �1.7 0.2 �0.7 �0.1 �0.8 �0.2 0.0 0.7 0.8 0.3 0.8
6 2126.843 0.5 �0.8 �0.1 �1.6 0.0 �0.1 �0.3 �0.9 �0.1 �0.2 �0.7 0.1 �0.5 0.7
7 2073.049 0.4 �0.1 0.1 �0.6 0.4 �0.1 �0.2 �0.8 0.1 0.0 �0.6 0.6 �0.2 0.5
8 1924.579 0.0 �0.2 0.1 0.4 0.5 �0.2 0.1 �0.3 0.3 0.0 �0.2 0.7 0.1 0.4
9 2914.436 0.6 �0.6 0.4 0.0 0.8 �0.3 0.4 �0.3 0.6 �0.1 0.0 0.6 0.2 0.5
13 3159.423 �0.5 0.2 �1.1 0.9 0.0 0.3 �0.2 0.4 0.0 �0.1 0.6 0.1 0.5
4 5 1734.652 0.6 �1.0 0.9 �0.4 �0.2 �0.3 0.7 0.3 0.0 0.2 1.7 1.0 0.6 0.9
6 1418.664 0.1 �0.3 0.0 �0.5 �0.8 0.0 �0.1 0.1 �0.1 �0.2 0.1 �0.3 �0.5 0.4
7 1317.485 0.3 0.3 0.0 0.5 �0.4 0.0 �0.4 0.2 0.0 �0.1 �0.2 0.2 �0.1 0.4
8 1216.240 0.3 0.3 0.0 1.2 �0.3 �0.1 �0.3 0.1 0.1 �0.2 0.1 0.5 0.2 0.5
9 2165.878 0.6 �0.1 0.2 1.0 �0.1 �0.1 0.2 0.5 0.4 �0.2 0.4 0.3 0.2 0.5
13 2406.326 �0.3 0.0 �0.2 �0.2 0.0 0.0 0.6 0.1 �0.3 0.2 0.0 �0.1 0.3
5 6 1284.566 0.2 �0.2 �0.2 0.2 �0.1 0.2 0.1 0.7 0.3 0.3 0.8 1.4 0.5 0.5
7 1894.753 1.1 0.0 0.9 0.5 0.6 0.5 0.5 �0.4 0.6 0.4 1.8 1.7 1.4 0.9
8 2256.071 1.2 �0.3 1.2 0.5 0.2 �0.1 0.5 �0.9 0.4 0.3 2.1 2.0 1.0 0.9
9 2571.612 1.4 �0.1 0.8 1.3 0.7 0.5 1.0 �0.2 0.9 0.2 2.0 2.0 1.5 1.1
13 2326.729 �0.4 �0.3 0.0 0.2 0.0 0.3 �0.3 0.2 �0.3 0.7 1.0 0.7 0.3
6 7 683.010 0.8 0.2 0.9 �0.1 0.5 0.4 0.4 �1.2 0.3 0.0 0.9 0.1 0.7 0.7
8 1157.815 1.0 �0.1 1.2 �0.3 0.1 0.0 0.3 �1.8 0.1 �0.1 1.0 0.3 0.2 0.8
9 1290.280 1.1 0.1 0.9 1.1 0.9 0.2 0.9 �0.8 0.6 �0.2 1.2 0.6 1.0 0.8
13 1166.024 �0.2 0.1 0.0 0.6 �0.3 0.3 �0.3 0.0 �0.4 0.3 0.0 0.5 0.3
7 8 511.257 0.3 �0.1 0.4 �0.3 �0.4 �0.4 �0.2 �0.9 �0.2 �0.1 0.1 0.2 �0.5 0.4
9 868.576 0.3 �0.5 0.2 0.5 0.3 �0.2 0.6 0.4 0.4 �0.2 0.6 0.1 0.3 0.4
13 1126.413 �0.5 0.0 �0.7 0.3 0.0 0.3 0.2 0.2 �0.2 0.4 �0.2 0.0 0.4
8 9 1057.916 0.5 �0.4 0.6 �0.4 0.1 �0.2 0.2 �0.2 0.3 0.0 0.4 0.0 �0.1 0.4
13 1520.689 �0.2 0.7 �1.1 0.1 0.1 0.1 �0.5 0.2 0.0 0.7 0.1 �0.2 0.5
9 13 665.040 0.0 0.1 �0.2 0.0 0.3 0.0 �0.4 0.0 �0.2 0.5 0.2 �0.2 0.3

47
Appendix 2. Baseline lengths at Olkiluoto outer network (deviation from mean in mm).
mean�(m) 2003.8 2004.3 2004.8 2005.3 2005.8 2005.8 2006.1 2006.3 2006.4 2006.8 2006.8 2007.1 2007.3
1 11 8478.270 1.8 1.3 1.2 1.2 �0.3 0.2 �0.5 0.2 1.2 0.4 �0.3 �0.3 �0.2
12 4817.828 0.5 0.9 �0.4 �0.6 �0.2
14 7852.376 �0.1 �0.9 0.4 �0.3 0.1 �0.1 �0.2 �0.5
15 5704.054 0.0 �1.2 0.3 �1.2 0.5 �0.1 �0.4 �0.3
11 12 11574.241 1.2 1.1 0.7 �0.5 �0.3
14 6005.974 �0.8 �0.6 �0.4 �0.8 0.1 0.1 �0.6 0.5
15 9358.364 0.0 �0.6 �0.3 �0.2 0.9 0.1 0.3 0.6
12 14 12512.520 �0.2
15 10387.696 0.4
14 15 4762.658 0.2 �0.1 �0.1 0.1 0.3 0.0 0.8 �0.1
mean�(m) 2007.4 2007.8 2007.8 2008.1 2008.3 2008.4 2008.8 2008.8 2009.4 2009.8 2010.3 2010.9 rms
1 11 8478.270 1.0 0.5 �0.5 �0.5 �1.0 �0.5 0.0 0.0 0.1 �1.9 �1.5 �1.8 1.0
12 4817.828 �1.0 0.1 �0.2 0.9 0.7
14 7852.376 1.4 1.2 0.8 0.0 �0.8 �0.3 0.7 1.0 0.6 0.2 �1.8 �1.5 0.8
15 5704.054 1.1 0.6 0.4 �0.4 0.2 0.3 1.0 0.1 0.4 0.3 �1.0 �0.7 0.7
11 12 11574.241 �0.3 �1.0 �0.6 �0.4 0.8
14 6005.974 0.8 0.8 0.2 �0.7 �0.5 0.0 �0.2 0.2 1.0 0.2 �0.3 0.9 0.6
15 9358.364 0.3 �0.1 �0.2 �0.3 0.4 �0.4 0.3 �0.6 0.4 �0.3 �0.2 0.0 0.4
12 14 12512.520 0.3 �0.7 0.6 0.0 0.5
15 10387.696 �0.2 0.3 �0.3 �0.1 0.3
14 15 4762.658 �0.4 �0.4 0.2 0.5 0.4 �0.8 0.3 �0.2 �0.3 0.4 �0.2 �0.8 0.4

48
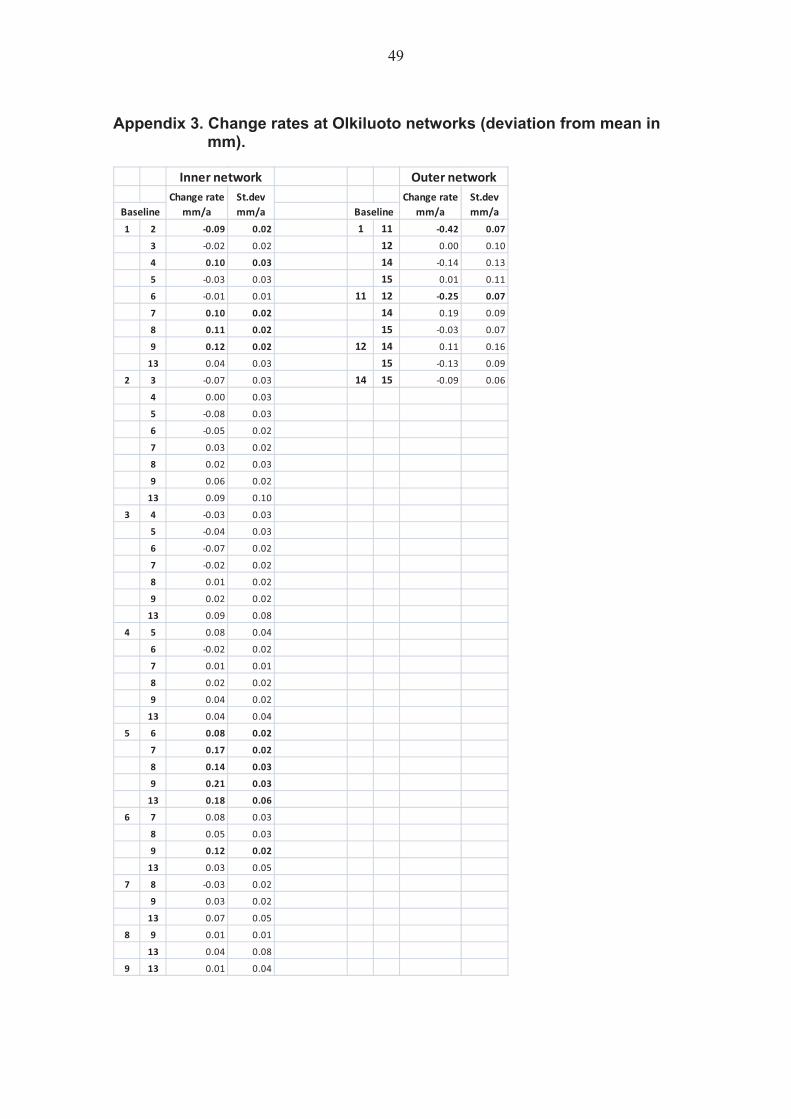
49
Appendix 3. Change rates at Olkiluoto networks (deviation from mean in mm).
1 2 �0.09 0.02 1 11 �0.42 0.07
3 �0.02 0.02 12 0.00 0.10
4 0.10 0.03 14 �0.14 0.13
5 �0.03 0.03 15 0.01 0.11
6 �0.01 0.01 11 12 �0.25 0.07
7 0.10 0.02 14 0.19 0.09
8 0.11 0.02 15 �0.03 0.07
9 0.12 0.02 12 14 0.11 0.16
13 0.04 0.03 15 �0.13 0.09
2 3 �0.07 0.03 14 15 �0.09 0.06
4 0.00 0.03
5 �0.08 0.03
6 �0.05 0.02
7 0.03 0.02
8 0.02 0.03
9 0.06 0.02
13 0.09 0.10
3 4 �0.03 0.03
5 �0.04 0.03
6 �0.07 0.02
7 �0.02 0.02
8 0.01 0.02
9 0.02 0.02
13 0.09 0.08
4 5 0.08 0.04
6 �0.02 0.02
7 0.01 0.01
8 0.02 0.02
9 0.04 0.02
13 0.04 0.04
5 6 0.08 0.02
7 0.17 0.02
8 0.14 0.03
9 0.21 0.03
13 0.18 0.06
6 7 0.08 0.03
8 0.05 0.03
9 0.12 0.02
13 0.03 0.05
7 8 �0.03 0.02
9 0.03 0.02
13 0.07 0.05
8 9 0.01 0.01
13 0.04 0.08
9 13 0.01 0.04
Inner�network Outer�network
BaselineSt.dev�mm/a
Change�rate�mm/aBaseline
Change�rate�mm/a
St.dev�mm/a

50

A
ppen
dix
4. B
asel
ine
leng
ths
at K
ivet
ty (d
evia
tion
from
mea
n in
mm
).
mea
n�(m
)19
96.4
1996
.819
97.4
1997
.819
98.4
1998
.819
99.3
1999
.820
01.4
2001
.820
02.7
2003
.720
04.7
2005
.720
06.7
2007
.720
08.7
2010
.7rm
s
12
659.
084
0.1
�0.2
0.6
�0.5
0.4
0.1
0.2
0.6
0.0
�0.2
0.7
0.5
0.4
0.2
�0.6
�1.0
�0.6
�1.0
0.5
316
13.4
870.
4�0
.10.
8�0
.70.
2�0
.10.
31.
10.
0�0
.10.
40.
10.
30.
3�0
.6�0
.8�1
.0�0
.60.
6
415
91.0
98�0
.1�0
.5�0
.1�0
.9�0
.4�0
.50.
20.
3�0
.9�0
.2�0
.60.
1�0
.30.
70.
30.
10.
82.
10.
7
567
2.04
70.
0�0
.2�0
.40.
2�0
.5�0
.1�0
.2�0
.1�0
.2�0
.1�0
.60.
0�1
.00.
20.
30.
40.
81.
50.
5
611
80.5
89�0
.9�0
.9�0
.7�0
.2�1
.0�0
.3�0
.20.
3�0
.4�0
.5�0
.2�0
.1�0
.10.
50.
50.
90.
82.
50.
9
773
5.56
2�0
.2�0
.10.
7�0
.20.
3�0
.10.
90.
40.
70.
6�0
.70.
80.
60.
3�0
.5�0
.5�1
.0�2
.00.
8
23
955.
940
0.2
0.1
0.2
�0.2
�0.2
�0.3
0.1
0.4
0.0
0.0
�0.2
�0.3
�0.1
0.1
0.0
0.2
�0.3
0.4
0.2
411
98.8
85�1
.7�0
.9�0
.2�0
.9�0
.7�0
.40.
2�0
.1�1
.00.
4�0
.80.
30.
01.
01.
00.
90.
92.
00.
9
511
67.2
82�0
.8�0
.30.
5�0
.10.
00.
30.
21.
00.
00.
30.
30.
60.
00.
5�0
.3�0
.6�0
.6�0
.90.
5
618
29.8
10�0
.9�0
.80.
1�0
.4�0
.40.
10.
01.
2�0
.3�0
.40.
60.
40.
50.
8�0
.1�0
.3�0
.40.
30.
6
790
1.31
81.
00.
10.
4�0
.50.
30.
10.
70.
00.
40.
0�0
.80.
2�0
.30.
1�0
.4�0
.3�0
.4�0
.60.
5
34
1102
.333
�0.4
�1.4
�0.2
�1.2
�1.2
�0.4
0.0
�1.3
�0.7
0.3
�0.8
1.0
0.1
1.8
1.0
1.6
0.8
1.1
1.0
520
31.1
150.
1�0
.20.
6�0
.4�0
.2�0
.10.
21.
10.
10.
20.
10.
30.
00.
8�0
.5�0
.3�1
.0�0
.80.
5
627
70.0
66�0
.4�0
.70.
3�0
.7�0
.5�0
.20.
11.
4�0
.3�0
.40.
40.
10.
41.
0�0
.20.
0�0
.70.
50.
6
716
93.3
980.
10.
20.
8�0
.70.
50.
20.
70.
80.
00.
0�0
.5�0
.4�0
.4�0
.1�0
.2�0
.2�0
.70.
10.
5
45
1608
.742
�0.2
0.0
0.2
�0.4
�0.1
�0.3
0.2
1.2
�0.2
0.2
�0.2
0.0
0.1
0.5
�0.4
�0.4
�0.3
0.2
0.4
624
62.3
89�0
.5�0
.30.
0�0
.4�0
.3�0
.40.
31.
4�0
.5�0
.10.
10.
10.
40.
60.
0�0
.5�0
.30.
60.
5
720
89.3
27�0
.5�0
.80.
2�1
.3�0
.5�0
.40.
9�0
.1�0
.50.
3�1
.80.
5�0
.31.
00.
50.
70.
51.
50.
8
56
854.
746
�0.2
�0.4
�0.3
0.0
�0.4
�0.2
0.1
0.3
�0.2
�0.3
0.2
0.0
0.2
0.0
0.4
�0.1
0.1
0.8
0.3
713
79.3
840.
0�0
.30.
30.
0�0
.3�0
.20.
70.
50.
50.
4�1
.20.
9�0
.40.
4�0
.3�0
.2�0
.4�0
.50.
5
67
1604
.963
�0.7
�1.3
�0.2
�0.3
�1.1
�0.5
0.1
0.9
�0.2
�0.4
�0.5
0.7
0.4
1.1
�0.2
0.5
0.1
1.6
0.8
51

52

App
endi
x 5.
Bas
elin
e le
ngth
s at
Rom
uvaa
ra (d
evia
tion
from
mea
n in
mm
).
mea
n�(m
)19
96.4
1996
.819
97.4
1997
.819
98.4
1998
.819
99.3
1999
.820
01.4
2001
.820
02.7
2003
.720
04.7
2005
.720
06.7
2007
.720
08.7
2010
.7rm
s
12
1176
.418
0.3
�0.1
3.3
�0.4
�0.5
�0.8
�0.2
0.5
0.1
�0.2
2.2
�1.0
�0.4
�1.1
0.0
�1.2
�1.3
1.0
1.2
354
1.20
52.
30.
10.
7�0
.50.
4�0
.50.
5�0
.10.
4�0
.20.
8�0
.9�0
.20.
1�0
.1�1
.2�0
.4�1
.20.
8
473
1.89
6�2
.70.
2�1
.00.
0�2
.50.
1�0
.30.
60.
61.
01.
10.
40.
70.
30.
70.
20.
50.
11.
1
561
4.73
50.
4�0
.20.
1�0
.6�0
.1�0
.10.
3�0
.10.
30.
50.
3�0
.1�0
.20.
0�0
.10.
00.
0�0
.30.
3
667
8.19
6�0
.40.
6�0
.10.
2�0
.50.
1�1
.00.
6�0
.50.
01.
20.
1�0
.3�1
.0�0
.10.
00.
21.
00.
6
712
22.3
88�0
.50.
6�0
.2�0
.4�0
.90.
40.
00.
80.
20.
61.
20.
40.
0�0
.70.
0�0
.6�0
.4�0
.40.
6
23
783.
976
�1.2
�1.0
2.4
�0.3
�0.7
�0.4
�0.5
0.2
�0.3
�0.2
0.8
0.0
�0.6
�1.3
0.2
0.2
�0.4
3.0
1.1
469
2.37
5�0
.70.
62.
50.
0�1
.6�1
.5�0
.40.
3�0
.20.
12.
0�0
.50.
0�0
.70.
3�0
.8�1
.01.
71.
1
513
97.2
230.
30.
02.
5�0
.3�0
.7�0
.7�0
.70.
5�0
.5�0
.11.
3�0
.6�0
.3�1
.1�0
.1�0
.3�0
.81.
70.
9
616
86.6
810.
60.
53.
8�0
.4�0
.5�1
.9�1
.00.
80.
0�0
.63.
7�1
.3�1
.1�2
.4�0
.2�1
.4�1
.12.
41.
7
719
40.4
14�0
.10.
52.
8�1
.3�1
.5�0
.50.
31.
00.
90.
24.
4�0
.7�0
.8�1
.8�0
.2�2
.1�1
.50.
41.
6
34
717.
507
�2.7
�0.1
�1.0
0.0
�3.0
�0.7
�0.2
0.2
0.5
0.9
0.8
0.8
0.7
0.4
0.9
0.4
0.9
1.2
1.2
561
6.53
61.
31.
00.
10.
0�0
.1�0
.2�0
.20.
3�0
.20.
20.
6�0
.60.
20.
2�0
.4�0
.4�0
.5�1
.30.
6
612
04.8
052.
10.
70.
9�0
.10.
2�0
.5�0
.40.
50.
0�0
.42.
0�0
.9�0
.6�1
.2�0
.3�1
.4�0
.3�0
.30.
9
716
79.3
011.
60.
40.
6�0
.9�0
.40.
00.
80.
70.
80.
32.
1�0
.3�0
.4�0
.9�0
.3�1
.9�0
.8�1
.51.
0
45
1225
.012
�2.9
0.4
�1.3
�0.2
�3.3
�0.4
�0.5
0.5
0.4
1.4
1.1
0.7
0.9
0.5
0.8
0.8
0.7
0.4
1.3
610
45.3
09�0
.10.
30.
5�0
.4�0
.4�0
.8�0
.70.
50.
6�0
.12.
0�0
.5�0
.6�1
.3�0
.1�0
.30.
40.
90.
8
712
48.3
620.
7�0
.10.
4�1
.30.
21.
00.
60.
71.
10.
02.
3�0
.2�0
.8�1
.2�0
.5�1
.3�0
.6�1
.31.
0
56
1188
.023
�0.1
0.3
�0.3
�0.2
�0.5
1.0
�0.4
0.6
0.0
0.6
1.3
0.0
�0.4
�0.8
0.0
�0.4
�0.1
�0.6
0.6
717
95.9
400.
20.
40.
0�0
.7�0
.80.
40.
40.
80.
61.
01.
30.
1�0
.2�0
.6�0
.1�0
.9�0
.6�1
.30.
7
67
636.
487
0.6
0.2
0.6
�0.3
0.1
�1.1
0.6
0.2
0.5
0.2
�0.1
�0.1
0.1
�0.2
0.0
�0.6
�0.5
�0.2
0.5
53

54

55
Appendix 6. Baseline lengths at Romuvaara (deviation from mean in mm).
1 2 �0.06 0.03 1 2 �0.07 0.06
3 �0.07 0.03 3 �0.11 0.04
4 0.11 0.03 4 0.12 0.05
5 0.07 0.02 5 �0.01 0.02
6 0.17 0.03 6 0.02 0.03
7 �0.10 0.04 7 �0.02 0.03
2 3 0.00 0.01 2 3 0.08 0.06
4 0.18 0.03 4 0.01 0.06
5 �0.04 0.03 5 �0.01 0.05
6 0.04 0.03 6 �0.06 0.10
7 �0.06 0.02 7 �0.10 0.09
3 4 0.18 0.03 3 4 0.18 0.05
5 �0.05 0.03 5 �0.09 0.03
6 0.03 0.03 6 �0.11 0.05
7 �0.05 0.02 7 �0.14 0.05
4 5 �0.01 0.02 4 5 0.17 0.06
6 0.03 0.03 6 0.02 0.04
7 0.11 0.04 7 �0.11 0.05
5 6 0.05 0.01 5 6 �0.03 0.03
7 �0.03 0.03 7 �0.07 0.04
6 7 0.12 0.03 6 7 �0.04 0.02
Baseline Baseline
Kivetty RomuvaaraChange�rate�
mm/aSt.dev�mm/a
Change�rate�mm/a
St.dev�mm/a

56

57
Appendix 7. Angles and distances in micro networks
Horizontal angles (gon) Horizontal distances (m) Height differences (m)
GPS1 B-A-O O-B-A A-O-B AB AO BO AB AO BO
2001 53.4844 45.6793 100.8363 15.6687 10.3035 11.6700 0.3066 2.3927 2.0860
2004 53.4827 45.6747 100.8427 15.6665 10.3012 11.6680 0.3061 2.3911 2.0850
2007 53.4813 45.6803 100.8384 15.6677 10.3030 11.6687 0.3066 2.3915 2.0850
2010 53.4837 45.6763 100.8400 15.6673 10.3020 11.6688 0.3059 2.3920 2.0860
GPS2 B-A-O O-B-A A-O-B AB AO BO AB AO BO
2001 33.4122 43.4959 123.0919 13.6919 9.2453 7.3391 0.0419 2.3929 2.3511
2004 33.4167 43.4951 123.0882 13.6921 9.2451 7.3389 0.0418 2.3938 2.3519
2007 33.4131 43.4945 123.0924 13.6930 9.2458 7.3389 0.0421 2.3943 2.3521
2010 33.4159 43.4989 123.0852 13.6926 9.2460 7.3389 0.0421 2.3949 2.3528
GPS3 O-A-B A-B-O B-O-A AB AO BO AB AO BO
2001 50.9262 48.0784 100.9954 11.3571 7.7856 8.1476 0.0742 2.5303 2.4561
2004 50.9335 48.0838 100.9827 11.3573 7.7864 8.1487 0.0741 2.5309 2.4568
2007 50.9344 48.0805 100.9850 11.3587 7.7870 8.1498 0.0744 2.5304 2.4561
2010 50.9286 48.0833 100.9881 11.3585 7.7872 8.1490 0.0747 2.5336 2.4589
GPS4 O-A-B A-B-O B-O-A AB AO BO AB AO BO
2001 56.3290 50.2602 93.4108 16.0043 11.4241 12.4507 0.0532 2.5565 2.5033
2004 56.3336 50.2596 93.4068 16.0035 11.4234 12.4509 0.0532 2.5543 2.5011
2010 56.3256 50.2586 93.4158 16.0052 11.4243 12.4508 0.0528 2.5564 2.5037
GPS5 B-A-O O-B-A A-O-B AB AO BO AB AO BO
2001 56.9263 41.3195 101.7542 9.3593 5.6591 7.3002 0.3628 2.4143 2.0516
2004 56.9277 41.3187 101.7536 9.3592 5.6590 7.3003 0.3622 2.4149 2.0527
2007 56.9316 41.3207 101.7477 9.3592 5.6592 7.3007 0.3613 2.4129 2.0516
2010 56.9297 41.3245 101.7458 9.3600 5.6601 7.3011 0.3619 2.4142 2.0523
GPS6 O-A-B A-B-O B-O-A AB AO BO AB AO BO
2001 51.1871 67.1139 81.6990 8.7256 7.9117 6.5528 -0.1988 2.2850 2.4838
2004 51.1906 67.1054 81.7040 8.7263 7.9116 6.5535 -0.1981 2.2852 2.4833
2007 51.1860 67.1066 81.7074 8.7269 7.9120 6.5534 -0.1987 2.2849 2.4836
2010 51.1832 67.1044 81.7124 8.7274 7.9122 6.5534 -0.1979 2.2852 2.4831
GPS7 B-A-O O-B-A A-O-B AB AO BO AB AO BO
2001 48.5237 45.4266 106.0498 12.2981 8.0859 8.5306 0.0778 2.3305 2.2527
2004 48.5254 45.4286 106.0460 12.2990 8.0868 8.5314 0.0776 2.3309 2.2533
2007 48.5292 45.4246 106.0462 12.2993 8.0864 8.5321 0.0763 2.3290 2.2527
2010 48.5262 45.4275 106.0463 12.2997 8.0871 8.5320 0.0775 2.3309 2.2535
GPS8 B-A-O O-B-A A-O-B AB AO BO AB AO BO
2001 73.1242 56.6369 70.2389 5.1466 4.4787 5.2590 0.4228 2.4488 2.0260
2004 73.1372 56.6356 70.2273 5.1468 4.4792 5.2602 0.4237 2.4497 2.0260
2007 73.1293 56.6348 70.2359 5.1472 4.4792 5.2600 0.4234 2.4487 2.0253
2010 73.1304 56.6367 70.2329 5.1477 4.4799 5.2606 0.4231 2.4495 2.0264
O-A-B A-B-O B-O-A AB AO BO AB AO BO
2001 46.5295 52.7909 100.6796 13.7468 10.1377 9.1769 -0.5238 2.5693 3.0931
2004 46.5290 52.7967 100.6743 13.7472 10.1388 9.1771 -0.5241 2.5702 3.0943
2007 46.5302 52.7946 100.6752 13.7477 10.1389 9.1776 -0.5237 2.5695 3.0932
2010 46.5277 52.7957 100.6765 13.7480 10.1393 9.1774 -0.5254 2.5713 3.0966

58
GPS11 B-A-O O-B-A A-O-B AB AO BO AB AO BO
2004 44.3346 52.0592 103.6062 9.4356 6.8953 6.0623 -0.2113 1.4094 1.6207
2007 44.3334 52.0689 103.5977 9.4365 6.8969 6.0627 -0.2120 1.4088 1.6208
2010 44.3317 52.0581 103.6102 9.4365 6.8959 6.0626 -0.2136 1.4072 1.6208
GPS13 O-A-B A-B-O B-O-A AB AO BO AB AO BO
2004 59.5102 48.7897 91.7000 12.1333 8.4869 9.8445 -0.3243 1.2715 1.5958
2007 59.5068 48.7933 91.6999 12.1340 8.4879 9.8446 -0.3239 1.2705 1.5944
2010 59.5109 48.7930 91.6962 12.1344 8.4882 9.8455 -0.3238 1.2721 1.5959
GPS15 O-A-B A-B-O B-O-A AB AO BO AB AO BO
2007 50.5948 53.9914 95.4138 10.6066 7.9759 7.5894 -0.5210 1.1806 1.7016
2010 50.5913 53.9913 95.4173 10.6071 7.9762 7.5894 -0.5205 1.1825 1.7030