grade 8: unit test a (the number system) - pearson...
TRANSCRIPT

digitsmath.com 1
Grade 8 Common Core State Standardsfor Unit Assessments
Item Number
Topic Lesson
Common Core State Standard Description
1 1.1 8.NS.1Express rational numbers using decimal expansions that terminate in 0s or eventually repeat.
2 1.2 8.NS.1Apply and extend understanding of rational numbers and decimal expansions to describe the characteristics of irrational numbers.
3 1.3 8.NS.2 Estimate the value of irrational numbers.
4 1.4 8.NS.2Use rational approximations of irrational numbers to compare the size of irrational numbers and locate them approximately on a number line diagram.
5 1.5 8.NS.1Apply and extend understanding of rational numbers and decimal expansions to describe the characteristics of irrational numbers.
6 1.1 8.NS.1Express rational numbers using decimal expansions that terminate in 0s or eventually repeat.
7 1.1 8.NS.1Express rational numbers using decimal expansions that terminate in 0s or eventually repeat.
8 1.1 8.NS.1Express rational numbers using decimal expansions that terminate in 0s or eventually repeat.
9 1.2 8.NS.1Apply and extend understanding of rational numbers and decimal expansions to describe the characteristics of irrational numbers.
10 1.2 8.NS.1Apply and extend understanding of rational numbers and decimal expansions to describe the characteristics of irrational numbers.
11 1.2 8.NS.1Apply and extend understanding of rational numbers and decimal expansions to describe the characteristics of irrational numbers.
12 1.2 8.NS.1Apply and extend understanding of rational numbers and decimal expansions to describe the characteristics of irrational numbers.
13 1.2 8.NS.1Apply and extend understanding of rational numbers and decimal expansions to describe the characteristics of irrational numbers.
14 1.3 8.NS.2 Estimate the value of irrational numbers.
15 1.3 8.NS.2 Estimate the value of irrational numbers.
16 1.3 8.NS.2 Estimate the value of irrational numbers.
17 1.3 8.NS.2 Estimate the value of irrational numbers.
18 1.4 8.NS.2Use rational approximations of irrational numbers to compare the size of irrational numbers and locate them approximately on a number line diagram.
Grade 8: Unit Test A (The Number System)

digits Grade 8 Common Core Standards for Unit Assessments
digitsmath.com 2
Item Number
Topic Lesson
Common Core State Standard Description
19 1.4 8.NS.2Use rational approximations of irrational numbers to compare the size of irrational numbers and locate them approximately on a number line diagram.
20 1.4 8.NS.2Use rational approximations of irrational numbers to compare the size of irrational numbers and locate them approximately on a number line diagram.
21 1.4 8.NS.2Use rational approximations of irrational numbers to compare the size of irrational numbers and locate them approximately on a number line diagram.
22 1.5 8.NS.1 Estimate the value of irrational numbers.
23 1.5 8.NS.1 Estimate the value of irrational numbers.
24 1.5 8.NS.1Convert a decimal expansion which repeats eventually into a rational number.
25 1.1 8.NS.1Express rational numbers using decimal expansions that terminate in 0s or eventually repeat.
26 1.4 8.NS.2Use rational approximations of irrational numbers to compare the size of irrational numbers and locate them approximately on a number line diagram.
27 1.3 8.NS.1 Estimate the value of irrational numbers.
28 1.5 8.NS.1Apply and extend understanding of rational numbers and decimal expansions to describe the characteristics of irrational numbers.
29 1.4 8.NS.2Use rational approximations of irrational numbers to compare the size of irrational numbers and locate them approximately on a number line diagram.
30 1.1 8.NS.1Express rational numbers using decimal expansions that terminate in 0s or eventually repeat.
Grade 8: Unit Test A (continued)

digits Grade 8 Common Core Standards for Unit Assessments
digitsmath.com 3
Item Number
Topic Lesson
Common Core State Standard Description
1 2.1 8.EE.7b Solve two-step linear equations with rational number coefficients.
2 2.2 8.EE.7b Solve linear equations in one variable.
3 2.3 8.EE.7bSolve linear equations with rational number coefficients, including equations whose solutions require expanding expressions using the distributive property and collecting like terms.
4 2.4 8.EE.7aTransform linear equations in one variable into simpler forms until an equivalent equation with one solution (x = a), infinitely many solutions (a = a), or no solution (a = b) results.
5 2.5 8.EE.7aTransform linear equations in one variable into simpler forms until an equivalent equation with one solution (x = a), infinitely many solutions (a = a), or no solution (a = b) results.
6 3.1 8.EE.2Use square root and cube root symbols to represent solutions to equations of the form x2 = p and x3 = p, where p is a positive rational number. Know that √2 is irrational.
7 3.2 8.EE.2Use square root and cube root symbols to represent solutions to equations of the form x2 = p and x3 = p, where p is a positive rational number. Know that √2 is irrational.
8 3.3 8.EE.1Know and apply the properties of integer exponents to generate equivalent numerical expressions.
9 3.4 8.EE.1Know and apply the properties of integer exponents to generate equivalent numerical expressions.
10 3.5 8.EE.1Know and apply the properties of integer exponents to generate equivalent numerical expressions.
11 3.6 8.EE.1Know and apply the properties of integer exponents to generate equivalent numerical expressions.
12 3.7 8.EE.1Know and apply the properties of integer exponents to generate equivalent numerical expressions.
13 4.1 8.EE.3Recognize numbers that are expressed in scientific notation and understand how multiplying by a power of 10 affects the values of numbers.
14 4.2 8.EE.3 Rewrite very large or very small numbers in standard form.
15 4.3 8.EE.3 Rewrite very large or very small numbers in standard form.
16 4.4 8.EE.4Perform operations with numbers expressed in scientific notation, including problems where both decimal and scientific notation are used.
17 4.5 8.EE.1Know and apply the properties of integer exponents to generate equivalent numerical expressions.
Grade 8: Unit Test B (Expressions Equations, Part 1)

digits Grade 8 Common Core Standards for Unit Assessments
digitsmath.com 4
Item Number
Topic Lesson
Common Core State Standard Description
18 2.3 8.EE.7bSolve linear equations with rational number coefficients, including equations whose solutions require expanding expressions using the distributive property and collecting like terms.
19 4.2 8.EE.3Use numbers expressed in the form of a single digit times an integer power of 10 to estimate very large or very small quantities and to express how many times one is as much as the other.
20 3.1 8.EE.2Use square root and cube root symbols to represent solutions to equations of the form x2 = p and x3 = p, where p is a positive rational number. Know that √2 is irrational.
21 3.2 8.EE.2 Evaluate cube roots of small perfect cubes.
22 2.2 8.EE.7bSolve linear equations with rational number coefficients, including equations whose solutions require expanding expressions using the distributive property and collecting like terms.
23 3.1 8.EE.2 Evaluate square roots of small perfect squares.
24 4.3 8.EE.3 Rewrite very large or very small numbers in scientific notation.
25 4.4 8.EE.4Perform operations with numbers expressed in scientific notation, including problems where both decimal and scientific notation are used.
26 4.5 8.EE.3Use scientific notation and choose units of appropriate size for measurements of very large or very small quantities.
27 4.3 8.EE.3 Rewrite very large or very small numbers in standard form.
28 2.4 8.EE.7aTransform linear equations in one variable into simpler forms until an equivalent equation with one solution (x = a), infinitely many solutions (a = a), or no solution (a = b) results.
29 3.6 8.EE.1Know and apply the properties of integer exponents to generate equivalent numerical expressions.
30 4.1 8.EE.4Recognize numbers that are expressed in scientific notation and understand how multiplying by a power of 10 affects the values of numbers.
Grade 8: Unit Test B (continued)

digits Grade 6 Common Core Standards for Mathematical Content (continued)digits Grade 8 Common Core Standards for Unit Assessments
digitsmath.com 5
Grade 8: Unit Test C (Expressions Equations, Part 2)
Item Number
Topic Lesson
Common Core State Standard Description
1 5.1 8.EE.5Graph proportional relationships, interpreting the unit rate as the slope of the graph.
2 5.2 8.EE.6Compare two different proportional relationships represented in different ways.
3 5.3 8.EE.5Graph proportional relationships, interpreting the unit rate as the slope of the graph.
4 5.4 8.EE.5Graph proportional relationships, interpreting the unit rate as the slope of the graph.
5 5.5 8.EE.6 Define the equation y = mx + b for a line intercepting the vertical axis at b.
6 5.6 8.EE.6 Define the equation y = mx + b for a line intercepting the vertical axis at b.
7 5.7 8.EE.6 Define the equation y = mx + b for a line intercepting the vertical axis at b.
8 6.1 8.EE.8aApply and extend understanding of linear equations in two variables to define a system of two linear equations in two variables.
9 6.2 8.EE.8bSolve simple cases of systems of two linear equations in two variables by inspection.
10 6.3 8.EE.8aSolve systems of two linear equations in two variables by graphing the two equations in the same rectangular coordinate plane and naming the coordinates of the point of intersection of the two lines.
11 6.4 8.EE.8bSolve systems of two linear equations in two variables algebraically using substitution.
12 6.5 8.EE.8 Analyze and solve pairs of simultaneous linear equations.
13 6.6 8.EE.8 Analyze and solve pairs of simultaneous linear equations.
14 6.7 8.EE.8bSolve systems of two linear equations in two variables algebraically using addition and subtraction.
15 5.4 8.EE.5Graph proportional relationships, interpreting the unit rate as the slope of the graph.
16 5.6 8.EE.6 Define the equation y = mx + b for a line intercepting the vertical axis at b.
17 5.1 8.EE.5Graph proportional relationships, interpreting the unit rate as the slope of the graph.
18 5.2 8.EE.6 Define the equation y = mx for a line through the origin.
19 5.5 8.EE.6 Define the equation y = mx + b for a line intercepting the vertical axis at b.
20 6.1 8.EE.8cSolve real-world and mathematical problems leading to two linear equations in two variables.

digits Grade 8 Common Core Standards for Unit Assessments
digitsmath.com 6
Item Number
Topic Lesson
Common Core State Standard Description
21 6.2 8.EE.8bSolve simple cases of systems of two linear equations in two variables by inspection.
22 6.3 8.EE.8cSolve real-world and mathematical problems leading to two linear equations in two variables.
23 6.5 8.EE.8bSolve systems of two linear equations in two variables algebraically using addition and subtraction.
24 6.6 8.EE.8cSolve real-world and mathematical problems leading to two linear equations in two variables.
25 6.7 8.EE.8 Analyze and solve pairs of simultaneous linear equations.
26 6.2 8.EE.8 Analyze and solve pairs of simultaneous linear equations.
27 5.2 8.EE.6Compare two different proportional relationships represented in different ways.
28 6.6 8.EE.8cSolve real-world and mathematical problems leading to two linear equations in two variables.
29 6.7 8.EE.8 Analyze and solve pairs of simultaneous linear equations.
30 6.1 8.EE.8cSolve real-world and mathematical problems leading to two linear equations in two variables.
Grade 8: Unit Test C (continued)

digits Grade 8 Common Core Standards for Unit Assessments
digitsmath.com 7
Item Number
Topic Lesson
Common Core State Standard Description
1 7.1 8.F.1 Define a function as a rule that assigns to each input exactly one output.
2 7.2 8.F.2Represent the same function as a set of ordered pairs, a table of values, a graph, and a rule.
3 7.3 8.F.3Classify a linear function as a rule defined by an equation of the form y = mx + b, whose graph is a straight line.
4 7.4 8.F.3Recognize functions that are not linear given a rule, a set of ordered pairs, a graph, or a table.
5 7.5 8.F.5Describe qualitatively the functional relationship between two quantities by analyzing a graph.
6 7.6 8.F.5Sketch a graph that exhibits the qualitative features of a function that has been described verbally.
7 7.7 8.F.5Describe qualitatively the functional relationship between two quantities by analyzing a graph.
8 8.1 8.F.3Classify a linear function as a rule defined by an equation of the form y = mx + b, whose graph is a straight line.
9 8.2 8.F.4Determine the rate of change and initial value of a linear function from a description of a relationship or from two (x, y) values, including reading these from a table or graph.
10 8.3 8.F.4Determine the rate of change and initial value of a linear function from a description of a relationship or from two (x, y) values, including reading these from a table or graph.
11 8.4 8.F.2Compare the properties of two functions when each is represented in a different way.
12 8.5 8.F.4 Construct a function to model a linear relationship between two quantities.
13 8.6 8.F.4 Construct a function to model a linear relationship between two quantities.
14 7.1 8.F.1 Define a function as a rule that assigns to each input exactly one output.
15 7.3 8.F.3Classify a linear function as a rule defined by an equation of the form y = mx + b, whose graph is a straight line.
16 7.4 8.F.3Recognize functions that are not linear given a rule, a set of ordered pairs, a graph, or a table.
17 7.5 8.F.5Describe qualitatively the functional relationship between two quantities by analyzing a graph.
18 7.6 8.F.5Sketch a graph that exhibits the qualitative features of a function that has been described verbally.
19 7.7 8.F.5Sketch a graph that exhibits the qualitative features of a function that has been described verbally.
20 8.1 8.F.4 Construct a function to model a linear relationship between two quantities.
Grade 8: Unit Test D (Functions)

digits Grade 8 Common Core Standards for Unit Assessments
digitsmath.com 8
Grade 8: Unit Test D (continued)Item
NumberTopic
LessonCommon Core State Standard Description
21 8.2 8.F.4Determine the rate of change and initial value of a linear function from a description of a relationship or from two (x, y) values, including reading these from a table or graph.
22 8.3 8.F.4Interpret the rate of change and initial value of a linear function in terms of the situation it models, and in terms of its graph or a table of value.
23 8.4 8.F.2Compare the properties of two functions when each is represented in a different way.
24 8.6 8.F.4 Construct a function to model a linear relationship between two quantities.
25 8.6 8.F.3 Construct a function to model a linear relationship between two quantities.
26 7.4 8.F.3Classify a linear function as a rule defined by an equation of the form y = mx + b, whose graph is a straight line.
27 7.4 8.F.3Recognize functions that are not linear given a rule, a set of ordered pairs, a graph, or a table.
28 8.4 8.F.2Compare the properties of two functions when each is represented in a different way.
29 7.6 8.F.5Sketch a graph that exhibits the qualitative features of a function that has been described verbally.
30 8.5 8.F.4 Construct a function to model a linear relationship between two quantities.

digits Grade 8 Common Core Standards for Unit Assessments
digitsmath.com 9
Item Number
Topic Lesson
Common Core State Standard Description
1 9.1 8.G.3Use coordinates to describe the effect of dilations, translations, rotations, and reflections on two-dimensional figures.
2 9.2 8.G.3Use coordinates to describe the effect of dilations, translations, rotations, and reflections on two-dimensional figures.
3 9.3 8.G.1 Explore the properties of rotations.
4 9.4 8.G.2Given congruent figures, describe a sequence of rotations, reflections, and translations that exhibits the congruence between them.
5 9.5 8.G.2Given congruent figures, describe a sequence of rotations, reflections, and translations that exhibits the congruence between them.
6 10.1 8.G.1 Explore the properties of dilations.
7 10.2 8.G.4Given similar figures, describe a sequence of rotations, reflections, translations, and dilations that exhibits the similarity between them.
8 13.7 8.G.9Use the formulas for the volumes of cylinders, cones, and spheres to solve real-world and mathematical problems.
9 10.3 8.EE.6Use similar triangles to explain why the slope m is the same between any two distinct points on a non-vertical line in the coordinate plane.
10 11.1 8.G.5Use facts about the angles created when parallel lines are cut by a transversal to solve problems.
11 11.2 8.G.5Use facts about the angles created when lines are cut by a transversal to decide whether the lines are parallel.
12 11.3 8.G.5 Use facts about the angle sum of triangles to solve problems.
13 11.4 8.G.5 Use facts about the exterior angles of triangles to solve problems.
14 11.5 8.G.5Use facts about the angle-angle criterion for similarity of triangles to solve problems.
15 11.6 8.G.5Use facts about the angle-angle criterion for similarity of triangles to solve problems.
16 12.4 8.G.6 Explore basic principles of a mathematical proof.
17 12.2 8.G.7Apply the Pythagorean Theorem to determine unknown side lengths in right triangles in real-world and mathematical problems in two and three dimensions.
18 12.3 8.G.7Apply the Pythagorean Theorem to determine unknown side lengths in right triangles in real-world and mathematical problems in two and three dimensions.
19 12.4 8.G.7Apply the Converse of the Pythagorean Theorem to determine if a triangle is a right triangle.
20 12.5 8.G.8Apply the Pythagorean Theorem to find the distance between two points in a coordinate system.
21 12.6 8.G.7Apply the Pythagorean Theorem to determine unknown side lengths in right triangles in real-world and mathematical problems in two and three dimensions.
Grade 8: Unit Test E (Geometry)

digits Grade 8 Common Core Standards for Unit Assessments
digitsmath.com 10
Item Number
Topic Lesson
Common Core State Standard Description
22 13.1 8.G.9Use the formulas for the surface areas of cylinders, cones, and spheres to solve real-world and mathematical problems.
23 13.2 8.G.9Use the formulas for the surface areas of cylinders, cones, and spheres to solve real-world and mathematical problems.
24 13.3 8.G.9Apply and extend understanding of three-dimensional figures to define the properties of cones, cylinders, and spheres.
25 13.4 8.G.9Use the formulas for the volumes of cylinders, cones, and spheres to solve real-world and mathematical problems.
26 13.5 8.G.9Use the formulas for the surface areas of cylinders, cones, and spheres to solve real-world and mathematical problems.
27 13.6 8.G.9Use the formulas for the volumes of cylinders, cones, and spheres to solve real-world and mathematical problems.
28 10.3 8.EE.6Use similar triangles to explain why the slope m is the same between any two distinct points on a non-vertical line in the coordinate plane.
29 10.2 8.G.4Given similar figures, describe a sequence of rotations, reflections, translations, and dilations that exhibits the similarity between them.
30 9.2 8.G.3Use coordinates to describe the effect of dilations, translations, rotations, and reflections on two-dimensional figures.
Grade 8: Unit Test E (continued)

digits Grade 8 Common Core Standards for Unit Assessments
digitsmath.com 11
Item Number
Topic Lesson
Common Core State Standard Description
1 14.1 8.SP.1Interpret scatter plots for bivariate measurement data to investigate patterns of association between two quantities.
2 14.2 8.SP.1Construct scatter plots for bivariate measurement data to investigate patterns of association between two quantities.
3 14.3 8.SP.1Describe patterns in scatter plots such as clustering, outliers, positive or negative association, linear association, and nonlinear association.
4 14.4 8.SP.1Describe patterns in scatter plots such as clustering, outliers, positive or negative association, linear association, and nonlinear association.
5 14.5 8.SP.2For scatter plots that suggest a linear association, informally fit a straight line, and informally assess the model fit by judging the closeness of the data points to the line.
6 14.6 8.SP.3Use the equation of a linear model to solve problems in the context of bivariate measurement data, interpreting the slope and intercept.
7 14.7 8.SP.2For scatter plots that suggest a linear association, informally fit a straight line, and informally assess the model fit by judging the closeness of the data points to the line.
8 15.1 8.SP.4Apply and extend understanding of data to define the characteristics of bivariate categorical data.
9 15.2 8.SP.4
Construct a two-way table summarizing data on two categorical variables collected from the same subjects. Use relative frequencies calculated for rows or columns to describe possible association between the two variables.
10 15.3 8.SP.4
Interpret a two-way table summarizing data on two categorical variables collected from the same subjects. Use relative frequencies calculated for rows or columns to describe possible association between the two variables.
11 15.4 8.SP.4
Construct a two-way table summarizing data on two categorical variables collected from the same subjects. Use relative frequencies calculated for rows or columns to describe possible association between the two variables.
12 15.5 8.SP.4
Interpret a two-way table summarizing data on two categorical variables collected from the same subjects. Use relative frequencies calculated for rows or columns to describe possible association between the two variables.
13 15.6 8.SP.4
Interpret a two-way table summarizing data on two categorical variables collected from the same subjects. Use relative frequencies calculated for rows or columns to describe possible association between the two variables.
14 15.7 8.SP.4
Interpret a two-way table summarizing data on two categorical variables collected from the same subjects. Use relative frequencies calculated for rows or columns to describe possible association between the two variables.
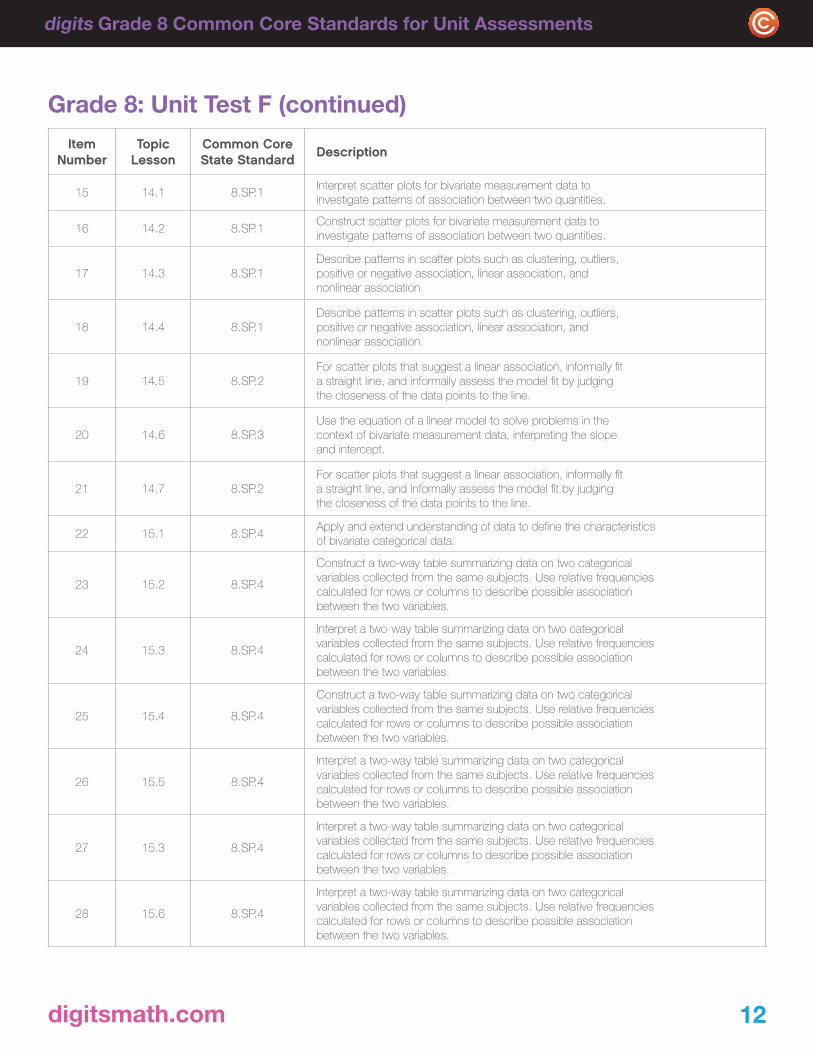
Grade 8: Unit Test F (Statistics)
digits Grade 8 Common Core Standards for Unit Assessments
digitsmath.com 12
Item Number
Topic Lesson
Common Core State Standard Description
15 14.1 8.SP.1Interpret scatter plots for bivariate measurement data to investigate patterns of association between two quantities.
16 14.2 8.SP.1Construct scatter plots for bivariate measurement data to investigate patterns of association between two quantities.
17 14.3 8.SP.1Describe patterns in scatter plots such as clustering, outliers, positive or negative association, linear association, and nonlinear association.
18 14.4 8.SP.1Describe patterns in scatter plots such as clustering, outliers, positive or negative association, linear association, and nonlinear association.
19 14.5 8.SP.2For scatter plots that suggest a linear association, informally fit a straight line, and informally assess the model fit by judging the closeness of the data points to the line.
20 14.6 8.SP.3Use the equation of a linear model to solve problems in the context of bivariate measurement data, interpreting the slope and intercept.
21 14.7 8.SP.2For scatter plots that suggest a linear association, informally fit a straight line, and informally assess the model fit by judging the closeness of the data points to the line.
22 15.1 8.SP.4Apply and extend understanding of data to define the characteristics of bivariate categorical data.
23 15.2 8.SP.4
Construct a two-way table summarizing data on two categorical variables collected from the same subjects. Use relative frequencies calculated for rows or columns to describe possible association between the two variables.
24 15.3 8.SP.4
Interpret a two-way table summarizing data on two categorical variables collected from the same subjects. Use relative frequencies calculated for rows or columns to describe possible association between the two variables.
25 15.4 8.SP.4
Construct a two-way table summarizing data on two categorical variables collected from the same subjects. Use relative frequencies calculated for rows or columns to describe possible association between the two variables.
26 15.5 8.SP.4
Interpret a two-way table summarizing data on two categorical variables collected from the same subjects. Use relative frequencies calculated for rows or columns to describe possible association between the two variables.
27 15.3 8.SP.4
Interpret a two-way table summarizing data on two categorical variables collected from the same subjects. Use relative frequencies calculated for rows or columns to describe possible association between the two variables.
28 15.6 8.SP.4
Interpret a two-way table summarizing data on two categorical variables collected from the same subjects. Use relative frequencies calculated for rows or columns to describe possible association between the two variables.
Grade 8: Unit Test F (continued)

Grade 8 Common Core State Standardsfor Unit Assessments
Item Number
Topic Lesson
Common Core State Standard Description
29 15.5 8.SP.4
Interpret a two-way table summarizing data on two categorical variables collected from the same subjects. Use relative frequencies calculated for rows or columns to describe possible association between the two variables.
30 15.4 8.SP.4
Construct a two-way table summarizing data on two categorical variables collected from the same subjects. Use relative frequencies calculated for rows or columns to describe possible association between the two variables.
Grade 8: Unit Test F (continued)
PearsonSchool.com800-848-9500Copyright Pearson Education, Inc., or its affiliates. All rights reserved.
PDF.1
112.
DI.P
C.R
H
Mat
1224
13