gradient texture unit coding for texture analysis
TRANSCRIPT

Gradient texture unit coding for texture analysis
Chein-I Chang, FELLOW SPIEYuan ChenUniversity of MarylandDepartment of Computer Science and
Electrical EngineeringRemote Sensing Signal and Image
Processing LaboratoryBaltimore County, Baltimore, Maryland
21250
Abstract. Texture is one of many important features to capture in imagecharacteristics. A recent texture unit-based texture spectrum approach,referred to as texture unit coding (TUC) developed by Wang and He hasshown promise in texture classification. We present a new texture fea-ture extraction coding, called gradient texture unit coding (GTUC) that isbased on Wang and He’s texture unit to capture gradient changes in atexture unit. Since the GTUC also generates an 8-D ternary texture fea-ture vector in the same way that the TUC does, a GTUC-generatedfeature vector can be further represented by a number in the same rangegenerated by the TUC. As a result, the GTUC-generated numbers alsoform a texture spectrum similar to that formed by the TUC-generatednumbers. By normalizing a texture spectrum as a probability distribution,this work further develops an information divergence (ID)-based discrimi-nation criterion to measure the discrepancy between two texture spectra,a concept yet to be explored in texture analysis. To compare the GTUCto the TUC in texture classification, several criteria used in hyperspectralimage analysis are also introduced for performance analysis. © 2004Society of Photo-Optical Instrumentation Engineers. [DOI: 10.1117/1.1768183]
Subject terms: gradient texture unit coding; gradient texture unit number; infor-mation divergence; relative discriminatory probability; relative discriminatorypower; texture unit; texture unit coding; texture unit numbers; texture spectrum.
Paper TPR-031 received Nov. 13, 2003; revised manuscript received Jan. 8,2004; accepted for publication Mar. 15, 2004.
ribth
vel
foree
s aby15an
gech
to at
el incantham.-heng
niting
seea
s,
asexelse-
ayedrera-
eedregra-thend
istheture
ford tohetex-theescange.ndtrumar
1 Introduction
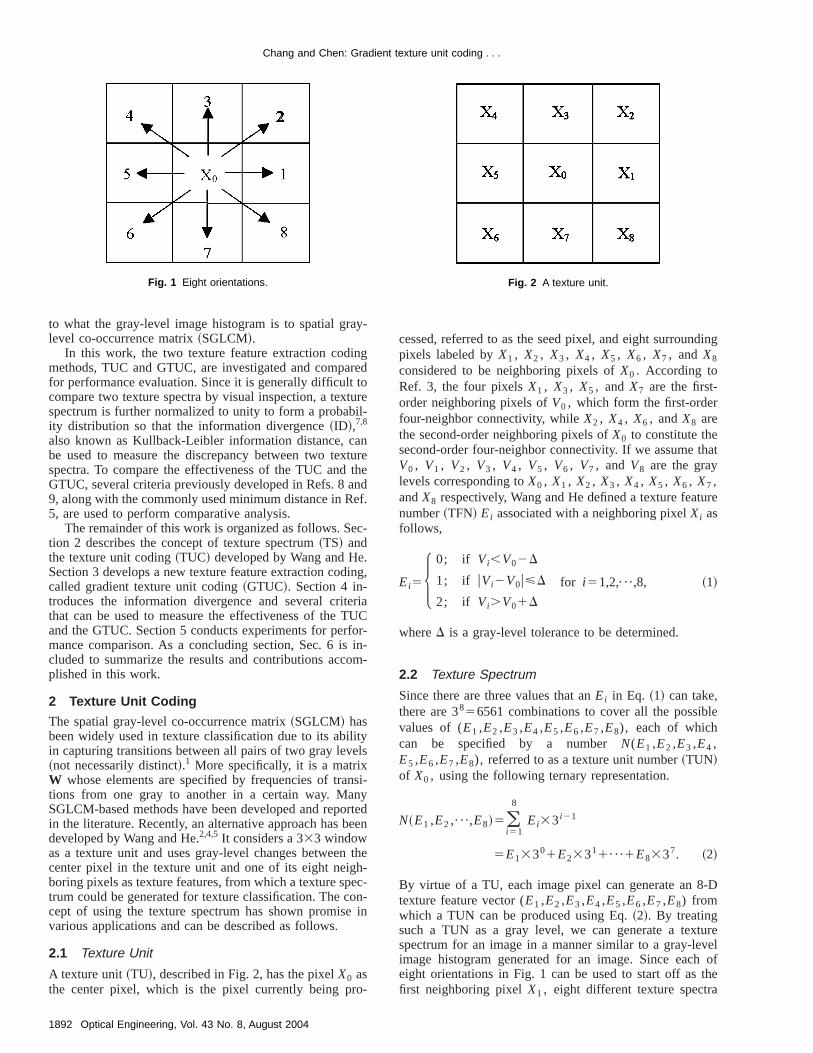
Texture is one of the fundamental features used to descimage characteristics. One commonly used approach isgray-level co-occurrence matrix that provides gray-letransition information between two gray levels.1 Using arather different approach, Wang and He2 considered a 333window as a texture unit~TU! along with its eight-neighborconnectivity3 to generate an 8-D texture feature vectoreach pixel that represents the gray-level changes betwthe pixel at the center of the texture unit, referred to aseed pixel, and its eight neighboring pixels specifiedeight orientations 0, 45, 90, 135, 180, 225, 270, and 3deg, shown in Fig. 1. As a result, each pixel can produce8-D texture feature vector that describes gray-level chanin a texture unit along with these eight orientations. Suan 8-D texture feature vector can be further convertedtexture unit number~TUN! in a ternary representation thaspecifies a particular texture pattern. Because each pixan image generates its own TUN via a TU, these TUNsbe used to form a texture spectrum in the same waygray-level values of image pixels form an image histograThe only difference is that thex axis of the texture spectrum is specified by TUNs instead of the gray levels in timage histogram. By virtue of the texture spectrum, Waand He have investigated various applications.4–6
We explore the concept of Wang and He’s texture uand further develop a new texture feature extraction codmethod, called gradient texture unit coding~GTUC! thatencodes gradient changes in gray levels between thepixel in a texture unit and its two neighboring pixels inTU, along with two different orientations. In other word
Opt. Eng. 43(8) 1891–1903 (August 2004) 0091-3286/2004/$15.00
ee
n
s
t
d
the GTUC extends the Wang and He method, referred totexture unit coding~TUC! in this work, in the sense that thGTUC captures the gray-level changes among three pirather than two pixels considered in the TUC. More spcifically, unlike the TUC that encodes a change in grlevel along a particular orientation specified by the sepixel and one of its eight neighboring pixels in a textuunit, the GTUC dictates texture patterns that describe gdient changes in two orientations specified by the spixel and two of its eight neighboring pixels in the textuunit. Consequently, the GTUC can be interpreted as adient method of Wang and He’s TUC, since it calculatesgray-level changes in two TUNs generated by Wang aHe’s TUC.
One of the unique features resulting from the TUCthat an 8-D ternary texture feature vector generated byTUC can be represented by a numerical number, the texunit number~TUN!, ranging from 0 to 382156560. Inanalogy with gray levels that create an image histograman image, these TUC-generated TUNs can also be useform a texture spectrum for a texture image. Similarly, tproposed GTUC also produces an 8-D ternary gradientture feature vector that generates a numerical value insame range$0,1,̄ ,6560%, referred to as the gradient texturunit number~GTUN! in the same fashion that the TUN igenerated by the TUC. As a result, a texture spectrumalso be produced from such GTUNs for a texture imaMore interestingly, the relationship between the TUC athe GTUC seems to suggest that what the texture specof TUNs is to the texture spectrum of the GTUNs is simil
1891© 2004 Society of Photo-Optical Instrumentation Engineers
ay-
gredtotureil-
anturthendef.
c-
.ing
riaUC
for-in-
om
lityels
nsinyrteee
thh-ec-on-
in
o-
ding
hat
ure
le
-D
turevel
ofthe
Chang and Chen: Gradient texture unit coding . . .
to what the gray-level image histogram is to spatial grlevel co-occurrence matrix~SGLCM!.
In this work, the two texture feature extraction codinmethods, TUC and GTUC, are investigated and compafor performance evaluation. Since it is generally difficultcompare two texture spectra by visual inspection, a texspectrum is further normalized to unity to form a probabity distribution so that the information divergence~ID!,7,8
also known as Kullback-Leibler information distance, cbe used to measure the discrepancy between two texspectra. To compare the effectiveness of the TUC andGTUC, several criteria previously developed in Refs. 8 a9, along with the commonly used minimum distance in R5, are used to perform comparative analysis.
The remainder of this work is organized as follows. Setion 2 describes the concept of texture spectrum~TS! andthe texture unit coding~TUC! developed by Wang and HeSection 3 develops a new texture feature extraction codcalled gradient texture unit coding~GTUC!. Section 4 in-troduces the information divergence and several critethat can be used to measure the effectiveness of the Tand the GTUC. Section 5 conducts experiments for permance comparison. As a concluding section, Sec. 6 iscluded to summarize the results and contributions accplished in this work.
2 Texture Unit Coding
The spatial gray-level co-occurrence matrix~SGLCM! hasbeen widely used in texture classification due to its abiin capturing transitions between all pairs of two gray lev~not necessarily distinct!.1 More specifically, it is a matrixW whose elements are specified by frequencies of trations from one gray to another in a certain way. MaSGLCM-based methods have been developed and repoin the literature. Recently, an alternative approach has bdeveloped by Wang and He.2,4,5 It considers a 333 windowas a texture unit and uses gray-level changes betweencenter pixel in the texture unit and one of its eight neigboring pixels as texture features, from which a texture sptrum could be generated for texture classification. The ccept of using the texture spectrum has shown promisevarious applications and can be described as follows.
2.1 Texture Unit
A texture unit~TU!, described in Fig. 2, has the pixelX0 asthe center pixel, which is the pixel currently being pr
Fig. 1 Eight orientations.
1892 Optical Engineering, Vol. 43 No. 8, August 2004
e
,
-
-
dn
e
cessed, referred to as the seed pixel, and eight surrounpixels labeled byX1 , X2 , X3 , X4 , X5 , X6 , X7 , and X8
considered to be neighboring pixels ofX0 . According toRef. 3, the four pixelsX1 , X3 , X5 , and X7 are the first-order neighboring pixels ofV0 , which form the first-orderfour-neighbor connectivity, whileX2 , X4 , X6 , andX8 arethe second-order neighboring pixels ofX0 to constitute thesecond-order four-neighbor connectivity. If we assume tV0 , V1 , V2 , V3 , V4 , V5 , V6 , V7 , and V8 are the graylevels corresponding toX0 , X1 , X2 , X3 , X4 , X5 , X6 , X7 ,andX8 respectively, Wang and He defined a texture featnumber~TFN! Ei associated with a neighboring pixelXi asfollows,
Ei5H 0; if Vi,V02D
1; if uVi2V0u<D
2; if Vi.V01D
for i 51,2,̄ ,8, ~1!
whereD is a gray-level tolerance to be determined.
2.2 Texture Spectrum
Since there are three values that anEi in Eq. ~1! can take,there are 3856561 combinations to cover all the possibvalues of (E1 ,E2 ,E3 ,E4 ,E5 ,E6 ,E7 ,E8), each of whichcan be specified by a numberN(E1 ,E2 ,E3 ,E4 ,E5 ,E6 ,E7 ,E8), referred to as a texture unit number~TUN!of X0 , using the following ternary representation.
N~E1 ,E2 ,¯,E8!5(i 51
8
Ei33i 21
5E13301E23311¯1E8337. ~2!
By virtue of a TU, each image pixel can generate an 8texture feature vector (E1 ,E2 ,E3 ,E4 ,E5 ,E6 ,E7 ,E8) fromwhich a TUN can be produced using Eq.~2!. By treatingsuch a TUN as a gray level, we can generate a texspectrum for an image in a manner similar to a gray-leimage histogram generated for an image. Since eacheight orientations in Fig. 1 can be used to start off asfirst neighboring pixelX1 , eight different texture spectra
Fig. 2 A texture unit.

Chang and Chen: Gradient texture unit coding . . .
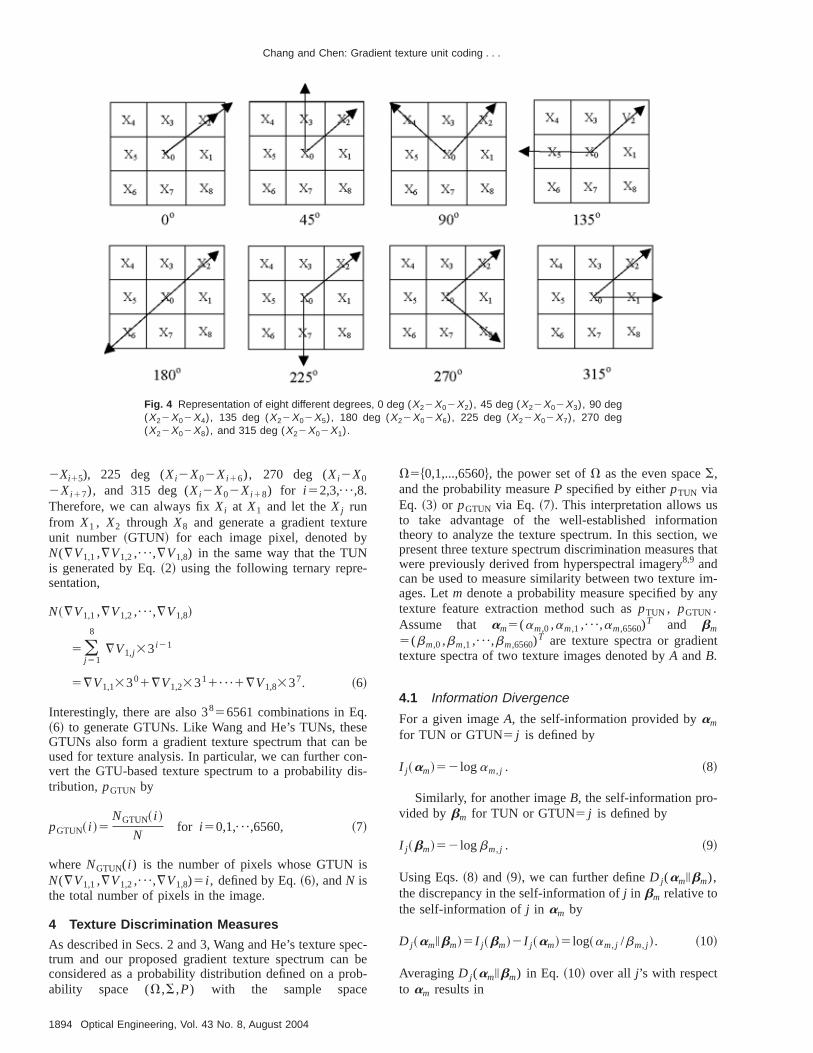
Fig. 3 Representation of eight different degrees, 0 deg (X12X02X1), 45 deg (X12X02X2), 90 deg(X12X02X3), 135 deg (X12X02X4), 180 deg (X12X02X5), 225 deg (X12X02X6), 270 deg(X12X02X7), and 315 deg (X12X02X8).
ob-
s
la--entnt
by
x
le-o,a-
turepairaort-
nean
-deg
nt
henbye.,so(
can be generated for each image. Using Eq.~2!, we canfurther convert the TU-based texture spectrum to a prability distribution,pTUN by
pTUN~ i !5NTUN~ i !
Nfor i 50,1,̄ ,6560, ~3!
where NTUN( i ) is the number of pixels whose TUN iN(E1 ,E2 ,¯,E8)5 i , defined by Eq.~2!, andN is the totalnumber of pixels in the image.
3 Gradient Texture Unit Coding
The texture spectrum produced by Eq.~2! is based on thecorrelation between the seed pixelX0 and one of its eightneighboring pixels,X1 , X2 , X3 , X4 , X5 , X6 , X7 , andX8in Fig. 2. It does not take into account the spatial corretion of X0 with two pixels in its eight-neighbor connectivity. In this section, we develop a new concept of graditexture unit matrix, which captures the gray-level gradiechanges betweenV0 andVi and betweenV0 andVj . Morespecifically, for the seed pixelX0 in a TU, we define agradient texture feature number~GTFN! with respect to anypair of its two neighboring pixelsXi andXj as follows.
¹Vi j 550; if uVi2V0u<D and uVj2V0u<D
1; if uVi2V0u<D and uVj2V0u.D
or uVi2V0u.D and uVj2V0u<D
2; if uVi2V0u.D and uVj2V0u.D
for i , j 51,2,̄ ,8.
~4!
In analogy with the 8-D texture feature vector defined(E1 ,E2 ,E3 ,E4 ,E5 ,E6 ,E7 ,E8) for the seed pixelX0 , wecan generate an 838 gradient texture feature matri~GTFM! for X0 by,
¹MTU5 b¹Vi j c838 , ~5!
whose (i , j ) entry ¹Vi j is given by Eq.~4!. It should benoted that the GTFM is symmetric and the diagonal ements of¹MTU can only take values of either 0 or 2. Swe can convert the GTFM to a 36-D gradient texture feture vector where each of the 36 dimensions in the feavector specifies a gradient change between a particularof two pixels Xi and Xj in Fig. 2. As a result, there aretotal of 281328 gradient texture feature vectors. That is, feach fixedXi in Fig. 2, there are eight pixels in the eighneighbor connectivity ofX0 , including itself~i.e.,Xi!, can bechosen to beXj where each of these pixels represents oparticular orientation specified in Fig. 1. Figure 3 showsexample whereXi is chosen to beX1 and theXj runs fromX1 , X2 through X8 , which represents eight different degrees, 0, 45, 90, 135, 180, 225, 270, and 315, with 45apart, namely, 0 deg (X12X02X1), 45 deg (X12X0
2X2), 90 deg (X12X02X3), 135 deg (X12X02X4), 180deg (X12X02X5), 225 deg (X12X02X6), 270 deg (X1
2X02X7), and 315 deg (X12X02X8). Similarly, we canalso chooseXi to be X2 and the Xj to run from X2 ,X3 ,¯,X8 throughX1 , as shown in Fig. 4 to also represeeight degrees, 0 deg (X22X02X2), 45 deg (X22X0
2X3), 90 deg (X22X02X4), 135 deg (X22X02X5), 180deg (X22X02X6), 225 deg (X22X02X7), 270 deg (X2
2X02X8), and 315 deg (X22X02X1). Comparing Fig. 4to Fig. 3, we note that the only thing that matters is tdegree formed byXi and Xj regardless of what is chosefor Xi . In other words, the degree of the angle formedXi andXj only depends on the difference of subscript, i.u i 2 j u. In this case, the eight orientations in Fig. 1 alcorrespond to the eight degrees specified by 0 degXi
2X02Xi 11), 45 deg (Xi2X02Xi 12), 90 deg (Xi2X0
2Xi 13), 135 deg (Xi2X02Xi 14), 180 deg (Xi2X0
1893Optical Engineering, Vol. 43 No. 8, August 2004
Chang and Chen: Gradient texture unit coding . . .
1894 Opt
Fig. 4 Representation of eight different degrees, 0 deg (X22X02X2), 45 deg (X22X02X3), 90 deg(X22X02X4), 135 deg (X22X02X5), 180 deg (X22X02X6), 225 deg (X22X02X7), 270 deg(X22X02X8), and 315 deg (X22X02X1).
rey
-
.sebe
on-is-
s
pecbe
ob-
ionwethat
im-ny
t
2Xi15), 225 deg (Xi2X02Xi 16), 270 deg (Xi2X0
2Xi 17), and 315 deg (Xi2X02Xi 18) for i 52,3,̄ ,8.Therefore, we can always fixXi at X1 and let theXj runfrom X1 , X2 through X8 and generate a gradient textuunit number ~GTUN! for each image pixel, denoted bN(¹V1,1,¹V1,2,¯,¹V1,8) in the same way that the TUNis generated by Eq.~2! using the following ternary representation,
N~¹V1,1,¹V1,2,¯,¹V1,8!
5(j 51
8
¹V1,j33i 21
5¹V1,13301¹V1,23311¯1¹V1,8337. ~6!
Interestingly, there are also 3856561 combinations in Eq~6! to generate GTUNs. Like Wang and He’s TUNs, theGTUNs also form a gradient texture spectrum that canused for texture analysis. In particular, we can further cvert the GTU-based texture spectrum to a probability dtribution, pGTUN by
pGTUN~ i !5NGTUN~ i !
Nfor i 50,1,̄ ,6560, ~7!
whereNGTUN( i ) is the number of pixels whose GTUN iN(¹V1,1,¹V1,2,¯,¹V1,8)5 i , defined by Eq.~6!, andN isthe total number of pixels in the image.
4 Texture Discrimination Measures
As described in Secs. 2 and 3, Wang and He’s texture strum and our proposed gradient texture spectrum canconsidered as a probability distribution defined on a prability space (V,S,P) with the sample space
ical Engineering, Vol. 43 No. 8, August 2004
-
V5$0,1,...,6560%, the power set ofV as the even spaceS,and the probability measureP specified by eitherpTUN viaEq. ~3! or pGTUN via Eq. ~7!. This interpretation allows usto take advantage of the well-established informattheory to analyze the texture spectrum. In this section,present three texture spectrum discrimination measureswere previously derived from hyperspectral imagery8,9 andcan be used to measure similarity between two textureages. Letm denote a probability measure specified by atexture feature extraction method such aspTUN , pGTUN.Assume that am5(am,0 ,am,1 ,¯,am,6560)
T and bm
5(bm,0 ,bm,1 ,¯,bm,6560)T are texture spectra or gradien
texture spectra of two texture images denoted byA andB.
4.1 Information Divergence
For a given imageA, the self-information provided byam
for TUN or GTUN5 j is defined by
I j~am!52 logam, j . ~8!
Similarly, for another imageB, the self-information pro-vided bybm for TUN or GTUN5 j is defined by
I j~bm!52 logbm, j . ~9!
Using Eqs.~8! and ~9!, we can further defineD j (amibm),the discrepancy in the self-information ofj in bm relative tothe self-information ofj in am by
D j~amibm!5I j~bm!2I j~am!5 log~am, j /bm, j !. ~10!
AveragingD j (amibm) in Eq. ~10! over all j’s with respectto am results in
lf-
re,
tion
at-
-
d
bil-to
y-
-f
a
r
40,t a
ourthee
tedty
izeig.andFig.ec-reg
tureoftoall-
entleddim-
Chang and Chen: Gradient texture unit coding . . .
D~amibm!5 (j 50
6560
D j~amibm!am, j
5 (j 50
6560
am, j log~am, j /bm, j !, ~11!
where D(amibm) is the average discrepancy in the seinformation ofbm relative to the self-information ofam . Inthe context of information theory,D(amibm) in Eq. ~11! iscalled the relative entropy ofbm with respect toam , whichis also known as the Kullback-Leibler information measudirected divergence, or cross entropy.7 Similarly, we canalso define the average discrepancy in the self-informaof am relative to the self-information ofbm by
D~bmiam!5(j 51
L
D j~bmiam!bm, j
5 (j 50
6560
bm, j log~bm, j /am, j !. ~12!
Summing Eqs.~11! and~12! yields information divergence~ID! defined by
ID~am ,bm!5D~amibm!1D~bmiam!, ~13!
which can be used to measure the similarity of texture pterns between two texture imagesA and B. It should benoted that while ID(am ,bm) is symmetric,D(amibm) isnot. This is because ID(am ,bm)5ID( bm ,am), andD(amibm)ÞD(bmiam).
4.2 Relative Discriminatory Probability
Let $sk%k51K beK texture images in the setD, which can be
considered as a database, andt be any specific target texture image to be identified usingD. We define the discrimi-natory probabilities of allsk’s in D relative tot as follows.
pt,Dm ~k!5m~ t,sk!/(
i 51
K
m~ t,si ! for k51,2,̄ ,K, ~14!
whereS i 51K m(t,si) is a normalization constant determine
by t and D. The resulting probability vectorpt,Dm
5@pt,Dm (1),pt,D
m (2),¯,pt,Dm (K)#T is called the relative dis-
criminatory probability~RDPB! of D with respect tot orthe spectral discriminatory probability vector ofD relativeto t. Then, using Eq.~14! we can identifyt via D by select-ing the one with the smallest relative spectral discriminaity probability. If there is a tie, either one can be usedidentify t.
4.3 Relative Discriminatory Entropy
Since pt,Dm 5@pt,D
m (1),pt,Dm (2),¯,pt,D
m (K)#T given by Eq.~14! is the relative discriminability probability vector oftusing a selective set of texture imagesD5$sk%k51
K , we canfurther define the relative discriminatory entropy~RSDE!of the spectral signaturet with respect to the setD, denotedby HRSDE
m (t,D) by
HRSDEm ~ t,D!52 (
k51
K
pt,Dm ~k!log2 pt,D
m ~k!. ~15!
Equation~15! provides an uncertainty measure of identifing t resulting from using D5$sk%k51
K . A higherHRSDE
m (t,D) may have less chance to identifyt.
4.4 Relative Discriminatory Power
Let d be a texture image. Assume thats ands8 are a pair oftwo texture images to be compared using thed as a refer-ence texture image. The RDPW ofm(,), denoted byRDPWm(s,s8;d) is defined by
RDPWm~s,s8;d!5maxH m~s,d!
m~s8,d!,m~s8,d!
m~s,d! J . ~16!
More precisely, RDPWm(s,s8;d) selects as the discriminatory power ofm(,) the maximum of two ratios, the ratio om(s,s8;d) to m(s8,s;d), and the ratio ofm(s8,s;d) tom(s,s8;d). The RDPWm(s,s8;d) defined by Eq.~16! pro-vides a quantitative index of discrimination capability ofspecific texture feature coding methodm(,) between twotexture imagess ands8 relative tod. Obviously, the higherthe RDPWm(s,s8;d) is, the better discriminatory powem(,) is. In addition, RDPWm(s,s8;d) is symmetric andbounded below by one, i.e., RDPWm(s,s8;d)>1 withequality if and only ifs5s8.
5 Experiments
In this section, the same four texture images of size 63640 pixels labeled in Fig. 5~a! that were used in Refs. 24, 5, and 6 were also used for experiments to conduccomparative study between Wang and He’s TUC andproposed GTUC for performance evaluation usingminimum distance~MD! and the information divergenc~ID! as performance measures. The toleranceD was set to3, which was an empirical choice. It should also be nothat both MD and ID were performed on the probabilidistributions produced by Eqs.~3! and~7!. The images areselected from Brodatz’s natural texture images,10 image A~beach sand!, image B~water!, image C~pressed cork!, andimage D~fur hide of an unborn calf!. To make our analysissimple and more effective, the upper left corner of s64364 pixels cropped from each of the four images in F5 was used for our experiments. They are enlargedshown right beneath each of the four images labeled by5~b!. Figures 6 and 7 show examples of eight texture sptra of the TUNs and GTUNs generated for the four textuimages in Fig. 5, respectively, with eight different startinpositions fromX1 , X2 ,¯,X8 . As we can see from Figs. 6and 7, the TUC-generated and the GTUC-generated texspectra were quite different, thus provide different levelstexture information for analysis. In particular, comparedTUC-generated texture spectra for four images, whichlooked very similar from visual inspection, the GTUCgenerated texture spectrum of image A was quite differfrom those of images B, C, and D. So, it could be singout immediately without difficulty. If we further examinemore closely the GTUC-generated texture spectrum of
1895Optical Engineering, Vol. 43 No. 8, August 2004

Chang and Chen: Gradient texture unit coding . . .
1896 Optical Engi
Fig. 5 Four texture images: (a) original image; and (b) a subimage of 64364 cropped from the upperleft corner of each original image.
fortexneudereeisedt beex-
2all
the
d1
D
B
age B, it was also distinct from images C and D. Asimages C and D, their corresponding GTUC-generatedture spectra were very similar and difficult to discern ofrom another. Based on this observation, we could conclthat the four texture images could be grouped into thdifferent classes, image A, image B, and a class comprof images C and D. However, such categorization cannomade easily by visually examining the TUC-generated tture spectra in Fig. 6.
To avoid subjective visual inspection, Tables 1 andtabulate the results of applying the TUC and GTUC tothe four texture images in Fig. 5~b! using the MD and ID as
neering, Vol. 43 No. 8, August 2004
-distance measures, respectively. To simplify analysis,notations TUC/MD(X,Y), TUC/ID(X,Y),GTUC/MD(X,Y), and GTUC/ID(X,Y) are introduced torepresent the distance between imagesX and Y measuredby the TUC using MD and ID, the GTUC using MD anID, respectively. Using these four definitions, Tableshows that TUC/MD~A,D!50.0023, TUC/MD~B,A!50.0026, and TUC/MD~C,D!5TUC/MD~D,C!50.0028,all of which were the smallest values yielded by TUC/Mfor each of the four texture images in Fig. 5~b!. It impliedthat image A was more similar to image D than to images

Chang and Chen: Gradient texture unit coding . . .
Fig. 6 Eight texture spectra of the TUNs generated for the four texture images in Fig. 5, respectively,with eight different starting positions from X1 , X2 ,...,X7 , X8 .
1897Optical Engineering, Vol. 43 No. 8, August 2004

Chang and Chen: Gradient texture unit coding . . .
1898 Opt
Fig. 7 Eight texture spectra of the GTUNs generated for the four texture images in Fig. 5, respectively,with eight different starting positions from X1 , X2 ,...,X7 , X8 .
ical Engineering, Vol. 43 No. 8, August 2004

m-ach
u-
theCup
nu-es,nd
re-to
mi-and
B.ro-di-age
o,rate
oftratofef-
msed
,sedllesttedd, aessge.
m-mi-. Asnd
ing
sed,ithtter
ge,A.C/
lesedd
othisomse,ved
aim-ble
Chang and Chen: Gradient texture unit coding . . .
and C, image B was more similar to image A than to iages C and D, and images C and D were similar to eother compared to images A and B.
Now, if the GTUC was used and their results are tablated in Table 1, where GTUC/MD~A,B!5GTUC/MD~A,B!50.0140, GTUC/MD~C,D!5GTUC/MD~D,C!50.00025 were the smallest values produced byGTUC/MD for each of the four texture images. The GTUresults suggested that images A and B were in one growhile images C and D were in another group.
Next, if the ID was implemented in place of the MD iTable 1, the results of the TUC/ID and GTUC/ID are tablated in Table 2, where for each of the four texture imagtheir smallest values in Table 2 produced by TUC/ID aGTUC/ID, were TUC/ID~A,C!50.6868, TUC/ID~B,A!51.1000, TUC/ID~C,D!5TUC/ID~D,C!50.6615, andGTUC/ID~A,C!50.3529, GTUC/ID~B,A!50.6833, GTUC/ID~C,D!5GTUC/ID~D,C!50.0172. Interestingly, in thiscase, the TUC/MD and GTUC/ID produced consistentsults. Both suggested that image A was more similarimage C than to images B and D, image B was more silar to image A than to images C and D, and images CD were similar to each other compared to images A andFurthermore, if we take a close look at the ID values pduced by GTUC in Table 2, we could conclude immeately that images C and D were in the same texture imclass with similar texture patterns, because the valueGTUC/ID~C,D!5GTUC/ID~D,C!, 0.0172 was very smallwhile images A and B could be considered as two sepatexture image classes, since GTUC/ID~A,C!50.3529,GTUC/ID~B,A!50.6833 were almost 20 and 40 timesthe value 0.0172. The results in Tables 1 and 2 demonsthat the ID was more reliable than the MD in termstexture discrimination, and the GTUC performed morefectively than did the TUC.
To further substantiate our conclusions drawn froTables 1 and 2, the RDPB, entropy, and RDPW were u
Table 1 Results of TUC and GTUC for the four texture images inFig. 5(b) measured by MD.
TUC
GTUC A B C D
A N/A 0.0026 0.0029 0.0023
B 0.0130 N/A 0.0059 0.0058
C 0.0153 0.0524 N/A 0.0028
D 0.0235 0.0663 0.0032 N/A
,
f
e
to evaluate the performance of TUC/MD, GTUC/MDTUC/ID, and GTUC/ID for comparative analysis. Table3–6 tabulate their results with images A, B, C, and D usas a reference image, respectively, where the smaRDPB values and the largest RDPW values are highlighand shaded for each of four reference images. As notesmaller value of RDPB yielded by one image indicates ldiscrimination between the image and the reference imaOn the contrary, a larger value of RDPW between two iages represents a more discriminatory power to discrinate the two images with respect to the reference imageshown in Tables 3–6, when the ID was used, the TUC aGTUC produced consistent results with the GTUC havbetter discriminatory powers~i.e., higher RDPW values!and less entropies. On the other hand, when MD was uthe GTUC generally performed better than the TUC wsignificant reduction of entropies and substantially bediscriminatory powers~see RDPW values in Tables 3–6!. Itshould be noted that with image D as the reference imathe TUC/MD produced the smallest RDPB for imageThis contradicted with the results produced by the GTUMD, TUC/ID, and GTUC/ID, all of which yielded thesmallest RDPB values for image D. If the results in Tab3–6 are further taken into account, the TUC/MD performthe worst among the TUC/MD, GTUC/MD, TUC/ID, anGTUC/ID.
It is also interesting to revisit image A. According tTables 1 and 2, both TUC and GTUC had difficulty widiscriminating image A from images B, C, and D. Thisbecause image A has quite different texture patterns frimages B, C, and D, as shown in Fig. 7. So, in this caimage A can be discriminated easily and should be remofrom comparison with other images. If it was used asreference image, the RDPB and RSPW values amongages B, C, and D were not consistent, as reflected in Ta3. The results in Table 3 show that TUC/MD~A,D!50.2949, GTUC/MD~A,B!50.2510, TUC/ID~A,C!
Table 2 Results of TUC and GTUC for the four texture images inFig. 5(b) measured by ID.
TUC
GTUC A B C D
A N/A 1.1002 0.6868 0.7341
B 0.7316 N/A 1.7370 1.5775
C 0.3613 1.3013 N/A 0.6615
D 0.4989 1.6178 0.2018 N/A
Table 3 RDPB, RDPW, and entropy values of TUC/MD, GTUC/MD, TUC/ID, and GTUC/ID usingimage A as the reference image.
1899Optical Engineering, Vol. 43 No. 8, August 2004

Chang and Chen: Gradient texture unit coding . . .
1900 Optical Engi
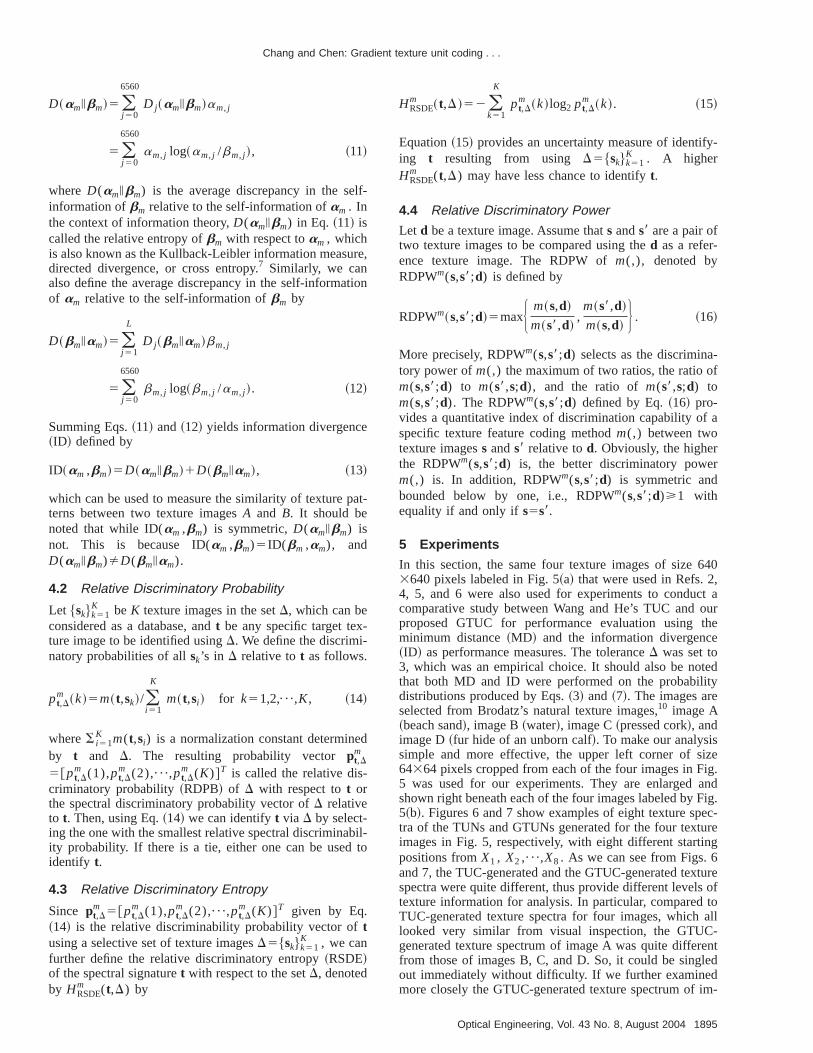
Fig. 8 Additional 11 texture images used for experiments.
Table 4 RDPB, RDPW, and entropy values of TUC/MD, GTUC/MD, TUC/ID, and GTUC/ID usingimage B as the reference image.
Table 5 RDPB, RDPW, and entropy values of TUC/MD, GTUC/MD, TUC/ID, and GTUC/ID usingimage C as the reference image.
Table 6 RDPB, RDPW, and entropy values of TUC/MD, GTUC/MD, TUC/ID, and GTUC/ID usingimage D as the reference image.
neering, Vol. 43 No. 8, August 2004
Chang and Chen: Gradient texture unit coding . . .
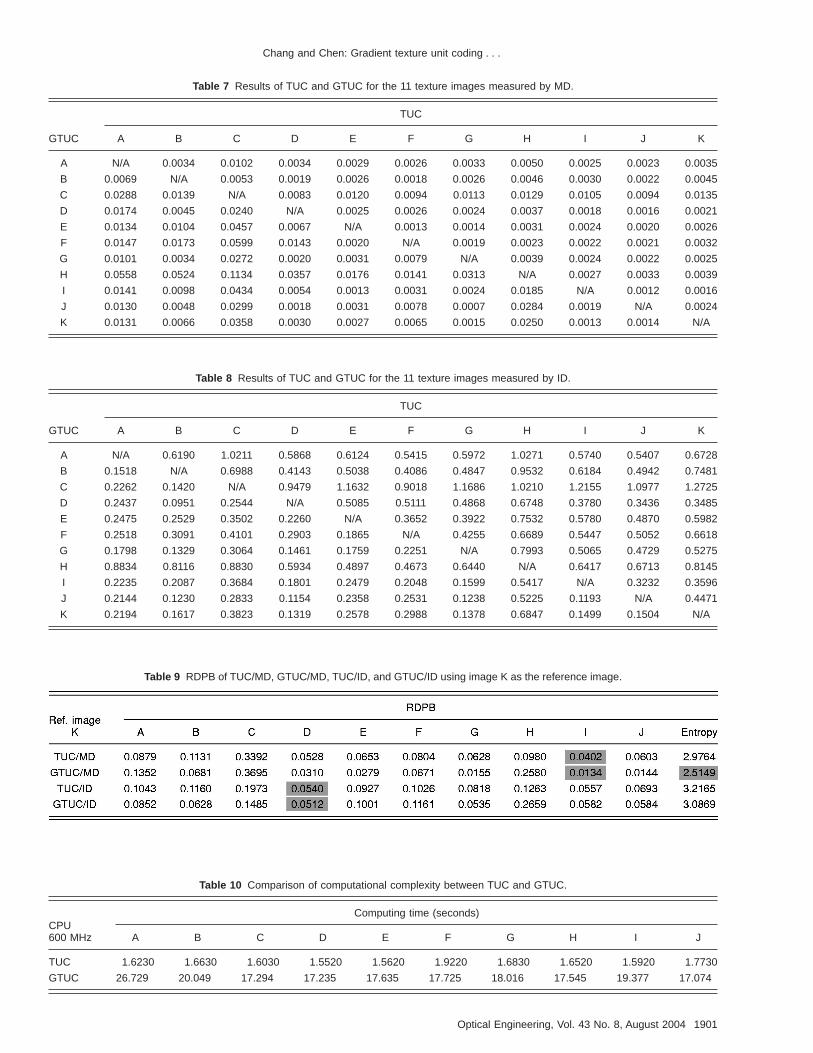
Table 7 Results of TUC and GTUC for the 11 texture images measured by MD.
TUC
GTUC A B C D E F G H I J K
A N/A 0.0034 0.0102 0.0034 0.0029 0.0026 0.0033 0.0050 0.0025 0.0023 0.0035
B 0.0069 N/A 0.0053 0.0019 0.0026 0.0018 0.0026 0.0046 0.0030 0.0022 0.0045
C 0.0288 0.0139 N/A 0.0083 0.0120 0.0094 0.0113 0.0129 0.0105 0.0094 0.0135
D 0.0174 0.0045 0.0240 N/A 0.0025 0.0026 0.0024 0.0037 0.0018 0.0016 0.0021
E 0.0134 0.0104 0.0457 0.0067 N/A 0.0013 0.0014 0.0031 0.0024 0.0020 0.0026
F 0.0147 0.0173 0.0599 0.0143 0.0020 N/A 0.0019 0.0023 0.0022 0.0021 0.0032
G 0.0101 0.0034 0.0272 0.0020 0.0031 0.0079 N/A 0.0039 0.0024 0.0022 0.0025
H 0.0558 0.0524 0.1134 0.0357 0.0176 0.0141 0.0313 N/A 0.0027 0.0033 0.0039
I 0.0141 0.0098 0.0434 0.0054 0.0013 0.0031 0.0024 0.0185 N/A 0.0012 0.0016
J 0.0130 0.0048 0.0299 0.0018 0.0031 0.0078 0.0007 0.0284 0.0019 N/A 0.0024
K 0.0131 0.0066 0.0358 0.0030 0.0027 0.0065 0.0015 0.0250 0.0013 0.0014 N/A
Table 8 Results of TUC and GTUC for the 11 texture images measured by ID.
TUC
GTUC A B C D E F G H I J K
A N/A 0.6190 1.0211 0.5868 0.6124 0.5415 0.5972 1.0271 0.5740 0.5407 0.6728
B 0.1518 N/A 0.6988 0.4143 0.5038 0.4086 0.4847 0.9532 0.6184 0.4942 0.7481
C 0.2262 0.1420 N/A 0.9479 1.1632 0.9018 1.1686 1.0210 1.2155 1.0977 1.2725
D 0.2437 0.0951 0.2544 N/A 0.5085 0.5111 0.4868 0.6748 0.3780 0.3436 0.3485
E 0.2475 0.2529 0.3502 0.2260 N/A 0.3652 0.3922 0.7532 0.5780 0.4870 0.5982
F 0.2518 0.3091 0.4101 0.2903 0.1865 N/A 0.4255 0.6689 0.5447 0.5052 0.6618
G 0.1798 0.1329 0.3064 0.1461 0.1759 0.2251 N/A 0.7993 0.5065 0.4729 0.5275
H 0.8834 0.8116 0.8830 0.5934 0.4897 0.4673 0.6440 N/A 0.6417 0.6713 0.8145
I 0.2235 0.2087 0.3684 0.1801 0.2479 0.2048 0.1599 0.5417 N/A 0.3232 0.3596
J 0.2144 0.1230 0.2833 0.1154 0.2358 0.2531 0.1238 0.5225 0.1193 N/A 0.4471
K 0.2194 0.1617 0.3823 0.1319 0.2578 0.2988 0.1378 0.6847 0.1499 0.1504 N/A
Table 9 RDPB of TUC/MD, GTUC/MD, TUC/ID, and GTUC/ID using image K as the reference image.
Table 10 Comparison of computational complexity between TUC and GTUC.
CPU600 MHz
Computing time (seconds)
A B C D E F G H I J
TUC 1.6230 1.6630 1.6030 1.5520 1.5620 1.9220 1.6830 1.6520 1.5920 1.7730
GTUC 26.729 20.049 17.294 17.235 17.635 17.725 18.016 17.545 19.377 17.074
1901Optical Engineering, Vol. 43 No. 8, August 2004

tis-Thethedoendesof
,
ths.ile
UCvi-an
ri-. In. 8re
nceandex-elyw
d 8UCtalurereurend
theer-s,,-
tedtheeyod.ultsarectly
ra-C8,r-
theagC,m-ehe
byca-kes
sd toge
ionap-
ke
tes
ixelstederseenndingec-er
ithge
nC,sise-o beesin
, etc.e’so-
s in
es
ly-
re
ec-
m,’’
trale
c--
rs
.-Iis,’’
s,’’ng
Chang and Chen: Gradient texture unit coding . . .
50.2724, GTUC/ID~A,C!50.2270 yielded the smallesRDPB values. This fact implied that image A could be mtaken for any of the three images, images B, C, and D.reason for this is because image A is so distinct fromother three images that using it as a reference imagenot do any good in discrimination among images B, C, aD. However, if a complete spectrum of the RDPB valuwas taken into consideration, the three RDPB valuesimages B, C, and D for TUC/MD, GTUC/MD, TUC/IDand GTUC/ID were ~0.3333, 0.3718, 0.2949!,~0.2510, 0.2954, 0.4537!, ~0.4364, 0.2724, 0.2912!, and~0.4596, 0.2270, 0.3134!, respectively, where the TUC/MDgenerated three very close RDPB values compared toGTUC/ID that produced the most distinct RDPB valueFrom this aspect, the GTUC/ID performed the best, whthe TUC/MD was the worst.
To have a fair comparison between Wang and He’s Tand our GTUC, the four texture images used for our preous experiments were the same ones used in WangHe’s work in Refs. 2, 4, 5, and 6. However, similar expements can be also carried out for any texture imagedoing so, 11 texture images labeled A through K in Figwere randomly selected from Brodatz’s natural textuimages,10 where the image K was chosen as a refereimage to calculate the RDPB for comparison. Tables 78 tabulate the results of TUC and GTUC for these 11 tture images measured by the MD and the ID, respectivSince the image K was used as a reference image,looked at the last rows and last columns of Tables 7 anto compare the performance of the TUC and the GTusing the MD and the ID. Interestingly, the experimenresults provided evidence that the two distance measMD and ID performed differently, even though they weimplemented in conjunction with the same texture featcoding method. According to Tables 7 and 8, the TUC aGTUC identified the image I~highlighted values! as theone closest to image K using the MD, compared toimage D~highlighted values! identified to be closest to thimage K by the TUC and the GTUC using the ID. To futher evaluate their relative discriminatory probabilitieTable 9 tabulates the RDPB of the TUC/MD, GTUC/MDTUC/ID, and GTUC/ID using image K as a reference image, where their respective entropies were also calculaAs we can see from this table, the ID always yieldedsmaller RDPB and entropy than the MD did when thwere implemented with the same texture coding methSince the tables for the RDPW are too large, their resare not included in this work. Nevertheless, those whointerested in the RDPW can compute their values direfrom Tables 7 and 8.
To conclude this section, Table 10 provides a compative analysis on the computational complexity of the TUand GTUC calculated for the 11 texture images in Fig.where a Pentium III PC with 600 MHz was used for peformance evaluation. As documented in Table 10,GTUC required about 17 to 26 sec to generate each imcompared to about 1.5 to 2.0 sec required by the TUwhich is about 15 times in seconds in computational coplexity. This additional computing time is attributed by thcomputation of the gradient texture feature matrix for tGTUC.
1902 Optical Engineering, Vol. 43 No. 8, August 2004
s
e
d
.e
s
.
e
6 Conclusions
The concept of the texture spectrum recently proposedWang and He has found applications in pattern classifition. It can be considered as a transform coding that mause of a 333 texture unit~TU! to convert texture patternof an image to various texture numbers that can be useform a texture spectrum in the same way that an imagray-level histogram is created in histogram equalizatfor image enhancement. This work presents a newproach, called gradient texture unit coding~GTUC! that isderived from Wang and He’s texture unit approach. UnliWang and He’s texture unit coding~TUC! that encodes thegray-level changes between the seed~center! pixel and oneof its adjacent pixels in a texture unit, the GTUC generagradient texture numbers~GTUNs! that dictate gray-levelchanges between the seed pixel and its two adjacent pin a texture unit. As a result, the GTUC can be interpreas a gradient of Wang and He’s texture unit numb~TUNs! because it captures the gray-level changes betwtwo TUNs. Interestingly, both the Wang and He’s TUC athe GTUC results in the same range of their correspondtexture unit numbers from 0 to 6560. Therefore, their sptra can be normalized to probability vectors and furthmeasured by information divergence in conjunction wother criteria recently developed in hyperspectral imaanalysis.8,9 The main contributions of this work focus othe introduction of a new texture coding method, GTUand exploration of the TUC and GTUC in texture analyfrom an information theory’s point of view. The results prsented are only based on texture analysis. They can alsimplemented in conjunction with classification techniquto perform texture classification and pattern recognitionvarious areas such as medical imaging, remote sensingOne such example using the concept of Wang and Htexture spectrum and TUC is mass detection in mammgrams, where texture features provide crucial elementclassification.11,12 A new application of our GTUC to thisarea is currently under investigation.
References
1. R. M. Harlaick, K. Shanmugam, and I. Dinstein, ‘‘Textural featurfor image classification,’’IEEE Trans. Syst. Man Cybern.3~6!, 610–621 ~1973!.
2. L. Wang and D. C. He, ‘‘A new statistical approach to texture anasis,’’ Photogramm. Eng. Remote Sens.56, 61–65~1990!.
3. Gonzalez and R. E. Woods,Digital Image Processing, Addison-Wesley, Reading, MA~2002!.
4. D. C. He and L. Wang, ‘‘Texture unit, texture spectrum and textuanalysis,’’IEEE Trans. Geosci. Remote Sens.28~4!, 509–512~1990!.
5. L. Wang and D. C. He, ‘‘Texture classification using texture sptrum,’’ Pattern Recogn.23~8!, 905–910~1990!.
6. D. C. He and L. Wang, ‘‘Texture features based on texture spectruPattern Recogn.24~5!, 391–399~1991!.
7. T. Cover and J. Thomas,Elements of Information Theory, John Wileyand Sons, New York~1991!.
8. C.-I Chang, ‘‘An information theoretic-based approach to specvariability, similarity and discriminability for hyperspectral imaganalysis,’’IEEE Trans. Inf. Theory46~5!, 1927–1932~2000!.
9. C.-I Chang,Hyperspectral Imaging: Techniques for Spectral Detetion and Classification, Chap. 2, Kluwer Academic/Plenum Publishers, New York~2003!.
10. P. Brodatz,Texture—A Photographic Album for Artists and Designe,Reinhold, New York~1968!.
11. S. M. Guo, P. S. Liao, Y. C. Liao, S. C. Yang, P. C. Chung, and CChang, ‘‘Mass detection in mammography using texture analysChinese J. Radiology28~3!, 149–157~2003!.
12. Y. Liao, ‘‘Mass detection in mammography using texture analysiMS Thesis, Dept. of Information Engineering, National Cheng KuUniv., Tainan, Taiwan~2002!.

Chang and Chen: Gradient texture unit coding . . .
Chein-I Chang received his BS degreefrom Soochow University, Taipei, Taiwan,MS degree from the Institute of Mathemat-ics at National Tsing Hua University, Hsin-chu, Taiwan, and MA degree from the StateUniversity of New York at Stony Brook, allin mathematics. He also received his MSand MSEE degrees from the University ofIllinois at Urbana-Champaign and PhD de-gree in electrical engineering from the Uni-versity of Maryland, College Park. He has
been with the University of Maryland, Baltimore County (UMBC)since 1987, as a visiting assistant professor from January 1987 toAugust 1987, assistant professor from 1987 to 1993, associate pro-fessor from 1993 to 2001, and professor in the Department of Com-puter Science and Electrical Engineering since 2001. He has threepatents and several pending patents on image processing tech-niques for hyperspectral imaging and detection of microcalcifica-tions. His research interests include automatic target recognition,
multispectral/hyperspectral image processing, medical imaging, andvisual information systems. He authored a book, Hyperspectral Im-aging: Techniques for Spectral Detection and Classification, pub-lished by Kluwer Academic/Plenum Publishers. He is a senior mem-ber of IEEE and a member of Phi Kappa Phi and Eta Kappa Nu.
Yuan Chen received the BS degree inelectrical engineering from Southeast Uni-versity in 2001, and MS degree in electricalengineering from the University of Okla-homa in 2003. She is currently pursuingher PhD degree in the Department of Com-puter Science and Electrical Engineering,University of Maryland, Baltimore County.Her research interests include image pro-cessing, medical imaging, and pattern rec-ognition.
1903Optical Engineering, Vol. 43 No. 8, August 2004