graduate business school - gupea: home · pdf filegraduate business school logistics and...
TRANSCRIPT

Graduate Business School
Logistics and Transport Management Master Thesis No 2005:62
Supervisor: Lars Mossfelt
Environmental performance calculations for the
Port of Gothenburg - Emissions to the air from Road transports
Elena Medin and Zuo Mo

I
Acknowledgements By this acknowledgement we would like to express our gratitude to all the people who helped us with this study. First of all we would like to thank our tutor Professor Lars Mossfeldt, Tema Stad & Trafik, Chalmers University of Technology, for his guidance, advices and help through the research. We would like to thank Bengt Cederman, Safety and Environment, Skandia Harbour, and Björn Sigström, Environmental Controller, Stab Miljö, who have been very helpful and responsible for our study. We would like to express our thanks to Jan Brandberg, Plan och trafik, Miljö Göteborg, for paying attention to our study. We appreciate his professionalism that played an important role in making this study completed. We are grateful for recommendations from Professor Magnus Blinge, Institutionen för logistik och transport, Chalmers, and Jonas Tornberg, Research Assistant, GIS Manager, Department of Urban Traffic and Land Use, Chalmers University of Technology. We would like to thank Violeta Roso, Ph.D. Student, Department of Logistics and Transportation, Chalmers University of Technology, and Rickard Bergqvist, Ph.D Student, Handelshögskolan vid Göteborgs universitet for their useful information for the present study. Finally, we thank all the haulage companies involved in this study for providing us with the initial data in use. Elena Medin Zuo Mo Gothenburg, January 2006

II
Abstract Port of Gothenburg AB and the port conduct the business that requires a permit under the Environmental Code. The most important environmental impact of the business is noise and emissions to the air, ground and water. The purpose of this research was to calculate the emissions to the air caused by the road haulage companies dealing with the Port of Gothenburg. The calculations formed the basis for analyzing the extent to which these road transports effect the environment inside Gothenburg city and its surroundings. The most popular roads used by the transports to and from the port were presented and the negative contributions to the environment in the surrounding areas were stated. The calculations were based on the methodologies and procedures from the Swedish authority of Network for Transport and the Environment (www.ntm.a.se) and real operational data were applied in order to carry out the calculations. In the conclusion an analysis was made as to whether or not the above mentioned road transports had a considerable effect on the environment of the studied area, and what could be done for the balance between the growing business of Port of Gothenburg, and the environmentally strong link in the logistics chains of the port. Some proposals for reducing the negative impacts such as a dry port located in a more environmentally tolerant area may be a topic for further research. Key words: Environmental Code; emissions to the air; environmental impact of the business; environment assessment; Euro Class; dry port

III
Table of contents 1 Introduction ........................................................................................................................... 1
1.1 Background ...................................................................................................................... 1 1.1.1 Port of Gothenburg.................................................................................................... 1 1.1.2 Access by road ......................................................................................................... 1
1.2 Purpose ............................................................................................................................. 2 1.3 Problem definitions .......................................................................................................... 2
1.3.1 The aims of Swedish Environmental Code ............................................................... 2 1.3.2 The Port of Gothenburg and Swedish Environmental Code ..................................... 3 1.3.3 Research Questions ................................................................................................... 3
1.4 Delimitations .................................................................................................................... 4 2 Methodology ......................................................................................................................... 5
2.1 Research Design – Quantitative vs. Qualitative............................................................... 5 2.1.1 Quantitative research methods .................................................................................. 5 2.1.2 Qualitative research methods .................................................................................... 5
2.2 Research category ............................................................................................................ 5 2.2.1 Descriptive research .................................................................................................. 5 2.2.2 Causal research.......................................................................................................... 6
2.3 Deduction and induction .................................................................................................. 6 2.4 Data collection: Primary and secondary data ................................................................... 6
2.4.1 Primary data .............................................................................................................. 6 2.4.2 Secondary data .......................................................................................................... 8 2.4.3 Data mining and the impact of missing data ............................................................. 8
2.5 Validity and Reliability - Evaluation criteria ................................................................. 12 2.5.1 Validity.................................................................................................................... 12 2.5.2 Reliability ................................................................................................................ 12
3 Theoretical framework ....................................................................................................... 14 3.1 Environmental issues in Logistics and Transport Management..................................... 14
3.1.1 Environmental issues at international level............................................................. 14 3.1.2 Swedish Transport Policy and Environmental Issues in Sweden ........................... 15 3.1.3 Environmental issue and the Port of Gothenburg ................................................... 16
3.2 Environmental handling in logistics............................................................................... 16 3.2.1 Approaches towards mitigating environmental impact from logistics.................... 16 3.2.2 Logistics decisions that affect the environment ...................................................... 17 3.2.3 Factors influencing the shipper’ environmental practice ........................................ 18
3.3 Methods and calculations of impacts on environment ................................................... 18 3.3.1 Impacts on the environment from road transports .................................................. 18 3.3.2 LCA method............................................................................................................ 20 3.3.3 NTM........................................................................................................................ 21 3.3.4 Routes distance calculation with help of GIS methodology ................................... 22
4 Empirical Study: Case Port of Gothenburg ..................................................................... 23 4.1 Data collection: Primary and secondary data ................................................................. 23
4.1.1 Questionnaire design ............................................................................................... 23 4.1.2 Sample frame and respondents................................................................................ 23 4.1.3 Secondary data ........................................................................................................ 24
4.2 Missing data processing ................................................................................................. 24 4.3 Calculation of emissions from the Port .......................................................................... 24
4.3.1 Prerequisite statements and assumptions ................................................................ 25 4.3.2 Calculation descriptions .......................................................................................... 25

IV
4.3.3 Type of Vehicles ..................................................................................................... 25 4.3.4 Fuel consumption and emissions factors................................................................. 26 4.3.5 Routes and distances ............................................................................................... 27 4.3.6 Calculation of total trips.......................................................................................... 30 4.3.7 Full-Loaded and empty-Loaded rate ....................................................................... 32 4.3.8 Calculation example of one route............................................................................ 32 4.3.9 Re-allocation of emissions ...................................................................................... 35
4.4 Emissions from the Port traffic ...................................................................................... 37 4.5 Emissions from the city traffic ....................................................................................... 37
5 Analysis ................................................................................................................................ 39 5.1 Comparison of emissions from the Port and the City .................................................... 39 5.2 Share of emissions on each route ................................................................................... 40 5.3 Percentage of emissions on each route........................................................................... 44 5.4 Containers haulage versus trailer haulage...................................................................... 45 5.5 The cost of emissions for society ................................................................................... 46 5.6 Reliability and validity ................................................................................................... 47
6 Recommendations ............................................................................................................... 48 6.1 Dry port .......................................................................................................................... 48
6.1.1 Dry port concept...................................................................................................... 48 6.1.2 Emissions reduction by implementation of dry port ............................................... 48
6.2 New types of engines ..................................................................................................... 49 6.3 Exhaust gas reduction techniques .................................................................................. 50 6.4 NTM calculation ............................................................................................................ 51 6.5 Shift to alternative routes ............................................................................................... 53
7 Conclusion............................................................................................................................ 54 8 References ............................................................................................................................ 55 9 Appendix .............................................................................................................................. 57
9.1 Questionnaire ................................................................................................................. 57
V
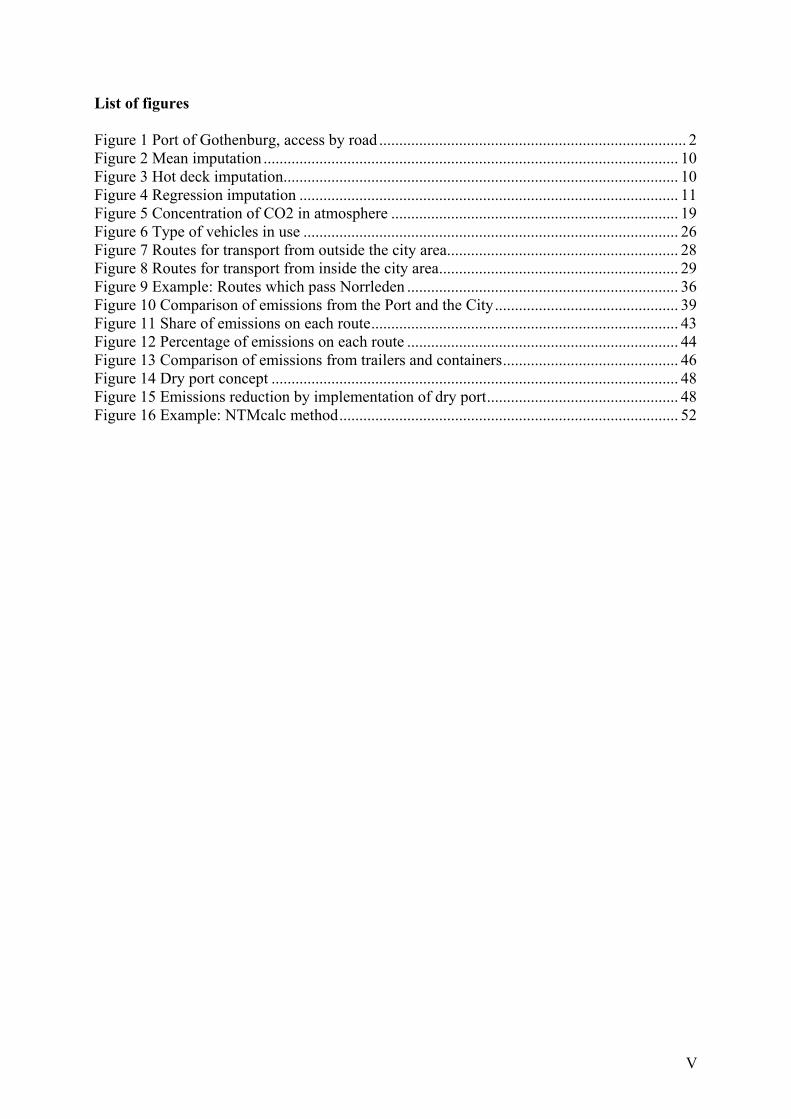
List of figures Figure 1 Port of Gothenburg, access by road ............................................................................. 2 Figure 2 Mean imputation ........................................................................................................ 10 Figure 3 Hot deck imputation................................................................................................... 10 Figure 4 Regression imputation ............................................................................................... 11 Figure 5 Concentration of CO2 in atmosphere ........................................................................ 19 Figure 6 Type of vehicles in use .............................................................................................. 26 Figure 7 Routes for transport from outside the city area.......................................................... 28 Figure 8 Routes for transport from inside the city area............................................................ 29 Figure 9 Example: Routes which pass Norrleden .................................................................... 36 Figure 10 Comparison of emissions from the Port and the City.............................................. 39 Figure 11 Share of emissions on each route............................................................................. 43 Figure 12 Percentage of emissions on each route .................................................................... 44 Figure 13 Comparison of emissions from trailers and containers............................................ 46 Figure 14 Dry port concept ...................................................................................................... 48 Figure 15 Emissions reduction by implementation of dry port................................................ 48 Figure 16 Example: NTMcalc method..................................................................................... 52

VI
List of tables Table 1 Delimitations of the study ............................................................................................. 4 Table 2 Logistic decisions effect the environment................................................................... 17 Table 3 General calculation strategy by NTM......................................................................... 21 Table 4 Response rate of the questionnaire.............................................................................. 24 Table 5 Hot deck imputation result .......................................................................................... 24 Table 6 Description of calculation steps .................................................................................. 25 Table 7 Fuel consumption factors for the selected vehicles..................................................... 26 Table 8 Emissions factors for the selected vehicles types ....................................................... 26 Table 9 Distances in use........................................................................................................... 30 Table 10 Total trips per year for container and trailer transport .............................................. 30 Table 11 Number of trips on each route from outside the city ................................................ 31 Table 12 Number of trips on each route from inside the city .................................................. 31 Table 13 Calculation example of one route ............................................................................. 32 Table 14 Example: Allocation of trips on each Euro class ...................................................... 33 Table 15 Example: Emissions from the full-loaded containers on route Lundbyleden ........... 33 Table 16 Example: Total emissions from full/empty loaded containers and trailers............... 34 Table 17 Example: Total emissions on one route .................................................................... 35 Table 18 Example: re-allocation of the emissions ................................................................... 36 Table 19 Emissions from the road transport to and from the Port of Gothenburg................... 37 Table 20 Emissions from the city road traffic.......................................................................... 38 Table 21 Share of emissions on each route .............................................................................. 40 Table 22 Percentage of emissions on each route...................................................................... 44 Table 23 Comparison of emissions from trailers and containers ............................................. 45 Table 24 Cost of emissions in monetary unit ........................................................................... 46 Table 25 Total cost to the society............................................................................................. 46 Table 26 Percentages of different Euro classes engines in use ................................................ 49 Table 27 Emissions reduction by implementation of new types of engines ............................ 50 Table 28 Exhaust gas reduction techniques ............................................................................. 51

1
1 Introduction
1.1 Background
1.1.1 Port of Gothenburg The Port of Gothenburg is Scandinavia’s largest hub for sea transport. It is the main port of Sweden. Its position in the heart of Scandinavia means that 70% of the population, and all industry, lie within a radius of 500 kilometres or six hours by car.1 In the 2004 the Cargo turnover of the Port of Gothenburg was 36.9 million tonnes; container turnover exceeded 731,000 TEUs per year, flats and cassettes included. (Port of Göteborg AB, 2004). The Port of Gothenburg includes the following terminal:
• The Container Terminal • The Ro/Ro Terminal • The Oil Terminal • The Car Terminal • The ferry and Cruise Terminal
The Container Terminal accounts for the largest share of the business of the port.
1.1.2 Access by road 2 The Port of Gothenburg is linked to its hinterland by two motorways, the E6 (from the north and south) and the E20 (from the north-east). National Highway 40 (from the east) is of motorway standard, while National Highway 45 (from the north/north-east) is a dual carriageway. In Gothenburg, the River Göta is crossed by four road bridges and one road tunnel. There are ring roads from several directions leading to the main port facilities.
1 Port of Göteborg, Annual report 2003 2 www.portgot.se

2
Figure 1 Port of Gothenburg, access by road About 70% of the cargo is transported by trucks to inland destinations (Port of Göteborg AB, 2003). There are approximately 65 transport companies involved in container haulage of cargo dealing with the Port of Gothenburg in the current year. Approximately, companies specialised in trailer transports are contractors of the port.
1.2 Purpose
The main purpose of this study is: To determine the extent to which the Port of Gothenburg contributes to the air pollution of Gothenburg region. The first step of the study is to provide the Port of Gothenburg with the real emissions data that the road cargo transport to and from the Port accounts for. The next step of the study is to compare these emissions with the total air pollutions of the total road traffic of the city. The calculations are made for the main routes used by the road transports to/from the Port of Gothenburg. The most polluted road/directions are to be determined. At the end of study the possible recommendations of researchers regarding the possible measures of environmentally friendly positioning of the Port are to be presented.
1.3 Problem definitions
1.3.1 The aims of Swedish Environmental Code
The Swedish Environmental Code (“miljöbalken” in Swedish) which came in force on the 1st of January, 1999, requires that all the major Swedish ports obtain operational permits from Country Administration by the end of 2005. Approval of permits depends on the directive on the Environmental Impact Assessments (EIA) of the EC (European Community). Swedish Environmental Code makes a revolution change in the guidelines of many companies. The time when economists of the company were only concentrated on obtaining

3
maximum profits for their company is over. Swedish Environmental Code places enforceable controls on business operations, and applys the polluter pays principles (PPP) to protect the environment. Public authorities back the Environmental Code by regional and sector regulation. Environmental Quality Standards (EQS) are regulations that control and put some limits on the level of polluting factor in ground, water and air according to EC directives.
1.3.2 The Port of Gothenburg and Swedish Environmental Code The goals of EIA are to identify the impact and consequences of port activities on peoples’ health and the environment. 3 The Port is required to collect information and present the result of researches regarding both direct impact of the Port activities and indirect impacts of ships, trucks etc. operating for the Port in the vicinity of the Port even though the Port of Gothenburg cannot directly control the activities of the other companies. The researches to be made were/are: Studies on air quality, noise and a risk assessments of the territory which belongs to the Port itself. ( The study of assessment of air pollution on the territory of the Port was made by Göteborgs city authority Miljöförvaltningen in 2005.4 ) Studies on air quality, noise and a risk assessments of the area which does not include the Port territory and which is limited by Gothenburg region’s boundaries. Recommendations should be made of any possible mitigational measures.
1.3.3 Research Questions
The main aim of this case study is to calculate air emissions as HC, CO2, SOx, PM, CO, CH4, NOx produced by the lorries dealing with the Port, and operating in the vicinity of the Port.
3 Port of Göteborg, 2003 4 Göteborgs Stad Miljöförvaltningen, 2005

4
1.4 Delimitations
Subject descriptions
The present case conditions Factors neglected for the present case and comments
Study area Gothenburg region, 14 routes from outside the city
1. E6: 1 Norrleden 2. E6: 2 Lundbyleden / Lundbytunneln 3. Rv 45: 1 Jordfallsbron/Norrleden 4. Rv 45: 2 Jordfallsbron/Lundbyleden 5. Rv 45: 3
Tingstadstunneln/Lundbyleden 6. Rv 45: 4
Oscarsleden/Älvsborgsbron 7. E20 norr: 1
Tingstadstunneln/Lundbyleden 8. E20 norr: 2
Oscarsleden/Älvsborgsbron 9. Rv 40: 1
Gårdaleden/Tingstadstunneln/Lundbyleden
10. Rv 40: 2 Gårdaleden/Oscarslede/Älvsborgsbron
11. E6/E20 Söder: 1 Söderleden/Älvsborgsbron
12. E6/E20 Söder: 2 13. Säröleden/Älvsborgsbron 14. E6/E20 Söder: 3
Gårdaleden/Oscarsleden/Älvsborgsbron
15. E6/E20 Söder: 4 Gårdaleden/Tingstadstunneln/Lundbyleden
5 routes inside the city 16. Lundbyleden 17. Norrrleden 18. Oscarsleden 19. Öckeröleden 20. Söderleden
Other routes inside the city. Three routes are actually not used by any companies investigated. E20 norr: 2 Oscarsleden/Älvsborgsbron Rv 40: 2 Gårdaleden/Oscarslede/Älvsborgsbron E6/E20 Söder: 3 Gårdaleden/Oscarsleden/Älvsborgsbron Comment: route E6/E20 Söder: 1 Söderleden/Älvsborgsbron and route Söderleden from inside the city are actually the same one. But the emissions from transport from outside city and inside the city are calculated seperately and then summed up together.
Types of vehicles
Two types of trucks, first one for the haulage of trailers, second one for the haulage of containers.
Other types of trucks used for the transportation to the port. Comment: The first type of trucks are also used by some companies to carry containers, in this study it is only the second one that is used in calculation of emission from container haulage.
Survey of companies
46 most companies according to the Port’s list Some other companies dealing with the Port
Table 1 Delimitations of the study

5
2 Methodology
In this chapter the research methodology that is used to accomplish the goal of the present case is presented. Bergqvist and Esping give the next definition of research methodology: “…the method is a tool used to retrieve new knowledge, i.e., the research plan is the basic plan that guides the data collection and analysis phases of the research project.”5
2.1 Research Design – Quantitative vs. Qualitative
2.1.1 Quantitative research methods
Quantitative research involves asking and obtaining answers to questions through conducting surveys of people by using questionnaires and interviews. Often, responses are compared with “hard data”, such as the total cost of a construction project. Survey techniques, such as questionnaires, interviews etc., are highly labour-intensive on the part of respondents, and particularly on the part of the researcher, while a further consequence is the low response rate according to Fellows6. Quantitative research methods underline the variable as a central part of research; the following analysis is made in the form of an organised, compressed assembly of information as table, charts that permit conclusion drawing and action. Quantitative data analysis often deals with statistical data analysis techniques.
2.1.2 Qualitative research methods
Qualitative data is a source of well-grounded, rich descriptions and explanations of processes in identifiable local contexts. With qualitative data one can preserve chronological flow, see precisely which events led to which consequences, and derive fruitful explanations. Qualitative research may be conducted in dozens of ways, many with long traditions behind them. As Neuman states7 in qualitative research the data is usually in the form of words, sentences, and paragraphs rather than numbers.
Quantitative research methods are used much more in the present study. The conclusions are based on real numbers, multiple tables and graphs. Hot deck statistical method is presented in the study.
2.2 Research category
2.2.1 Descriptive research
Purpose: To describe the characteristics of a set of objects, with the purpose of providing an accurate picture of some aspect of the business environment. Hypothesis will exist but it may be tentative in nature and the relationships studied will not be casual in nature.8 Methods:
5 Bergqvist R. and Esping P, 2002, p.107 6 Fellows and Liu, 1997 7 Neuman W.L., 1997, p 329 8 Nouf Al-Iryani and Thomas Gassin, 2004, p.14

6
• Cross-sectional studies (interview and questionnaires) • Longitudinal studies (based on secondary information, for ex. public statistics or
interviewing of the same group at the different locations)
2.2.2 Causal research
Purpose: To establish cause and effect relationships (how changes of X effects Y). Research hypotheses, which are designed to develop, extend or refute an already established body of knowledge, are integral to this approach. Methods:
• Priority 1: True experiments (randomised experiment & various type of control: experimental group vs control group)
• Priority 2: Partial experiment (similar groups) • Priority 3: Explanative interviews
The present research could be classified as descriptive research.
2.3 Deduction and induction
Up to now researchers have distinguished between inductivist and hypothetico-deductive research on the basis of the presence or absence of theory. In the deductivist tradition the researcher starts “... with an abstract, logical relationship among concepts then move(s) towards concrete empirical evidence” as Neuman9 claims. Thus in deductivist research there is a well-established role for existing theory since it informs the development of hypotheses, the choice of variables, and the resultant measures which researchers intend to use. In a deductive approach logical relationship comes as first and central for the researcher. In the inductive tradition ideas first appear and then, the researcher tries to connect the ideas in the theory. The theory is tested against the ideas. The present case: The pre-determined theoretical methodology is used for this case study that leans towards the following deductive approach.
2.4 Data collection: Primary and secondary data
The collection of appropriate data is the first stage of any quantitative analysis. Such data can be collected in many ways, including the following methods:
2.4.1 Primary data
In the absence of existing data, information is collected with a specific purpose in view. One of obvious methods of collecting the so-called primary data involve the use of
9 Neuman, 1997, p. 46

7
• Survey or questionnaire
They will be at its best when getting a snapshot of the current state of affairs in a given group or population, what researchers call descriptive work. Questionnaires could be structured and unstructured. As Nouf10 claims the structured questionnaire has next types of response formats:
• Open-ended format: the respondent is free to answer in the way he likes within the limits of the questions.
• Multi-choice response: the respondent is supposed to choice from among the number of pre-specified responses.
• Dichotomous response: the yes and no responses are allowed as a choice response • Interviews: Interviews are often used in preference to questionnaires when sensitive
information is to be collected. Interviews are more time consuming and expensive approach to data collection
• Observation: Observation are used when the situation lend themselves to the use of observation.
Advantages of primary data
Mail and self-Administered Questionnaire
• Researcher can give questionnaires directly to respondents or mail them to respondents who read questions, then record their answers
• This type of survey is by far cheaper • The respondent can complete the questionnaire when it is convenient • Mail questionnaires offers anonymity and avoid interview bias
Face-to-Face Interviews
• They have the highest response rates and permit the longest questionnaire
Disadvantages of primary data
Mail and self-Administered Questionnaire
• The biggest problem with mail questionnaires is a low response rate; • Researcher cannot control the conditions under which a mail questionnaire is
completed • No one is present to clarify questions
Face-to-Face Interviews
• High cost is the biggest disadvantage of face-to face interview • The appearance, tone of voice, question wording of the interviewer may affect the
respondent
10 Nouf Al-Iryani and Thomas Gassin, 2004, p.19

8
2.4.2 Secondary data
Internal information Companies records on production, sales and personnel may contain the required data; such information is increasingly likely to be stored as part of computerised company database. External information Local government statistics, marketing survey reports and company reports may be of use in obtaining the required information. According to Thomas11data obtained from such sources are referred to as secondary data since they have not been collected with a specific purpose in mind. Advantages of secondary data
• It is relatively inexpensive method to get the data for researchers • It permits comparisons across groups and time • It permits asking about the issues not thought of by the makers of company reports
Disadvantages of secondary data
• A common problem in existing statistics is finding the appropriate units of analysis • Researcher depends on accuracy of the data collected by the others • Sometimes the data were collected but have been lost
The present case: Collecting data
The next sources for the case study are used: • Company’s records and documentation • Questionnaires • Observations • Interviewing of the personnel of the company • External information: Statistics and documents of local authorities (Miljöförvaltning,
Gothenburg city)
2.4.3 Data mining and the impact of missing data
As in Newman12, Researchers translate a research problem into questionnaires, then use these with respondents to create data. Survey researches involve other people-respondents- who answer to questions. From the answers, the researchers create quantitative data that he or she analyzes to address to research problem. Survey researchers try to minimize errors, but survey data often contain them. Errors can arise in sampling frames, from non response and from question wording or order. There are some solutions regarding missing or inconsistent data:
• Use of complete data only
11 Thomas R., 1997, p 3 12 Newman W.L., 1997, p.265

9
• Deleting selected cases or variables • Data imputation • Model-based approaches
These categories13 are based on the randomness of the missing data and how the missing data is estimated and used for replacement. The above methods could be described as bellow: Use of complete data only:
One of the most direct and simple methods of addressing missing data is to include only those values with complete data. Delete selected cases or variables:
The simple deletion of data that contains missing values may be utilized when a non-random pattern of missing data is present. Imputation methods for missing data:
Imputation methods are literally methods of filling in missing values by attributing them to available data. Commonly used imputation methods include:
• Case substitution A researcher with complete knowledge of the data (and its history) should have the authority to replace missing data with values from previous research.
• Mean substitution This type of imputation is accomplished by estimating missing values by using the mean of the recorded or valuable values. However, it is important to calculate the mean only from responses that have been proven to be valid and are chosen from a population that has been verified to have a normal distribution.
13 Marvin L. and John F., 2003

10
Figure 2 Mean imputation
• Hot deck imputation Hot deck imputation replaces missing values with values drawn from the next most similar case. This method is very common in practice.
Figure 3 Hot deck imputation
• Cold deck imputation With this method, the end user substitutes a constant value derived from external sources or from previous research for the missing values. Unfortunately, feasible values are not always provided using cold deck imputation methods.
• Regression imputation Regression analysis is used to predict missing values based on the variable’s relationship to other variables in the data set. The first step consists of identifying the independent variables

11
and the dependent variables. In turn the dependent variable is regressed on the independent variables. The resulting regression equation is then used to predict the missing values.
Figure 4 Regression imputation
• Multiple imputation This method combines a number of imputation methods into a single procedure. The present case: Missing data solutions In the present case the next steps for dealing with missing data could be distinguished:
• Use of complete data only (19 respondents)
Weaknesses:
Ignore possible systematic differences between complete cases and in-complete cases.
Standard Errors will generally be larger in the reduced sample because less information is
utilized.
Get biased estimates if the reduced sample is NOT a random sub-sample of the original
sample.
• Deleting selected cases or variables (1 respondent)
Strengths:
– Computation process is quick and easy
– Can be used with any statistical analysis
Weaknesses:

12
A large amount of data could be lost
Decrease sample size, and thus, reduces statistical power
• Hot deck imputation (method was applied to 6 respondents with incomplete data) Strengths:
– Keeps from loosing data
– Calculation process is easy
Weaknesses:
In general, Single Imputation results in the sample size being over-estimated with the
variance and standard errors being underestimated.
2.5 Validity and Reliability - Evaluation criteria
Any review of research methods will be incomplete without considering the fundamental issues relating to evaluation of any research outcomes. The technical language of such research evaluation includes terms such as validity, reliability and generalisability.
2.5.1 Validity For a given problem, validity is one of the concepts used to determine how good an answer is provided by research.14 It means in essence that a theory, model, concept, or category describes reality with a good fit. In research methodology literature, the measure of validity is often considered under either internal or external.
• Internal validity refers to whether or not what are identified as the causes actually produce what has been interpreted as the “effect” or “responses” and checks whether the right cause-and-effect relationships was established validity.
• External validity criterion refers to the extent to which any research findings can be generalised beyond the immediate research sample or setting in which the research took place; thus the extent to which findings drawn from studying one group are applicable to other groups or settings (the applicability of findings beyond the group).
2.5.2 Reliability The goal of reliability is to minimise the errors and biases in a study. The object is to ensure that, if a later investigator followed exactly the same procedures, the same findings and conclusions would result. Yin claims15 that ‘to increase the reliability of the information in a case study it is important to maintain a chain of evidence’.
14 Dilanthi Amaratunga, 2005 15 Yin K, 2004, p.98

13
First, the report itself should have sufficient citation to the relevant portion of the case study database. Second, the database, upon inspection, should reveal the actual evidence and also indicate the circumstances under which the evidence was collected - for example, the time and place of an interview. Finally, a reading of protocol should indicate the link between the content of protocol and the initial study questions. From the above discussion, it can be seen that the basic difference between reliability and internal validity is that reliability deals with the data collection process to ensure consistency of results, while internal validity focuses more on the way such results support conclusions according to Then16. It should also be noted that the above deliberation refers very much to the traditional evaluation criteria of validity and reliability that are governed by the convention of the quantitative research paradigm. The present case: Data analyses As the study is based on the data sources from the questionnaires which were sent to the companies the result might contain uncertainly. It could be explained uncertainly by the impact of missing or inconsistent data which has been a pervasive problem in data analysis since the origin of data collection. The high percent of response to the questionnaires of the study create the ground on which some assumptions are made. The initial calculation are made by the use of complete data only (questionnaires that contains missing data are neglected). Then hot deck imputation statistical method is applied.
16 Then, 1996, unpublished thesis

14
3 Theoretical framework Until recently, transport companies have mainly concentrated on price, quality and service. Now, however, transport procures are paying more and more attention to environmental aspects, and are changing their demands to the transporters. One of the procures of good transportation is the Port of Gothenburg which is trying to create “an environmentally strong link in the logistics chain” in the work with their contractors. Why and how transport procures and haulage companies could be scrutinised from an environmental point of view?
3.1 Environmental issues in Logistics and Transport Management
3.1.1 Environmental issues at international level
3.1.1.1 EU White pages guidelines
The connection between economically growth and transport growth is something both national governments and the EU have recently been focusing on, it is a connection that has not been much investigated in research. According to Leif Enarsson17 it is generally acknowledged that not always and not everywhere (but probably sometimes) do the individual modes of transport pay for the costs they generate. The situation differs from one member state to another. As a result, there is doubt about real insensitivity to use the cleanest mode or the least congested networks. Because of these, the Commission has developed the following guidelines in the “White Paper”. Harmonising of fuel taxation for commercial users, particularly in road transport. Alignment
of the principles for charging for infrastructure use; the integration of external costs must
also encourage the use of modes of lesser environmental impact and, using the revenue raised
in the process, allow investment in new infrastructure, as proposed by the European
Parliament in the Costa Report.
Integrating transport into sustainable development
Why?
• Air quality and climate change
Road transport accounts for 84% of all CO2 emissions from transport.18
How?
The Gothenburg European Council placed breaking the link between economic growth
and transport growth at the heart of the sustainable development strategy.
3.1.1.2 Transparency of EU White Pages guidelines
• No real incentive (no instruments) in White Pages to use the cleanest mode or fuel • Equal treatment is related to price for using infrastructure. • The same conditions for all modes mean equal fees and taxes
17 BGS, 2004, Lecture in Transportation 18 White papers, Directorate-General for Energy and Transport

15
3.1.2 Swedish Transport Policy and Environmental Issues in Sweden
3.1.2.1 Swedish Transport Policy:
Sweden tops the countries where environmental issues are all important part of Transport Policy. One environmental goal established by the Swedish government is to reduce the emissions from transports so they should stabilize by the year 2010 at the same level as in 1990. The Swedish Society for Nature Preservation wants to go further. As the goals of the Swedish government have been regarded as insufficient, new stricter ones have been proposed for a new Swedish strategy for the climate, Rikard Enström19 claims. What is to be concerned about: Environmental quality standards will in the near future be available for the majority of serious urban air pollutants in Sweden. The standards for particulate matter (2005), nitrogen dioxide (2006) and ground level ozone (2010) are those most difficult to achieve. At least one quarter of all cities and villages may have problems in complying with the standard for PM10, which is to be achieved not later than the 1st of January 2005. Around one fifth of urban areas may have concentrations of nitrogen dioxide above the standard in 2006. In both cases the problems are mostly on streets with dense traffic. Several municipalities may also have difficulties in achieving the environmental quality standard of ground level ozone in 2010. A tendency of increasing concentrations in urban areas is observed, partly due to decreasing emissions of nitrogen oxides.20 What can be a positive factor is that a number of municipalities (one of them is Gothenburg) pay more and more attention to environmental issue and have started carrying out comprehensive measurements of urban air pollutants. EnviMan AQ Emissions21 is the program which represents the mixing of GIS and Simulation Program making it the possible to calculate emissions for every area (road) which environment experts need. This case study includes the data generated by EnviMan regarding the road transport emissions along the main roads that are limited by Gothenburg community boundaries. 22 These studies show that the situation is far from satisfactory:
Air quality of Swedish cities has improved only slightly over the last five to six years.
This can probably be explained mainly by the development of emissions and other impacts
of road traffic, energy use and energy production (e.g. wood heating).
3.1.2.2 Environmental Handbook for Transport Purchasing23
This is an evidence that environmental issues are going to be more and more popular among transport procurers, transporters, trade associations and the authorities in Sweden. Environmental Handbook for Transport Purchasing is a handbook developed by the Transport Research Institute which should play an active part in the company’s environmental work.
19 BGS, 2004, Lecture in Transport Economics and Management 20 IVL Svenska Miljöinstitutet AB, 2005, IVL report B 1607 21 OPSIS 22Miljöförvaltning, Gothenburg, 2005 (Jan Brandberg) 23 TFK, 1998:4E

16
The handbook includes a description of the most common environmental management systems (ISO 14000, EMAS, ISM and BS). The book considers some of the models available for assessing of environmental impact of product or service, and presents some of the most common measurement systems which are used to produce emission data from transportation. There is a chapter which contains a summary of the existing various database with information on energy needs and emissions related to goods transportation in Sweden. This book could be very useful for people who plan and purchase transport service as it presents tips and ideas regarding the various work operations that are usually found in an environmental management system. The book has two questionnaires which are intended to make it easier for environmental and safety considerations to be taken into consideration when purchasing transport services.
3.1.3 Environmental issue and the Port of Gothenburg The Port of Gothenburg sticks strongly to its Environmental policy which is written down in this way: "We will be an environmentally strong link in the logistics chain." 24 This means that we will:
• Use our resources efficiently, reduce noise and emissions to air, land and water, in order to promote long-term sustainable development.
• Implement an efficient environmental management system according to ISO 14001, in order to guide and improve our environmental efforts.
• Inform every employee about environmental issues, and encourage them to actively consider the environment in their daily work.
• Keep ourselves informed of, and in compliance with, relevant environmental legislation.
• Prevent environmental accidents and be well prepared to limit the effects of an accident.
• Consider environmental consequences seriously from a long term perspective when making decisions, and choose those solutions that are best for the environment whenever it is economically reasonable.
• Encourage, assist, and make it easier for customers, suppliers, and other parties to work in accordance with our environmental policy.
3.2 Environmental handling in logistics
3.2.1 Approaches towards mitigating environmental impact from logistics According to Björklund25 there are two main approaches to addressing environmental concerns in freight transport, either to improve the technology applied (e.g. using modern engines, catalytic converters and more efficient and/or less environmentally harmful fuels), or to implement changes in logistics-related activities.
24 Port of Göteborg AB, December 2002 25 Björklund M.,2005, p. 46

17
The practice of reducing the emissions from transports has been to a large extent focused on activities regarding the second approach, i.e. technical innovations: the increasing the use of existing resources, thus increasing the transport work (measured in tonne-km) without increasing the traffic work (measured in vehicle kilometres). This could be done by implementing changes in the logistically related strategies and activities applied, as26
• Selection of supplier (the suppliers’ environmental status and location) • Changes in the service (transport time, flexibility, frequencies) • Increased consolidation • Fleet management • Selection of transport mode (which mode is environmentally preferable) • Design and packaging used:
To facilitate handling Decrease transport damages Increase the load factor
• Stock levels • Capacity and location of production units and warehouses • Return loads • Applying cost-effective driving • Network planning such as the use of the hub and spoke concept
3.2.2 Logistics decisions that affect the environment Wu and Dunn systemize in such a way logistic decisions that effect the environment27:
Raw material acquisition Purchasing Vendor selection Vendor location
Inbound logistics
Mode selection Carrier selection Material handling Warehousing
Transformation Inventory management Packaging
Outbound logistics
Network design Inventory decisions Consolidation Mode selection Carrier selection Warehousing
Marketing Service level Channel decisions
Resource input
After-sales services Returns handling Parts management Service work
Negative en
vironment im
pact
Table 2 Logistic decisions effect the environment 26 Blinge M, 2000 27 Wu H. and Dunn S., 1995
18
According to Björklund28 most of actions applied in organisation today are related to the scheduling of freight flows and management of transport resources, fast the largest improvement potentials from environmental point of view are found in the physical structure of the logistics system as for example location of terminals and warehouses and the pattern of distribution. According to Blinge29 technological improvements and intermodal transport solutions are important parts, but the key to a transportation system that is environmentally sustainable lies within the process of strategic logistic planning.
3.2.3 Factors influencing the shipper’ environmental practice Three different forms of factors that in different ways affect environmental purchasing practice could be distinguished as: Enabling factors (support) Driving factors (push) Hindrance (obstruct) It is difficult to strictly recommend the measures which could be applied to make the transport procures and haulage companies environmentally friendly. Of course, the most powerful instruments are authorities’ measures. The authorities tools which could lead to using environmentally friendly transports: Direct instruments:
• Taxes • Fees • Subvention • Regulation
Other possibilities for the state (contributions and regulation by rules and laws):
• Reduce and relocate traffic by building- and traffic planning • Build bypass roads • Technical changes of vehicles (engines, riving system) • Technology for exhaust cleaning and fuels
3.3 Methods and calculations of impacts on environment
3.3.1 Impacts on the environment from road transports The dominant transport group is road traffic which is responsible for 92% of emissions.30 The calculations also include estimated emissions from working machinery (300,000 tonnes of
28 Björklund M., 2005, p. 10 29 Magnus Blinge, 2003 30 http://www.internat.naturvardsverket.se/documents/pollutants/climate/climate/fcccdata/NIR.pdf

19
carbon dioxide) used in the building and running of the traffic infrastructure such as the building and maintenance of roads, and the running of harbours and airports.
Figure 5 Concentration of CO2 in atmosphere Source: IPCC (Intergovernmental Panel on Climate Change).31 In Sweden’s National Inventory Report 2004 of Naturvårdsverket is stated that carbon dioxide emissions dominate greenhouse gas emissions from traffic. Amongst the other gases, emissions of nitrous oxide are increasing, as cars fitted with catalytic converters emit more nitrous oxide per vehicle kilometre than other cars. According to Naturvårdsverket in Sweden the emissions of carbon dioxide from the transport sector have increased compared to1990. Unfortunately, trends in the transport business follow those of the national economy, and use of fossil fuels in road traffic is still increasing, despite gradual fuel use efficiency improvements. This is because traffic is increasing at a faster rate than the total effect of the specific improvements in fuel efficiency. The amount of gasoline declined from 1995 but has begun to increase again since 2000. Diesel consumption, which is less price-sensitive than gasoline consumption, has increased continuously over the past few years. The main reason for this is the increasing amount of business in the transport sector using heavy lorries, but another reason is the increased number of lighter lorries. Emissions, through vehicle exhausts, road traffic causes emissions which are dangerous to mankind, nature and buildings. Carbon Monoxide (CO) restricts oxygen absorbent into the blood and can accentuate the risk of damage to the heart and circulatory systems, to the central nervous system and to unborn child. Carbon Dioxide (CO2) contributes to a risk in the carbon dioxide levels in the atmosphere and thus strengthens the greenhouse effect. Sulphuric Oxide (SOx) can cause allergic reactions, respiratory problems and lung damage, and people with asthmatic problems can be affected by the emissions.
31http://www.energikontorso.com/transporteko/projekt/mobility_management/Dokument/Vart%20%C3%A4r%20vi%20p%C3%A5%20v%C3%A4g.pdf

20
Nitrous Dioxide (NOx) contributes to acidification and over fertilisation of both ground and water, the effects being similar to those of sulphuric acid. Hydrocarbons (HC) are associated with cancer risks. Particles (PM) from emissions can be amounts of substances causing both cancer and lung disease.In additions to the emissions of various damaging substances. Traffic noise causes headaches and sleeping problems, as well as conversational difficulties. To the above could be added the following:
• Energy consumption basic for the level of emission, and it is affected by design, degree of utilisation, speed, in a given transport relation also by conveyance, trans-shipment and choice of route.
• Emissions are international, 82% of nitrous oxides in Sweden comes from other
countries, but Sweden also “exports” 70% of our nitrous oxides emissions.32
• Emission figures are rather similar for countries in Western Europe.
• Car owners seem to be more concerned about truck emissions than these from their own cars.
3.3.2 LCA method LCA33 is a model on which many assessment of the ecological impact of products is assessed -- the life-cycle assessment. LCA is a model that is questioned by many because of its complexity and the difficulties involved in producing conclusive results. The LCA is an instrument for charting the life cycles of products telling us where in the life-cycle the greatest environmental impact occurs, and by using this information as a basis, we may thus work to improve the total-cycle of products from the environmental viewpoint. An LCA is done in three basic stages and two further structuring stages. The basic stages are:
• Goal definition • Life-cycle inventory • Classification and evaluation
The structural stages are definition and improvement analysis.
32 Enarsson L, 2004, BGS 33TFK, Report 1998:4E

21
3.3.3 NTM Network for Transport and Environment (NTM)34 has developed systems for energy and emissions data for all models of transport. The work consists of data on energy and emissions for goods transportation in Sweden. Basic data on the energy turnover and atmospheric emissions have been gathered and processed. The aim is to present emissions from the best, the average and the worst technology used in traffic today. Data was extracted by each respective transporter (or trade organisations) with some additions from the NTM. The NTM data on energy and emissions for goods transports in Sweden will be continuously updated, see the NTM homepage. The purpose of the NTM report is to create a common method and compilation of data for use in the environmental analysis of transport work. With a view to minimising the number of inconsistencies in defining limits, the aim of NTM is to supplement the operational data that has been gathered to provide information that covers the full life-cycle of energy carries. The main steps in calculation are presented below:
Table 3 General calculation strategy by NTM
34 www.ntm.a.se

22
If a customer asks for the environmental loading in a particular transport relation, the transport company must be able to give these loading figures to the customer on a secure basis. The emission data is based on the following basic formula:
nutilisatiocapacitycapacityloadSpeed
effectemissionSpecfactorEmission
11.: ××
×
The result of the calculation of the emission factor is expressed in g/tonne kilometre
3.3.4 Routes distance calculation with help of GIS methodology The distance for a direct transport between two addresses carried out by one vehicle can be found by route planning tools. Some are available on the internet; see www.map24.com. The truck must usually be positioned before and after the transport. If no information on positioning distances is available, a factor of 50 % of the transport distance could be used for calculating the positioning distance. The emissions for this distance should be calculated with fuel consumption data for the empty vehicle.
23
4 Empirical Study: Case Port of Gothenburg
4.1 Data collection: Primary and secondary data
In the data collection process, 46 transport companies dealing with Port of Gothenburg were surveyed and the necessary data for this case were received by using E-mails, ordinary mails and telephone interviews.
4.1.1 Questionnaire design In designing the questionnaire, comments and feedback from B. Cederman35 and B. Sigström36 were obtained to ensure that the questions were clear and precise. The first part of the questionnaire concerns some background variables in order to obtain the data from respondents as numbers of different Euro class, roads choice inside and outside Gothenburg and availability of fuel cleaning systems. These data are necessary for the following calculations of emissions. The second part focuses on annually statistics regarding the number of container and trailer haulages to the Port of Gothenburg. The questionnaire was provided in Swedish as these companies have Swedish as a working language. The copy of the questionnaire is available as Appendix 9.1. The survey was carried out between September and October 2005.
4.1.2 Sample frame and respondents The list of 46 haulage companies which are haulage contractors with the Port of Gothenburg are provided by the Port. Some companies failed to answer for some reason: luck of personal; transport of cargo are made with help of under contractors but not themselves; only a small part of the company’s business is with the Port of Gothenburg. Such mentioned companies above are deleted from the survey list. Only the companies which confirmed their participation in the study remain. A total of 40 were sent a questionnaire. After two weeks, reminders with a new questionnaire were sent to non-respondents by ordinary mails. A total of 27 responses were received, of these, three responded that they could not communicate the number of different Euro class engines which they disposed, three companies answered that they did not know what way they drive to the Port, one could not fill in statistical data regarding the total number of trips and one questionnaire was unreasoned. There are 19 usable responses, plus 6 responses which could be used in the study on the base of Hot Deck Statistical Method, i.e. a response rate of 54,3%, which makes a concrete ground for the research and makes sure a reliable result could be made based on the real data. The table provides a summary of the response rate and some additional details.
35 Safety and environment, Skandia Harbour, SE-403 38 Göteborg, Sweden, [email protected] 36 Environmental Controller, Stab Miljö, Port of Göteborg AB, SE-403 38 Göteborg, Sweden, [email protected]

24
Amount Percentage
All the companies investigated 46 100% Companies which answers well 19 41.3% Companies which do not know Euro class 3 6.5% Companies which do not know what way they drive 3 6.5% Companies which do not know number of total trips 1 2.2% Companies which did not answer at all 20 43.5% Companies whose data can be used in the calculations 25 54.3%
Table 4 Response rate of the questionnaire
4.1.3 Secondary data The case study required some additional “internal information” regarding 46 companies in survey. The next information was provided by the Port:
• Company’s records on containers handling turn over in the Port itself • CD with registered number of trucks related to different haulage companies which
entered the Port in September & October 2005.
4.2 Missing data processing
Hot deck imputation was applied as the only method which resulted in replacement of a missing value (non response and inapplicable response by the respondents) in the present case. Regression imputation which seems to be more reliable for this case study were left unused as none independent variables such as total number of employees of each company or annual turn over each company for each of 46 haulage companies in survey could be provided for applying of regression. No. of company
Total trips of containers
Next similar case (No. of company)
Total trips of trailers
Next similar case (No. of company)
9 0 - 10560 30 23 10000 2 4000 31 26 14200 42 13600 18 29 8000 21 160 32 39 13000 6 0 - 44 0 - 2000 21 Table 5 Hot deck imputation result
4.3 Calculation of emissions from the Port
The basic method for calculation of emissions of road transport to and from the Port of Gothenburg which is used in the present case study is the NTM method because it is most the simple, up to date and recommended to the transport companies by Swedish authority. The calculation of emissions are made for the main roads which are used by haulage companies dealing with the Port of Gothenburg. The NTM database provides the fuel consumption data for the selected vehicle types and exhaust gas emission data related to the different kinds of engine (Euro 0, Euro 1, Euro 2, Euro 3, Euro 4 and Euro 5) and fuel consumption in different

25
conditions (Rural or Urban). The distance for every road limited by boundaries of Gothenburg region are extracted from www.map24.com where GIS methodology are applied.
4.3.1 Prerequisite statements and assumptions Some prerequisite statements and assumptions are made before the calculations to make clear:
• The term of ‘trip’ answered in the questionnaire by the haulage companies means a journey from the companies to the port and back to the company (either for delivery of cargo to the port or for pick-up of cargo from the port). So in the process of calculation, the trips are multiplied by two in order to get the total distance covered on each route.
• The companies only answered the total number of trips from the big routes but did not state the number of trips on each branch when the trucks get of the main roads. If the company use more than one branch for the transport from one road outside the city, the number of trips is divided equally among these routes
4.3.2 Calculation descriptions The calculation is generally following NTM calculation strategy, only small changes are made to according to the specific features of the present study.
4.3.3 Type of Vehicles Two types of vehicles are selected in this study. For the transport of a semi-trailer, type No.1 — a combination of a tractor and a semi-trailer is commonly seen and used. For container transport, both types are used, No.1 and No.2—a combination of a truck/lorry which carries a 20 foot container and a trailer/semi-trailer with carries a 40 foot container. Combination No.2 is more popular in the companies because they are more efficient.
No. Description Comment 1 Selection of relevant vehicle type Two most commonly seen types of vehicles at the port are
selected in this case 2 Set fuel type and fuel consumption The fuel consumption factors here are set to full and empty
vehicles on the situation of highway traffic 3 Measure of distances Real distances data are calculated with the help of
Geographical information system 4 Allocation of trips Total trips are allocated to each road to full/empty loaded
containers and trailers, then to different Euro classes of engines
5 Calculate vehicle environmental performance data for the operation of the vehicle
Emissions from different Euro classes of full/empty loaded containers and trailers all calculated separately and summed up on each route studied
6 Compensate for the effect of applicable exhaust gas abatement techniques
In this case no company has such of techniques, so this step is neglected
7 Get real environmental performance data on each route by re-allocation
The routes used in this case are overlapped in some parts so the emissions data should be re-allocated to show the environmental performance.
Table 6 Description of calculation steps

26
So in this report, it is defined as below. Trailer means the combination No. 1 of a tractor and a semi-trailer which have a maximum weight of 40 tons and cargo capacity of 2 TEUs; whereas container means the combination No.2 of a truck/lorry and a trailer/semi-trailer, which have a maximum weight of 60 tons and cargo capacity of 3 TEUs.
Max weight
Vehicle length
Cargo Capacity (typical values, inner dimensions)
No Illustration Nomenclature
[tonne] [m] tonne pallet [m] M3 TEU
1
(HDV) Tractor +semi-trailer
< 40
16,4 26 33 13,4 82 2
2
(HDV) Lorry/truck +trailer or semi-trailer on dolly
< 60
25,25 40 57 7,7+ 13,4
120 3
Figure 6 Type of vehicles in use
4.3.4 Fuel consumption and emissions factors Fuel consumption factors are different between different type of vehicles selected. For each type of vehicle, there are also different fuel consumptions between full-loaded or empty tractors.
Highway l/km Fuel consumption for the selected vehicle types Full Empty
Tractor + semi-trailer 2TEU 0.354 0.236
Lorry + trailer 3TEU* 0.49 0.327
*No. 2 calculated under the assumption that these vehicles are 10% more energy efficient (per tkm) than No. 1
Table 7 Fuel consumption factors for the selected vehicles37 Exhaust gas emission data for Diesel Heavy weight Duty Vehicles (HDV) in HIGHWAY traffic
(Vehicle gross weight >20 tonne. average speed 82 km/h)
[g/l] Euro 0 Eruo 1 Euro 2 Euro 3 Euro 4
HC 1.59 1.93 1.15 1.04 1.27
CO 4.98 5.13 3.67 4.41 2.88
Nox 37 28.3 32.1 22.1 13.2
PM 1.23 1.031 0.471 0.495 0.099
CO2 2642 2642 2642 2642 2642
CH4 0.0382 0.0462 0.0276 0.0251 0.0306
Sox 0.0133 0.0133 0.0133 0.0133 0.0133
Table 8 Emissions factors for the selected vehicles types
37 Source: Data processed by NTM based on HBEFA 2.1.

27
4.3.5 Routes and distances Studied routes Transport arrives at City of Gothenburg from five main roads, which are the E6, Rv45, E20, Rv40, E6/E20 Söder. After getting off the five main roads, different branch roads are used by different companies to the Port of Gothenburg, which to large extent increase the number of studied routes up to 11.
E6: 1 Norrleden E6: 2 Lundbyleden / Lundbytunneln
Rv 45: 1 Jordfallsbron/Norrleden Rv 45: 2 Jordfallsbron/Lundbyleden
Rv 45: 3 Tingstadstunneln/Lundbyleden Rv 45: 4 Oscarsleden/Älvsborgsbron

28
E20 norr: Tingstadstunneln/Lundbyleden Rv 40: Gårdaleden/Tingstadstunneln/Lundbyleden
E6/E20 Söder: 1 Söderleden/Älvsborgsbron E6/E20 Söder: 2 Säröleden/Älvsborgsbron
E6/E20 Söder: 3 Gårdaleden/Tingstadstunneln/Lundbyleden Figure 7 Routes for transport from outside the city area

29
For the transport staring from inside the city area, five different roads are followed to the port of Gothenburg.
Figure 8 Routes for transport from inside the city area Distances data All the distance data used in this report is measured with the help of GIS system Map24. The end point of all the routes is the ID control for containers and trailers at the Port of Gothenburg. Since it is only emissions to the area of the City of Gothenburg that are taken into consideration, for the transport from outside the city area, starting points are counted from the crossing points of the city border and each route respectively. For the transport that is starting from inside the city area, it is impossible to locate the exact starting points since no information is given regarding the location of the terminals or factories where each transport task starts from or ends at. Only main roads that these transport tasks follow inside the city

30
area are pointed out from the companies’ answer to the questionnaire. Here assumptions are made for the transport from inside the city area, it is the starting points of the five routes studied in this research that are set to be the starting points of each transport task respectively and the distance is measured from there to the ID control.
Route Distance (km)
E6: 1 Norrleden 27.41
E6: 2 Lundbyleden / Lundbytunneln 25.24
Rv 45: 1 Jordfallsbron/Norrleden 26.33
Rv 45: 2 Jordfallsbron/Lundbyleden 24.07
Rv 45: 3 Tingstadstunneln/Lundbyleden 19.93
Rv 45: 4 Oscarsleden/Älvsborgsbron 20.72
E20 norr: Tingstadstunneln/Lundbyleden 14.08
Rv 40: Gårdaleden/Tingstadstunneln/Lundbyleden 16.72
E6/E20 Söder: 1 Söderleden/Älvsborgsbron 11.2
E6/E20 Söder: 2 Säröleden/Älvsborgsbron 19.4
E6/E20 Söder: 3 Gårdaleden/Tingstadstunneln/Lundbyleden 14.24
Lundbyleden 9
Norrrleden 20.05
Oscarsleden 7.91
Öckeröleden 11.8
Söderleden 11.2
Table 9 Distances in use
4.3.6 Calculation of total trips From the questionnaire, the total numbers of trips per year for trailers and containers in each company are given, by which the percentages of containers and trailer transport in each company are calculated and shown in the table. No. Of companies No. of trips of
containers per year No. of trips of trailers per year
Total trips per year % Con. % T.
2 11000 100 11100 99% 1%
5 480 480 100% 0%
6 13193 240 13433 98% 2%
8 9000 9000 100% 0%
10 2000 20 2020 99% 1%
14 6000 800 6800 88% 12%
18 17500 17500 35000 50% 50%
19 520 520 100% 0%
20 1125 5 1130 100% 0%
21 5700 1200 6900 83% 17%
24 3300 3300 100% 0%
30 6482 6482 0% 100%
31 3500 3500 0% 100%
32 700 125 825 85% 15%
33 600 600 100% 0%
35 7000 7000 100% 0%
42 14500 676 15176 96% 4%
43 3750 3750 100% 0%
46 2100 3000 5100 41% 59%
Table 10 Total trips per year for container and trailer transport

31
The total numbers of trips on each route are allocated to containers and trailers transport for each company. No of companies
E6 Co. E6 of T. Rv 45 Rv 45 T. Rv 40 Rv 40 T. E6/E20 Söder C.
E6/E20 Söder T.
E20 Norr C.
E20 Norr T.
2 350 3 450 4 500 5 400 4 425 4
5 0 0 240 0 0 0
6 880 16 880 16 440 8 220 4 1100 20
8 0 0 9000 0 0 0
10 0 0 0 2000 20 0
14 200 27 800 107 1200 160 600 80 1200 160
18 3500 3500 3500 3500 3500 3500 3500 3500 3500 3500
19 0 0 0 0 260 0
20 170 1 170 1 5 0 5 0 5 0
21 265 56 170 36 420 88 140 29 240 51
24 200 0 250 0 300 0 300 0 50 0
30 192 4400 880 96 864
31 100 100 1000 500 500
32 160 29 160 29 160 29 80 14 160 29
33 0 40 0 0 400 0 0
35 1400 0 1400 0 1400 0 1400 0 1400 0
42 2860 133 1430 67 5720 267 700 33 730 34
43 2250 0 550 0 200 0 550 0 200 0
46 900 1286 0 0 0 0
Table 11 Number of trips on each route from outside the city Nr Lundbyleden Norrleden Oscarsleden Öckeröleden Söderleden
Total C. T. Total C. T. Total C. T. Total C. T. Total C. T.
2 1250 1239 11 5825 5773 52 350 347 3 450 446 4 1000 991 9
5 240 240 0 0 0 0 0 0 0 0 0
6 6160 6050 110 1540 1512 28 1540 1512 28 250 246 4 3080 3025 54
8 0 0 0 0 0 0 0 0 0 0
10 0 0 0 0 0 0 0 0 0 0
14 1000 882 118 0 0 0 0 100 88 10 0 0
18 0 0 0 0 0 0 0 0 0 0
19 260 260 0 0 0 0 0 0 0 0 0
20 50 50 0 5 5 0 50 50 0 200 199 1 10 10 0
21 5150 4254 896 300 248 52 100 83 17 20 17 3 130 107 19
24 500 500 0 200 200 0 0 0 0 0 400 400 0
30 50 0 50 0 0 0 0 0 0 0 0
31 1000 0 1000 0 0 0 0 0 0 0 0
32 430 365 65 0 0 10 8 2 2 2 0 10 8 1
33 60 60 0 20 20 0 0 0 0 0 0 0
35 0 0 0 0 0 0 0 0 0 0
42 2600 2484 116 675 645 30 350 334 16 600 573 26 400 382 17
43 0 0 0 0 0 0 0 0 0 0
46 900 371 529 0 0 0 0 0 0 0 0
Table 12 Number of trips on each route from inside the city

32
4.3.7 Full-Loaded and empty-Loaded rate According to the record of the entrance gate, for the trailers transport, each tractor carries 1,5 semi-trailers on average both way, and all the trailers are full-filled with cargo, this means 75% of the trips are with full-loaded trailers and 25% are empty. But regarding containers transport, 70% have containers on the tractors and 30% do not carry any containers on them. For the 70% of tractors that carry containers, some containers are empty. Based on the statistics data from the port, 80% of the containers transported are full-filled with cargo and 20% are empty containers. According to this calculations have been made that 70%*80%=56% of the trips are for full-loaded containers. The other 44% of trips are empty( with only tractors or with empty containers on them).
4.3.8 Calculation example of one route
Emissions from one route
From trailers From containers
Full-loaded trailers
Euro0
Euro1
Euro2
Euro3
Euro4
Empty trailers
Euro0
Euro1
Euro2
Euro3
Euro4
Full-loaded containers
Euro0
Euro1
Euro2
Euro3
Euro4
Empty containers
Euro0
Euro1
Euro2
Euro3
Euro4
Allocation
of trips S
um up of emissions
Table 13 Calculation example of one route Calculation formula Emission=Number of trips*2*Distance*Full-load(empty)rate*Euro class %*Fuel consumption factor*Emission factor

33
Nr Euro 0
pcs % Euro 1
pcs % Euro
2 pcs % Euro 3
pcs % Euro 4
pcs % Total trips
Lundbyleden C.(inside)
Km
2 0% 0% 15 71% 6 29% 0% 1239 9 5 0% 0% 2 25% 6 75% 0% 240 9 6 0% 4 15% 13 48% 10 37% 0% 6050 9 8 0% 0% 2 33% 4 67% 0% 0 9 10 1 8% 2 17% 6 50% 3 25% 0% 0 9 14 0% 0% 400 67% 200 33% 0% 882 9 18 5 2% 10 4% 74 32% 129 56% 14 6% 0 9 19 0% 0% 2 100% 0% 0% 260 9 20 0% 0% 0% 1 100% 0% 50 9 21 0% 0% 2 33% 4 67% 0% 4254 9 24 0% 0% 10 100% 0% 0% 500 9 30 0% 0% 5 83% 1 17% 0% 0 9 31 0% 0% 2 22% 7 78% 0% 0 9 32 0% 0% 0% 5 100% 0% 365 9 33 0% 0% 0% 2 100% 0% 60 9 35 0% 0% 0% 1 100% 0% 0 9 42 0% 0% 10 45% 12 55% 0% 2484 9 43 0% 0% 4 36% 7 64% 0% 0 9 46 0% 0% 0% 4 100% 0% 371 9
Table 14 Example: Allocation of trips on each Euro class Take Lundbyleden from inside of Gothenburg City for example, first the emissions from full-loaded containers are calculated with the help of above-mentioned formula. Total emissions from the full-loaded containers on route Lundbyleden from inside the city area
Nr HC CO NOx PM CO2 CH4 SOx
2 6843.8432 23748.049 178918.86 2923.7108 16164756 164.49697 81.374432
5 1265.423 5008.3488 29161.037 579.66451 3131847.9 30.494621 15.765926
6 36599.765 124319.68 831712.24 16819.07 78947919 879.41257 397.42896
8 0 0 0 0 0 0 0
10 0 0 0 0 0 0 0
14 4852.0376 17069.294 125368.52 2087.5384 11514147 116.65228 57.962965
18 0 0 0 0 0 0 0
19 1476.8208 4712.9846 41222.563 604.85443 3392835.3 35.443699 17.079754
20 255.70195 1084.2746 5433.6664 121.70429 649581.29 6.1712681 3.2700345
21 22624.077 87484.435 534432.54 10233.367 55516544 544.93907 279.47389
24 2840.04 9063.432 79274.16 1163.1816 6524683.2 68.16096 32.84568
30 0 0 0 0 0 0 0
31 0 0 0 0 0 0 0
32 1874.142 7947.083 39825.518 892.01952 4761041.6 45.231697 23.967393
33 308.20608 1306.9123 6549.3792 146.69424 782961.98 7.4384352 3.9414816
35 0 0 0 0 0 0 0
42 13374.179 49983.067 326936.78 5939.7419 32417048 321.91728 163.18953
43 0 0 0 0 0 0 0
46 1903.6258 8072.1055 40452.048 906.05266 4835941.7 45.943276 24.344445 Total
94217.863 339799.66 2239287.3 42417.599 218639305 2266.3021 1100.6445
Table 15 Example: Emissions from the full-loaded containers on route Lundbyleden Total emissions from full loaded and empty containers and trailers one this route are calculated in the same way with the same formula.

34
Table 16 Example: Total emissions from full/empty loaded containers and trailers
Total full trailers Total empty trailers Total full containers Total empty containers
Nr HC CO Nox PM CO2 CH4 Sox HC CO Nox PM CO2 CH4 Sox HC CO Nox PM CO2 CH4 Sox HC CO Nox PM CO2 CH4 Sox
2 60 209 1574 26 142186 1 1 13 46 350 6 31597 0 0 6844 23748 178919 2924 16164756 164 81 3589 12452 93815 1533 8475893 86 43
5 0 0 0 0 0 0 0 0 0 0 0 0 0 0 1265 5008 29161 580 3131848 30 16 664 2626 15290 304 1642166 16 8
6 644 2188 14639 296 1389597 15 7 143 486 3253 66 308799 3 2 36600 124320 831712 16819 78947919 879 397 19191 65186 436103 8819 41395869 461 208
8 0 0 0 0 0 0 0 0 0 0 0 0 0 0 0 0 0 0 0 0 0 0 0 0 0 0 0 0
10 0 0 0 0 0 0 0 0 0 0 0 0 0 0 0 0 0 0 0 0 0 0 0 0 0 0 0 0
14 626 2202 16174 269 1485426 15 7 139 489 3594 60 330095 3 2 4852 17069 125369 2088 11514147 117 58 2544 8950 65736 1095 6037374 61 30
18 0 0 0 0 0 0 0 0 0 0 0 0 0 0 0 0 0 0 0 0 0 0 0 0 0 0 0 0
19 0 0 0 0 0 0 0 0 0 0 0 0 0 0 1477 4713 41223 605 3392835 35 17 774 2471 21615 317 1779013 19 9
20 1 5 23 1 2793 0 0 0 1 5 0 621 0 0 256 1084 5434 122 649581 6 3 134 569 2849 64 340604 3 2
21 4608 17820 108863 2085 11308610 111 57 1024 3960 24192 463 2513024 25 13 22624 87484 534433 10233 55516544 545 279 11863 45872 280227 5366 29109768 286 147
24 0 0 0 0 0 0 0 0 0 0 0 0 0 0 2840 9063 79274 1163 6524683 68 33 1489 4752 41567 610 3421179 36 17
30 270 906 7272 114 631306 6 3 60 201 1616 25 140290 1 1 0 0 0 0 0 0 0 0 0 0 0 0 0 0
31 5087 20290 116236 2340 12626118 123 64 1130 4509 25830 520 2805804 27 14 0 0 0 0 0 0 0 0 0 0 0 0 0 0
32 324 1373 6881 154 822611 8 4 72 305 1529 34 182802 2 1 1874 7947 39826 892 4761042 45 24 983 4167 20882 468 2496424 24 13
33 0 0 0 0 0 0 0 0 0 0 0 0 0 0 308 1307 6549 147 782962 7 4 162 685 3434 77 410541 4 2
35 0 0 0 0 0 0 0 0 0 0 0 0 0 0 0 0 0 0 0 0 0 0 0 0 0 0 0 0
42 603 2255 14748 268 1462287 15 7 134 501 3277 60 324953 3 2 13374 49983 326937 5940 32417048 322 163 7013 26208 171427 3114 16997685 169 86
43 0 0 0 0 0 0 0 0 0 0 0 0 0 0 0 0 0 0 0 0 0 0 0 0 0 0 0 0
46 2631 11158 55914 1252 6684415 64 34 585 2479 12425 278 1485426 14 7 1904 8072 40452 906 4835942 46 24 998 4233 21211 475 2535697 24 13
Total 14856 58405 342324 6804 36555349 358 184 3301 12979 76072 1512 8123411 80 41 94218 339800 2239287 42418 218639305 2266 1101 49403 178172 1174157 22241 114642213 1188 577

35
The total emissions from the 19 companies that are studied in this research are acquired by summing up the emissions from all the trailers and all the containers. Hot deck imputation is then applied to get the emissions for the companies with missing data. All the emissions from trailers and containers of the 25 companies are then put together to get the total emissions on this route.
4.3.9 Re-allocation of emissions In reality, 14 routes studied are not separate routes and there are overlaps among them that are not taken into consideration when calculation of emissions is first made on each route. In the calculation of this case, the emissions on each route are assumed to be proportional to the distance of respective route. The formula below is used to allocate the emissions to the branch roads.
Total trailers
Total containers
Nr HC CO Nox PM CO2 CH4 Sox HC CO Nox PM CO2 CH4 Sox
2 74 255 1924 31 173783 2 1 10432 36200 272734 4457 24640649 251 124
5 0 0 0 0 0 0 0 1929 7634 44451 884 4774014 46 24
6 787 2674 17893 362 1698396 19 9 55791 189506 1267816 25638 120343788 1341 606
8 0 0 0 0 0 0 0 0 0 0 0 0 0 0
10 0 0 0 0 0 0 0 0 0 0 0 0 0 0
14 765 2691 19768 329 1815520 18 9 7396 26019 191105 3182 17551521 178 88
18 0 0 0 0 0 0 0 0 0 0 0 0 0 0
19 0 0 0 0 0 0 0 2251 7184 62837 922 5171848 54 26
20 1 6 29 1 3414 0 0 390 1653 8283 186 990185 9 5
21 5633 21780 133055 2548 13821634 136 70 34487 133356 814659 15599 84626311 831 426
24 0 0 0 0 0 0 0 4329 13816 120841 1773 9945862 104 50
30 331 1108 8888 139 771596 8 4 0 0 0 0 0 0 0
31 6217 24798 142066 2860 15431922 150 78 0 0 0 0 0 0 0
32 396 1678 8410 188 1005413 10 5 2857 12114 60708 1360 7257465 69 37
33 0 0 0 0 0 0 0 470 1992 9984 224 1193503 11 6
35 0 0 0 0 0 0 0 0 0 0 0 0 0 0
42 737 2756 18025 327 1787239 18 9 20387 76191 498364 9054 49414733 491 249
43 0 0 0 0 0 0 0 0 0 0 0 0 0 0
Co
mp
an
ies
with
co
mp
lete
da
ta o
nly
46 3216 13637 68340 1531 8169841 78 41 2902 12305 61663 1381 7371639 70 37
9 331 1108 8888 139 771596 8 4 0 0 0 0 0 0 0
23 6217 24798 142066 2860 15431922 150 78 10432 36200 272734 4457 24640649 251 124
26 0 0 0 0 0 0 0 20387 76191 498364 9054 49414733 491 249
29 396 1678 8410 188 1005413 10 5 34487 133356 814659 15599 84626311 831 426
39 0 0 0 0 0 0 0 55791 189506 1267816 25638 120343788 1341 606
Co
mp
an
ies w
ith
mis
sin
g d
ata
44 5633 21780 133055 2548 13821634 136 70 0 0 0 0 0 0 0
Total emissions trailers and containers ( gram) 30733 120749 710815 14051 75709325 741 381 264717 953225 6267017 119407 612306999 6367 3082
Total emissions before re-allocation (Ton) 0,70 2,56 16,54 0,32 1635,83 0,02 0,01
Table 17 Example: Total emissions on one route

36
Emissions allocated to branch=
Emissions of the route (before allocation)teceOfTheRouDis
ceOfBranchDis
tan
tan×
Here is an example of the allocation three routes: E6 Norrleden, Rv45 Norrleden and Norrleden from inside, they have an overlap part of Norrleden which is 20.05Km long.
Figure 9 Example: Routes which pass Norrleden First the emissions are allocated to the Norrleden part on each route according to the formula above (green in the table), for the route Norrleden from inside the city, all the emissions are allocated to Norrleden because the overlapped part is this route. Then the emissions before allocation and the emissions allocated from other routes to the overlapped branch (yellow) are summed up to get the real total emissions on this route from the road transport to and from the Port. E6 Norrleden
HC CO Nox PM CO2 CH4 Sox Total emissions before re-allocation (Ton) 0.25 0.91 5.93 0.11 582.08 0.01 0.00 Total emissions allocated to Norrleden (Ton) 0.18 0.67 4.34 0.08 425.78 0.00 0.00 Emissions allocated from Rv45 Norrleden (Ton) 0.12 0.42 2.89 0.05 270.13 0.00 0.00 Emissions allocated from Norrleden inside (Ton) 0.73 2.54 18.38 0.32 1693.68 0.02 0.01 Total emissions from the port on this route (Ton) 1.10 3.86 27.20 0.49 2545.89 0.03 0.01
Rv 45 Norrleden HC CO Nox PM CO2 CH4 Sox
Total emissions before re-allocation (Ton) 0.16 0.55 3.80 0.07 354.74 0.00 0.00 Total emissions allocated to Norrleden (Ton) 0.12 0.42 2.89 0.05 270.13 0.00 0.00 Emissions allocated from E6 Norrleden (Ton) 0.18 0.67 4.34 0.08 425.78 0.00 0.00 Emissions allocated from Norrleden inside (Ton) 0.73 2.54 18.38 0.32 1693.68 0.02 0.01 Total emissions from the port on this route (Ton) 1.07 3.75 26.52 0.47 2474.20 0.02 0.01
Norrleden from inside HC CO Nox PM CO2 CH4 Sox Total emissions before re-allocation (Ton) 0.73 2.54 18.38 0.32 1693.68 0.02 0.01 Emissions allocated from Rv45 Norrleden (Ton) 0.12 0.42 2.89 0.05 270.13 0.00 0.00 Emissions allocated from E6 Norrleden(Ton) 0.18 0.67 4.34 0.08 425.78 0.00 0.00 Total emissions from the port on this route (Ton) 1.03 3.62 25.61 0.45 2389.59 0.02 0.01 * some emissions are 0.00 ton which means the figures are too small to be displayed. Real figures can be found in appendix excel files
Table 18 Example: re-allocation of the emissions

37
4.4 Emissions from the Port traffic
The emissions from the road cargo transport to and from the Port of Gothenburg on studied routs are listed in the table of ‘after re-allocation’ below. The total emissions are summed from all the emission on each route before re-allocation.
4.5 Emissions from the city traffic
The emissions data for the road traffic of the City of Gothenburg are provided by the city environmental authority with the environmental program EnviMan. The emissions data on 16 routes in the study are listed as well as the emissions data for the whole city from road traffic, to make comparison with the respective emissions from the traffic to the Port.
Before re-allocation After re-allocation
Routes HC CO Nox PM CO2 CH4 Sox HC CO Nox PM CO2 CH4 Sox
E6: 1 Norrleden 0.25 0.91 5.93 0.11 582.08 0.01 0.00 1.10 3.86 27.20 0.49 2545.89 0.03 0.01
E6: 2 Lundbyleden / Lundbytunneln 1.25 4.70 28.77 0.56 2993.77 0.03 0.02 3.48 12.83 81.77 1.55 8251.70 0.08 0.04
Rv 45: 1 Jordfallsbron/Norrleden 0.16 0.55 3.80 0.07 354.74 0.00 0.00 1.07 3.75 26.52 0.47 2474.20 0.02 0.01
Rv 45: 2 Jordfallsbron/Lundbyleden 0.68 2.38 17.65 0.29 1609.53 0.02 0.01 3.10 11.30 74.31 1.37 7333.15 0.03 0.02
Rv 45: 3 Tingstadstunneln/Lundbyleden 0.02 0.09 0.53 0.01 55.17 0.00 0.00 2.68 9.86 63.54 1.20 6355.69 0.02 0.01
Rv 45: 4 Oscarsleden/Älvsborgsbron 0.50 1.82 11.19 0.22 1166.52 0.01 0.01 0.59 2.11 13.15 0.26 1353.41 0.01 0.01
E20 norr: Tingstadstunneln/Lundbyleden 0.69 2.51 16.09 0.31 1618.99 0.02 0.01 2.92 10.72 69.06 1.30 6909.56 0.03 0.02
Rv 40: Gårdaleden/Tingstadstunneln/Lundbyleden 1.50 5.58 35.44 0.67 3590.83 0.04 0.02 3.36 12.39 79.62 1.50 7983.41 0.05 0.03
E6/E20 Söder: 1 Söderleden/Älvsborgsbron 0.47 1.71 10.66 0.21 1091.65 0.01 0.01 0.73 2.61 16.91 0.33 1676.99 0.02 0.01
E6/E20 Söder: 2 Säröleden/Älvsborgsbron 0.05 0.16 1.10 0.02 98.52 0.00 0.00 0.63 2.24 14.57 0.28 1439.08 0.02 0.01 E6/E20 Söder: 3Gårdaleden/Tingstadstunneln/Lundbyleden 0.02 0.07 0.41 0.01 43.73 0.00 0.00 2.68 9.84 63.41 1.19 6341.53 0.04 0.02
Lundbyleden 0.70 2.56 16.54 0.32 1635.83 0.02 0.01 2.67 9.81 63.26 1.19 6325.44 0.06 0.03
Norrrleden 0.73 2.54 18.38 0.32 1693.68 0.02 0.01 1.03 3.62 25.61 0.45 2389.59 0.02 0.01
Oscarsleden 0.08 0.29 1.96 0.04 186.90 0.00 0.00 0.28 0.99 6.23 0.12 632.22 0.01 0.00
Öckeröleden 0.07 0.26 1.79 0.03 172.64 0.00 0.00 0.07 0.26 1.79 0.03 172.64 0.00 0.00
Söderleden 0.24 0.83 5.73 0.11 538.56 0.01 0.00 0.73 2.61 16.91 0.33 1676.99 0.02 0.01
Total from the Port 7.42 26.94 175.96 3.30 17433.13 0.18 0.09
Table 19 Emissions from the road transport to and from the Port of Gothenburg

38
Route (in ton) HC CO Nox PM CO2
E6: 1 Norrleden 284.8 1795.9 361 7.35 85092.3
E6: 2 Lundbyleden / Lundbytunneln 529.98 3529.49 752.59 12.9 155002.4
Rv 45: 1 Jordfallsbron/Norrleden 224.89 1507.8 278.4 5.99 66984.7
Rv 45: 2 Jordfallsbron/Lundbyleden 480.8 3299.4 683.8 11.77 139885.1
Rv 45: 3 Tingstadstunneln/Lundbyleden 329.9 2704.5 426.2 8.54 89436.7
Rv 45: 4 Oscarsleden/Älvsborgsbron 267.3 2253 308.9 6.54 73132.1
E20 norr: Tingstadstunneln/Lundbyleden 291.5 2402.8 371.8 7.5 77955.7
Rv 40: Gårdaleden/Tingstadstunneln/Lundbyleden 394,7 3024,8 548,1 9,55 109820,8
E6/E20 Söder: 1 Söderleden/Älvsborgsbron 173,02 1499,8 175,9 4,3 46644,8
E6/E20 Söder: 2 Säröleden/Älvsborgsbron 217,5 1733,2 228,3 4,72 62080,1
E6/E20 Söder: 3 Gårdaleden/Tingstadstunneln/Lundbyleden 376,9 2843,5 509,4 9,01 105106,4
Lundbyleden 161,6 1311,9 232,6 4,27 42699,6
Norrrleden 98,03 837,1 103,7 2,45 27724,7
Oscarsleden 86,54 739.5 103.8 1.94 23208.4
Öckeröleden 67.2 581.6 76.6 1.84 18798
Söderleden* 173.02 1499.8 175.9 4.3 46644.8
Total in the city 3267.4 24736.5 3454.2 74.53 875134.8
*same as E6/E20 Söder: 1 Söderleden/Älvsborgsbron because they are the same road
Table 20 Emissions from the city road traffic

39
5 Analysis
5.1 Comparison of emissions from the Port and the City
0
100000
200000
300000
400000
500000
600000
700000
800000
900000
HC CO Nox PM CO2
Comparison of total emissions
Total
f rom
the
Por t
Total
in the
city
Share of the Port
0%
1%
2%
3%
4%
5%
6%
HC CO Nox PM CO2
HC
CO
Nox
PM
CO2
Figure 10 Comparison of emissions from the Port and the City HC CO NOx PM CO2 CH4 Sox Total from the Port (Ton) 7.4 27 176 3.3 17400 0.18 0.09 Total in the city (Ton) 3267 24737 3454 75 875100 Share of the Port 0.23% 0.11% 5.09% 4.42% 1.99%
As can be seen from the graphs above, regarding the road transport inside the City of Gothenburg, the emissions generated from the road transport to and from the Port of Gothenburg have quite a small share of the total emissions from road traffic inside the City
of Gothenburg.

40
The pollutant with the biggest share from the city in comparison with the other pollutant which the Port of Gothenburg responds to is NOx. Road transport to the port amounts to 176 tons NOx gases in year 2004 inside the city area and shares 5.09% of the total NOx emission out of the road transport of the city and its suburbs. The smallest share of pollutant is CO, the transport to the Port of Gothenburg exposes 27 tons of CO which is 0.11% of total emission of CO of all the road traffic of Gothenburg. The road transport to and from the Port of Gothenburg produces about 17400 tons of CO2 and contributes with only 1.99% emission of CO2 to the “green house effect” which the road transport of the region produces. The share of the Port road traffic for PM emissions is 3.3 ton and shares 4.42% of the total emissions of PM worked out by the road traffic of the region. HC emissions from the road transport to the Port are relatively small as 7.4 tons and they amount to 0.23% of the total emissions of HC of road transport of the city. The CH4 and SOx emissions from the road transport dealing with the Port are considerably few as only 0.18 and 0.09 tons respectively. Unfortunately, the city environmental authority could not provide the data regarding CH4 and SOx emissions inside the whole city area so no comparison could be made to see the shares.
5.2 Share of emissions on each route
Share of the emissions from Port traffic on each route
Routes No. HC CO Nox PM CO2
E6: 1 Norrleden 1 0.39% 0.21% 7.54% 6.60% 2.99%
E6: 2 Lundbyleden / Lundbytunneln 4 0.66% 0.36% 10.87% 12.02% 5.32%
Rv 45: 1 Jordfallsbron/Norrleden 2 0.48% 0.25% 9.52% 7.88% 3.69%
Rv 45: 2 Jordfallsbron/Lundbyleden 5 0.64% 0.34% 10.87% 11.66% 5.24%
Rv 45: 3 Tingstadstunneln/Lundbyleden 6 0.81% 0.36% 14.91% 14.00% 7.11%
Rv 45: 4 Oscarsleden/Älvsborgsbron 11 0.22% 0.09% 4.26% 3.97% 1.85%
E20 norr: Tingstadstunneln/Lundbyleden 7 1.00% 0.45% 18.58% 17.35% 8.86%
Rv 40: Gårdaleden/Tingstadstunneln/Lundbyleden 8 0.85% 0.41% 14.53% 15.69% 7.27%
E6/E20 Söder: 1 Söderleden/Älvsborgsbron 13 0.26% 0.15% 4.68% 4.47% 1.97%
E6/E20 Söder: 2 Säröleden/Älvsborgsbron 14 0.29% 0.13% 6.38% 6.03% 2.32%
E6/E20 Söder: 3Gårdaleden/Tingstadstunneln/Lundbyleden 9 0.71% 0.35% 12.45% 13.25% 6.03%
Lundbyleden 10 1.65% 0.75% 27.20% 27.88% 14.81%
Norrrleden 3 1.05% 0.43% 24.70% 18.56% 8.62%
Oscarsleden 12 0.32% 0.13% 6.00% 6.31% 2.72%
Öckeröleden 16 0.11% 0.05% 2.34% 1.76% 0.92%
Söderleden 15 0.26% 0.15% 4.68% 4.47% 1.97%
Table 21 Share of emissions on each route

41
No. 1: E6 Norrleden No. 2: Rv45 Norrleden
No. 6: Rv45 Tingstadstunneln Lundbyled No. 5: Rv45 Jordfallsbron Lundbyleden
No. 4: E6 Lundbyleden No. 3: Norrleden from inside city
Share of the Port
0,00%
5,00%
10,00%
15,00%
20,00%
25,00%
30,00%
HC CO Nox PM CO2
HC
CO
Nox
PM
CO2
Share of the Port
0,00%
5,00%
10,00%
15,00%
20,00%
25,00%
30,00%
HC CO Nox PM CO2
HC
CO
Nox
PM
CO2
Share of the Port
0,00%
5,00%
10,00%
15,00%
20,00%
25,00%
30,00%
HC CO Nox PM CO2
HC
CO
Nox
PM
CO2
Share of the Port
0,00%
5,00%
10,00%
15,00%
20,00%
25,00%
30,00%
HC CO Nox PM CO2
HC
CO
Nox
PM
CO2
Share of the Port
0,00%
5,00%
10,00%
15,00%
20,00%
25,00%
30,00%
HC CO Nox PM CO2
HC
CO
Nox
PM
CO2
Share of the Port
0,00%
5,00%
10,00%
15,00%
20,00%
25,00%
30,00%
HC CO Nox PM CO2
HC
CO
Nox
PM
CO2

42
No. 7: E20 norr Tingstadstunneln No. 8: Rv40 Lundbyleden
No. 12: Oscarsleden from inside No. 11: Rv45 Oscarsleden Älvsborgsbron
No. 10: Lundbyleden from inside No. 9: E6 E20 Söder Lundbyleden
Share of the Port
0,00%
5,00%
10,00%
15,00%
20,00%
25,00%
30,00%
HC CO Nox PM CO2
HC
CO
Nox
PM
CO2
Shar e of the Port
0,00%
5,00%
10,00%
15,00%
20,00%
25,00%
30,00%
HC CO Nox PM CO2
HC
CO
Nox
PM
CO2
Share of the Port
0,00%
5,00%
10,00%
15,00%
20,00%
25,00%
30,00%
HC CO Nox PM CO2
HC
CO
Nox
PM
CO2
Share of the Port
0,00%
5,00%
10,00%
15,00%
20,00%
25,00%
30,00%
HC CO Nox PM CO2
HC
CO
Nox
PM
CO2
Share of the Port
0,00%
5,00%
10,00%
15,00%
20,00%
25,00%
30,00%
HC CO Nox PM CO2
HC
CO
Nox
PM
CO2
Share of the Port
0,00%
5,00%
10,00%
15,00%
20,00%
25,00%
30,00%
HC CO Nox PM CO2
HC
CO
Nox
PM
CO2

43
Figure 11 Share of emissions on each route From the graphs above it can be seen that the shares of emissions on each single route studied have the same trend as the share of emissions from all of the transport to and from the Port out of the city road traffic. NOx and PM are two main pollutants from the Port traffic, the reason for this may be that the heavy trucks used produce much more NOx and PM than cars. Besides, most of the trucks do not have any exhaust gas reduction techniques installed, but all of the cars have such equipment that can reduce the NOx and PM emissions by almost 80%. The shares of CO2 emissions on each route range from about 2% to less than 10 % differently on each route studied. In general, all the pollutants from the traffic to the port take a small share out of the total pollutants emissions from the traffic in the city. But on some routes, the shares from the port traffic are big enough and should be taken care of. For example, route Norrleden inside the city takes almost 25% of NOx and 19% of PM emissions. This may be because that this route is mainly used by the traffic to the Port. On the road Lundbyleden traffic to the port shares 27% NOx emission and 28% PM emissions. All the routes that include the part of
No. 13: E6 E20 Söder Söderleden Älvs No. 14: E6 E20 Söder Säröleden Älvs
No. 16: Öckeröleden No. 15: Söderleden from inside
Share of the Port
0,00%
5,00%
10,00%
15,00%
20,00%
25,00%
30,00%
HC CO Nox PM CO2
HC
CO
Nox
PM
CO2
Share of the Port
0,00%
5,00%
10,00%
15,00%
20,00%
25,00%
30,00%
HC CO Nox PM CO2
HC
CO
Nox
PM
CO2
Share of the Port
0,00%
5,00%
10,00%
15,00%
20,00%
25,00%
30,00%
HC CO Nox PM CO2
HC
CO
Nox
PM
CO2
Share of the Port
0,00%
5,00%
10,00%
15,00%
20,00%
25,00%
30,00%
HC CO Nox PM CO2
HC
CO
Nox
PM
CO2
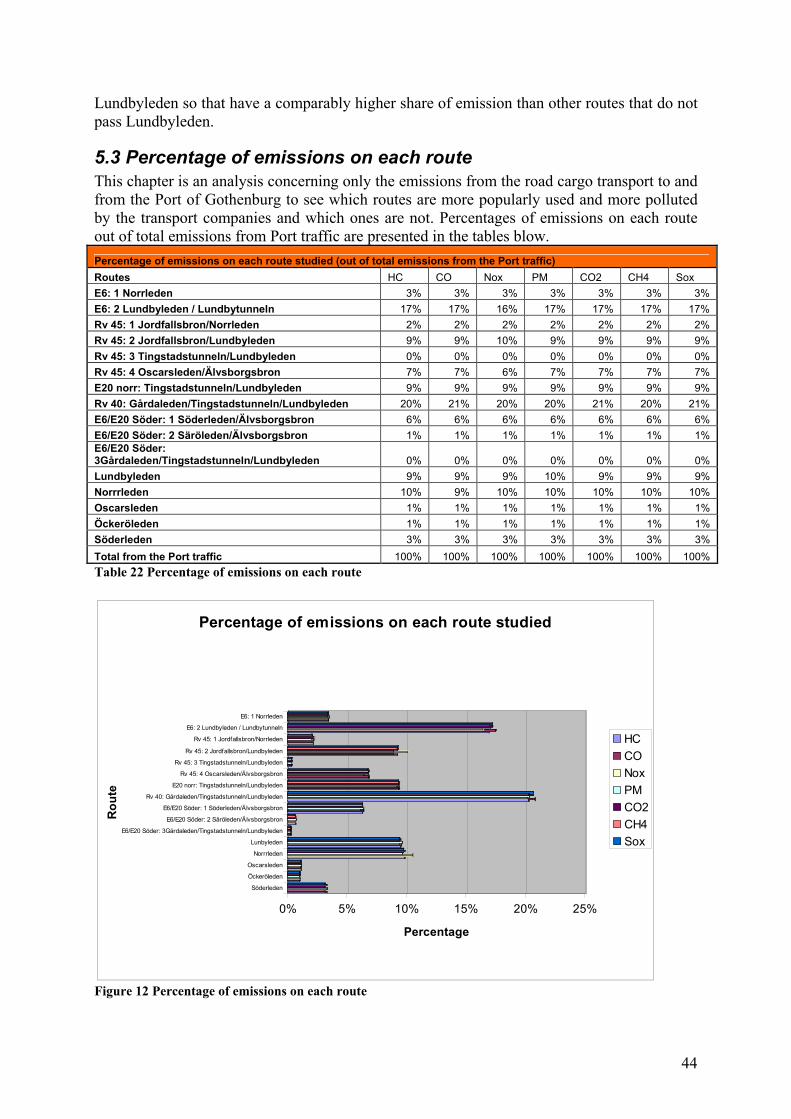
44
Lundbyleden so that have a comparably higher share of emission than other routes that do not pass Lundbyleden.
5.3 Percentage of emissions on each route
This chapter is an analysis concerning only the emissions from the road cargo transport to and from the Port of Gothenburg to see which routes are more popularly used and more polluted by the transport companies and which ones are not. Percentages of emissions on each route out of total emissions from Port traffic are presented in the tables blow.
Percentage of emissions on each route studied (out of total emissions from the Port traffic)
Routes HC CO Nox PM CO2 CH4 Sox
E6: 1 Norrleden 3% 3% 3% 3% 3% 3% 3%
E6: 2 Lundbyleden / Lundbytunneln 17% 17% 16% 17% 17% 17% 17%
Rv 45: 1 Jordfallsbron/Norrleden 2% 2% 2% 2% 2% 2% 2%
Rv 45: 2 Jordfallsbron/Lundbyleden 9% 9% 10% 9% 9% 9% 9%
Rv 45: 3 Tingstadstunneln/Lundbyleden 0% 0% 0% 0% 0% 0% 0%
Rv 45: 4 Oscarsleden/Älvsborgsbron 7% 7% 6% 7% 7% 7% 7%
E20 norr: Tingstadstunneln/Lundbyleden 9% 9% 9% 9% 9% 9% 9%
Rv 40: Gårdaleden/Tingstadstunneln/Lundbyleden 20% 21% 20% 20% 21% 20% 21%
E6/E20 Söder: 1 Söderleden/Älvsborgsbron 6% 6% 6% 6% 6% 6% 6%
E6/E20 Söder: 2 Säröleden/Älvsborgsbron 1% 1% 1% 1% 1% 1% 1% E6/E20 Söder: 3Gårdaleden/Tingstadstunneln/Lundbyleden 0% 0% 0% 0% 0% 0% 0%
Lundbyleden 9% 9% 9% 10% 9% 9% 9%
Norrrleden 10% 9% 10% 10% 10% 10% 10%
Oscarsleden 1% 1% 1% 1% 1% 1% 1%
Öckeröleden 1% 1% 1% 1% 1% 1% 1%
Söderleden 3% 3% 3% 3% 3% 3% 3%
Total from the Port traffic 100% 100% 100% 100% 100% 100% 100%
Table 22 Percentage of emissions on each route
0% 5% 10% 15% 20% 25%
Percentage
E6: 1 Norrleden
E6: 2 Lundbyleden / Lundbytunneln
Rv 45: 1 Jordfallsbron/Norrleden
Rv 45: 2 Jordfallsbron/Lundbyleden
Rv 45: 3 Tingstadstunneln/Lundbyleden
Rv 45: 4 Oscarsleden/Älvsborgsbron
E20 norr: Tingstadstunneln/Lundbyleden
Rv 40: Gårdaleden/Tingstadstunneln/Lundbyleden
E6/E20 Söder: 1 Söderleden/Älvsborgsbron
E6/E20 Söder: 2 Säröleden/Älvsborgsbron
E6/E20 Söder: 3Gårdaleden/Tingstadstunneln/Lundbyleden
Lunbyleden
Norrrleden
Oscarsleden
Öckeröleden
Söderleden
Ro
ute
Percentage of emissions on each route studied
HC
CO
Nox
PM
CO2
CH4
Sox
Figure 12 Percentage of emissions on each route

45
The table and graph show an image of the share of emissions from the Port road traffic on each route out of the total emissions from the Port. For the routes from outside the city boundary, the biggest share of the emissions is from Rv40:Gårdaleden/Tingstadstunnel/Lund. The lorries on their way to the Port in this direction account for about 20% of HC; 21% of CO; 20% of NOx; 20% of PM and 21% of CO2 emitted from the road transports dealing with the Port of Gothenburg. The E6: 2 Lundbyleden / Lundbytunneln direction is the second route that is much used by lorries on their way to the Port. Emissions around this route amount to 17% of HC; 17% of CO; 16% of NOx; 17% of PM and 17% of CO2 of the total emissions of the road transports working with and for the Port. There are some routes which are not popular between the haulage companies: Rv 45: 3 Tingstadstunneln/Lundbyleden and E6/E20 Söder: 3Gårdaleden/Tingstadstunneln/Lundbyleden. The above routes are not used at all and the Port does not contribute directly to the air emissions caused by road transports in this area. E6/E20 Söder: 2 Säröleden/Älvsborgsbron (1% of HC; 1% of CO; 1% of NOx; 1% of PM and 1% of CO2 ); Rv 45: 1 Jordfallsbron/Norrleden 2% of HC; 2% of CO; 2% of NOx; 2% of PM and 2% of CO2 and E6: 1 Norrleden 3% of HC; 3% of CO; 3% of NOx; 3% of PM and 3% of CO2) are the other directions which are quite unused by the road traffic coming from outside the Gothenburg region to the Port; here the Port accounts for a small percentage of the air pollutions. Regarding the road cargo transports inside the city boundaries to the Port of Gothenburg. Lundbyleden and Norrleden are the most actively used routes for the cargo transportation to/from the Port inside the Gothenburg region. The share of emissions on these routes is around 9-10% for every kind of emissions compared with the total emissions from the Port road traffic. Oscarsleden and Öckeröleden are not used so much by the cargo transport inside of city. Transports choosing these directions accounts for 1% of every kind of air emissions of the total air emissions from the Port in Gothenburg region.
5.4 Containers haulage versus trailer haulage
In Ton
HC CO NOx PM CO2 CH4 SOx Total emissions from trailers 2.54 9.17 59.89 1.11 5968.1 0.06 0.03 Total emissions from containers 4.88 17.77 116.08 2.18 11465.0 0.12 0.06 Table 23 Comparison of emissions from trailers and containers

46
0,00
2000,00
4000,00
6000,00
8000,00
10000,00
12000,00
HC CO Nox PM CO2 CH4 Sox
Comparison of emissons from trailers and containers
Total emissions from trailers Total emissions from contailers
Figure 13 Comparison of emissions from trailers and containers In all the emissions generated from the road cargo transport to and from the Port of Gothenburg, container transports contribute to more than 60 percent of the total emissions and twice as big as the emissions from trailer haulage. This is because the amount of container business is much larger than that of trailers. The container terminal of the Port of Gothenburg is one of the biggest in Sweden. The Container and Car Terminals account for the majority of the container turn-over of 700,000 TEU per year of the Port.
5.5 The cost of emissions for society
As to Vägverkets publications 1999.17038 emissions of NOx, HC , SO2 and PM make for health problems; atmosphere, water and ground pollutions and corrosion. On the base of Leksell’s study regarding health affecting by the most well known pollutants Vägverket presents the approximate costs for society of different kind of air emissions (in SEK per kg of emission).
Emissions Cost (SEK/kg) NOx 60 SO2 20 HC 30 CO2 1.5
Table 24 Cost of emissions in monetary unit The emissions of the companies dealing with the Port of Gothenburg could be transferred into a monetary unit for the social cost to the Gothenburg region.
Emissions NOx SO2 HC CO2
Cost (SEK/KG) 60 20 30 1.5
Total from the Port (Ton) 175.96 0.09 7.42 17 433.13 Total cost
Environmental cost to the city (SEK)
10 557 851 1 755 222 580 26 149 699 36 932 000
Table 25 Total cost to the society
38 Vägverket, Borlänge, December 1999

47
5.6 Reliability and validity
The data collected for the case study are those that were delivered by the companies in their responses to the questionnaires. Collection of the data in this way and interviewing of the competitive personal of the Port make it possible to supply this case study with the data that would other wise be almost impossible to get in any other way. High responding rate of the questionnaire makes sure the reliability of the source data in use. The emissions are calculated according to the number of different Euro class engines owned by the companies; the loading factor was taken into consideration; and emissions are calculate separately for the lorry used for container haulage and for the lorry used for trailer haulage. From this point of view, the initial data used for calculation of emissions has a high percent reliability; all the data are supported by answers of the companies as well as by the information provided by the people of the Port who are in charge of this project. The emissions data of the road transports provided by EnviMan, Miljöförvaltning are built on the approximately number of transports in the city: division of initial data by Euro class, containers/trailers, the loading factor is neglected. Consequently, the final calculation of emissions has less reliability than those of the present case of the Port. The recommendation and gathered information of NTM are used for calculations of emission of the present case. As this method is recommended by the Swedish authorities as the most simple and effective in practice the case could be an example for the transport companies that are interested in the subject.

48
6 Recommendations Considering the current situation of the port, recommendations are given to reduce the emissions from the road cargo transport to and from the Port of Gothenburg.
6.1 Dry port
6.1.1 Dry port concept The dry port concept is based on a seaport directly connected by rail with inland intermodal terminals where shippers can leave and/or collect their goods in intermodal loading units as if directly to the seaport (Leveque and Roso, 2001). Services like storage, consolidation, depot, maintenance of containers, track and tracing, custom clearance, etc., should be available at the dry port.
Figure 14 Dry port concept From an environmental perspective, dry port implementation can be a worthwhile solution for seaport terminals congestion as well as for better inland access. With dry port implementation CO2 emissions should decrease, queues and long waiting times at seaport terminals should be avoided, as well as the potential risk for road accidents.
6.1.2 Emissions reduction by implementation of dry port
0,00
2000,00
4000,00
6000,00
8000,00
10000,00
12000,00
14000,00
16000,00
18000,00
20000,00
HC CO Nox PM CO2 CH4 Sox
Total from the Port
Total emissions from trasnportstart from outside the city
Total emissions from trasnportstart from the city area
0,00
100000,00
200000,00
300000,00
400000,00
500000,00
600000,00
700000,00
800000,00
900000,00
1000000,00
HC CO Nox PM CO2
Total from the Port
Total in the city
Total emissions from trasnportstart from outside the city
Total emissions from trasnportstart from the city area
Figure 15 Emissions reduction by implementation of dry port

49
HC CO Nox PM CO2 CH4 Sox
Total from the Port 7.42 26.94 175.96 3.30 17433.13 0.18 0.09
Total in the city 3267.4 24736.5 3454.2 74.53 875134.8 Total emissions from transport start from outside the city 5.59 20.46 131.57 2.48 13205.52 0.13 0.07 Total emissions from transport start from the city area 1.83 6.48 44.40 0.81 4227.61 0.04 0.02 Share of the Port (If only transport from inside the city) 0.06% 0.03% 1.29% 1.09% 0.48%
See from the graph, 75 percent of the emissions from the road transport to the port are generated from transport tasks that start (or end) outside the city area. If the dry port theory is implemented, all this emissions will be shifted outside the city area which means a 75 percent reductions of emissions from the road transport to the Port of Gothenburg. The share of emissions from the road transport will by then take only 1,29 percent of NOx emissions, 1,09% of CO2 emissions. But so far, it does not seem to be necessary to implement dry port if just to see from the emissions aspect of the port operation since Port of Gothenburg now takes only a small share of the emissions out of the whole city road traffic. In the future, if the Port expands the container and trailer business to a greater extent, the dry port theory could be a very good choice because it is quite possible to increase the railway capacity to the Port. The dry port theory can reduce the total emissions to the city area by a considerably large part of 75 percent.
6.2 New types of engines
Company No. Euro 0 pcs %
Euro 1 pcs %
Euro 2 pcs %
Euro 3 pcs %
Euro 4 pcs %
2 0% 0% 15 71% 6 29% 0%
5 0% 0% 2 25% 6 75% 0%
6 0% 4 15% 13 48% 10 37% 0%
8 0% 0% 2 33% 4 67% 0%
10 1 8% 2 17% 6 50% 3 25% 0%
14 0% 0% 400 67% 200 33% 0%
18 5 2% 10 4% 74 32% 129 56% 14 6%
19 0% 0% 2 100% 0% 0%
20 0% 0% 0% 1 100% 0%
21 0% 0% 2 33% 4 67% 0%
24 0% 0% 10 100% 0% 0%
30 0% 0% 5 83% 1 17% 0%
31 0% 0% 2 22% 7 78% 0%
32 0% 0% 0% 5 100% 0%
33 0% 0% 0% 2 100% 0%
35 0% 0% 0% 1 100% 0%
42 0% 0% 10 45% 12 55% 0%
43 0% 0% 4 36% 7 64% 0%
46 0% 0% 0% 4 100% 0% Total 6 1% 16 2% 547 56% 402 41% 14 1%
Table 26 Percentages of different Euro classes engines in use
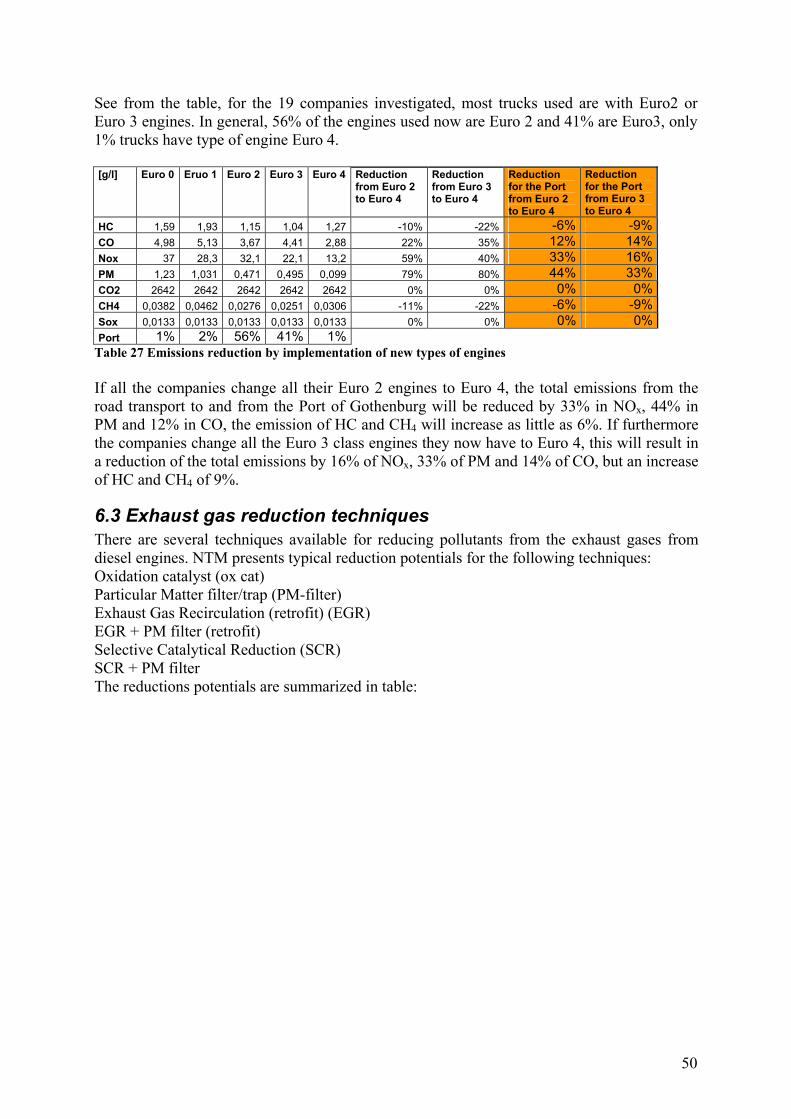
50
See from the table, for the 19 companies investigated, most trucks used are with Euro2 or Euro 3 engines. In general, 56% of the engines used now are Euro 2 and 41% are Euro3, only 1% trucks have type of engine Euro 4. [g/l] Euro 0 Eruo 1 Euro 2 Euro 3 Euro 4 Reduction
from Euro 2 to Euro 4
Reduction from Euro 3 to Euro 4
Reduction for the Port from Euro 2 to Euro 4
Reduction for the Port from Euro 3 to Euro 4
HC 1,59 1,93 1,15 1,04 1,27 -10% -22% -6% -9% CO 4,98 5,13 3,67 4,41 2,88 22% 35% 12% 14% Nox 37 28,3 32,1 22,1 13,2 59% 40% 33% 16% PM 1,23 1,031 0,471 0,495 0,099 79% 80% 44% 33% CO2 2642 2642 2642 2642 2642 0% 0% 0% 0% CH4 0,0382 0,0462 0,0276 0,0251 0,0306 -11% -22% -6% -9% Sox 0,0133 0,0133 0,0133 0,0133 0,0133 0% 0% 0% 0% Port 1% 2% 56% 41% 1% Table 27 Emissions reduction by implementation of new types of engines If all the companies change all their Euro 2 engines to Euro 4, the total emissions from the road transport to and from the Port of Gothenburg will be reduced by 33% in NOx, 44% in PM and 12% in CO, the emission of HC and CH4 will increase as little as 6%. If furthermore the companies change all the Euro 3 class engines they now have to Euro 4, this will result in a reduction of the total emissions by 16% of NOx, 33% of PM and 14% of CO, but an increase of HC and CH4 of 9%.
6.3 Exhaust gas reduction techniques
There are several techniques available for reducing pollutants from the exhaust gases from diesel engines. NTM presents typical reduction potentials for the following techniques: Oxidation catalyst (ox cat) Particular Matter filter/trap (PM-filter) Exhaust Gas Recirculation (retrofit) (EGR) EGR + PM filter (retrofit) Selective Catalytical Reduction (SCR) SCR + PM filter The reductions potentials are summarized in table:

51
Table 28 Exhaust gas reduction techniques The answers from the questionnaire show that only three companies use such techniques as PM filter and NOx cleaning systems. None of the companies who answered the questionnaire well enough to be used in the calculation have this kind of emission reduction techniques on their trucks. This shows that the haulage companies pay too little attention to the use of the cleaning techniques that are very effective methods in reducing of exhaust gas emissions. This also showed a big potential for the transport companies dealing with the Port of Gothenburg in improves their environmental performances. The table shows that if SCR and PM filter techniques are used, the NOx emissions can be reduced by 81% percent, and for the PM pollutant even more up to 90% could be removed. These two pollutants are exactly the most polluting factors from the road transport companies that have traffic to the Port. If the techniques are used commonly among the companies, the NOx and PM pollutant shares from the road transport to and from the port can be reduced to below 1% out of the total NOx and PM emissions from the city.
6.4 NTM calculation
The feeling of competition to be awarded by the Port of Gothenburg as the most “green company of Gothenburg” (or to be declared as a most “polluting company of Gothenburg”) could push the haulage companies into taking some measures in an environmentally friendly direction. The Port of Gothenburg could be recommended time-to-time to make spot checks among the lorries of the companies that the Port is dealing with. NTMcalc method provided by NTM on its web pages is a very simple and easy method to use with this scope. Following the instructions, haulage companies could calculate emissions with NTMcalc regularly by themselves thus easily improving their environmental performance. Graphs below show an example of emissions calculation steps with the help of NTMcalc.

52
Set parameters and click 'Save'! Save
Step1 Lorry , Description: Collect the good in GJteborg
Vehicle
type Heavy duty lorry w ith trailer (40 tonne max load)
Load factor 70
Engine and fuel
type
Euro 0, Mk 1 Fuel
consumption
4.9
km
Distance
1 km, whereof in urban area
0 km
2
Exhaust after-
treatment
Data
Version 1.9.9
2003-10-17
Send suggestions regarding this page here
(check FAQ first). © 2002-2003 NTM.
Result:
Results per tonne goods with respect to fuel production including data from fuel production life cycle
Step1 Sum
High High Med
Low Med
Low
0.052 0.052 CO2 Total [kg] 0.047
0.041 0.047
0.041 [kg]
0.052 0.052 CO2 Fossil [kg] 0.047
0.041 0.047
0.041 [kg]
0.89 0.89 NOx [g] 0.79
0.70 0.79
0.70 [g]
0.10 0.10 HC [g] 0.092
0.080 0.092
0.080 [g]
CH4 [g] N/A
N/A
[g]
0.084 0.084 CO [g] 0.075
0.065 0.075
0.065 [g]
0.021 0.021 PM [g] 0.018
0.016 0.018
0.016 [g]
0.013 0.013 SO2 [g] 0.012
0.010 0.012
0.010 [g]
Energy, renewable [MJ] 0
0
[MJ]
0.73 0.73 Energy, fossil [MJ] 0.65
0.57 0.65
0.57 [MJ]
Energy, nuclear [MJ] 0
0
[MJ]
Step Description Parameters Source, emission data
Step 1 Collect the freight in Göteborg
Vehicle type: Heavy duty lorry with trailer Max load: 40 tonne Engine and fuel type: Euro 0, Mk 1 Exhaust after-treatment: Saknas Fuel consumption: 4,9 l/10km Distance outside urban areas: 1km Load factor: 70%
Volvo LV & Scania 1998
Figure 16 Example: NTMcalc method

53
6.5 Shift to alternative routes
According to the feedback from the transport companies, there is a high concentration of traffic on the road Lundbyleden, which results in the high emissions level especial the NOx and PM pollutants. An easy and effective way to reduce the emissions level on this road is to shift the traffic to alternative roads leading to the Port of Gothenburg. Shifting transport to alternative routes does not reduce the total emissions but can change the emissions concentration on certain roads. For instance, the companies can follow the route of Oscarsleden/Älvsborgsbron where there is not too much traffic to the Port as an alternative route instead of Lundbyleden. The PM and NOx level from the Port traffic on both roads could then be controlled under 10 percent of all the emissions from city road traffic.

54
7 Conclusion The road traffic to and from the Port of Gothenburg for cargo transportation contributes only a small part of the total emissions from road transport to the city of Gothenburg. The most noticeable pollutant are NOx and PM from the heavy traffic to and from the Port, which take 5 percent and 4.4 percent respectively out of the total in the city. This was mainly resulted from the commonly used old types of Euro 2 and Euro 3 diesel engine for heavy truck, as well as the lack of concern for exhaust gas reduction techniques from the road transport companies dealing with the Port. CO2 emissions from the Port road transport is small as it is only less than 2 percent out of the total CO2 emissions from road traffic in the city. Other pollutants as HC and CO contribute only 0,23 and 0,11 percent to the total emissions in the City of Gothenburg. On some routes there are high contributions from the port traffic to the city emissions like on route Lundbyleden the NOx and PM share more than 27 percent of the whole traffic. The utilization of vehicles is high as 75 percent of trailers are full-loaded. 56 percent of the containers trucks are full utilized, which still leaves room for improvement. The most recommended suggestion for the road transport company is to implement exhaust gas reduction technique like SCR and PM filter on their trucks, which will reduce the NOx and PM emissions by more than 80 percent. If the container business in the Port of Gothenburg in the future five years expands by more than 50 percent of the current level, the CO2 emissions from port road transport will increase to a 3 percent share of the whole city, and the NOx and PM emissions could be reduced to less than 2 percent if the new Euro class engines and exhaust gas reduction techniques are implemented. Dry port concept could be a further research topic if the Port of Gothenburg keeps expanding in five to ten years, which could reduce the total traffic to the Port and thereby the emissions by 75 percent.

55
8 References Unpublished Sources: Bergqvist, R. & Esping, P., 2003, The Potential of West European Sea-Based Intermodal Systems, Gothenburg Sweden, Elanders Novum. Then, D.S , 1996, A study of organisational response to the management of operational property assets and facilities support services as a business resource – real estate asset management", Heriot-Watt University, Edinburgh., unpublished thesis Leif Enarsson, 2004, BGS, LTM, Lecture in Transportation; OH-copies Environment and Transportation Rikard Engström, 2004, BGS, LTM, Lecture n.2-3 in Transport Economics and management Environmental Handbook for Transport Purchasing; TFK, Report 1998:4E
Violeta Roso, 2005, Evaluation of dry port concept from an environmental perspective, ISL 2005 Conference Proceedings, Lisbon, Portugal
Vägverket, December 1999l, Samhällekonomiska kalkylvärden, Planeringsomgång 2002-2011, Borlänge,
Göteborgs Stad Miljöförvaltningen, 2005, Beräkningar of luftföreningar i Göteborgs Hamn, R 2005:03 Published Sources: Nouf Al-Iryani and Thomas Gassin, Master thesis 2004: 62, Deciding a distribution network design, GBS; Logistics and transport Management. Richard Thomas, 1997, Quantitative Methods for Business studies, Prentice Hall Europe Neuman, W.L. (1997), Social Research Methods, Qualitative and Quantitative Approaches, Allyn & Bacon, Needham Heights, MA., Fellows, R, Liu, A (1997), Research Methods for Construction, Blackwell Science Limited, Oxford., Maria Björklund, 2005, Purchasing Practices of Environmentally Preferable Transport Services – Guidance to increased shipper consideration, Lund University Blinge M. et al., 2000, Underlagsdokument till Vägverkets åtgärdskatalog kring logistik och miljö, TFK, Göteborg Yin Robert K., 2004, Case Study Research, Design and Methods, Sage Publications Blinge Magnus , 2003-03-26, TFK Miljö och Logistik
56
Port of Göteborg, Annual report 2003 Articles Marvin L. and John F., 2003, Data mining and the impact of missing data, Industrial Management & Data Systems 103/8 Wu H. and Dunn S., 1995, Environmentally responsible logistics systems, International Journal of Physical Distribution & Logistics Management, vol..25, no.2. Albrecht J (2001) “Tradable CO2 permits for cars and trucks”, Journal of Cleaner Production, 9:179-189. Internet sources: Dilanthi Amaratunga, David Baldry, Marjan Sarshar, Rita Newton, Quantitative and qualitative research in the built environment: application of “mixed] research approach http://www.emeraldinsight.com.ezproxy.ub.gu.se/Insight/ViewContentServlet?Filename=Published/EmeraldFullTextArticle/Articles/0790510103.html, download 2005.11.22 http://www.trafikkontoret.goteborg.se/ http://www.uk.map24.com/ http://www.naturvardsverket.se/, IVL Svenska Miljöinstitutet AB, 2005, IVL report B 1607, download 2005.12.07 http://www.sweden.gov.se/sb/d/2023/a/22847, The Swedish Environmental Code, 2000, Government Offices of Sweden, download 2005.12.09 http://www.energikontorso.com/transporteko/projekt/mobility_management/Dokument/Vart%20%C3%A4r%20vi%20p%C3%A5%20v%C3%A4g.pdf, download 2005.12.11 http://www.internat.naturvardsverket.se/documents/pollutants/climate/climate/fcccdata/NIR.pdf, download 2005.12.11 www.ntm.a.se http://www.kines.uiuc.edu/labwebpages/Kinesmetrics/Missing%20Data/MDA_AAHPERD04_Kang.pdf, download 2005.11.12
Interviewing Bengt Cederman, Safety and environment, Skandia Harbour, [email protected] Björn Sigström, Environmental Controller Stab miljö, [email protected] Jan Brandberg, Miljöförvaltning, Gothenburg

57
9 Appendix
9.1 Questionnaire
Frågeformulär: Transporter med lastbil till och från Skandia- och Älvsborgshamnarna Tack för att Ni tar Er tid att fylla i nedanstående uppgifter. De kommer att ligga till grund för beräkningar av Göteborgs Hamn AB:s indirekta miljöpåverkan, orsakade av transporter på land. Krav på sådana utredningar finns att finna I Miljöbalken. Alla uppgifter kommer att behandlas av två studenter från Chalmers Tekniska Högskola som hanterar Era uppgifter konfidentiellt. Gemensamt har vi ett mycket stort intresse i detta arbete för vår fortsatta utveckling. Fordonspark 1. Var vänlig ange antalet fordon per miljöklass i Er fordonspark som Ni brukade för transporter till och från Göteborgs hamn under maj - juni 2005 Euro 0 Euro 1 Euro 2 Euro 3 2. Var vänlig ange genomsnittlig motorstyrka per miljöklass i kW Euro 0 Euro 1 Euro 2 Euro 3 3. Var vänlig ange antalet fordon per miljöklass som Ni utrustat med NOx rening Euro 0 Euro 1 Euro 2 Euro 3 4. Var vänlig ange antalet fordon som Ni utrustat med partikelfilter Euro 0 Euro 1 Euro 2 Euro 3 5. Har Ni anskaffat eller har Ni planer på att anskaffa någon lastbil av 2005 års modell under detta år. Ange i så fall hur många 2005 6. Var vänlig ange hur många containrar Ni har samtidig transportkapacitet för, till och från hamnen. (D v s att om Ni har fyra fordonssammansättninga av dragbil med 12m släpvagnschassi anger Ni 8 st. 20 fot och 8 st. 40 fot, vilket innebär att Ni för dessa fordon anger full last export och full last import. Vi räknar om till TEU). 20 fots container 40 fots container Alla containrar större än 20 fot anges som 40 fots.
Företag: __________________________________________ Kontaktperson: ____________________________________

58
7. Hur stor andel av Era fordon transporterar containrar respektive trailrar till och från hamnen? Ange i procent. Containrar % Trailrar % I Göteborgs Hamn AB:s tillståndsansökan för Skandia- och Älvsborgshamnarna inkl Arendal har avgränsningen för vårpåverkbara miljöpåverkan satts mot Ivarbergsmotet i öster och Öckeröleden i norr till i höjd med Arendalsmotet. Vad vi måste utreda är om hamnens veerksamhet har någon betydande påverkan på miljön utanför detta område. Vägval 8. Hur många transporter utför Ni per år till och från hamnen via någon av följande tillfartsleder genom Göteborg och som sträcker sig utanför kommungränsen? E 6 Norr Rv 45 Rv 40 E6/E20 Söder E20 Norr 9. Hur många transporter per år utför Ni inom Göteborg mellan hamnen och någon godsterminal eller industri där någon avnedanstående leder nyttjas? Lundbyleden Norrleden Oscarsleden Öckeröleden Söderleden
10. Vilka av nedanstående vägval gör Ni när Ni skall till eller från någon av nedanstående destinationer. Stryk under det mest tillämpliga vägvalet. E6 norr: 1 Norrleden; 2 Lundbyleden / Lundbytunneln; 3 Annan väg Rv 45: 1 Jordfallsbron/Norrleden; 2 Jordfallsbron/Lundbyleden; 3 Tingstadstunneln/Lundbyleden; 4 Oscarsleden/Älvsborgsbron; 5 Annan väg E20 norr: 1 Tingstadstunneln/Lundbyleden; 2 Oscarsleden/Älvsborgsbron; 3 Annan väg Rv 40 1 Gårdaleden/Tingstadstunneln/Lundbyleden; 2Gårdaleden/Oscarslede/Älvsborgsbron; 3 Annan väg E6/E20 Söder: 1 Söderleden/Älvsborgsbron; 2 Säröleden/Älvsborgsbron;

59
3 Gårdaleden/Oscarsleden/Älvsborgsbron; 4 Gårdaleden/Tingstadstunneln/Lundbyleden; 5 Annan väg Statistik 2004 11. Var vänlig ange nedan hur många lastade resp tomma containrar Ni transporterade till och från hamnen under 2004. Antal tomma Antal lastade 20' Antal lastade 40' Hur många resor gjorde Ni till hamnen under året 12. Var vänlig ange nedan hur många trailrar Ni transporterade.till och från hamnen under 2004. Antal trailrar Antal resor Ytterligare information som Ni vill delge oss Svaren skickas som brev till; (Vänligen märk kuvertet: ”Landtransporter enkät”) Göteborgs Hamn AB Björn Sigström 403 38 GÖTEBORG eller som bifogat i E-mail till: [email protected] och [email protected] Har Ni några frågor: Kontakta; Björn Sigström, (Avd Miljö, tel. 031 731 2303) eller Bengt Cederman, (Containerterminalen, tel. 031 731 2718)

60
Parallellt med denna undersökning kan det förekomma likvärdiga undersökningar som görs av andra intressenter. Denna undersökning är dock strikt kopplad till det fortsatta arbetet kring Göteborgs Hamn AB:s tillståndsansökan för att få lov att bedriva hamnverksamhet över Skandia-, Älvsborg och Arendalshamnarna. Det är därför av mycket stor betydelse för vår gemensamma utveckling att Ni tar Er tid att redovisa dessa uppgifter.