grain market research project - usaid
TRANSCRIPT
Grain Market Research Project
MEETING FOOD AID AND PRICESTABILIZATION OBJECTIVES
THROUGH LOCAL GRAINPURCHASE: A REVIEW OF THE
1996 EXPERIENCE
Wolday AmhaJulie Stepanek
T.S. JayneAsfaw Negassa
WORKING PAPER 7GRAIN MARKET RESEARCH PROJECTMINISTRY OF ECONOMIC DEVELOPMENT AND COOPERATIONADDIS ABABAMAY 1997
MEETING FOOD AID AND PRICE STABILIZATION OBJECTIVESTHROUGH LOCAL GRAIN PURCHASE: A REVIEW OF THE 1996 EXPERIENCE
Wolday Amha, Julie Stepanek, T.S. Jayne, and Asfaw Negassa
EXECUTIVE SUMMARY
Ethiopia has been a food deficit country for many years. Since 1994, however, grainproduction has increased steadily, with the largest crop on record reported in 1995/96. Theapparent transition to food self-sufficiency is welcomed, yet it brings with it new developmentchallenges. Grain prices in recent years have fallen far below their historical average.Concerns have arisen that lower prices may reverse the recent gains made in promoting use offertilizer and improved seeds by smallholder farmers. In addition, national food self-sufficiency has not overcome the chronic food insecurity problem facing many people.Despite increased production and lower grain prices, a large segment of the rural populationcontinues to be unable to secure an adequate food supply. The current situation is thereforeone of food self-sufficiency co-existing with widespread poverty.
Therefore, while there remains a clear need for continued food assistance for vulnerablegroups, the typical method of importing food aid from donor countries was viewed as likely toexacerbate the country’s existing supply glut and further depress cereal prices to the detrimentof agricultural production growth. To address this problem, the Government has arrangedwith donors to procure food aid from domestic markets through purchase from local traders.The objective of the program was to buy grain locally to fulfill domestic food aidrequirements. However, local purchase programs can also be designed to support other policyobjectives, including stabilizing market prices during supply gluts and encouraging thedevelopment of the marketing system. Supporting producer prices of maize and wheat was anexplicit policy objective of the Government of Ethiopia in 1996.
The objective of this paper is to identify factors that can improve the ability of future localpurchase activities to achieve a range of national food policy objectives. This analysis reviewsthe design and implementation of 1996 local purchase activities in Ethiopia in relation to threekey policy objectives: price stabilization for farmers; promoting the development of acompetitive and low-cost food marketing system; and procuring food aid resources in a cost-effective manner.
The analysis of the 1996 Ethiopia experience provides potentially valuable lessons for thedesign of future local purchase programs throughout Africa. The major conclusions of thestudy are:
1. The EU local purchase program has been clearly successful in meeting its primaryobjective: building up emergency food reserves. Almost 100,000 tons of grain wereprocured under the program in 1996, at an average cost of $251 per ton. This costwas slightly below the landed import cost of comparable quality grain at most of thespecified delivery sites.
-ii-
2. There appear to be opportunities to significantly reduce the procurement cost of localgrain purchase in the future. Several aspects of the program inflated the costs of grainprocurement and hence reduced the amount of grain that could have been procured forrelief and stabilization purposes with the amount of funds devoted to the Program.This include (a) the issuing of tenders of fixed lot sizes that were too large to enablemost Ethiopian grain traders to participate in the program; (b) stringent grain qualityspecifications; (c) regionalization of the tender/auction process; and (d) segmenting theauction process for individual lots. Segmenting the auction process for individual lotsis estimated to have caused the EU to pay 9.8% more than it would have had thetenders not been segmented by region. Details are presented in Section 3 of this study.
3. The evidence suggests but does not prove a lack of competition in the bidding processin 1996. The 1996 Program paid about 12% more for the grain it purchased thanprevailing market values for comparable quality at the specified delivery markets. Tosome extent, this result may also be the consequence of an unpredictable marketenvironment. The costs of local purchase programs can be potentially reduced in thefuture through improved market information and forecasting systems that are widelydisseminated through radio and newspapers. Details are presented in Section 3 of thisstudy.
4. The local purchase of 108,000 tons of grain in 1996 amounted to about 5.4% of themarketed grain output from the 1995/96 meher season. Program purchases of maize,wheat, and sorghum are estimated at about 8.3%, 10.3%, and 18.4% of the totalvolumes marketed of these three commodities. It is difficult to estimate the effect ofthe program on producer prices. Grain prices generally remained atypically flatthrough most of the 1995/1996 marketing year. However, it is likely that producerprices would have been even lower than they were without EU’s intervention.
5. Traders submitting bids under the local purchase program in 1996 appeared to differ insome important respects from the broader cross-section of Ethiopian grain traders. Traders able to submit bids were generally more diversified in their business activities,had greater access to bank credit, and were more likely to own their own trucks thanthe typical grain wholesaler. This may provide an indication of the types of entrybarriers to participation in the 1996 program (see Section 3.7).
The report provides a number of options for consideration to improve the functioning ofpotential local purchase activities in the future. These include: (1) increasing competition inbid process through reduced contract lot size; (2) holding one auction rather than a set oflocalized auctions; (3) reviewing the costs and benefits of requiring stringent grain qualitystandards; and (4) changing the timing of local purchase activities to earlier in the marketingseason when a greater proportion of farmers are selling their crops and can potentially benefitfrom the increased demand of local purchase activities.

-iii-
ACKNOWLEDGEMENTS
The authors thank Aklu Girgre, Daniel Molla, Gebremeskel Dessalegn, Alemu Asfaw, AliSaid, Jim Shaffer, Michael Weber, and Jean-Charles LeVallee for their support in theimplementation of this study. We also extend our apprecation to the staff at the EuropeanUnion Food Security Unit, in particular Paulo Mattei, Hansjorg Neun, Pascal Joannes, andChris Pierson, for their helpful sharing of information and encouragement of this study.
-iv-
Contents
1. Introduction . . . . . . . . . . . . . . . . . . . . . . . . . . . . . . . . . . . . . . . . . . . . . . . . . . . . . . 11.1 Problem Statement . . . . . . . . . . . . . . . . . . . . . . . . . . . . . . . . . . . . . . . . . . . . . . . 11.2 Objectives . . . . . . . . . . . . . . . . . . . . . . . . . . . . . . . . . . . . . . . . . . . . . . . . . . . . . 21.3 Research Questions . . . . . . . . . . . . . . . . . . . . . . . . . . . . . . . . . . . . . . . . . . . . . . 21.4 Methodology . . . . . . . . . . . . . . . . . . . . . . . . . . . . . . . . . . . . . . . . . . . . . . . . . . . 4
2. Conceptual Framework . . . . . . . . . . . . . . . . . . . . . . . . . . . . . . . . . . . . . . . . . . . . . 4
3. Implementation of 1996 Local Purchase Activities. . . . . . . . . . . . . . . . . . . . . . . . 73.1 Description of the Local Purchase Program . . . . . . . . . . . . . . . . . . . . . . . . . . . . 73.2 Timing of Tender Announcement and Delivery. . . . . . . . . . . . . . . . . . . . . . . . . . 93.3 Lot Size . . . . . . . . . . . . . . . . . . . . . . . . . . . . . . . . . . . . . . . . . . . . . . . . . . . . . . 113.4 Pre-Announcement of Amount to be Purchased . . . . . . . . . . . . . . . . . . . . . . . . 123.5 Quality Standards . . . . . . . . . . . . . . . . . . . . . . . . . . . . . . . . . . . . . . . . . . . . . . . 123.6 Actual Bid Price and Market Price Comparisons . . . . . . . . . . . . . . . . . . . . . . . . 133.7 Importance of Trader’s Asset Level in Determining Participation . . . . . . . . . . . 163.8 Regionalization of Tenders . . . . . . . . . . . . . . . . . . . . . . . . . . . . . . . . . . . . . . . . 173.9 Separating Tenders by Lots . . . . . . . . . . . . . . . . . . . . . . . . . . . . . . . . . . . . . . . 19
4. Conclusions and Policy Implications. . . . . . . . . . . . . . . . . . . . . . . . . . . . . . . . . . 224.1 Summary of Main Findings . . . . . . . . . . . . . . . . . . . . . . . . . . . . . . . . . . . . . . . . 224.2 Options for Further Consideration to Improve the Functioning of Local Purchase Activities . . . . . . . . . . . . . . . . . . . . . . . . . . . . . . . . . . . . . . . . . . . . . . 244.3 Future Research and Monitoring . . . . . . . . . . . . . . . . . . . . . . . . . . . . . . . . . . . 24
References . . . . . . . . . . . . . . . . . . . . . . . . . . . . . . . . . . . . . . . . . . . . . . . . . . . . . . . . . . . . 26
According to the 1996/97 FAO/WFP Crop and Food Supply Assessment Mission to Ethiopia,1
about 1.9 million Ethiopians will require food assistance in 1997.
-1-
1. INTRODUCTION
1.1 Problem Statement
For years, Ethiopia has not produced sufficient food to feed its people. Importation of cerealfood aid ranged from 0.3 to over 1.1 million tons over the past decade. However, since 1994,food production has increased steadily. Ethiopia experienced the largest grain harvest onrecord in 1995/96. The recent production upsurge is due to a combination of favorableweather, increased use of fertilizer, strengthened agricultural extension programs, and grainmarket liberalization (Mulat et al 1997; Asfaw and Jayne 1997). The 1995/96 harvest hasbeen followed by another bumper crop in 1996/97.
While the transition from chronic national food deficits to food self-sufficiency is welcomed,the new situation has created its own problems for agricultural policy. First, grain prices havefallen far below their historical average, especially in the major cereal-producing regions.Throughout 1996, maize and teff prices in major producing regions were only 60% to 80% oftheir average levels over the past decade (GMRP 1996a). Concerns have arisen that such lowprices might depress farm production, inhibit adoption of fertilizer and improved seedcurrently being aggressively promoted through government extension programs, and retardthe country's recent progress in achieving food self-sufficiency.
A second concern is that the impressive growth in food production at the national level mightlead to a sense of complacency that the country’s hunger problem has largely abated. In fact,a large proportion of the rural population remains unable to secure an adequate food supply. 1
The growth in food production clearly has not overcome the fundamental problem ofwidespread poverty, which prevents the poor from being able to buy sufficient food to feedthemselves even at current low prices. The current situation is therefore one of food self-sufficiency and historically low prices co-existing with large numbers of hungry people.
Therefore, while there remains a clear need for continued food assistance for vulnerablegroups, the typical method of importing food aid from donor countries was viewed as likely toexacerbate the country’s existing supply glut and further depress cereal prices to the detrimentof agricultural production growth. To address this problem, the Government has arrangedwith donors to procure food aid from domestic markets through purchase from local traders. In late 1995, some donors such as the European Union (EU) and World Food Program (WFP)agreed to provide cash instead of food aid to facilitate the local purchase of cereals. Byprocuring grain locally, the program was envisaged to reduce the cost of delivering food aid todistribution areas compared to food aid imports. Price support to producers was not a statedobjective of the local purchase programs implemented in 1996. However, by reducing thevolume of grain circulating in local markets, local purchase of food aid may also support theobjective of stabilizing farm-gate cereal prices during surplus periods. Supporting cerealprices, especially for maize and wheat, was an explicit policy objective of the Government ofEthiopia in 1996. Another potential objective of local purchase is to contribute directly to
In recent years, local purchase programs have also been implemented in Uganda,2
Mozambique, and, to a limited extent, in Zambia.
-2-
new entry and increased investment in the grain marketing system, thereby promoting long-term market development objectives.
Local purchase programs are a relatively new tool in the development agenda. Historically,2
the major donors have provided food aid grain from their own countries. However, it is likelythat local purchase programs will become more important in the future, as some donors’ havebecome more flexible in the form of procuring food aid resources. Analysis of the 1996Ethiopian experience provides potentially valuable lessons for the design of future localpurchase programs in Africa.
1.2 Objectives
The objective of this paper is to identify factors that can improve the ability of local purchaseactivities to meet key food security and food policy objectives. The analysis in this reportconsiders the design and implementation of local purchase programs in relation to three keynational policy objectives:
(1) supporting and stabilizing farm-gate cereal prices to encourage use of productivity-enhancing inputs;
(2) promoting the development of a competitive and low-cost food marketing system; and(3) procuring adequate food aid resources in a cost-effective manner.
Only the third objective — procuring adequate food aid resources in a cost-effective manner— was an explicitly stated objective of the 1996 EU program. However, all three objectiveswere explicitly addressed in the Government of Ethiopia’s Food Security Strategy (1996). Asnoted above, local purchase arrangements have often been advocated as a means to supportthe achievement of a range of objectives, such as raising food production incentives andpromoting new entry and competition in the grain marketing system. It is with these criteria inmind that the report analyzes the 1996 experience with local purchase in Ethiopia. Theobjective of the paper is not to evaluate the EU program per se, but rather to identify factorsthat can improve the ability of future local purchase programs to achieve a range of importantnational policy objectives in a cost-effective manner.
1.3 Research Questions
The following research questions were addressed:
1. Were there particular characteristics of traders that submitted bids to sell grain to theProgram? Was the Program designed in such a way as to favor traders with certaincharacteristics and preclude others from participating? If so, what were the
-3-
characteristics of traders submitting bids compared to those who did not? What werethe major barriers to participating in the bid process?
2. What effect did the contract lot size have on the competitiveness and cost-effectiveness of the Program? To participate in the Program, traders had to bid in lotsizes of 3,000 tons. This study assesses whether lot sizes of this magnitude constituteda barrier to entry for smaller traders and reduced competition in the bid process. If so,what effect did a fewer number of participating traders have on the average bid price,and the cost-effectiveness of the Program? By “cost-effectiveness,” we mean theability of the program to procure grain for food aid purposes at the least possible cost,thereby maximizing the volume of grain that can be procured for a given amount ofcash. Donor funds are a scarce resource. As will be shown below, cost-effective useof these scarce resources will maximize the potential contribution of the program tothe three policy objectives specified in Section 1.2.
3. What effect did the timing of tender announcement and delivery have on theProgram? Grain production and sales in Ethiopia have distinct seasonal patterns. Themonths in which tenders are announced, awarded and due for delivery may affect thecost-effectiveness of the Program and the functioning of the grain marketing system.
4. What was the effect of grain quality specifications on the competition and cost-effectiveness of the Program? The Grade I quality standards required under the termsof the Program in 1996 were very stringent, and often required traders to undertakeadditional grain cleaning and fumigation costs before delivery to Program sites.
5. What effect did “region-specific” tenders have on the competitiveness and cost-effectiveness of the Program? The 1996 EU Program featured a set of regionalauctions rather than one national auction. Thus, traders who submitted bids indifferent regions did not compete against each other. This paper assesses the effect ofthe regionalized auction process on the competitiveness and cost-effectiveness of thebid process.
6. What effect did the separation of tenders by lots have on the competitiveness andcost-effectiveness of the Program? Within each region, lots of grain for 3,000 tonswere auctioned separately. As will be shown, this did not necessarily result in thelowest average bid prices being contracted, even within a given region. We examinewhether competition would be enhanced (and whether total costs of grain procurementfrom traders would be reduced) if all lots and regions were combined into one auction.
1.4. Methodology
To address the research questions listed above, the Grain Market Research Project conducteda survey of over half of the participating traders, both winners and losers during August andSeptember, 1996. Over 47 traders showed interest in the program and only 43 submitted bidsto EU (14 traders won the bids). Of these, 27 were surveyed, 10 winners and 17 losers. Astructured questionnaire was used to ask questions about how the traders viewed the bid
-4-
process and contract specifications of the EU program. In addition, questions were askedspecifically to the bid winners and to the bid losers separately. Descriptive statistics were usedto examine the specified research questions.
To examine the competitiveness of the bid process, we also compare the contract pricesagreed upon by the bid winners and the EU with the actual market prices in the respectivedelivery markets. Data on wholesale market prices are reported by the Ethiopian GrainTrading Enterprise (EGTE). It is important to note that differences between forward contractprices and market prices could be due to several factors, including unpredictability in marketconditions, lack of public market information that might otherwise be incorporated into futureprice expectations, quality differences between contracted grain and grain monitored byEGTE, and/or barriers to entry or lack of competition in the bid process.
2. CONCEPTUAL FRAMEWORK
The EU local purchase program has been the first of its kind in Ethiopia. Historically,Ethiopia has relied heavily on imported food provided by donors for its relief programs. Whileprocuring grain for relief purposes from local markets is expected to be less costly thanimporting it from donor countries, this option was never seriously considered in Ethiopia untilrecently due to the country’s longstanding status as a chronic food deficit country. In recentyears, however, the procurement of food aid from local markets also became consistent withthe Government’s efforts to support and stabilize cereal market prices in response to rapidlyincreased production. In recent years, local market prices have been far lower than importparity prices. In addition, proponents of local purchase underscore positive multiplier effects. Money spent by donors on grain purchase is directed to the local economy rather than tointernational grain trade companies. Benefits accrue to Ethiopian traders, but also expand tolocal traders, farmers, grain cleaners, and transporters.
To understand the mechanisms by which local purchase can affect market conditions andtrader behavior, market relationships must be understood. In theory, as more grain is takenoff the market through local purchase (to be used in non-market activities such as food aid),the market supply decreases and this puts upward pressure on prices. In addition, perhapscounter-intuitively, it will be shown that the lower the average bid price is, the more likely theprogram is to succeed in supporting producer prices.
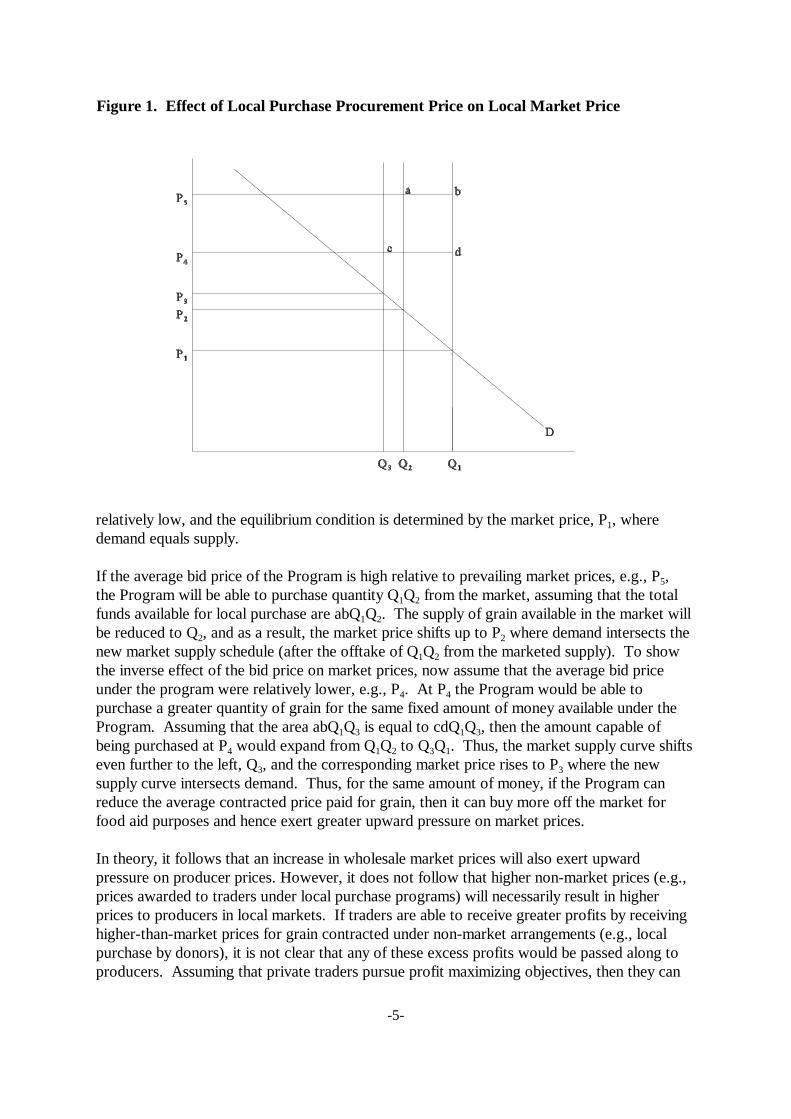
The Ethiopian grain market is represented by Figure 1 below. After the harvest, production isfixed in the short run. The quantity produced and peasants’ consumption and sales behaviordetermine the supply of domestically produced grain, Q . The marketed supply of grain, being1
largely a function of production, is also considered relatively unresponsive to price in the shortrun. The demand for grain in domestic markets is a downward-sloping curve representing theinverse relationship between grain prices and quantity of product purchased by consumers. Ina good harvest year, such as that represented by Q grain prices are1,
-5-
Figure 1. Effect of Local Purchase Procurement Price on Local Market Price
relatively low, and the equilibrium condition is determined by the market price, P , where 1
demand equals supply.
If the average bid price of the Program is high relative to prevailing market prices, e.g., P , 5
the Program will be able to purchase quantity Q Q from the market, assuming that the total1 2
funds available for local purchase are abQ Q . The supply of grain available in the market will1 2
be reduced to Q , and as a result, the market price shifts up to P where demand intersects the2 2
new market supply schedule (after the offtake of Q Q from the marketed supply). To show1 2
the inverse effect of the bid price on market prices, now assume that the average bid priceunder the program were relatively lower, e.g., P . At P the Program would be able to4 4
purchase a greater quantity of grain for the same fixed amount of money available under theProgram. Assuming that the area abQ Q is equal to cdQ Q , then the amount capable of1 3 1 3
being purchased at P would expand from Q Q to Q Q . Thus, the market supply curve shifts4 1 2 3 1
even further to the left, Q , and the corresponding market price rises to P where the new3 3
supply curve intersects demand. Thus, for the same amount of money, if the Program canreduce the average contracted price paid for grain, then it can buy more off the market forfood aid purposes and hence exert greater upward pressure on market prices.
In theory, it follows that an increase in wholesale market prices will also exert upwardpressure on producer prices. However, it does not follow that higher non-market prices (e.g.,prices awarded to traders under local purchase programs) will necessarily result in higherprices to producers in local markets. If traders are able to receive greater profits by receivinghigher-than-market prices for grain contracted under non-market arrangements (e.g., localpurchase by donors), it is not clear that any of these excess profits would be passed along toproducers. Assuming that private traders pursue profit maximizing objectives, then they can
-6-
be expected to offer the lowest price to producers that the market will bear, regardless of theprice at which they are able to sell to donors. Producer prices would be influenced by localpurchase only to the extent that the program alters the supply and demand conditions of themarket, or expectations about future market conditions.
The extent to which local purchase programs affect domestic market prices depends ultimatelyon (a) the quantity of grain to be purchased; (b) the volume of grain circulating in domesticmarkets; and (c) the price elasticities of demand for cereals (i.e., the extent to whichconsumers shift their grain purchase patterns as relative prices of cereals change). The moregrain taken off the market relative to the size of the market, and the more unresponsive iscereal purchase patterns to price, the greater is the expected rise in market prices.
The ability of local purchase programs to achieve desired objectives depends crucially onaccurate information on these variables. Without such information, the appropriate amount topurchase is not clear, and there is the risk that either too much will be purchased with theeffect of driving up prices excessively for consumers, or not enough will be purchased to haveany meaningful effect on producer prices or production incentives.
The potential adverse effects of purchasing too much should not be minimized in a countrysuch as Ethiopia. For example, nationally-representative data from 1996 indicate that about48% of Ethiopia’s rural population are net buyers of grain, i.e., they only purchase grain orpurchase more than they sell (Daniel and Jayne 1996). These households are likely to beadversely affected by programs that increase the price of grain in local markets. In fact, it ispossible that some households that would have had sufficient income to purchase their residualgrain requirements from the market may no longer be able to do so if local purchase programsappreciably raise local market prices.
Another issue to consider in using local purchase to influence market prices is theconcentration of marketed grain output. Again using nationally-representative data from1996, it was found that 10% of Ethiopia’s rural households accounted for over half (52%) ofthe marketed grain. Over 40% of the country’s rural households sold no grain crops of anykind. These results indicate that the marketed grain supply originates from a narrow segmentof the rural population, and that policies and programs designed to support grain prices maybe captured disproportionately by a relatively small number of farmers. Against theseconsiderations must be weighed the relevance of crop revenues in affecting the incentives touse productivity-enhancing inputs such as fertilizer, and expected supply-price responseestimates.

-7-
3. IMPLEMENTATION OF 1996 LOCAL PURCHASE ACTIVITIES
3.1 Description of the Local Purchase Program
The 1996 EU Program was to be implemented in two rounds. However, the second roundwas postponed until after the 1996/97 meher harvest at which time the longer-run marketsituation could be assessed. For the first round, tenders for 108,000 tons (24,000, 42,000, and42,000 tons of wheat, maize, and sorghum) were issued in February and March 1996 fordelivery in June and July to specified locations. The EU announced the tenders in nationalnewspapers and in regional newsletters of the Southern, Amhara, Oromia and Tigray Regions. Efforts were made by the Regional Governments to provide estimates of local production andmarketable cereal surplus to the Local Purchase Steering Committee, chaired by the DisasterPrevention and Preparedness Committee (DPPC).
The EU issued 36 tenders, each in lots of 3,000 tons (Table 1). The location of deliveries wasas follows: 45,000 MT at Mekele; 45,000 MT at Kombolcha; 9,000 MT at Dire Dawa; and9,000 MT at Shashemene. The recipient of the grain was to be the Emergency Food SecurityReserve Administration (EFSRA) except in Tigray Region, where the non-governmentalorganization REST was to receive 33,000 tons of sorghum.
Table 1: Specifics of tenders issued by the EU for grain purchase in Ethiopia in 1996 ( MT)
Particulars Wheat Maize Sorghum Total
Kombolcha March (6,000) (6,000) May 24,000 15,000 6,000 45,000
Dire Dawa - March 3,000 May 6,000 9,000
Shashemene - - May 9,000 9,000
Mekele - February (33,000) March 12,000 (33,000) May 33,000 45,0001
Total 24,000 42,000 42,000 108,000
Source: European Union, Addis Ababa, Ethiopia, 1996.Note: Number in parentheses are tenders that were canceled.
Contracted to EuronAid1

-8-
In most cases, the bids were awarded in late March and April 1996. A trader could submitbids for an unlimited number of lots. Over 100 bids were received from 43 private traders,holding companies, and the government-parastatal EGTE. Among these, 14 came outwinners. Two trading firms won 14 lots, nearly 39% of the total. Five traders won only onelot each, and 4 traders won 2 lots each. For various reasons (e.g., in some cases the lowest-priced bids submitted were in excess of landed import costs), tenders were in some casesreissued and/or canceled. Ultimately, a total of 97,283 tons were purchased in 1996 fromEthiopian markets under the Program. Of this, 20% of the grain was delivered to the specifieddelivery sites by July 1996; 61% was delivered by September 1996, and 86% had beenreceived by November 13, 1996. Deliveries of this first phase of the Program were completedin January 1997.
The 1996 program took place with very little hard information available as to the size of themarket. For these reasons, it was difficult to determine in advance the desired amount topurchase locally. However, to the authors’ knowledge, national marketed cereal supply wasfor the first time estimated and published from nationally-representative smallholder surveydata in 1996, after the major aspects of the Program had already been implemented. Data inTable 2 shows the volume purchased under the Program in 1996 relative to the estimatedvolume of grain marketed from the 1995/96 meher harvest. The data indicate that the 1996Program purchased about 8.3%, 10.3%, and 18.4% of the maize, wheat, and sorghummarketed by the smallholder sector. Since these estimates of national grain sales do notinclude state farms or private commercial farms, the proportion of total grain supplypurchased by the Program were somewhat lower than that stated here.
Table 2. Production and marketed supply of grain, Peasant Sector (meher), 1995/96
Grain
Production Grain marketed* EGTE purchases EU purchases
tons tons % tons marketed tons marketed% of total % of total
Maize 1,696,801 506,436 29.8 29,825 5.9 42,000 8.3
Teff 1,313,035 409,799 31.2 9,468 2.3 - -
Wheat 836,250 233,904 28.0 22,223 9.5 24,000 10.3
Barley 853,979 217,661 25.5 420 0.0 - -
Sorghum 1,342,251 228,613 17.0 2,315 1.0 42,000 18.4
Millet 200,230 38,027 19.0 70 0.2 - -
Pulses 583,346 244,080 41.8 2,849 1.2 - -
Oilseeds 148,956 115,975 77.9 4,435 3.8 - -
Total 6,974,956 1,994,495 28.6 71,605 3.6 108,000 5.4
Source: Asfaw and Jayne, 1996 and EU, 1996.Note: * This does not include the marketed grain by state farms and private commercial farms.
-9-
Table 2 also shows the volume of grain purchased in the 1995/96 season by the EGTE. Between November 1995 and June 1996, the EGTE was mandated to offer farmers aminimum support price for maize and wheat (at 70 and 116 birr per quintal, respectively). However, EGTE was unable to secure sufficient credit to purchase substantial volumes ofgrain and defend the support price. Maize prices in particular were well below the EGTEsupport price in many areas of the country throughout 1996. EGTE’s share of the market wassmall for all crops, which compromised its ability to influence prices in the market. It is notedthat EGTE won five contracts (15,000 tons total) for delivery of maize under the 1996 EUauction.
3.2. Timing of Tender Announcement and Delivery
The success of local purchase activities in meeting desired objectives may be affected by thetiming of tender announcement and delivery. Due to potential seasonality in grain prices, thetiming of tender announcement and delivery may affect the price of bids received as well as thesubsequent movement in market prices.
There is a strong seasonal trend in grain prices in Ethiopia. In general, prices are at theirlowest right after the larger, meher harvest, and then rise steadily until the smaller, belgharvest where prices fall, but rise again to a high before the next meher. Figures 2, 3, and 4show the average monthly prices of maize, wheat, and sorghum based on the 10-year period 1985-1996 as well as the price pattern between June 1995 and June 1996. December ishistorically the low-price month for wheat; prices for maize are typically lowest betweenOctober and December; and sorghum prices are at their nadir typically in June to November. Data from nationally representative household surveys in 1996 indicate that by May, about90% of farmer grain sales have already occurred (GMRP 1996b). In fact, it is likely that mostrural households participating in the market during the May-September period are purchasinggrain. Since grain is typically most plentiful on local markets during the several months afterthe harvest, it would appear that grain could be purchased at lowest cost, and exert thegreatest benefit on farmer crop revenues, by setting delivery dates not long after the period ofgreatest farm grain sales.
In 1996, the tenders for local purchase were issued in February and March. Due tocancellations most of the tenders were launched in April. Contracts were generally awarded inMarch and April. Delivery dates were specified for May and June in most cases, but actualdelivery typically occurred later. From this, it appears likely that much of the grain purchasedby participating traders occurred in the April-June period after most farmers already sold theirgrain. According to the 10 bid winners interviewed, more than 50% of the grain theypurchased to meet the terms of the local purchase contracts were from other traders. Manytraders attributed their failure to delivery grain by the specified delivery date to difficulties insourcing grain at this time. It is likely that average bid prices could be reduced in the future bypurchasing earlier in the crop season. This in fact is being pursued by the EU during thesecond phase of local purchase activities in 1997. However, the potential for reducingprocurement costs at harvest time must be weighed against the higher cost of storage thatwould be incurred by purchasing earlier in the season.
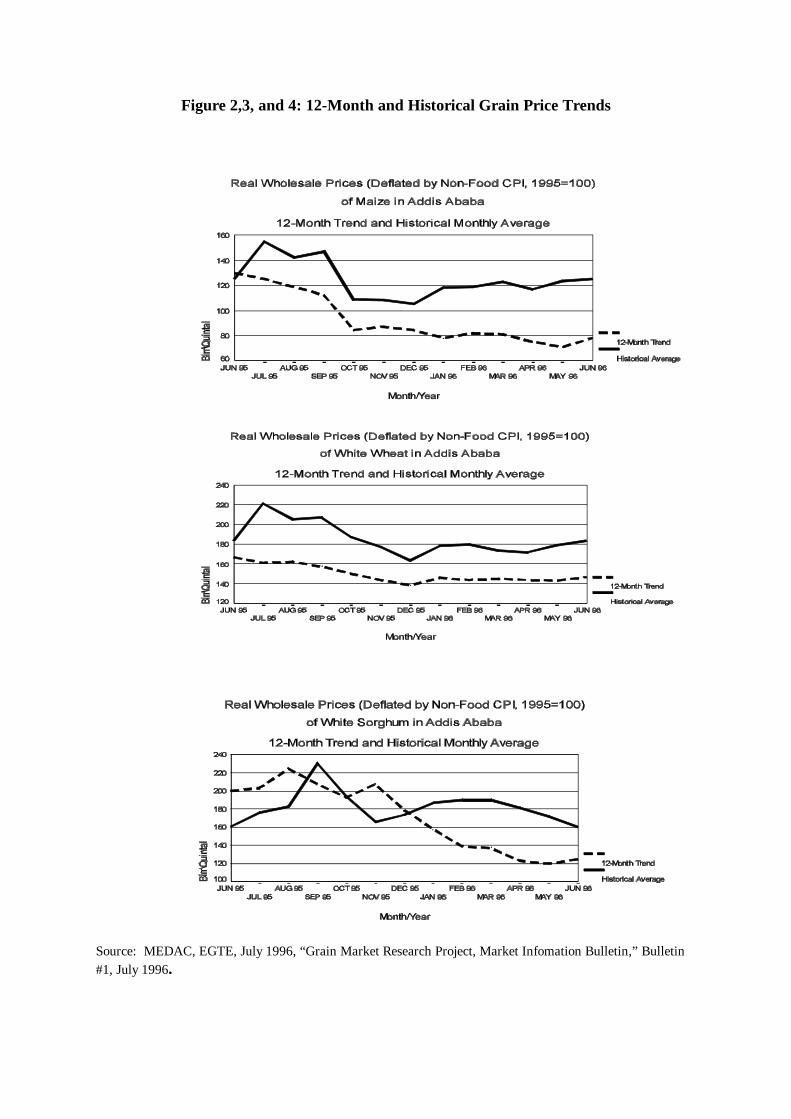
Figure 2,3, and 4: 12-Month and Historical Grain Price Trends
Source: MEDAC, EGTE, July 1996, “Grain Market Research Project, Market Infomation Bulletin,” Bulletin#1, July 1996.
10
The 1996 local purchase program specified that grain was to be delivered within 60 days ofthe contract date. There was a penalty for late delivery, set at 0.1% per day of the totalnominal value of the consignment. More than half of the winning traders delivered at leastsome of their contract tonnage after the delivery deadline. The primary reason stated for thedelay was that transport and/or quality grain was not available. During the first half of 1996,the government imported a large amount of fertilizer. This engaged the nation’s truckingcapacity for some time and often traders were not able to rent trucks which delayed delivery. A few traders felt that a longer delivery time is required in the rainy season due to the poorroad conditions.
3.3. Lot Size
The 1996 local purchase program offered tenders in lots of 3,000 tons. It is hypothesized that lot sizes of this volume constitute a barrier to participation and that smaller lot sizes wouldincrease the level of competition in the bid process. This may in turn lead to reduced averagegrain procurement costs for local purchase (other factors held constant) and thereby savescarce donor resources for other forms of assistance.
Experienced smaller traders may not be able to mobilize enough working capital to procure3,000 tons. A random survey of 219 wholesale grain traders interviewed in September 1996indicated that less than 10% of them purchased more than 3,000 tons of maize during theentire 1995/96 marketing year. The 10% of the traders purchasing the most maize during1996 averaged only 521 tons purchased per trader. The trader deciles purchasing the mostwheat and sorghum during 1996 averaged only 978 tons and 567 tons purchased per trader,respectively (Gebremeskel and Shaffer, forthcoming). These results suggest that in order toparticipate in the program, almost all Ethiopian grain traders would require access to muchmore credit and/or working capital than they currently utilize.
The distinctions between those who submitted bids and the 219 wholesalers surveyed in 1996becomes apparent by examining their views about the appropriateness of the 3,000 ton lotsize. Of the 219 traders selected randomly, 6.8% of them submitted bids to participate in thelocal purchase program. Of the 143 traders that did not submit bids and gave a response as towhy they did not participate, 34% identified the large lot size as the primary reason, while24% mentioned it as the second most important reason. When asked to identify a lot size thatwould enable them to submit bids for future local purchase programs, 45% of the tradersspecified 500 tons or less, while 86% of the traders specified 1,000 tons or less.
By contrast, among those purposively interviewed traders that submitted bids to supply grainunder the local purchase program (n=27), 52 percent said the lot size was appropriate. And ofthe traders who won bids, all stated that the lot size of 3,000 tons was appropriate. Largertraders didn’t respond favorably to the idea of a smaller lot size. They agreed thatparticipation by smaller traders would increase, but they indicated that they may notparticipate because if they only won one or two small lots then they would not be able tocover their administrative costs.
See FEWS-EU, 1996. “Monthly Food Security Bulletin/April 1996,“ Famine and Early3
Warning System/European Union Food Security Unit, 18 May 1996, Addis Ababa, p. 1.
10
Overall, it appears that a 3,000 ton lot size is a barrier to entry for most Ethiopian graintraders. In response to this, it has recently been announced that the second phase of the EUlocal purchase program will be specified in terms of 500 ton lots. According to our tradersurvey results, this will be expected to increase the total number of bids received, other factorsconstant, and possibly reduce the number of very large traders submitting bids. We alsoanticipate that by increasing the number of bids, the smaller lot size will increase competitionand reduce the average bid price received, again holding other factors constant. However, it isalso likely that administrative and supervisory costs of implementing the program will increase(per unit of grain to be purchased) if the number of traders participating greatly increases.
3.4 Pre-Announcement of Amount to be Purchased
An important design issue for local purchase programs is whether to announce in advance howmuch will be purchased in a given season. It is hypothesized that by ensuring that wholesaletraders are well aware of the volume to be purchased, this information will be incorporatedsmoothly into future price expectations and reduce the potential for volatile market reactionsthat might occur if large volumes were purchased without advance knowledge of most actorsin the grain marketing system.
Apparently, many grain traders were unaware of the local purchase program in 1996. Of the219 traders randomly surveyed in September 1996, 49.3% of them stated that they wereunaware of the program. Moreover, as information on market conditions during 1995/96continued to trickle in, the Government and EU agreed to modify somewhat the amount andtiming of grain procurement in 1996. The “Phase II” activities, originally designed topurchase an additional 78,000 tons in mid 1996, was delayed until 1997. On the one hand, the3
ability to adjust the timing and amount of grain purchases provides flexibility to respond tonew information on food relief needs and market conditions. On the other hand, announcing apriori the amount to be purchased would allow this information to be fully incorporated intomarket price expectations and eliminate a degree of price risk incurred by traders from havingto respond ex post to the market effects of changes in the timing and volume of local purchase.
3.5 Quality Standards
Quality standards as specified by the 1996 local purchase program were thought to be toostringent by most participating traders. However, the ramifications of the quality requirementson the average bid price received by the Program and the development of efficient marketshave not been fully examined.
Grain quality standards were based on EFSRA’s storage requirements. The quality inspectionwas carried out by SGS, an international surveying company designated by the EU, at thesource (loading) and at the delivery point (EFSRA’s warehouses). The quality inspection task
10
of taking samples from every lot at the loading stage clearly reduced the volume of grain thatotherwise might have been rejected by EFSRA’s stringent quality specifications. The qualitystandard of the EU tenders originally required 94% purity grain for maize and wheat, and 91%for sorghum with itemized tolerable impurity levels. Some easing of quality standards wasintroduced which allowed for the percentage of colored grain in the total supply of whitesorghum and maize to be increased from 1% to 10.5%. In spite of this easing of qualitystandards, many winners felt that the standards were still too high and added an unexpectedcost to their business.
Overall, about 63 percent of traders interviewed that submitted bids said they were capable ofmeeting the quality standards set for maize, wheat, and sorghum. However, the winningrespondents were split evenly in their opinion to whether the quality grain for maize and wheatare obtainable on the market. In fact, when traders were asked how they might improve thedesign of local purchase programs in the future, “lowering quality standards” was the mostpopular response. A few traders were unable to deliver their grain because it didn’t pass therequired quality inspection upon delivery. Traders also commented that achieving thestandards set by the EU increased their costs above their calculated figures. Some traders suchas EGTE and RADIA International installed new cleaning plants at Nekempt and Shashemenerespectively. Others commented that they had to clean the grain themselves or took it to acleaning station, especially for maize. Cleaning fees varied between birr 3.50 and 6.00 perquintal.
The results from the random survey of 219 grain wholesalers interviewed in September 1996indicate that the stringent quality standards actually reduced the number of traders submittingbids to the Program. For those traders that chose not to submit bids, 24.4% of them indicatedthat the high quality standards was either the most important or second most importantexplanation for their decision.
In general, however, the use of quality specification in contracting eliminates some of the risksand transaction costs in trading and encourages investment. The contract specifications asdesigned by the EU reflect its intent to strengthen contract discipline and market efficiency ofgrain trade in Ethiopia. However, quality standards that are too strict and not actuallyrequired, based on end-user needs or storage considerations, may serve to reduce competitionin the bid process and thereby introduce additional costs (in terms of average bid pricereceived) that may overwhelm the benefits of high quality standards.
3.6 Actual Bid Price and Market Price Comparisons
While not an explicitly stated objective of the 1996 local purchase program in Ethiopia,procuring grain from traders at least-cost market prices is important for maximizing thebenefits of local purchase for a given bundle of resources devoted to the program. Asexplained in Section 2, procurement costs above market prices are likely to (a) pass windfallprofits to grain traders without passing any benefits along to farmers; and (b) expend scarceresources that otherwise could have been used to create other benefits. This section nowconsiders the average bid price received by the Program in relation to prevailing market pricesduring the months of specified delivery. If it is discovered that the bid prices are significantly

Shadow prices here refers to the price of specific grain commodities that might be expected in4
a competitive and well-functioning auction situation.
The five birr per quintal cleaning cost is slightly above the mean cost incurred by the bid5
winners who paid for cleaning and fumigation charges to meet the EU quality specifications.
10
higher than market prices for grain of corresponding quality, then this may indicate, amongother things, a lack of competition in the bidding process. This might also indicate thepotential in the future to procure more grain for an allotted budget (or conversely the sameamount of grain at lower cost, thus saving donor resources for other purposes), other factorsconstant.
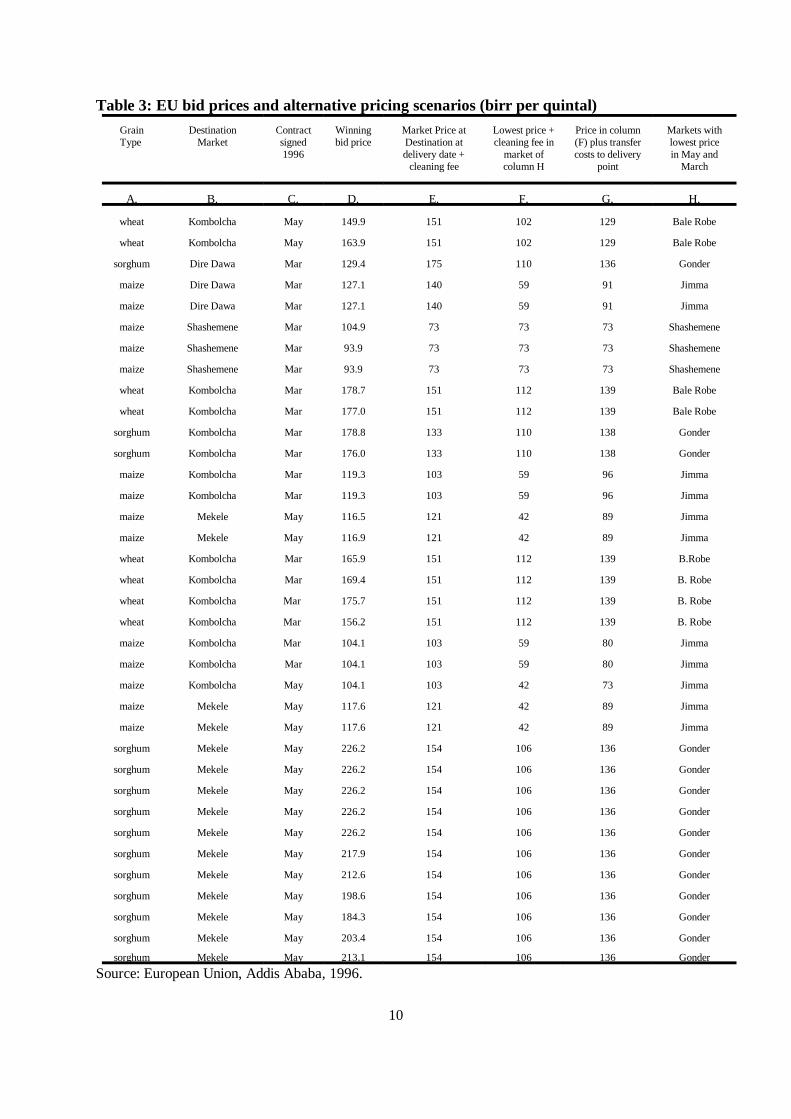
Two alternative methods are used to derive reasonable shadow prices against which tocompare the actual 1996 bid prices received under the program. In the first Scenario, we4
take the actual wholesale market price of the specific grain at the specified delivery point atthe specified month of delivery, and add to this a cleaning cost of 5 birr per quintal to upgradethe quality to Grade I as specified in the contract terms. These quality-adjusted prices5
(column E of Table 3) may be seen as representing the cost of moving grain to the specifiedlocation at the specified delivery date. These prices are compared to the actual winning bidprices in column D. In most cases, the bid price is higher than the corresponding market price. For example, the winning price for maize delivered at Kombolcha was 119 birr per quintal, butthe price in Kombolcha at that time was 103 birr per quntal. Adding up the cost differentialacross all the grain contracted under the Program in 1996 (column E - column D), the EUwould have saved about Birr 20.2 million (US$3.16 million) if it had received the prevailingmarket prices. This amounts to 11.6% of the 172 million birr spent by the EU on local grainpurchase in 1996.
In Scenario II, we calculated the least-cost source market at the time of specified delivery plustransfer costs to the delivery point based on price data for 26 wholesale markets monitored byEGTE. Cleaning costs (birr 5 /qt) are added to these costs to arrive at a landed destinationprice (Table 3, column G). This represents the least-cost method of procuring and deliveringa particular grain to a particular market. For example, in the first contract of wheat toKombolcha, the lowest observed market price of 102 birr per quintal (column F) plustransport and handling costs from that market (Bale Robe) to Kombolcha plus cleaning costswas equal to 129 birr per quintal as recorded in column G. This compares to the winning bidprice of 151 birr per quintal under the Program (column E).
In theory, in a perfectly competitive market with open markets and spatial price differencesequal to transfer costs and no risk premia, the least-cost means of delivering grain toKombolcha during the delivery month should have been close to 129 birr per quintal. Addingup the cost differential across all the grain contracted under the Program in 1996 (column D -
10
Table 3: EU bid prices and alternative pricing scenarios (birr per quintal)
Grain Destination Contract Winning Market Price at Lowest price + Price in column Markets withType Market signed bid price Destination at cleaning fee in (F) plus transfer lowest price
1996 delivery date + market of costs to delivery in May andcleaning fee column H point March
A. B. C. D. E. F. G. H.
wheat Kombolcha May 149.9 151 102 129 Bale Robe
wheat Kombolcha May 163.9 151 102 129 Bale Robe
sorghum Dire Dawa Mar 129.4 175 110 136 Gonder
maize Dire Dawa Mar 127.1 140 59 91 Jimma
maize Dire Dawa Mar 127.1 140 59 91 Jimma
maize Shashemene Mar 104.9 73 73 73 Shashemene
maize Shashemene Mar 93.9 73 73 73 Shashemene
maize Shashemene Mar 93.9 73 73 73 Shashemene
wheat Kombolcha Mar 178.7 151 112 139 Bale Robe
wheat Kombolcha Mar 177.0 151 112 139 Bale Robe
sorghum Kombolcha Mar 178.8 133 110 138 Gonder
sorghum Kombolcha Mar 176.0 133 110 138 Gonder
maize Kombolcha Mar 119.3 103 59 96 Jimma
maize Kombolcha Mar 119.3 103 59 96 Jimma
maize Mekele May 116.5 121 42 89 Jimma
maize Mekele May 116.9 121 42 89 Jimma
wheat Kombolcha Mar 165.9 151 112 139 B.Robe
wheat Kombolcha Mar 169.4 151 112 139 B. Robe
wheat Kombolcha Mar 175.7 151 112 139 B. Robe
wheat Kombolcha Mar 156.2 151 112 139 B. Robe
maize Kombolcha Mar 104.1 103 59 80 Jimma
maize Kombolcha Mar 104.1 103 59 80 Jimma
maize Kombolcha May 104.1 103 42 73 Jimma
maize Mekele May 117.6 121 42 89 Jimma
maize Mekele May 117.6 121 42 89 Jimma
sorghum Mekele May 226.2 154 106 136 Gonder
sorghum Mekele May 226.2 154 106 136 Gonder
sorghum Mekele May 226.2 154 106 136 Gonder
sorghum Mekele May 226.2 154 106 136 Gonder
sorghum Mekele May 226.2 154 106 136 Gonder
sorghum Mekele May 217.9 154 106 136 Gonder
sorghum Mekele May 212.6 154 106 136 Gonder
sorghum Mekele May 198.6 154 106 136 Gonder
sorghum Mekele May 184.3 154 106 136 Gonder
sorghum Mekele May 203.4 154 106 136 Gonder
sorghum Mekele May 213.1 154 106 136 Gonder
Source: European Union, Addis Ababa, 1996.
10
column G), the EU would have saved about Birr 47 million (US$7.4 million) if it had receivedthe prevailing market prices.
Of these two Scenarios, we feel that Scenario I represents a more reasonable estimate of theadditional procurement costs over and above prevailing market price levels. The figures inScenario II assume that Ethiopian grain traders are able to quickly source grain from all over the country to take advantage of least-cost procurement opportunities. This is not likely to befeasible for the majority of grain traders in the country. Scenario II does not account for thepotential problems of purchasing in the lowest cost areas and then securing adequate transportfor shipping the contracted grain to the delivery location. Scenario I, on the other hand,simply assumes that traders are capable of purchasing product in the market of the deliverylocation sometime during the specified month of delivery, and using this to satisfy thecontract. The information in Table 3 indicates that the EU could have saved US$3.16 millionby simply buying the specified grain in the local market of the delivery location at the specifiedtime of delivery. This would have reduced Program expenditures on local grain purchase by11.6% (or alternatively would have allowed roughly 11% more food to be procured for reliefefforts with the given amount of funds provided for the Program by EU).
To some extent, this result may also be the consequence of an unpredictable marketenvironment. Due to the large harvest in 1995/96, grain prices did not rise later in the yearaccording to their typical seasonal pattern. It is likely that traders incorporated theexpectation of a seasonal price rise into their bid prices, since delivery dates were specified asat least 5-6 months after the main harvest. However, market risks and uncertainty can bemitigated through timely and accurate market information. The costs of local purchaseprogram can be potentially reduced in the future through improved market information andforecasting systems that are widely disseminated through radio and newspapers. Such systemsare now being implemented in Ethiopia by EGTE; information from this grain marketinformation system is being broadcasted on FANA radio twice a week and is being releasedthrough flyers faxed to regional administrations each week.
The cost-effectiveness of local purchase can also be reduced in the future by designing theprogram so that a greater number of traders are able to bid on local purchase contracts. Examples of this include offering contract lots of lower volume to enable smaller traders toenter bids (discussed in Section 3.3) and holding one auction nationally rather than limiting thegeographical domain from which bids and grain procurement can be accepted (discussed inSection 3.8).
3.7 Importance of Traders’ Asset Level in Determining Participation
This section examines whether there are particular attributes that influence the likelihood thatthat a trader is able to submit a bid to the Program. As mentioned earlier, the lot size of 3,000tons was far larger than the purchases of most Ethiopian grain wholesalers over the entire1995/96 marketing year. It may therefore be expected that particular asset levels and accessto credit may distinguish those that submitted bids under the 1996 local purchase programfrom the broader profile of Ethiopian grain traders. To address this question, we report keyasset levels identified by the 27 trading firms interviewed that submitted bids under theprogram and compare these with asset levels identified by the 219 randomly-chosen graintraders (all of whom did not participate in the program). The specific assets examined hereinclude truck ownership, ownership of storage, access to credit, and businesses other thangrain trade.
10
As shown in Table 4, there are some important differences in the attributes of those submittingbids and the broader cross-section of Ethiopian grain wholesalers. On the other hand, thereare very few differences in the attributes examined between the bid winners and bid losers. First, it appears that those submitting bids under the local purchase program were morediversified in their activities than the average grain trader. Almost 85% of the bid winners and90% of the bid losers were involved in other business activities. By contrast, only 46% of the219 randomly sampled grain traders were engaged in other businesses (Gebremeskel andShaffer, forthcoming). Also, 71% of the bid winners and 50% of the bid losers owned trucks,compared with only 15% of the wider sample of grain traders. Of those traders submittingbids for sale under the local purchase program, 67% financed their grain purchase using bankcredit, compared with 61% for the wider sample of non-participating traders. Finally littledifference in ownership of storage facilities was noted between participating and non-participating traders.
The results indicate that, in general, once a trader submits a bid, there are no distinguishingcharacteristics that increase or lower his or her probability of winning a contract. Bid winnerswere chosen based on whether they submitted the lowest-priced bid for a particular contract ina particular region. However, there do appear to be important differences in the asset levels,particularly truck ownership, between those firms that submitted bids and those that did not. Also, those firms submitting bids tended to be larger and more diversified in their activitiesthan those not participating in the local purchase bid process. This may have been primarilydue to the 3,000-ton lot size in the 1996 program, which probably constituted a barrier toparticipation for most grain traders.
Table 4: Distribution of assets between EU participants and traders that did not participate in the local purchase program (percent)
Assets wholesalers (n=219)
Traders that submitted bids (n=27)1
winners (n=10) losers (n=17)
Randomly sampled grain2
Own other businesses (% yes) 85 90 46Own trucks (% yes) 71 50 15Own storage warehouse (% yes) 58Access to back credit (% yes)
50 5567 59 61
Source: GMRP survey data, 1996. Surveyed in August 19961
Surveyed in September 19962
3.8 Regionalization of Tenders
Another issue of inquiry is whether the regionalization of the program is an effective methodof promoting a competitive market environment. Segmenting the auction process into regionsserves to reduce the number of competing bids in an auction. This may have the undesirableeffect of raising the regional average bid price above that which would have prevailed if theauction system was nationalized.
The EU initiated the tender process by advertising for bids for a particular grain anddestination in four regions: Oromia, Amhara, Southern (SNNPR), and Tigray. Traders were
10
able to source grain wherever desired and were not constrained to source grain from theregion carrying out the auction. Interestingly, the destination points and types of grain to beprocured were by and large the same across all regional tenders. For example, the bids issuedin SNNPRS, Amhara, and Oromiya regions all featured the purchase of wheat for delivery toKombolcha (Table 5). The bid process has been designed such that there would be separateauctions by the type of grain and destination in the different regions undertakensimultaneously. The stated rationale for regionalizing the auction process was that sometraders operating specifically in one or two regions might have difficulties in submitting bids ina wider national-level auction. It was also perceived that a national-level auction in AddisAbaba might give unfair advantages to traders based in Addis. In fact, many traders based inAddis traveled to other regions to submit bids. Also, some traders submitted bids in all of theparticipating regions, while others preferred to bid only in their respective regions.
The evidence indicates that the regional segmentation of the auction created additionaltransaction costs for the traders of registering in numerous auctions and limited the number oftraders submitting bids. As a result, the segmentation of the bid process led to a situation inwhich bids were accepted that were the lowest prices received within a particular regionalauction, but not necessarily the lowest bid price received overall. For example, the averagebid price submitted for wheat delivered to Kombolcha was 6 percent less in the Oromiyaauction than in the Amhara auction. If traders in both regions were forced to compete againstone another, some traders in Oromiya who submitted lower-priced bids for the delivery ofwheat to Kombolcha would have been accepted in lieu of traders submitting higher-priced bidsin the Amhara auction.
In sum, it is concluded that regionalization of the bid process caused bid prices to be higherthan if all bids were pooled nationally. This process hinders the development of an efficientmarket and reduces the Program’s ability to minimize costs. Concerns about allowing regionaltraders to be able to participate could be accommodated by allowing traders to submit theirbids to regional administrative units, which in turn would forward all bids to the appropriatenational level organization implementing the auction process. This should alleviate thetransaction costs associated with traveling to Addis to participate in the program and removeany potential advantages to Addis-based traders.

10
Table 5: Tenders issued by region (figures in metric tons)
Region Wheat Maize Sorghum Total
SNNPRS 6,000 15,000 3,000 (all delivered (6,000 to Dire (all delivered toto Kombolcha) Dawa, 9,000 to Dire Dawa)
Shashemene) 24,000
Amhara 6,000 12,000 6,000(all delivered to (6,000 to (all delivered to
Kombolcha) Kombolcha, Kombolcha)6,000 toMekele) 24,000
Oromiya 12,000 15,000 --(all delivered to (9,000
Kombolcha) delivered toKombolcha,
6,000 toMekele) 27,000
Tigray -- -- 33,000(all delivered to
Mekele) 33,000
Source: European Union, Addis Ababa, Ethiopia, 1996.
3.9 Separating Tenders by Lots
As shown in the previous section, the number of bids may differ across regions for the samegrain to the same destination. However, it was also possible that within the same region, thenumber of bids would differ across the various 3,000-ton contracts that were issuedsimultaneously in the region. This program design could again hinder the competitiveness ofthe bid process and thus raise the average bid price.
Traders can bid for multiple lots within one region and for the same destination. For somecontracts (lots), as many as 17 traders submitted bids (Table 6). For other lots, as few as twobids were received from the same region and for the same grain and delivery point. As aresult, some traders were awarded contracts whose bid price was higher than other traderswho lost bids for the same grain and delivery point in the same regional auction. This methodof segmenting each 3,000-ton contract into separate auctions resulted in a higher averageprice to the EU.
10
Table 6: Number of bids submitted per 3,000-ton contract
Grain type and destination Number of bids submitted
wheat/Kombolcha 8wheat/Kombolcha 17wheat/Kombolcha 7wheat/Kombolcha 4wheat/Kombolcha 13wheat/Kombolcha 10wheat/Kombolcha 8wheat/Kombolcha 9maize/Dire Dawa 7maize/Dire Dawa 6maize/Shashemene 10maize/Shashemene 12maize/Shashemene 8maize/Kombolcha 10maize/Kombolcha 7maize/Kombolcha 6maize/Kombolcha 5maize/Kombolcha 4maize/Mekele 14maize/Mekele 13sorghum/Kombolcha 2sorghum/Kombolcha 2sorghum/Dire Dawa 6sorghum/Mekele 4sorghum/Mekele 4sorghum/Mekele 4sorghum/Mekele 4sorghum/Mekele 4sorghum/Mekele 4sorghum/Mekele 4sorghum/Mekele 4sorghum/Mekele 4sorghum/Mekele 4sorghum/Mekele 4
Source: European Union, Addis Ababa, 1996.
The EU purchased Birr 172 million worth of grains in Ethiopia in 1996. Column D in Table 7shows the value of grain purchased by type and by destination. Column E indicates the valueof grain acquisition of the total amount of one type of grain destined for a certain destination ifa single auction would have been held across all lots rather than in multiple lots. In this case,the EU would have saved 16.8 million birr (Column F), or approximately 9.8% of theProgram’s total grain procurement cost in 1996. It is noted that about 89 percent of thissavings would have resulted from combining lots for sorghum delivered to Mekele.
Overall, combining lots of the same grain and destination would increase competition andreduce the average bid price. It appears that the cost-effectiveness of local purchase activitiescould be improved in the future through combining bids across all lots specifying the samegrain and delivery point rather than segmenting the auctions by lot.
It was also found that some traders were unaware that they could submit multiple bids for onegrain type at one delivery point. This confusion might have occurred because some traderswere unaware that they could refuse a contract offer. If a trader won a bid which he/she couldnot deliver, he/she would not have been obligated to sign the contract.

10
Traders had an advantage if they knew to submit as many bids as possible. Traders whosubmit multiple bids and win a contract in which they were competing with only a few othertraders had an advantage over traders that competed against many other traders. In addition,the likelihood that they win a bid improves if they bid in one lot that has few competitors. Many traders who did offer multiple bids, offered different prices for the same contract inhopes that a higher bid price would win. The average number of bids submitted was 10 forwinners and 2 for losers. However, for individual winners the number of lots won was not inproportion to the number of bids submitted. Some traders entered 2 bids and had a 100percent success rate. Other traders entered up to 19 bids, but won only 6.
Table 7: Relative value of purchases by separate and combined lots (000' birr)
Grain Type point Bid value (actually won) auction was heldDestination Bid value if one
Savings
A. B. D. E. F.
wheat Kombolcha 40,109.4 38,787.3 1,322.1
maize Kombolcha 16,522.5 16,360.5 162.0
maize Shashemene 8,786.9 8,484.3 302.6
maize Dire Dawa 7,302 same 0
maize Mekele 14,062 14,058.3 3.7
sorghum Kombolcha 10,645.2 same 0
sorghum Dire Dawa 3,882 same 0
sorghum Mekele 70,827.6 55,733 15,094.6
Total 172,137.6 155,252.3 16,885
Source: European Union, Addis Ababa, Ethiopia, 1996.
10
4. CONCLUSIONS AND POLICY IMPLICATIONS
This report identifies factors affecting the performance of the 1996 local purchase program inEthiopia and options for making future local purchase activities more compatible with a rangeof national food policy objectives. The analysis considers the design and implementation oflocal purchase programs in relation to three key national policy objectives:
(1) price stabilization for farmers during periods of unusually low cereal prices;(2) promoting the development of a competitive and low-cost food marketing system; and(3) procuring food aid resources in a cost-effective manner.
Only the third objective — procuring adequate food aid resources in a cost-effective manner— was an explicitly stated objective of the 1996 EU program. However, it appears that otherpolicy objectives may also be supported without additional cost through appropriately-designed local purchase activities. The analysis indicates that there are feasible design changesthat could improve the competitiveness of the program and reduce the average bid priceoffered to the Program. Lower bid prices would enable the Program to purchase more grainwith the same resources, and thereby increase the potential for local purchase programs tomeet the Government of Ethiopia’s policy objective of supporting farm-gate cereal pricesduring years of supply gluts and expanding the availability of cereal for food-insecurehouseholds.
4.1. Summary of Main Findings
The following conclusions can be drawn about the 1996 local purchase activities in Ethiopia:
1. The EU local purchase program has been clearly successful in meeting its primaryobjective: building up EFSRA’s emergency food reserve. Almost 100,000 tons ofgrain were procured under the program in 1996, at an average cost of $251 per ton. Given relatively high world market prices for wheat, maize, and sorghum during 1996,the local purchase of food aid at $251 per ton was somewhat cheaper than the landedimport cost of comparable quality grain at most of the specified delivery sites.
2. However, there appear to be opportunities to significantly reduce the procurement costof local grain purchase in the future. Several aspects of the program inflated the costsof grain procurement and hence reduced the amount of grain that could have beenprocured for relief and stabilization purposes with the amount of funds devoted to theProgram. The most important aspects of the 1996 program that inflated procurementcosts were (a) the issuing of tenders of fixed lot sizes that were too large to enablemost Ethiopian grain traders to participate in the program (Section 3.3); (b) stringentgrain quality specifications (this was especially noted by the participating grain tradersthemselves, see Section 3.5); (c) regionalization of the tender/auction process (Section3.8); and (d) segmenting the auction process for individual lots (Section 3.9). Segmenting the auction process for individual lots is estimated to have caused the EUto pay 9.8% more than it would have had the tenders not been segmented by region.
3. The average contracted prices of wheat and sorghum under the 1996 Program were farabove the prevailing market prices at the specified local delivery markets. Thissuggests, but does not prove, a lack of competition in the bidding process in 1996. However, it is clear that the 1996 Program could have reduced its costs of grain
10
procurement by 20 million birr (US$3.16 million) by simply buying the contracted108,000 tons of grain in the local market of the delivery location at the specified timeof delivery. This would have reduced Program expenditures on local grain purchaseby 11.6% (or alternatively would have allowed roughly 11% more food to be procuredfor relief efforts with the given amount of funds provided for the Program by EU).
To some extent, this result may also be the consequence of an unpredictable marketenvironment. Due to the large harvest in 1995/96, grain prices did not rise later in theyear according to their typical seasonal pattern. However, market risks anduncertainty can be mitigated through timely and accurate market information. Thecosts of local purchase programs can be potentially reduced in the future throughimproved market information and forecasting systems that are widely disseminatedthrough radio and newspapers.
4. The local purchase of 108,000 tons of grain in 1996 amounted to about 5.4% of themarketed grain output from the 1995/96 meher season. Program purchases of maize,wheat, and sorghum are estimated at about 8.3%, 10.3%, and 18.4% of the totalvolumes marketed of these three commodities. It is difficult to estimate the effect ofthe program on producer prices. Grain prices generally remained atypically flatthrough most of the 1995/1996 marketing year. However, it is likely that producerprices would have been even lower than they were without EU’s intervention.
5. The greatest evidence that the EU local purchase operation has actually raised marketprices is in Tigray, where bids for 33,000 tons of sorghum were launched in February. Tigray is generally regarded as a grain-deficit region, and wholesale sorghum prices inMekele were already higher than in most other regional markets for which data isavailable. In February, the wholesale price of sorghum rose from 131 birr/quintal to160 birr/quintal, and rose again in March to 168 birr/quintal, despite the fact thatsorghum prices declined or stayed flat over this period in almost all other regionalmarkets covered by EGTE. Although this tender was canceled in March because bidprices exceeded the cost of importing sorghum to Tigray from the world market, it islikely that grain had already been purchased before this in anticipation of participation.
6. State farms produced about 12.5% of the grain supplied to the Program by the winningtraders. Smallholder and commercial farmers accounted for 12.5%, 50% came fromother traders, and the remaining amount delivered to the Program by winning traderswas delievered from a combination of these sources. The fact that the bid winnerspurchased such a large proportion of the grain from other traders indicates that thebenefits of the program probably extended to a wider group of grain marketingparticipants beyond the 10 bid winners only.
7. Traders submitting bids under the local purchase program in 1996 appeared to differ insome important respects from the broader cross-section of Ethiopian grain traders. First, the traders submitting bids were more diversified in their business activities, hadgreater access to bank credit, and were more likely to own their own trucks than thetypical grain wholesaler. This may provide an indication of the types of entry barriersto participation in the 1996 program.
10
4.2 Options for Further Consideration to Improve the Functioning of LocalPurchase Activities
1. Increase competition in bid process through reduced contract lot size: The cost-effectiveness of local purchase can be improved in the future by designing the programso that a greater number of traders are able to bid on local purchase contracts. Perhaps the most important change to increase the number of bidders is to offercontract lots of lower volume to enable smaller traders to enter bids. As this reportgoes to press, it is noted that the Second Phase of the EU’s local purchase activitiesfeatures contract lots of 500 tons, down from the 3,000 ton lot size in 1996.
2. Hold one national-level auction rather than a set of localized auctions: In section 3.8,it is shown that the regionalization of the auction process constrained competition inthe bid process and increased the average bid price received under the Program. As aresult, some traders did not win bids despite submitting lower-priced bids than othertraders that did win bids (for comparable grain types, delivery points, and deliverymonths). This issue is discussed in more detail in Section 3.8.
3. Do not segment bids by contract: Combining bids across all lots specifying the samegrain and delivery point (rather than segmenting the tenders by lot) is expected to increase competition in the bid process and thus reduce the average bid price. In 1996,this would have saved the program 16.8 million birr for other developmental purposes,amounting to 9.8% of the total grain procurement costs under the program.
4. Review the need for stringent Grade I grain quality standards: For storage purposes,it is possible that Grade I quality is absolutely required for the Emergency FoodSecurity Reserve Authority. However, most traders that participated in the programcomplained strongly about the extra costs and time involved in meeting these qualitystandards. They reported that Grade I quality is not readily available from smallholdergrain production. A broader random survey of 219 local grain traders also indicatedthat of those that heard of the local purchase program in 1996, 24.4% of themindicated that the high quality standards was either the most important or second mostimportant explanation for their decision not to submit a bid.
5. Change the timing of local purchase activities to earlier in the marketing season:Farmers may benefit by changing the timing of tender issuing, awarding contracts, anddelivery dates to occur earlier in the marketing season when a greater proportion offarmers are selling their crops and can potentially benefit from the increased demand oflocal purchase activities. It is likely that moving the auction process forward in themarketing season will also result in reduced bid prices, other factors held constant (seeSection 3.2). It is noted that tenders for the second phase of the EU local purchaseactivities were already launched in December 1996, several months ahead of the timingin 1996.
4.3 Future Research and Monitoring
These conclusions are based on information currently available after one year’s experience. Monitoring can be important in learning from each year’s experience and for adjusting theProgram to the conditions faced in each new crop year. Information predicting crop size,stock holdings and expected marketed quantities as well as information on current and pastprices are important in determining the appropriate future design of local purchase programs.

10
Important areas of research beyond that considered in this report include inquiries into thelong run implications of the Program on the food security situation of different groups, thecosts of storage by different types of market participants, the stockholding and marketingstrategies of farm households and their implications for the design of local purchase programs,and evaluations of local purchase programs in the broader context of a food and agriculturaldevelopment strategy for Ethiopia.

10
References
Asfaw Negassa and T.S Jayne, 1997. “The response of Ethiopian Grain Markets toLiberalization,” Working Paper #6, Grain Market Research Project, Ministry ofEconomic Development and Cooperation, Addis Ababa, Ethiopia.
Daniel Molla and T.S. Jayne, 1996. “The Role of Food Aid in Ethiopia: StabilizationObjectives and Access to Food by Vulnerable Households,” note presented at the FirstDiscussion Forum of the Grain Market Research Project, Ministry of EconomicDevelopment and Cooperation, 8 -9 November 1996, Sodere, Ethiopia.
EGTE (Ethiopian Grain Trading Enterprise), 1995. “Statistical Bulletin No. 3,” EthiopianGrain Trade Enterprise, Addis Ababa.
FEWS-EU, 1996. “Monthly Food Security Bulletin/April 1996,” Famine and Early Warning System/European Union Food Security Unit, 18 May 1996, Addis Ababa, p. 1.
Gebremeskel Dessalegn and James D. Shaffer, forthcoming. “Constraints on Grain MarketPerformance in Ethiopia,” Working Paper #8, Grain Market Research Project,Ministry of Economic Development and Cooperation, Addis Ababa
Government of Ethiopia, 1996. “National Food Security Strategy,” Federal DemocraticRepublic of Ethiopia, Addis Ababa, November.
GMRP (Grain Marketing Research Project), 1996a. “Emerging Market and Policy Responsesto Ethiopian's Grain Harvest of 1995-96,” Market Analysis Note # 1, Ministry ofEconomic Development and Cooperation, Addis Ababa.
GMRP (Grain Marketing Research Project), 1996b. Food Security Household Data Set,Ministry of Economic Development and Cooperation, Addis Ababa, Ethiopia.
Ministry of Economic Development and Cooperation, Ethiopian Grain Trade Enterprise, July 1996, “Grain Market Research Project, Market Infomation Bulletin,” Bulletin #1.
Mulat Demeke, Ali Said, and T.S. Jayne, 1997. “Interactions between Input Market andGrain Market Performance,” Food Security Research Project Working Paper #5,Ministry of Economic Development and Cooperation, Government of Ethiopia, AddisAbaba.