the history of the eu grain market regulation - … history of the european grain... · the history...
TRANSCRIPT
Rue du Trône 98 • B-1050 Bruxelles • Tel. +32 2/502 08 08 • Fax. +32 2/502 60 30 • E-mail: [email protected]
THE HISTORY OF THE EUROPEAN GRAIN MARKET
Rudolf Stöhr – Klaus Schumacher
Rue du Trône 98 • B-1050 Bruxelles • Tel. +32 2/502 08 08 • Fax. +32 2/502 60 30 • E-mail: [email protected]
Contents
1. The beginnings of the E.E.C. agricultural market......................................................... 5
2. The painstaking path to a Common Cereal Market .................................................... 9
3. The harmonisation of grain prices – a breakthrough for Europe ........................ 1515
4. The first enlargement of the Community ................................................................... 21
5. Monetary compensatory amounts and the Common Agricultural Market ............. 23
6. Grain market policy reform .......................................................................................... 27
I - The increasing surpluses ................................................................................................ 29
II - The inclusion of feedstuffs in the Cereals Common Market Organisation ............ 31
III - The accession of Greece ............................................................................................... 32
IV - The accession of Spain and Portugal ......................................................................... 32
7. Fundamental reform of the Cereals Market Organisation ....................................... 33
8. The Uruguay Round and the Common Grain Market ............................................. 357
8.1. Reduction of exports ................................................................................................ 38
8.2. Improved market access ........................................................................................ 38
9. Reforms within the Framework of the AGENDA 2000.............................................. 39
10. Fundamental Reform of the Common Agricultural Policy in 2003 ..................... 41
11. Outlook - A Single Common Market Regulation, WTO Round and Health Check
43
APPENDIX 1A: EU Grain Production 1961 to 2007 :Wheat, Durum & Barley ............... 44
APPENDIX 1B: EU Grain Production 1961 to 2007. Corn, Others & Total ..................... 45
APPENDIX 2A: EU Oilseeds Production 1961 to 2007 (Rapeseed & Sunflowerseed) . 46
APPENDIX 2B: EU Oilseeds Production 1961 to 2007 (Soybean & Total RS+SFS+SB 47
APPENDIX 3: EU Grain Trade from 1980 to 2007 ............................................................ 48
APPENDIX 4 : EU Oilseed Trade from 1988 to 2006 .................................................... 489

Rue du Trône 98 • B-1050 Bruxelles • Tel. +32 2/502 08 08 • Fax. +32 2/502 60 30 • E-mail: [email protected]
1. The beginnings of the E.E.C. agricultural market
One of the dates most fitting as the birthday of the E.E.C. Common Cereals Common Market
Organisation is 15th December 1964. This was the day when, following a turbulent marathon
session, the agriculture ministers of the six E.E.C. countries, together with the ministers of
economics, reached agreement on a harmonised price scale for grain. Two and a half years
later, on 1st July 1967, it came into force.
The bargaining result of that 15th December 1964 was celebrated by the German Minister of
Economics M. Schmücker as a “breakthrough for Europe”. This perception underlines the
importance that grain prices have, not only as the base-plate for the whole agricultural price
scale, but also politically – an attribute that even today still lingers on. The turbulent political
events that went hand in hand with price adjustments will be dealt with later.
In May 1958, a long time before that memorable „breakthrough for Europe“, COCERAL had
been established – the „Comité Européen du Commerce des Céréales et des Aliments du Bétail“
(The European trade association for grain and animal feed). Its founding fathers were such
perspicacious and brave grain traders as Belgium’s Fernand Belpaire, Italy’s Riccardo Rusconi,
France’s Roger Joffet or Germany’s Alfred Toepfer. They were all enthusiastic and committed
Europeans, who took the 25th March 1957 E.E.C. Treaty with its ambitious goals seriously and
gave their 100% backing to making it a success.
Obviously, their efforts were directed first and foremost towards the agricultural market. In the
first 20 – 30 years this market was without doubt the motor behind European integration. The
practical measures adopted here were instrumental in promoting cooperation in other industrial
areas.
How the Common Agricultural Market became the driving force behind European integration is
still, even in retrospect, an astonishing and fascinating process. This is all the more so, given
that only 10 articles (Articles 38 – 47) of the 248 articles and numerous appendices of the
March 1957 E.E.C. Treaty actually referred to agriculture. It had certainly not been the intention
of the Treaty’s fathers that 70 – 80% of all E.E.C. regulations and more than 50% of the
Community’s budget in the 70’s and 80’s would concern the agricultural sector. This was to be
attributed to the growing influence of the initial six and present 27 Member States on
agricultural policy decisions.
The basic concept for the agricultural sector, as enshrined in the E.E.C. Treaty, was liberal and
transparent. The credit for this is owed especially to the then Dutch agriculture minister Sicco L.
Mansholt, who became vice-president of the first E.E.C. Commission (as from 1st January 1958)
under Walter Hallstein and its first agriculture commissioner.
The main objectives of the Common Agricultural Policy, whose beginnings can be traced back to
1st January 1958, can be summarised as follows (E.E.C. Treaty, Article 39):
raising agricultural productivity;
increasing earnings;
stabilising markets;

Rue du Trône 98 • B-1050 Bruxelles • Tel. +32 2/502 08 08 • Fax. +32 2/502 60 30 • E-mail: [email protected]
guaranteeing regular supplies;
ensuring reasonable prices for consumers.
Back in those days, productivity in plant and livestock production was relatively low. France, with
an average production of approx. 19 million tonnes (1955 – 1957) was the E.E.C.’s main grain
producer with an average wheat yield of 22 quintals per hectare. Germany’s grain production
reached 13 million tonnes with a wheat yield of 30 quintals per hectare.
Self-sufficiency was already being attained in certain products (meat, sugar, dairy products and
potatoes). The situation in grain was somewhat different: domestic production of bread grain
(i.e. grain of bread-making quality) was covering 90% of demand, whereas that of feed grain
(including rye) only reached 75%. 9 million tonnes of grain were being imported, mainly by the
Benelux countries and Germany. France was already producing over its needs, exporting
between 0,5 and 2 million tonnes, depending on harvest results.
It should not be concealed that, even at the start of the 60’s, there were voices warning of
increasing surpluses on the E.E.C.’s agriculture markets. These included agrarian economists (a
report by a group of German professors in 1962) and Agriculture Commissioner Mansholt
himself (the 1966 Mansholt Plan). But such criticism was hardly heeded in the (agro-) political
circles of the Member States.
There is another prominent date that must be mentioned in the run-up to the Cereals Common
Market Organisation. In the early hours of 14th January 1962, following a 200-hour marathon
debate, the Agriculture Council (consisting of the agriculture ministers of the six Member States)
passed a packet of 12 agricultural regulations, one of which was the renowned Regulation No.
19/62, initiating the “step-by-step introduction of a Common Market Organisation for Cereals”.
This served as a model for other market organizations for such products as pork, eggs and
poultry, fruit and vegetables, wine, milk, beef and sugar, and led to almost 90% of agricultural
production being more or less withdrawn from the free play of the markets.
These 14th January resolutions transformed the results of the Stresa Conference on Agriculture
(3rd – 12th July 1959) into policy, creating market organizations for plant and animal products
aimed at achieving the objectives set out in Article 39 of the E.E.C. Treaty. It was also the start
of a process integrating six very disparate national markets, which would prove to be irreversible
in spite of the many crises.
Besides the already mentioned Agriculture Commissioner Mansholt, two further players must be
named in this connection: Hans-Broder Krohn, his general director, and Berend Heringa, the
Director responsible for agricultural markets. These three men played a decisive role in paving
the way for the Commission’s Common Agricultural Policy. Their original basic concept was for a
liberal market with such elements as a cautious policy on prices, interventions just for animal
feed grain and only at the end of a marketing year. This concept was wrecked by the massive
resistance of certain Member States and could only later be salvaged by an enormous
administrative effort for such measures as denaturing and set-aside areas and vast amounts of
money for support measures and export subsidies.
To be in a position to judge the historic importance of the first Cereals Common Market
Organisation as set out in the April 1962 Regulation No. 19/62, it is a good idea to take a look
at the totally disparate market regulation systems in effect in the individual E.E.C. Member
States beforehand. Germany and France are used as examples:

Rue du Trône 98 • B-1050 Bruxelles • Tel. +32 2/502 08 08 • Fax. +32 2/502 60 30 • E-mail: [email protected]
French Grain Policy:
French grain policy was governed by 3-year economic plans. So-called “campaign
prices” – fixed prices for producers - had to be set by 31st July of each year (the
marketing year began on 1st August). These prices were of course only for good-quality
products. The actual prices paid to the producers were often much lower than the
“campaign prices”, due to a number of state taxes and other levies. The only non-
regulated product was oats, but even here an intervention price was in force, albeit at a
very low level.
To encourage maize production, an additional premium was paid on each ton delivered.
To help producers store their products, bi-monthly increments on top of the campaign
price were paid between August and May.
As wheat was already being produced in surplus, it was subjected to stricter regulation.
The campaign price was only paid for a certain amount, which did not even correspond
to the „collecte“– the total amount sold by all farmers. In the 3-year period 1958-1961,
this maximum amount was set at 7.2 million tonnes.
The annual wheat exports of 1 – 2 million tonnes were sold at a deficit on the world
market with its lower price levels. Two-thirds of the deficit was covered by the French
state, the rest by the farmers. In an attempt to reduce soft wheat production and
promote feed grain production, higher deliveries by farmers were subject to rising levies,
such as the cotisation de résorption. Farmers who agreed to reduce their soft wheat
acreage by 20% were freed from the cotisation de résorption.
Administration and monitoring of the French grain market was in the hands of the ONIC
(Office National Interprofessionel des Céréales).
German Grain Policy:
Until Regulation No. 19/62 came into effect, the grain market in the Federal Republic of
Germany was even more state-regulated than in France. Ever since 1952/53 grain prices
– and with them the whole price level for agricultural products – had been way above
world market prices. An elaborate system of minimum and maximum prices, import
quotas and levies, obligatory blending of cereals and state interventions in the market
was constructed in an attempt to guarantee supplies to a market ridden by shortages
and stable prices for producers.
The responsibility for administering this market was in the hands of the state-run Einfuhr-
und Vorratsstelle (EVSt) – the import and supply agency. One major instrument for
regulating the market was the allocation of import quotas, which were worked out on the
basis of the annual “import and supply plan”. The difference between the lower world
market prices and the much higher national level was compensated by levies – a
procedure resembling the later common procedure for imports.
Import quotas and levies were supplemented by obligatory blending for domestic wheat.
Mills were obliged to at least 75% domestic wheat for grinding.
To guarantee producer prices, grains other than oats and maize were bought up by the
EVSt at preset minimum prices and stored. This “intervention system” was also to figure
in the later Cereals Common Market Organisation.
Before Regulation No. 19/62 came into effect, minimum and maximum prices were
reset each year, though in the timeframe from 1952/53 – 1966/67 they remained
virtually unchanged. For wheat and rye there was a regional differentiation. The Federal
Republic was divided up into 4 regions: Price Zone IV (around Duisburg) was the main

Rue du Trône 98 • B-1050 Bruxelles • Tel. +32 2/502 08 08 • Fax. +32 2/502 60 30 • E-mail: [email protected]
deficit area and consequently had the highest prices. Bavaria with its high surpluses was
the region with the lowest prices (Price Zone I). It will come as no surprise to find out that
this model of regionally differentiated prices – also used in Italy – should crop up again
in a more refined manner in the later grain price regionalisation.
The price differential of some 8 DM per tonne between the regions was however not high
enough to get surpluses moving from Bavaria to the Lower Rhineland. This led to the
EVSt paying freight subsidies, thereby underpinning producer prices in surplus regions far
away from the markets.
This short presentation of the regulated markets in France and Germany should serve to point
out the difficulties with which the founding fathers of the first Cereals Common Market
Organisation were confronted. The German philosophy of high producer prices for farmers just
had to collide with the intentions of countries like the Netherlands, which were interested in low
raw material prices for their swiftly expanding livestock sector. In such discussions, France
tended to keep to the middle of the road.
In summary it must be stated that the Federal Republic of Germany was the country trying
hardest to protect its market from world market pressures. The lowest level of price protection
was to be found in Belgium and the Netherlands, where prices for animal feed grain were on a
world market level and where there were no import restrictions.
Italy also had a relatively liberal market regulation for feed grain and actively encouraged maize
imports. The wheat market enjoyed special state attention with its high, regionally differentiated
prices. Even so, price support only applied to a certain quantity, corresponding to some 20 –
30% of the total harvest. Imports were restricted to minor quantities of durum wheat.
Rue du Trône 98 • B-1050 Bruxelles • Tel. +32 2/502 08 08 • Fax. +32 2/502 60 30 • E-mail: [email protected]
2. The painstaking path to a Common Cereal Market
The Base Regulation No. 19/62 governing the step-by-step introduction of a Common Market
Organization for Cereals was published in the E.E.C. Official Journal on 4th April 1962. It was set
to come into force on 1st July 1962. It was also stipulated that the first step towards
harmonising the different grain price levels should be agreed upon during the 1963/64
marketing year and should come into effect on 1st July 1964.
Both deadlines could not be met. At short notice, the July 1 deadline was postponed until 30th
July. The experts from the Commission and the Member States, together with the linguists,
needed much more time to harmonise the content of the numerous regulatory texts in the
E.E.C.’s four official languages.
Neither did the step-by-step harmonisation of grain prices take place. For a long time, Germany
was bitterly opposed to any reduction in its grain prices. It wasn’t until 10th/11th May 1966 that
the Council of Agriculture Ministers reached agreement on harmonising prices in one single step
on 1st July 1967. The 15th December 1964 resolution („breakthrough for Europe“) had finally
been put into effect!
This Cereals Common Market Organisation turned out to be a lot more protectionist than had
originally been intended by the Commission. A number of elements, emanating mainly from the
strict German Market Regulation Law (“Marktordnungsgesetz”), reappeared within the European
framework: the year-round intervention obligation, sluice-gate prices and levies, and
regionalisation.
Even if a number of national regulations remained in force until the end of the transition period
(originally set at seven years but phased out on 1st July 1967 after only five years), this Market
Organisation was the first time a common binding framework covering all six countries had
been established.
Examples of common principles were:
abolition of all direct state interventions;
prices reflecting local conditions;
protection at external frontiers via levies, in domestic markets via obligatory intervention;
gradual reduction of intra-community levies;
inclusion of all cereal-based processed products, as well as products in direct
competition such as tapioca and bran
Another example points to the way national agriculture markets were growing together and how
national competencies were being transferred to supranational (i.e. E.E.C.) bodies: the first
meeting of the Cereals Management Committee (Comité de gestion des Céréales) on Thursday,
9th March 1962, chaired by director Berend Heringa. Such management committees were also
installed for all other products and product groups subject to market organisation. These bodies
have become the regular meeting places for representatives from the E.E.C. Commission’s
specialist departments and the responsible experts from the individual Member States. Their
Rue du Trône 98 • B-1050 Bruxelles • Tel. +32 2/502 08 08 • Fax. +32 2/502 60 30 • E-mail: [email protected]
objective is to effectively “manage” agriculture markets. There is hardly another body that has
been so closely connected and had so much influence on market development as these
„Comités de gestion“.
With respect to the major importance of the grain market, its management committee met
nearly every Thursday afternoon right up to the beginning of the 2007/2008 marketing year (it
now only meets once every two weeks). The first meeting took place on 9th March 1962, the
1000th on 29th August 1985 and the 2050th at the beginning of January 2008.
But back to Regulation No. 19/62 and a summary of its main points. The organization of the
internal market was the central issue:
Starting with the 1962/63 marketing year, the system of minimum and maximum prices used
by a number of countries was replaced by a system of base target prices and base intervention
prices. These were initially set at different levels for individual countries. They applied to wheat
and barley, in Germany to rye as well and in France and Italy also to maize.
These base prices were applicable for the main deficit region. In Germany this was the Duisburg
region with its important grain milling and compound feed industries. In France, the port of
Rouen was declared the main deficit area. The so-called regionalisation in the major countries
involved using these base prices to derive a number of marketing centres. In Germany for
example there were 202 marketing centres for wheat, rye and barley. A complicated process of
determining the lowest freight costs from Duisburg to each marketing centre was used to set
the derived target prices. Price differentials between derived intervention prices for Duisburg
and areas further away turned out to be much lower.
Target prices played only a minor role in the market regulation system, for example when selling
grain bought at intervention prices. The intervention price on the other hand was a guarantee for
all market players. The agencies responsible for intervening – the EVSt in Germany and the
ONIC in France – were committed to buy produce (wheat, rye, barley and – in Italy – durum
wheat) offered to them at each marketing centre (intervention agency stores) at the applicable
intervention price. Obligatory intervention applied from September to May, although the E.E.C.
Commission’s original intention had been to only have such a state purchase commitment at
the end of each marketing year. When malting barley was offered for intervention – which rarely
happened – a 40 DM per tonne premium was given on top of the barley intervention price.
The produce had of course to meet certain quality criteria: specific weight (kg/hl), moisture
content, impurity levels and non-sprouting. Minimum purchase amounts were also fixed, varying
by country and type of cereal from 25 tonnes (Luxembourg) to 500 tonnes (wheat in France).
In 1962/63 and 1963/64, the first two years of the Cereals Common Market Organisation,
there was relatively little intervention. But in 1964/65 it rose sharply, with 470,000 tonnes of
wheat and 400,000 tonnes of rye in Germany alone. In the following years and decades,
Germany had the dubious honour of being the top interventionist.
Intervention, target and threshold prices were topped up by monthly increments. These were
intended to cover interest payments, drying costs, administrative costs and natural losses. In the
1962/63 marketing year, starting in September, ten increments on wheat and barley were
granted amounting to a total of 45 DM per tonne, as well as 25 DM per tonne on animal feed
grain.
The first revision of the regulation on monthly increments occurred directly in the following
1963/64 marketing year. The total amount was reduced by 10% for all types of grain and, in
addition, subjected to a diminishing scale. Monthly increments were to become one of the
market organisation elements most often amended by the Council of Ministers.

Rue du Trône 98 • B-1050 Bruxelles • Tel. +32 2/502 08 08 • Fax. +32 2/502 60 30 • E-mail: [email protected]
Regulating external trade proved to be a lot more complicated than regulating the internal
market. The price differentials between the six Member States were a major factor. As already
mentioned, complete price harmonisation for cereals was not achieved until 1st July 1967.
Germany France Netherlands Italy
Intervention price1:
Soft wheat 442.50 340.- 339.90 409.60
Durum wheat ---- 415.50 ---- 547.20
Rye 402.50 271.80 ---- ----
Barley 383.50 271.30 ---- ----
Threshold price:
Soft wheat 484.- 382.20 366.30 438.40
Durum wheat 508.- 453.50 385.- 570.40
Rye 440.50 309.80 269.50 394.40
Barley 427.- 307.70 308.- 250.40
Oats 388.50 275.30 294.30 253.60
Maize 432.- 358.20 280.50 244.-
Sorghum 405.- 358.20 272.30 279.20
[1] in the main deficit area, at the begin of the marketing year
E.E.C. grain prices in 1962/1963 (in DM per tonne)
This table illustrates again the major differences between Germany with its high prices and the
Netherlands, which was looking for affordable raw materials. It also shows that rye was
considered as animal feed in all countries except Germany.
The threshold prices1 were intended to be set at such a level that the wholesale prices would be
achieved in the main deficit area (i.e. near the target price level).
For imports from third countries a levy reflecting the difference between the so-called world
market price and the E.E.C. threshold price was calculated.
The c.i.f. import prices for the individual types of grain were used as the basis for defining the
world market price. These were determined for imported grain by the E.E.C. Commission on a
daily basis at the main entry ports (Rotterdam, Antwerp, Marseille, Genoa, Ravenna etc.).
Relevant information was supplied by the Member States and taken from quotations from
international commodity exchanges. The most favourable prices were used. The levels
calculated in this manner (the difference between the threshold and c.i.f. import prices) were
often subject to correction, with the coefficients of equivalence being the most frequent
correction factor: on the one hand there was only a single threshold price for soft wheat – as for
other types of cereals. On the other hand soft wheat varieties were traded on international
markets at different prices depending on their quality. A balance was achieved by the use of the
coefficients of equivalence, which were applied to the main grain varieties traded on
international commodity markets. For soft wheat alone there were 28 different coefficients,
1 The threshold price is a minimum price above which imports from third countries enjoy free access. For products for which a target
price or guide price exists, the threshold price is determined in such a manner that the sales price of the imported product,
allowance made for transport costs, is on a par with this price.
Rue du Trône 98 • B-1050 Bruxelles • Tel. +32 2/502 08 08 • Fax. +32 2/502 60 30 • E-mail: [email protected]
ranging from 1.25 USD per tonne for Swedish wheat to 12 USD per tonne for top-quality wheat
varieties such as US-Dark Hard Winter I and II (guaranteed 14 % protein content) and 12.50 USD
per tonne for the Canadian Manitoba I.
The better the quality, the higher the coefficient was. There were also negative coefficients for
imported grain not meeting E.E.C. standards – such as some barley varieties from North
America, North Africa, Syria, Iraq or Turkey. The positive coefficients were subtracted from the
individual c.i.f. prices to reflect the potential advantage of purchasing such grain. The levy rose
correspondingly. The system worked in the opposite way for negative coefficients. In this way, it
was – at least in theory – guaranteed that the different qualities of imported grain were
completely accounted for on the E.E.C. internal market.
The logic behind this system might seem to be convincing. However there was constant friction
in its daily use between the Brussels management and traders, mainly centring on the choice of
the “right” c.i.f. prices. The levy levels dependent on these were an important instrument for
“managing” imports.
For example, the Commission would set c.i.f. prices on the basis of Rotterdam as entry port.
These prices would be corrected to reflect another entry port. Imports to Germany were based
on Emmerich in the Lower Rhineland as entry port. Freight and handling costs between
Rotterdam and Emmerich were set at 4.40 DM per tonne. The Rotterdam c.i.f. price was
increased by this amount, leading to a lower levy at the German border.
Levies were valid for 24 hours. They were changed if there was a difference of more than 1.80
DM per tonne compared with the previous day.
As import transactions usually involved forward contracts, the levy could be applied for in
advance, reflecting the future delivery date (and the payment date of customs duty). The levy
applicable on the date of application was however corrected if the actual transaction price
turned out to be lower. This correction amount, also called the premium, compensated for the
difference and prevented imports below the threshold price level.
In connection with the levy, the importer applied for an import licence from his national market
organisation agency. This licence had to be granted without any restriction as to amount or
origin. The licence could only be revoked or not granted if the domestic price level was seen to
be endangered through exceptionally high imports (with reference to the safeguard clause in
Article 22 of Regulation No. 19/62).
Import licences were valid for the current month and the following three months. Licence
misuse was prevented by a very high guaranty being required, which would be forfeited if the
import transaction did not actually take place within a maximum 4-month timeframe. The
different levels of guaranties demanded by the six countries were one example of the
competition distortions in effect at that time.
Imports from E.E.C. Member States were basically treated in the same way, with the exporting
country’s “free-at-frontier” price being used instead of the c.i.f. price to calculate the levy. The
starting point was the market price in the main deficit area (in France, the most important
exporting country, this was the Paris basin; fob Chartres). On top of this came a predetermined
sales margin of 4 DM per tonne and freight costs (for Germany, based on Emmerich). The
difference between this “free-at-frontier” price and the threshold price was the intra-community
levy.
To encourage trade within the internal market, this levy was subject to a general reduction of 4
DM per tonne for grain and 10 DM per tonne for processed cereal products (flour and semolina).
This so-called „Préférence communautaire“, which also applied to trade in other agricultural
products, was the source of major protest by a number of third countries, who interpreted it as a
gross and unfair discrimination of their exports.

Rue du Trône 98 • B-1050 Bruxelles • Tel. +32 2/502 08 08 • Fax. +32 2/502 60 30 • E-mail: [email protected]
With market prices within the E.E.C. subject to much less fluctuation than world market prices,
E.E.C. levies were not fixed on a daily but a weekly basis. The levies were also not subject to any
corrections due to coefficients of equivalents, as most E.E.C. grain varieties basically
corresponded to the European standard.
In contrast to imports, E.E.C. grain exports to third countries were subject to much less
regulation. The Commission’s regulations provided for 3 export procedures:
1. export in conjunction with the levy-free re-import of the same type of grain;
2. refunding of the levy valid on the day of export for the same type of grain (including the
possibility of fixing the size of the refund in advance);
3. putting the export refund up to tender.
The Commission made a wise decision in delegating the choice of the export procedure to the
individual Member States. France, the only export country of significance, preferred the
procedure of putting export refunds to tender. Germany initially only allowed refunds on exports
to third countries in conjunction with the levy-free re-import of the same type of grain. The export
of grain to other Member States was, with the exception of seed grain, prohibited.
The evaluation of the Cereals Common Market Organisation one year after its introduction
differed according to interests. Most participants agreed in principle that the scheme had
generally stood the test of time and that no major hiccups in the market had occurred.
Germany, the country most sceptical to start with, voiced little criticism – maybe because even
farmers had to admit that prices had risen slightly in comparison with the previous year.
There were no major amendments to Base Regulation No. 19/62 or its implementation
regulations in the transition years prior to the introduction of harmonised prices for grain on 1st
July 1967. Price levels remained virtually unchanged apart from a minor reduction in the
threshold prices for maize and barley in Germany and a slight increase in prices in the
Netherlands following the 15th December 1964 resolution on harmonising grain prices.
On the technical/administrative side a number of corrections were made, taking into account
the practical experiences made with some implementation regulations. These included
corrections of the coefficients of equivalence and quality standards in line with what was
actually happening in the markets.
Greater significance must be given to a number of developments and occurrences that
influenced the incipient E.E.C. agricultural market as a whole.
First of all, the Kennedy Round needs to be mentioned. This was the sixth round of GATT
negotiations since World War II. Negotiations began in 1964 and ended in mid-May 1967.
Three points were of importance for the grain market:
1. the increase in grain shipments to developing countries within the framework of food aid
from 3 to 5 million tonnes, with increased E.E.C. involvement (especially in flour shipments);
2. the growing pressure of certain GATT members to harmonise and reduce agricultural prices;
3. the reduction of the import duty rate on tapioca (customs tariff 07.06) to zero for the fixed
part of the levy and to 18 kg of the levy on barley for the variable part. Tapioca was a cereal
Rue du Trône 98 • B-1050 Bruxelles • Tel. +32 2/502 08 08 • Fax. +32 2/502 60 30 • E-mail: [email protected]
subject to Cereals Market Organisation and this measure meant that imports of tapioca as a
grain substitute would be greatly encouraged.
Secondly, the sharp attacks especially by the USA need to be mentioned. The E.E.C. was
accused of blatant protectionism and aspiring to become self-sufficient in the agriculture sector.
The 1963/64 „Hähnchen-Krieg“ (chicken war) is a sad reminder of these disputes. As a result of
this particular dispute, all subsequent market regulations included the so-called 39/110 clause,
referring to Article 39 of the E.E.C. Treaty on the protection of the domestic agricultural sector,
and to Article 110 governing trade relations.
Finally, the internal E.E.C. disputes, especially between France and the Brussels Commission,
played an inauspicious role. At the instigation of President de Gaulle, France boycotted E.E.C.
committees from early summer 1965 till the end of January 1966. Strangely enough, this
“policy of the empty chair” did not apply to the weekly meetings of the Cereal Management
Committee. Ostensibly, the reason for France’s abstention policy was its concern on how the
Common Agricultural Policy should be financed. But deeper down, it was all about the E.E.C.’s
political direction, the surrender of sovereignty, the co-determination rights of the European
Parliament and the power of the Commission, which President de Gaulle saw as nothing more
than a rubber-stamp agency.
Rue du Trône 98 • B-1050 Bruxelles • Tel. +32 2/502 08 08 • Fax. +32 2/502 60 30 • E-mail: [email protected]
3. The harmonisation of grain prices – a breakthrough for Europe
The massive pressure from certain third countries and the wildly varying interests of individual
Member States were the difficult attendant circumstances, under which the discussions on the
“right” price level for grain took place within the Community. The debate had got under way at
the beginning of the 60’s and carried on right up to the legendary decision of 15th December
1964 on harmonised grain prices, when the agriculture and economics ministers of the E.E.C.
Member States followed the proposal of Agriculture Commissioner Mansholt and agreed on a
“middle-range” price level. A month earlier, President de Gaulle had threatened to take France
out of the E.E.C. if no agreement was reached on a common price level by 15th December
1964.
This threat had been aimed primarily at Germany, which in those years had had its foot more on
the brake than on the accelerator in all efforts directed at integration. The federal government
seemed to hold the opinion that lower prices for farm produce and increased competition would
not be digestible for German farmers. Reference was constantly being made to the higher
production costs, to the major potential loss of income for German farmers if prices were
reduced, to the lack of harmonisation in fiscal and financial policies, and to other issues.
On 10th - 11th May 1966 the E.E.C. Agricultural Council officially adopted the resolution to let
common grain prices come into effect at the beginning of the 1967/68 marketing year, in
accordance with the 15th December 1964 resolution. This meant that the transition period,
proposed on 14th January 1962 for the establishment of a common grain market, had been
reduced by two and a half years. In addition to the Cereals Common Market Organisation, the
common markets for cereal-based products, pork, eggs and poultry and oilseeds were also
established. This laid the foundation for the establishment, one year later on 1st July 1968, of
the common agricultural market for the remaining products (eggs, beef and milk) as well as the
Customs Union (one and a half years earlier than originally planned).
1st July 1967 was a significant date for other reasons as well. It was the day the merger of the
E.E.C., the European Coal and Steel Community (ECSC) and Euratom came into effect, creating
the European Communities. The E.E.C. became the E.C., the E.E.C. Commission became the E.C.
Commission. 26 years later, the European Community became the European Union.
The new Base Regulation for the Common Cereal Market, Regulation No. 120/67, was not
published in the E.C.’s official journal until 13th June 1967, two weeks after it had come into
effect. Important implementation regulations followed at an even later date. The introduction of
the common price level meant that there was no longer any need for intra-community levies and
that, common rules governing exports and the management of the internal market could be
applied. These were decisive preconditions for establishing a common market. But of course,
harmonised policies in the areas of tax (VAT), transport (freight rates) and - last but not least -
currency remained missing. Within just a few years, with currency parities adrift, compensatory
mechanisms had to be introduced to counteract major currency fluctuations (monetary
compensatory amounts).
The solution to such monetary problems was to fix prices in units of account (EUA – European
Units of Account). This was an artificial common currency, corresponding to 0,88867088 gr. of
fine gold and worth one USD. The parities of the national currencies to gold or USD were used

Rue du Trône 98 • B-1050 Bruxelles • Tel. +32 2/502 08 08 • Fax. +32 2/502 60 30 • E-mail: [email protected]
for converting EUA into Member State’s currencies (or vice-versa). This meant that one EUA was
equivalent to 4 DM, 4.937 FF, 625 Lit, 362 NLG and 50 BEF/luxF.
67/ 68 66/67 (1)
67/ 68 66/67 (1)
67/ 68 66/67 (1)
Soft wheat 425.- 475.50 395.- 442.50 417.52 474.50
Durum wheat 500.- ---- 470.- ---- 492.52 521.50
Rye 375.- 432.50 350.- 402.50 367.52 433.50
Barley 365.- 412.- 340.- 383.50 356.- 415.50
Maize 362.52 ---- 308.- ---- 353.52 415.50
Oats ---- ---- ---- ---- 334.64 378.50
Sorghum ---- ---- ---- ---- 341.76 394.50
Buckwheat/ Millet ---- ---- ---- ---- 338.20 ----(1)
These prices for 1966/ 67 only applied to the Federal Republic of Germany
Base target price Base intervention price Threshold price
Grain prices in 1967/1968 (in DM per tonne)
The base target and intervention prices still applied to the main consumer regions. There was a
special ruling for durum wheat, insofar as producers were guaranteed a minimum price of 580
DM per tonne, way above the official intervention and target price.
For maize, a relatively low intervention price of 308 DM per tonne was set for the whole E.C. It
applied as long as farmers’ maize sales did not cover more than 45% of the Community’s
requirements. This can be interpreted as a certain concession to the USA.
Intervention prices were no longer solely determined on the basis of a main deficit region and
the freight costs necessary to service such a region - the so-called regionalisation. Other major
deficit regions, entry and exit ports were also taken into account.
In the Federal Republic a total of 125 marketing centres (intervention centres), each with its
individual intervention prices, were established. France, with 278 intervention centres, and Italy,
with 271, had a great many more. Target prices were no longer subject to regionalisation
National intervention agencies remained committed to buy up produce from farmers at the
intervention price offered by one of three nearest marketing centres. The minimum quantity was
set at 50 tonnes, with an exception being made for Luxembourg and Italy, where it was set at
10 tonnes. Germany retained its previous minimum quantity of 100 tonnes. For high-quality rye
of bread-making quality, a premium of 10 DM per tonne could be paid on top of the intervention
price.
In principle it would have been expected that any intervention could, in a common market, take
place in a neighbouring E.E.C. country without respect for national frontiers. When however
German wheat was offered to a French intervention agency, difficulties cropped up in
connection with the French registration system with its organismes agrées and passage
obligatoire.
In additional to this “normal” intervention procedure, the national intervention agencies were
empowered to initiate special measures in support of local markets. This so-called “Intervention
B” had previously been part of the French market organisation. In the E.E.C. it only played a
minor role.
The quantities bought up by the intervention agencies had to be channelled back into the
market. This generally occurred via tenders, with the bidder offering the highest price being

Rue du Trône 98 • B-1050 Bruxelles • Tel. +32 2/502 08 08 • Fax. +32 2/502 60 30 • E-mail: [email protected]
awarded the contract. The selling price for deliveries to the internal market had to be at least 16
DM per tonne above the intervention price of the nearest marketing centre.
For produce being sold for export, minimum prices were set by the Commission, taking into
account price levels on both the internal and the world market.
A new instrument for managing markets was denaturing. Wheat and rye were made unfit for
human consumption, in order to relieve the market for cereals of bread-making quality and to
reduce the deficit in animal feed grain. Denaturing was carried out by colouring the grain or
adding fish oil. The denaturing premium for the whole E.E.C. was set at 54.20 DM per tonne for
July and August. From September to May there were additional monthly increments, which
however, at 0.80 DM / tonne, were a lot lower than for basic cereals. Rye denaturing was only
permitted on the premises of intervention agencies.
The premium was reduced if the wheat was not denatured, but mixed – under supervision - with
other components in a factory producing compound feed. The export of denatured wheat was
also permitted, but the subsidies were set at barley levels.
External trade regulation followed the same lines as practised under the previous Regulation
No. 19/62. Due to the abolition of intra-community levies and the introduction of a common
threshold price (using Rotterdam as the base), the system became a lot easier.
The levy was fixed daily by the Commission, provided the difference to the previous day was
more than 2.40 DM per tonne. The levy corresponded to the difference between world market
prices and the Community’s threshold prices.
For a certain transition period, Italy was exempted from the principle of a single common levy.
The country was granted a levy reduction of 30 DM per tonne on imports from third countries in
order to support its nascent food processing industry. For grain imported from other E.E.C.
countries, a subsidy was granted at the same rate, financed by the European Agricultural
Guidance and Guarantee Fund (EAGGF). This special provision was initially limited till 1971/72,
but was prolonged several times. 90% of all proceeds from levies went into the EAGGF. The
remaining 10% were retained by Member States as an administrative fee.
Foreign trade was carried out on the basis of import and export licences. Import licences were
valid for the current and subsequent three months. If the import transaction did not take place
within this timeframe, the guarantee of 20 DM per tonne on licences with a pre-fixed levy was
forfeited.
The same deposit rules and timeframes also applied to export licences. For exports to state-
trading countries, licence validity was extended to the current month plus five months (for flour,
plus six months). Malt export licences were valid for eleven months.
A licence was also necessary for intra-community trade. The reason given was the need for
improved market transparency.
A harmonised E.E.C. licence, to be issued independently of the applicant’s country of residence
and useable at any border-crossing within the Community, did not come into existence until the
1969/70 marketing year, one year later than originally intended.
Exports were a difficult case, and remained so in the following decades. The gap between E.E.C.
prices and the lower world market prices was bridged by refunds. The main criteria for
calculating refunds were:
1. the prices at the Community’s exit ports;
2. the quotations on the international commodity exchanges (especially in the USA);

Rue du Trône 98 • B-1050 Bruxelles • Tel. +32 2/502 08 08 • Fax. +32 2/502 60 30 • E-mail: [email protected]
3. freight costs within the E.E.C. and on the world market.
Each Thursday, with the help of these and other market data, the Commission compiled the
refund rates. These could however be changed in between, either via an application submitted
by a Member State or on the initiative of the Commission.
For calculating refunds on cereal-based processed products, the quantity of raw materials
necessary for production was used (the so-called “raw material incidence”).
Refund rates were set for the whole E.E.C. They could however be increased for more distant
destinations, taking higher freight costs into account. Increased refunds were only paid out once
the exporter had produced proof that the produce had actually reached its destination and been
discharged.
Just as with levies, a pre-fixing of refunds was also possible. In contrast to levies, the correction
factor could move up and down, to compensate for fluctuations in forward prices.
The safeguard clause already referred to in connection with Regulation No. 19/62 was naturally
included in the subsequent Regulation No. 120/67. Article 20 stated that “in trade with third
countries, suitable measures can be taken, should the market be subject to serious upheavals
caused to imports or exports or be threatened by such”. Such measures – i.e. withholding
licences – could be instigated by the Commission or upon application by a Member State. In the
long history of the E.E.C. market organization for cereals, this instrument was only used twice.
The importance of foreign trade in those days can be illustrated by a few figures: in the
1967/68 marketing year with a total grain harvest of 67 million tonnes, the six E.E.C. members
achieved an export surplus in wheat of 1.5 million tonnes; in the previous year, trade had been
balanced. In contrast, there was a trade deficit of 10 million tonnes in animal feed grain (12
million tonnes in the previous year). In 1967/68 the Community achieved its first export surplus
in barley: approx. 1 million tonnes. Maize exports reached 1 million tonnes, but 11 million
tonnes were imported.
In autumn 1968 COCERAL drew up a balance of the first year of the Cereals Common Market
Organisation, coming to the conclusion that the new regulation had stood the test in most
aspects. The market was working a lot more smoothly than originally anticipated. The
apprehension about difficulties in the transition to the new regulation had been unjustified.
COCERAL had two main points of criticism: one was the delay in publishing important regulation
texts, which in some cases had come into effect retroactively. This was made worse by the fact
that some texts had been so vaguely formulated that this had led to interpretation problems.
The second point concerned the large scope of discretion, which the Commission had granted
itself for interventions in the workings of the market. Examples were the calculation of c.i.f.
prices, the determination of export refunds, prefixation restrictions, changes in the coefficients
of equivalence, or the use of intervention B.
Even today, some of these problems still dog COCERAL’s work. But a whole plethora of new
problems have been added.
It is also interesting to draw a balance of the Common Grain Market’s first year from a
statistical perspective. Attention is immediately drawn to the high intervention amounts,
especially in Germany. Some 740,000 tonnes of wheat, with 300,000 tonnes coming from
Bavaria alone, were bought up by the EVSt. In addition there were the 150,000 tonnes of rye
Rue du Trône 98 • B-1050 Bruxelles • Tel. +32 2/502 08 08 • Fax. +32 2/502 60 30 • E-mail: [email protected]
and 80,000 tonnes of winter barley. In France, some 200,000 tonnes of wheat were taken out
of the market and put into storage as an intervention B measure.
At 44,000 tonnes, wheat denaturing did not have the anticipated effect in Germany, mainly due
to the high administrative hurdles. In comparison, the Netherlands reached a figure of 200,000
tonnes and France 600,000 tonnes.
The average export refund for wheat corresponded approximately to the average levy. The
highest additional export subsidy (15 EUA per tonne) was paid for exports to the People’s
Republic of China.
The basic structure of Cereals Common Market Organisation, as defined in Base Regulation
120/67, remained basically unchanged until its expiration at the end of October 1975 (it was
superseded by Regulation No. 2727/75 which came into effect on 1st November 1975). For this
reason, only major changes that took place in this period will be mentioned in the following
chapters. Indeed, in the 70’s and 80’s, external factors had a much greater influence on the
workings of the common market than regulatory decisions. Such external factors include the
increasing upheavals in currency markets (leading to the monetary compensatory amounts),
Community enlargements (leading to accession compensatory amounts) and the repercussions
of GATT disputes.
Rue du Trône 98 • B-1050 Bruxelles • Tel. +32 2/502 08 08 • Fax. +32 2/502 60 30 • E-mail: [email protected]
4. The first enlargement of the Community
An important theme in this connection was the discussion on “deepening and enlarging”. This
first appeared on the agenda of the Den Haag summit meeting at the beginning of December
1969. The enlargement of the Community was intended to go hand in hand with progress in
deepening Community structures and policies. With this in mind, the Den Haag summit
declaration gave the go-ahead for both an economic and monetary union and political
unification.
Apart from the accession talks with Denmark, Great Britain, Ireland and Norway, which
culminated in 1973 in the first enlargement of the 6-member Community, negotiations were
being held with a number of neighbouring countries on various forms of economic collaboration.
With the aid of these association, cooperation and free trade agreements, the E.E.C. was able to
greatly expand its economic influence.
1st July 1968 was not just an important date for the Common Cereals Market Organisation. It
was also the date the Customs Union came into effect. This meant the abolition of intra-
community customs duties and the introduction of a common external tariff for trade with third
countries. A large number of redundant customs officers moved to the market organisation
agencies, as the regulatory fervour of the E.C. Commission – and the Councils of Ministers! –
was creating new jobs. The customs union was important for the agricultural market: for all (as
yet) non-regulated farm produce, the remaining customs duty was slashed from the average
15% to zero.
The 1968/69, 1969/70 und 1970/71 marketing years (beginning as from 1968/69 on 1st
August instead of 1st July) saw only minor changes. In 1968/69 for example, prices for animal
feed grain (including rye) were raised slightly and denaturing was facilitated (higher subsidies
and less bureaucracy). This was caused by a sharp rise in interventions. More and more wheat
was supposed to go into the feedstuff sector, which naturally had negative effects on imports of
feed grain.
For 1970/71, the Agriculture Council decided – without the backing of the E.C. Commission – to
raise grain prices by 2 – 5% depending on the type. Increments were increased by 8%. This
decision came as a surprise for a number of market observers, as wheat surpluses had already
reached threatening levels. This was especially true for low-quality “mass wheat”, for which
there was virtually no international demand.
By the end of the 70’s, net grain imports to the E.E.C. had receded to some 7 million tonnes.
This was way below the 10 – 11 million tonnes agreed upon in the Kennedy Round.
Apart from the wheat surplus, the overproduction of sugar and butter was increasingly
becoming a headache.
European political discussions in the early 70’s were dominated by two themes of special
relevance to the common agricultural market: one was the enlargement of the Community, the
other the upheavals on the currency market.
In May 1967, Denmark, Great Britain, Ireland and Norway had renewed their applications for
starting accession negotiations. They had first applied back in August 1961, but these
exploratory talks had failed, mainly due to President de Gaulle’s resistance. It wasn’t until a year
after his resignation in April 1969 that negotiations got under way again.

Rue du Trône 98 • B-1050 Bruxelles • Tel. +32 2/502 08 08 • Fax. +32 2/502 60 30 • E-mail: [email protected]
The most contentious points were:
1. Great Britain’s links with the Commonwealth (Mauritius sugar or New Zealand butter);
2. the share in financing the Common Agricultural Policy;
3. the length of the transition period.
On 1st January 1973, Denmark, Great Britain and Ireland joined the E.E.C. In a referendum in
September 1972 in Norway, a majority of 53.5% of Norwegians had voted against accession.
The common agriculture market organisations came into effect for the three countries a month
later on 1st February 1973. Even this deadline had been in danger, with one of the main
reasons being that the Luxembourg printing shop was hardly able to cope with the vast quantity
of regulations that had to be published in the new languages. The Council of Ministers was
clearly the guilty party, as a number of detailed issues had only been agreed upon at the last
minute, following tortuous night-long sessions.
With the introduction of the E.E.C. market organisation system, the three countries committed
themselves to bring their - in many cases much lower - price levels into line with E.E.C. price
levels within five years (till 31st December 1977). Because threshold prices, levies and refunds
were already applicable in full for the accession countries, compensatory amounts (price or
accession compensatory amounts as opposed to monetary compensatory amounts) were
needed to bridge the gaps. These amounts were reduced in line with the increase in price levels
that took place in six steps up till 31st December 1977. The first one-sixth reduction became
effective on 1st August 1973 at the beginning of the new marketing year.
Examples of accession compensatory amounts for wheat valid on 1st February 1973 were
44.32 EUA per tonne in Great Britain, 9.95 in Denmark and 7.25 in Ireland.
These amounts applied to trade both with third countries and with the old E.E.C. countries.
Levies were applied at the same rate for all nine countries. This meant that imports of wheat
from the USA to Great Britain were reduced by 44.31 EUA per tonne. By contrast, an exporter of
French wheat to Great Britain received a subsidy of 44.31 EUA per tonne. This meant that
products from third countries and E.E.C. countries were subject to the same competitive
conditions.
Accession compensatory amounts were calculated for all types of grain (using wheat and barley
as the base cereals in accordance with their nutritional values) and all processed products. For
the latter, the amounts consisted of a fixed sum intended for protecting national processing
industries (based on the old customs duty) and the so-called raw materials incidence.
As from 9th December 1973 “advance fixing” was introduced for accession compensatory
amounts as well. Following payment of a 3 EUA guarantee, the fixing applied to the whole
validity period of the import or export licence.
The compensatory amounts in trade between the three new members were derived from the
difference in amounts that each country had vis-à-vis the 6-member Community.
The application of this logical and straightforward ruling was made redundant by the fact that
between August 1973 and the end of 1974 and once again in autumn 1975 world market
prices exceeded E.E.C. prices for the first time. This meant that import levies and accession
compensatory amounts were reduced to zero.
Article 55 of the Act of Accession stipulated that accession compensatory amounts must not
exceed levy rates. Within a margin of 4 EUA per tonne, the levy was coupled to the
compensatory amount. A levy of 0.01 – 4 EUA led for example to a compensatory amount for
Great Britain of 2 EUA; a levy of 4.01 – 8 EUA led to 6 EUA.

Rue du Trône 98 • B-1050 Bruxelles • Tel. +32 2/502 08 08 • Fax. +32 2/502 60 30 • E-mail: [email protected]
5. Monetary compensatory amounts and the Common Agricultural Market
The accession compensatory amounts were supplemented by monetary compensatory amounts
to compensate for the currency disparities which had been increasing as from the late 60’s, as a
direct consequence of nationally-based monetary and financial policies. Back in March 1957,
the founding fathers of the E.E.C. Treaty had already been aware of this potential problem. The
somewhat vague monetary provisions in the Treaty (Articles 103 and 107) were aimed at
protecting the Common Market from disruptions. Member States were obliged to treat
economic policy and “policy in the area of exchange rates as an issue of common importance”.
Article 109 called upon governments to make sure that any national protective measures led to
minimum disruption in the Common Market.
The E.E.C. Commission had issued a number of proposals in the mid and late 60’s regarding an
improved coordination of economic and monetary policy, but the countries showed little
interest, preferring to protect their sovereignty.
The Community was therefore caught unaware when the French franc was devalued by 11.1%
on 11th August 1969 and the German mark re-valued by 9.29% on 24th October 1969
(following its floatation on 29th September 1969) .
Since 1st July 1967 standard grain prices set in EUA had been in effect in the E.E.C. These were
converted into national currencies on the basis of the official exchange rates. This meant that
any change in the exchange rate would lead to changes in prices as expressed in the national
currency. A revaluation led to lower national price levels, a devaluation to higher ones.
From a financial point of view, such an automatic system made sense. However the national
economic and political implications were not to be underestimated. Therefore the effects of
cheaper or more expensive currencies on trade in cereals (and all other agricultural products)
had first of all to be neutralised.
This was done via compensatory amounts at the French and German intra-community and
external borders – the so-called monetary or border compensatory amounts.
With effect from 22nd August 1969 and just 11 days after devaluation, export levies and import
subsidies were introduced in France. They were slowly phased out in the following two years,
after prices for agricultural produce had been raised by 12.5% in FF terms within the same
period.
Germany operated a similar system for a limited period until 31st December 1969 in the
opposite way - with export subsidies and import levies. On 1st January 1970 the automatic
system came into effect: agricultural prices tied to EUA were cut by 8.5% - in the middle of the
marketing year! German farmers were compensated via payments per hectare and a rise in
VAT.
The devaluation of the French franc and revaluation of the German mark in autumn 1969
turned out to be just a foretaste of what was to come. They were followed by a whole row of
parity changes, affecting both E.E.C. currencies and the USD.
The effects on agricultural markets were in many ways chaotic. The Commission became very
inventive in developing one temporary construction after another to prevent a complete
Rue du Trône 98 • B-1050 Bruxelles • Tel. +32 2/502 08 08 • Fax. +32 2/502 60 30 • E-mail: [email protected]
breakdown of the market organisation system – with a certain amount of success. The era of
the monetary compensation amount specialists had arrived…..
There is unfortunately no room here to discuss the enormous workloads that weighed down the
Commission’s agencies and other financial institutions.
The problem can however be illustrated by just a few key facts:
1. In May 1971, the exchange rates of the Dutch NLG and German DM were floated.
Compensatory measures came into force at the two countries’ borders. Belgium and
Luxembourg followed suit at the end of August, France and Italy at the end of
December.
For regulating trade with third countries, average exchange rate movements between
individual E.E.C. currencies and the USD were determined on a weekly basis. This
revaluation factor was – in simple terms – multiplied by the c.i.f. price (for intra-
community trade by the Duisburg-based intervention price) to fix the size of the
compensatory amount.
2. The chaos reached its peak in spring 1973, following the devaluation of the dollar on
10th February 1973, and the accession of the three new members. The Commission
stopped calculating monetary compensatory amounts on 26th February 1973. Base
amounts, currency factors and levy coefficients were published, with which trading
companies could calculate the valid amounts themselves. Some 500 agricultural
products were involved.
3. Monetary compensatory amounts could also be fixed in advance, but only for trade
with third countries.
4. The monetary compensatory amount valid in a weak currency importing country could
be paid out by the strong currency exporting country.
5. The switch-over coefficient was one very inventive contribution to easing the
administrative burden caused by the currency upheavals. Its use meant that
revaluation effects could be transferred to countries with weak currencies, thereby
avoiding price reductions in the country with the re-valued currency. The coefficient
(1.207509) was used between 1st August 1984 and 1st February 1995.
6. There could be no talk of a “standard E.E.C.” price level from the early 70’s to the mid
90’s. In all countries exchange rates were constantly fluctuating. These were
compensated either by adapting the monetary compensatory amounts or by adjusting
prices for agricultural produce on a national level. The official EUA parities were
replaced by the so-called “green” parities in the agricultural sector.
Prior to the introduction of the European Monetary System (EMS) and the European Currency
Unit (ECU) on 13th March 1979, “green” parities were adjusted seven times in Germany and
Great Britain, nine times in France and eleven times in Italy.
Rue du Trône 98 • B-1050 Bruxelles • Tel. +32 2/502 08 08 • Fax. +32 2/502 60 30 • E-mail: [email protected]
In retrospect, it seems incredible that the Common Agricultural Market did not collapse under
the burden of these enormous monetary tensions. The inventiveness of the Commission staff in
finding ways to prevent this knew no bounds.
Following the failure of the Werner Plan (named after Luxembourg’s Minister of Finance) for a
better coordination and step-by-step introduction of an economic and monetary union in the
early 70’s, a breakthrough was achieved in 1978. On 5th December the leaders of the nine
member countries reached agreement on the establishment of a European Monetary System
(EMS). Its top priority was to achieve greater monetary stability through improved coordination
of economic and monetary policies.
Due to French reservations the EMS did not start operating on 1st January 1979 as planned, but
on 13th March 1979. With respect to the Common Agricultural Market it became operational in
certain areas on 9th April, for other areas at the beginning of respective marketing years.
All E.E.C. countries participated in the EMS, although Great Britain did not apply the provisions
on exchange rates until a later date.
The EMS keystone was the newly established European Currency Unit (ECU).
The ECU represented the contents of a basket (a basket currency), in which fixed amounts of the
nine participating currencies were put. These amounts corresponded to each country’s share of
the Community’s gross national product and intra-community trade.
The exchange rates fixed on 12nd March 1979 were declared the guiding rates and, for the
purposes of the agricultural sector, “frozen”. This meant that they could only be changed
following a change of parity or the reconstitution of the basket. As from 13th March, the first
day of the EMS, the guiding rate for the DM was fixed at 2.51064, for the FF at 5.79831 and for
the NLG at 2.72077.
On the adoption of the EMS on 5th December 1978 it had been agreed that the EMS / ECU
introduction should not lead to any basic changes in the agricultural sector.
This meant in particular:
1. no change in the existing common price level (Great Britain was in favour of generally
reducing prices within the E.E.C.);
2. no changes in the existing prices fixed in national currencies;
3. no changes in the monetary compensatory amounts (as demanded by France).
The replacement of the EUA by the ECU made it once again necessary to construct a whole
series of often complicated temporary measures. These will not be detailed here. One EUA
became 1.208953 ECU. This relation of just under 1.21 corresponded to the difference between
the previous guiding rates of the “snake” currencies and the new rates (i.e. for the DM: 3.03524
: 2.51064 = 1.208953.
To put it simply, the new ECU amounts were reached by multiplying the old EUA amounts (for
prices, subsidies, compensatory amounts, etc) by the new ECU parities (DM 1.208953).
An ECU parity was also set for the USD. This was needed to set levies on a daily basis. This USD:
ECU relationship was termed the currency factor and was used to convert both c.i.f. prices and
refunds into ECU. A weak dollar automatically leads – as is still the case – to higher levies, just
as vice-versa a strong dollar results in lower levies.
Problems in this connection occurred however when, as was often the case in 1973/74 and
1974/75, the international bullish market caused the Community’s threshold prices to be

Rue du Trône 98 • B-1050 Bruxelles • Tel. +32 2/502 08 08 • Fax. +32 2/502 60 30 • E-mail: [email protected]
exceeded. Levies did not come into effect. There was no compensation for dollar fluctuations.
The system’s logic, calling for import subsidies instead of import levies, was not applied.

Rue du Trône 98 • B-1050 Bruxelles • Tel. +32 2/502 08 08 • Fax. +32 2/502 60 30 • E-mail: [email protected]
6. Grain market policy reform
With the spotlight on the above-mentioned agro-monetary developments and resolutions,
decisions relating to the grain market itself were somewhat out of focus.
The 4-day meeting of agriculture ministers in March 1976 was of special importance.
Commission proposals for reforming grain market policy were adopted. The new concept, often
represented as a silo or cathedral, was aimed at simplifying the system and improving the
workings of the market. In the light of the experiences of the past ten years, a reorganization of
the Common Grain Market was urgently required.
Reorganization was spear-headed by four measures:
1. increasing the difference between intervention and threshold prices (thereby increasing the
preference for E.C. produce);
2. improving the price relationships between the individual types of grain;
3. abolition of regionalisation in the wheat market;
4. introduction of separate intervention prices for feed wheat and bread-making wheat.
Bread-making wheat accounted for some 85% of arable land in the nine countries. Its
intervention price was 15 EUA or 13% higher than that of feed wheat, which respectively
corresponded to the intervention price for barley.
Differentiation between bread-making and feed wheat was initially achieved by a dough test
(“not sticky”). In later years, with more standardised test equipment available, it was carried out
by a baking test.
At the beginning of the 1977/78 marketing year, a reference price for baking wheat (soft wheat
of bread-making quality) was introduced. The state-purchase guarantee for such wheat was
restricted and the intervention commitment limited to the months of August until October.
Individual intervention measures (Intervention C) were to be applied for the following months
(for example involving the payment of a storage premium).
Regionalisation, i.e. basing grain prices on freight cost differentials vis-à-vis a main deficit area,
had been abolished in 1973/74 for rye, in 1974/75 for barley, and 1976/77 for wheat. The
high number of marketing centres in the 9-country E.E.C. (656 for wheat and 417 for barley) was
retained.
Fixing intervention prices according to nutritional values meant that denaturing was no longer
necessary. The Commission’s authorisation for Member States to grant denaturing premiums
(see page 25) was withdrawn as of 1st. August 1976. It should be remembered that in the first
half of the 70’s some 25 million tonnes of wheat had been denatured and channelled to the
animal feed sector. The granting of a high denaturing premium in Great Britain following
accession had been particularly absurd.
In the mid and late 70’s, changes in the external trade area were focussed on exports, which
were gaining in importance due to the rising surpluses. Export licence validity was adjusted a
number of times to reflect changing conditions on the world market. Licence validity for grain
tenders in importing third countries was raised to a maximum of eight months. In special cases
Rue du Trône 98 • B-1050 Bruxelles • Tel. +32 2/502 08 08 • Fax. +32 2/502 60 30 • E-mail: [email protected]
and when major amounts (at least 75,000 tonnes) were involved, the validity could be extended
even longer. This was aimed at facilitating exports, especially to state-trading countries.
The setting of export refunds was a subject of repeated criticism. They were set by tender every
Thursday by the Commission. The vague criteria used in their calculation (prices within the
Community and on the world market, avoidance of disruptions in the E.E.C. internal market,
economic aspects of exports) left a lot to the Community’s discretion. The focus was often on
fiscal and trade considerations, where interests of other exporting countries had to be taken into
account.
To take account of freight costs to individual export markets, refunds could be set at different
levels dependent on the destination. The international grain market with its most important
importing countries (from North Africa, the Near East, via the USSR to the People’s Republic of
China) was divided up into seven zones. For countries further away, a freight supplement could
be granted on top of the basic refund, but this was only paid out after the produce had actually
reached its destination. Proof of arrival or discharging in the destination port via suitable
customs documents was a continual cause of dispute between the Commission and COCERAL.
Export procedures were continually being improved. One measure was the calculation of
corrective amounts (premiums) on the advanced fixing of refunds (see also page 15). The
corrective amount became more and more an instrument for steering exports. By using high
corrective amounts for example, the Commission tried to put a stop to what they saw as
speculative export transactions in the final months of an export licence period.
Grain exports also took place on the basis of a refund tender. The contract was awarded to the
bidder offering the lowest refund. Most tenders were long-term, with bids being accepted on a
weekly basis.
Attention has already been drawn to the fact that in the mid 70’s, world market prices were
higher than E.E.C. levels (see page 22). This first occurred in August 1973 and led to the
Commission publishing a so-called shortage regulation. This gave it a fitting instrument to
prevent shortages on the E.E.C. internal market that might have arisen through increased
exports.
Measures included:
1. export levies;
2. the complete or partial stop to granting export licences;
3. the complete or partial rejection of licences already applied for.
Export levies already came into effect when world market prices came near to the Community’s
threshold price. They were fixed by the Commission or awarded by tender. During the different
boom periods, exports on the basis of export levies hardly took place. The E.C. Commission was
obviously focussing on ensuring supplies to the internal market. The epithet of a “caring family
father” quickly made the rounds…

Rue du Trône 98 • B-1050 Bruxelles • Tel. +32 2/502 08 08 • Fax. +32 2/502 60 30 • E-mail: [email protected]
In the early 80’s, there were three developments of importance to grain market policy:
I. the increasing surpluses;
II. the inclusion of fodder products in the Cereals Common Market Organisation;
III. the enlargement of the Community.
I - The increasing surpluses
In 1973/74 the E.E.C. had already become a net exporter. Some 2 million tonnes of soft wheat
and about 1 million tonnes of barley were exported. Mainly due to high maize imports (some 14
million tonnes), there was still a trade gap of 16 million tonnes. The picture changed
dramatically in the years up to 1980/81. The old Community with its high deficits had become,
for some observers not unexpectedly, a surplus-producing region.
There were many factors contributing to this development, the main ones being:
increasing imports of grain substitutes;
enormous gains in farm productivity;
continuing compulsory intervention;
the overvaluation of rye.
The dispute over the right rye price had long become a political issue. All proposals put forward
by the E.C. Commission for the necessary reduction of the rye price failed due to bitter
resistance – mainly from Germany. It wasn’t until 1981/82 and 1982/83 that the intervention
price for rye was reduced, in two steps, to the level of maize, barley and feed wheat. At long last,
the price differentials between the different types of cereals reflected their nutritional values.
A new instrument came into being for preventing wheat and barley surpluses: the co-
responsibility levy. In the 1981/82 marketing year, the Commission had already wanted to
involve farmers in reducing surpluses. It had been proposed that intervention prices should be
reduced by a certain percentage, should a pre-set harvest volume be exceeded. The ensuing
reduction in market prices would lead to reductions in export refunds and increase the
competitiveness of home-grown cereals vis-à-vis imported feedstuffs.
The co-responsibility levy, also in effect in a similar form for milk and sugar, came into effect in
the 1983/84 marketing year after long discussions. With the collaboration of the ten agriculture
ministers (Greece had since become a member), it had been adopted in a form much more
complicated than that originally proposed by the Commission. If the grain harvest of the 10-
member Community exceeded the production threshold of 119.5 million tonnes (the 1980 –
1982 average, excluding durum wheat and rice), then intervention prices (and the reference
price for baking wheat) would be reduced by 1% for every 1 million tonne extra (up to a
maximum of 5%) as from 1983/84. A separate production threshold was introduced for durum
wheat in 1984/85. The E.C. Commission established an interesting correlation between cereal
production and imports of feedstuffs. Should the latter exceed 15 million tonnes, the production
threshold would be increased by the same amount for the following marketing year.
A reduction of intervention prices following a bumper harvest only occurred in 1985/86. In the
following year this form of co-responsibility had already become subjected to major
modifications:
As from 1st July 1986 (the start of the marketing year had been brought back to 1 July), a new
co-responsibility levy (CRL) with direct effect was applied. It was set at 3% of the intervention
price for milling wheat (the reference price for milling wheat had been abolished in the
Rue du Trône 98 • B-1050 Bruxelles • Tel. +32 2/502 08 08 • Fax. +32 2/502 60 30 • E-mail: [email protected]
meanwhile) or 5.38 ECU per tonne for a 5-year timeframe. The levy applied to E.E.C-grown
cereals and was initially raised on processed products, exports and sales to intervention
agencies.
In the preamble to the corresponding implementation regulation it was stated that the levy was
“to make market reality clear to grain producers”. But there was already great doubt in those
days whether the co-responsibility levy with its tortuous workings had really been necessary to
achieve this.
Smallholders (farmers with max. acreage of 15 hectares and max. marketable grain production
of 25 tonnes) were exempted from the levy, as well as farmers with a max. 20 tonne
marketable production and a set-aside of at least 30% of arable land.
On top of the basic 5.38 ECU per tonne levy, an additional levy (also 5.38 ECU) was set for the
case that the re-introduced guarantee or production threshold, now set at 160 million tonnes,
should be exceeded. This guarantee threshold was valid for the following four marketing years.
In 1988/89 the levy system was once again changed: the CRL was now, as had initially been
proposed by the E.C. Commission for 1986/87, imposed at the primary point of sale – i.e. to be
carried by the producer. The primary buyer (the trader, processor, or even farmer) was legally
responsibility for the correct payment.
II - The inclusion of feedstuffs in the Cereals Common Market Organisation
At the time of the establishment of the Cereals Common Market Organisation in 1967, it had
included certain kinds of animal feed, either grain by-products (such as bran) or commodities in
direct competition with grain (such as tapioca).
The introduction of production thresholds for grain together with the co-responsibility levy also
put the E.E.C.’s up-to-then – with a few exceptions – liberal import policy for feedstuffs under
increasing pressure.
Beginning with the 1982/83 marketing year, the basic rules of the Cereals Market Organisation
were extended to cover ten further feedstuffs over and above wheat bran and tapioca. These
included maize-germ meals, corn gluten feed, citrus pellets, sliced sugar beet pallets and DDGs.
This meant the use of import licences and the associated guarantees. Import duties remained
unchanged at zero, with the exception of tapioca and bran (see page 13).
In the late 70’s tapioca imports had started increasing rapidly. After arduous discussions the
E.C. Commission concluded a cooperation agreement with the two principal supplying countries,
Thailand and Indonesia, with the main objective of curbing exports to the E.E.C.
Thailand, not a GATT member, signed a voluntary restraint agreement whereby it undertook to
restrict exports. It was accorded the following supply rights at a maximum duty of 6% of the
produce’s c.i.f. value:
Rue du Trône 98 • B-1050 Bruxelles • Tel. +32 2/502 08 08 • Fax. +32 2/502 60 30 • E-mail: [email protected]
For 1982: 5 million tonnes; for both 1983 and 1984: 5 million tonnes with the possibility of
exceeding this by 10%: for both 1985 and 1986: 4.5 million tones with the same possibility. As
was to be expected, this agreement was prolonged first till the end of 1990, then again to the
end of 1994 and finally to 1998. For each 4-year period, a total export amount of 21 million
tonnes was permitted. As production was decreasing and demand from Thailand itself, but also
from China and Indonesia, increasing, by the mid 90’s the quotas were not being fulfilled and
the agreement petered out.
As Indonesia was a member of GATT, a customs-tariff agreement was concluded. Here as well
the maximum duty was set at 6%. The permissible quantity was a lot lower, rising from 588,235
tonnes in 1982 to 970,590 tonnes in 1986. 85% of this amount was reserved for Indonesia, the
rest for other GATT member countries such as Brazil. This agreement was also renewed a
number of times, the last time for the 3-year period 1996 – 1998.
To complete the picture, it should also be mentioned that the People’s Republic of China and
Vietnam were granted an import quota (370,000 tonnes). This was not fulfilled in the first years.
China was also given a duty-free import quota for 600,000 tonnes of sweet potatoes in 1990.
III - The accession of Greece
On 1st January 1981, two years after the conclusion of negotiations, Greece became the
Community’s tenth member.
On accession, Greece’s feed grain prices were slightly higher than the Community’s. For soft and
durum wheat as well as for rye, they were more or less a lot lower. The price differences were
compensated, in a similar way to that exercised on the Community’s first enlargement, by so-
called accession compensatory amounts. As E.E.C. price levels already applied for feedstuffs as
from 1st January 1981, compensatory amounts were only fixed for wheat and rye. The transition
period during which the compensatory amounts were gradually reduced and Greek prices
brought up to E.C. levels lasted five years. As from 1st January 1986, the common E.C. prices
applied to all types of cereals in Greece as well – insofar as they were not distorted by currency
problems.
IV - The accession of Spain and Portugal
On 1st January 1986, the third enlargement of the European Community was completed. The
Common Market Regulation mechanisms came into effect in the two countries two months
later on 1st March – at least in theory. Portugal was granted the right of postponing the
introduction of the E.C. system for cereals for five years (“stand-still” agreement).
Prices for basic cereals in Spain on 1st March 1986 were – apart from durum wheat – only
marginally below E.C. levels. The transition period during which levies or compensatory amounts
were needed could therefore be kept shorter than with other accession countries. Spain was
already able to introduce E.C. price levels for soft wheat and maize in 1988/89 and for rye,
barley and sorghum one year later.
For imports of some especially sensitive products from the 10-member Community to Spain, a
7-year transition period was foreseen (lasting until the establishment of the EU Internal Market
on 1st January 1993), during which volume restrictions were in effect. As well as meat and
Rue du Trône 98 • B-1050 Bruxelles • Tel. +32 2/502 08 08 • Fax. +32 2/502 60 30 • E-mail: [email protected]
some dairy products, this applied to baking wheat. Imports were restricted in 1986 to 175,000
tonnes, rising by 15% per year until 1992.
The import quotas for maize and sorghum from third countries were much more contentious
and important. Following exceedingly arduous negotiations, the E.C. and the USA reached an
agreement that 2.3 million tonnes of maize and sorghum could be imported annually with a
greatly reduced levy. The annual imported quantities of the three feedstuffs corn gluten feed,
distillers dried grain (DDG) and citrus pellets were deducted from this amount. As these three
feedstuffs accounted for some 0.5 million tonnes of imports, the amount available for import at
reduced prices was around 1.8 million tonnes.
This agreement was implemented in three ways:
1. setting of the amount to be deducted (“abatimento”) by the Commission;
2. tendering the amount to be deducted;
3. direct purchases on the world market by the Spanish market organization agency SENPA
(via trading companies).

Rue du Trône 98 • B-1050 Bruxelles • Tel. +32 2/502 08 08 • Fax. +32 2/502 60 30 • E-mail: [email protected]
7. Fundamental reform of the Cereals Market Organisation
Following the successful reform of the milk market with the introduction of production quotas in
April 1984, discussions in the late 80’s focussed on eliminating the structural surpluses in the
grain market. The Commission started out from an annual surplus of some 40-45 million tonnes
that could not be sold – under normal conditions – on either the internal market or the world
market. Certain Member States were forced to face up to the fact that a “cautious price policy”
would not be enough to bring supply and demand into equilibrium.
Domestic consumption was sinking, and the international market was only able to absorb the
increasing and very high-priced exports to a certain extent. By the late 80’s, the E.C. had already
moved into second place in grain exports (behind the USA) with a volume of 33 – 35 million
tonnes. Disputes with the USA and other grain exporting nations increased. The state’s
unrestricted commitment to buy up produce saw intervention stocks rise to a record 33 million
tonnes in 1992. Building storage warehouses was boom business, but the financial leeway for
financing such a policy was getting tighter and tighter.
In May 1992, 25 years after the Cereals Common Market Organisation came into effect (1st July
1967), the agriculture ministers of the 12 Member States agreed on a totally new concept for
the E.C. grain market.
The primary objective of this first fundamental reform was to reduce production. This was
achieved by a mix of set-aside, extensification and price reductions. The reform packet was
flanked by a number of measures in the social and environmental sectors.
The new and radically simplified Cereals Common Market Organisation was based on
Regulation No. 1766/92. On 1st July 1993, this replaced Regulation 2727/75, which, over the
course of the previous years, had been supplemented by no less than 39 amending regulations.
The first timid attempts to introduce set-aside had started some years earlier, during the
1988/89 marketing year for a 5-year period.
There were massive start-up problems in a number of countries and by the end of the first three
years only a total of 1.7 million hectares (or 4.5%) of total arable land had been set aside,
600,000 hectares in the ex-GDR alone. Participants in the program were rewarded by having 5%
of their co-responsibility levy (CRL) waived.
In 1991/92 a much more effective one-year set-aside program was introduced, that ended up
remaining in effect until 2006/2007. Set-aside rates were changed annually. In 1991/92 the
program specified for example that at least 15% of a farm’s previous year’s arable land
(including land used for producing seed grain and silo maize, oilseeds and pulses) be set aside.
It was forbidden for set-aside land to be used either agriculturally (for example for producing
feedstuffs) or commercially (for example as a car-park).

Rue du Trône 98 • B-1050 Bruxelles • Tel. +32 2/502 08 08 • Fax. +32 2/502 60 30 • E-mail: [email protected]
Set-aside participants were initially rewarded by having the total CRL (5% or some 20 DM per
tonne) refunded. In addition there was national compensation at different levels. In Germany
these were on a sliding scale according to soil quality. On average they reached 720 DM /
hectare in the first two years.
Set-aside modalities were modified a number of times. The annual set-aside rate ranged from 5
to 17.5% depending on the market situation. The set-aside premium was regionalised to take
different soil quality into account. The calculation base was the average crop per hectare from
1986/87 to 1990/91, multiplied by a base amount set by the Commission.
A rough estimate put the average premium for the whole EU (the European Community had
become the European Union in 1993) at 317 ECU / hectare, based on an average 4.6 tonne
crop yield per hectare. Set-aside in Germany, where the average yield was 5.56 tonnes /
hectare, were compensated at an average of 383 ECU / hectare, with Schleswig-Holstein, the
region with the highest productivity, averaging 469 ECU / hectare.
Set-aside land had to be at least 0.3 hectares big and 20 metres wide. The land had to be
measured accurately, as the actual set-aside was only permitted to exceed the registered
amount by 10% or a maximum of 1 hectare.
Smallholders were exempted from having to set land aside. These were farmers with a crop not
exceeding 92 tonnes. Given the average yield of 4.6 tonnes per hectare, this meant that farms
with less than 20 hectares of arable land were exempted.
It was a major effort monitoring the set-aside program. In addition to local inspections,
photographic monitoring – by plane or satellite – was used for the first time to identify and
measure set-aside land.
In addition to the set-aside program, the reduction of cereal prices was a key element of the
reform concept. Within three years (1993/94 – 1995/96) prices were reduced by 30 – 35% and
brought into line with world market prices. This step had already been carried out for oilseeds in
the 1992/93 marketing year.
The major loss in farmers’ incomes was largely absorbed by compensatory payments per
hectare.
The land used for cultivating the “grandes cultures” was eligible for compensatory payments.
These included all types of cereals, oilseeds and pulses. The total land under such cultivation
amounted to 48.6 million hectares in 1989 – 91. This was divided up between the individual
Member States und the producing regions nominated by them. Germany was allotted 9.821
million hectares eligible for subsidies, France 13.4 million and Great Britain 5.41 million.
The compensatory amount for a farmer consisted of a basic amount (1993/94: 25 ECU per
tonne; 1994/95: 35 ECU and 1995/96, the final year of price reductions, 45 ECU) multiplied by
the regionally differentiated yield per hectare. Following the example of the set-aside premium,
the average crop of the years 1986/87 - 1990/91 was used: 4.6 tonnes / hectare. The average
compensatory payment pro hectare over all E.C. countries was: 1993/94: 115 ECU; 1994/95:
161 and 1995/96 and all subsequent years 207 ECU. The conversion of these ECU amounts
into national currencies took place on the basis of the current ECU exchange rate (the “green”
parity) at the beginning of each marketing year (1st July).
Rue du Trône 98 • B-1050 Bruxelles • Tel. +32 2/502 08 08 • Fax. +32 2/502 60 30 • E-mail: [email protected]
The crop yield per hectare figures used to calculate the individual income losses of farms varied
greatly from country to country. Therefore compensatory amounts were subject to a regional
sliding scale, corresponding to a region’s average yield.
Denmark, Greece, Ireland, Italy (with the exception of maize), Luxembourg and the Netherlands
used their national average yields as the basis. In Germany each federal state represented a
region, with the exception of Lower Saxony, which was subdivided into nine regions due to its
wide range of soil quality.
France developed its own, very complicated system to register different yields (i.e. income
losses) as equitably as possible. For each of the 95 départements an individual crop per hectare
level was determined. This was one-third based on the average yield of the whole country and
two-thirds based on the département’s average.
The main political development influencing the E.C. (post-November 1993 = EU) grain market in
the early 90’s was undoubtedly the convergence of the ex-COMECON countries with the EU.
In mid-December 1991 the first Association Agreements were signed with the then CSFR,
Poland and Hungary. Similar agreements followed a year later with Romania and Bulgaria. The
long-term objective was the establishment of a free trade zone and the abolishment of customs
duties and quotas between these six (following the split-up of the CSFR) countries and the EU.
In a 5-year transition period (lasting up to 1996/97) the EU introduced a system of gradually
decreasing levies and duties to facilitate agricultural imports while at the same time raising the
corresponding uptake quotas. Favourable treatment was focussed on imports of fruit and
vegetables, meat and cereals.
The supply rights of these countries were comparatively modest to start with. In the final year of
the first transition period (1996/97), Hungary had the right to ship 232,000 tonnes of soft
wheat at an 80% reduced levy. Among other items, the Czech Republic was permitted to deliver
31,667 tonnes of malt and 27,333 tonnes of malting barley. Slovakia had to make do with
13,667 tonnes of malting barley and 15,833 tonnes of malt. Poland was given a quota of 4,350
tonnes of buckwheat. In 1997/97 the transition period was extended till 2000/2001, the
expected year of accession. Import quotas were raised by 10 – 15% and levies remained
discounted at 80%.
With demand in general higher than the available quantities, deliveries had to be allocated.
Rue du Trône 98 • B-1050 Bruxelles • Tel. +32 2/502 08 08 • Fax. +32 2/502 60 30 • E-mail: [email protected]
8. The Uruguay Round and the Common Grain Market
With the current Doha Round, COCERAL is experiencing its fifth round of GATT / WTO
negotiations within its 50-year history. The most outstanding round was the Uruguay Round,
which will be remembered not just because of its 7-year duration. Talks began in September
1986 in Uruguay’s Punta del Este and were successfully completed in mid-December 1993 in
Brussels. The official conclusion took place in mid-April 1994 in Marrakech, Morocco, in
connection with the establishment of the World Trade Organization (WTO), GATT’s enlarged
successor.
The previous Dillon, Kennedy and Tokyo Rounds had earned accolades for pushing through a
drastic reduction in the high customs protection for industrial goods. The Uruguay Round’s
decisive step forward was the inclusion of the agricultural sector. The two main contestants
were the EU and the USA; the latter supported by the members of the Cairns Group consisting of
the major agricultural exporting countries.
The two Blair House Agreements of November 1992 and December 1993 commemorate the
major role played by Blair House, the US Government’s guesthouse in Washington, in these high-
tension talks.
The result of this negotiation, which came into effect for cereals, feedstuffs and oilseeds on 1st
July 1995, can be summarised for the cereal and feedstuff sectors as follows:
8.1. Reduction of exports
Subsidised EU grain exports were to be reduced over a six-year period (1995/96 – 2000/01)
both by cutting financial incentives (export refunds) by 36% and by reducing the volume of
exports by 21%. The reference period was set in principle to 1986 – 90. In a last-minute
compromise the EU was able to obtain recognition for 1991 and 1992 as the reference period
for wheat. In the latter period, EU wheat exports had averaged 20.3 million tonnes, in the former
just 17 million.
There were no such restrictions for non-subsidised exports, for example due to higher world
market prices or a stronger USD / ECU exchange rate. Food aid shipments were also exempted.
For the 12-member EU, the volume cutback of subsidised EU grain exports was as follows: In
1995/96, the first year of the transition period, exports of 31.3 million tonnes were permitted,
19.1 of which were to be wheat and 12.2 feed grains. This was to be reduced to just 23.4
million tonnes by 2000/01, with 13.4 million tonnes of wheat and 10 million tonnes of feed
grains.
Export volumes not used in one year could not be carried over into the following year.

Rue du Trône 98 • B-1050 Bruxelles • Tel. +32 2/502 08 08 • Fax. +32 2/502 60 30 • E-mail: [email protected]
8.2. Improved market access
Complaints, often justified, of agricultural protectionism and the closing of its markets to third
countries had accompanied E.E.C. history right from the start. It therefore came as no surprise
that improved grain market access should play a significant role in the negotiations. Imports
were to be raised from the current 3% of domestic consumption to 5% by the end of the
transition period.
The main amounts of cereals to be annually imported (either calendar year or marketing year)
were:
2.3 million tonnes of maize / sorghum to Spain
0.5 million tonnes of maize to Portugal
0.3 million tonnes of high-quality / durum wheat to the whole EU
0.475 million tonnes of bran to the whole EU.
The EU commitment was fulfilled with these 3.6 million tonnes. In general they corresponded to
previous years’ imports. In addition, there were two smaller import quotas with a reduced “levy”
(= customs duty) for oats, and – somewhat a curiosity – a quota for 30,000 tonnes of malting
barley. This favoured amount was destined for an EU-based American brewery, whose beer was
stored in beech barrels.
Improved market access also included an agreement on tarification. All measures restricting
imports (including import levies) were to be converted into fixed customs duties. Furthermore,
these were to be reduced by 36% within the 1995/96 – 2000/01 transition periods.
This involved all types of cereals not subject to intervention, such as oats, sorghum and triticale.
Following the abolition of threshold prices and the introduction of the 55% regulation in
1995/96, new import tariffs were set for the remaining cereals.
In the 1993/94 marketing year, as part of the simplification of the Cereals Common Market
Organisation, the wheat intervention price had been aligned with animal feed prices. This meant
that there was a standard price level for all types of grain. Two years later, on 1st July 1995,
import regulations were changed as part of the implementation of the GATT resolutions. The
official abolition of threshold prices (and, as a consequence, of import levies) meant that target
prices lost their significance. The threshold price was replaced by the 55% regulation created
during the Blair House talks: “the import price inclusive of all duties must not exceed the
intervention price by more than 155%”. The objective of this new regulation was to prevent any
further reduction in the standard intervention price (at that time 98 ECU per tonne) from
increasing the difference to the minimum import price (threshold price), thereby causing an
additional rise in the price of third country grain. The so-called “Community preference” (see
page10) thereby acquired a ceiling.
Levies, which had been in operation since 1962, were now replaced by the imprecise term
“import duties”, though they still remained flexible. The import duty for grain corresponded to
the difference between the 55% higher intervention price and the world market price (on a c.i.f.
Rotterdam basis).
The import duty is only published every two weeks be the EU Commission. It only has to be reset
if a difference of more than 5 ECU per tonne is calculated. This regulation is currently in use in
this form.
Another innovation with major consequences for the Cereals Market Organisation was the
abolition of the almost 40 coefficients of equivalence for soft wheat. These had been used to

Rue du Trône 98 • B-1050 Bruxelles • Tel. +32 2/502 08 08 • Fax. +32 2/502 60 30 • E-mail: [email protected]
take the different wheat qualities traded on international commodity exchanges into account,
and had been necessary for establishing a base for a single common c.i.f. price and the
associated levy (see page 13).
They were replaced on 1st July 1995 by the still valid categorisation of soft wheat into three
quality groups (low-, middle- and high-quality). For each group a single c.i.f. Rotterdam reference
price was fixed.
The customs duty to be paid by importers corresponded to the difference between one of these
three reference prices and the standardised minimum import price (155% of the intervention
price).
The sharp reduction in cereal prices in the EU in the mid-90’s (see page28) greatly alleviated the
problem of grain substitution through imported feedstuffs. In the 1990 – 92 timeframe the EU
had on average imported some 41 million tonnes of feedstuffs annually. EU/USA consultations,
as provided for in the already mentioned Blair House Agreement of December 1993 in the case
of a further increase in imports, were no longer necessary.
On1st January 1995, the fourth enlargement of the Community took place. With the accession
of Finland, Austria and Sweden, the EU now had 15 members. A referendum in Norway had
once again come out against accession, with a majority similar to 1972 (52.3%).
The three countries introduced EU price levels and the Cereals Market Organisation
mechanisms straight away. This meant that accession compensatory amounts as known from
previous accessions were not required. In the preceding years, Sweden had already reduced its
prices to EU levels. The price reductions that were necessary in Finland and Austria were
compensated by income supplements for farmers in 2-year and 5-year transition periods
respectively.
The EU grain market as a whole was not much affected by this enlargement. The focus was on
the oats market. With good harvests, Sweden and Finland both achieved surpluses of some
400,000 tonnes. This led to both countries being given the potential right to export refunds in
the Act of Accession.

Rue du Trône 98 • B-1050 Bruxelles • Tel. +32 2/502 08 08 • Fax. +32 2/502 60 30 • E-mail: [email protected]
9. Reforms within the Framework of the AGENDA 2000
The major goal of the following reform of the Common Agricultural Policy of the EU and thus
also of the Market Regulation for Grain within the framework of the Agenda 2000 had been to
freeze real agricultural expenditure for the period from 2000 to 2006 at the 1999 level of 40.5
billion Euro. After difficult negotiations, this was achieved and concluded by the government
heads of the EU in March 1999.
The resolutions adopted at the summit on arable crops which took place in Berlin under German
Presidency deviated considerably from the proposals made by the EU Commission and from the
agreement reached by the agriculture ministers one month before the summit.
The basis for the new amendment of the Market Regulation for Grain remained Regulation No.
1766/92, which, however, underwent substantial alterations due to the requirements of the
Agenda 2000. The reform aimed again first and foremost at a better market balance and an
improvement in the competitiveness of EU agriculture and, at the same time, at remaining
within the budget ceiling for agricultural expenditure of 40.5 billion Euro.
Accordingly, the intervention price for grain was cut in two equal steps by a total of 15%. It fell
from the 1998/99 and 1999/2000 level of 119.19 Euro/t to 110,25 €/t on July 1, 2000 and
then to 101.31 €/t on July 1, 2001. Since then, this intervention price of 101.31 has been valid.
The monthly increments (Reports) to the intervention price in the amount of 1 Euro were
reduced to 0.92 €/t.
This reduction of the intervention price was compensated by an increase of the compensatory
payments. As in the case of the intervention price reduction, this increase took place in two
steps, but, contrary to the reform in 1992, the price cuts were not fully compensated. In the first
step, on July 1, 2000, the compensatory payments were only increased to 58.67 €/t from the
level of 54.34 €/t that was valid in 1998/99 and 1999/2000. The second increase followed on
July 1, 2001 to 63 €/t.
Maintained was the rule, that the basic amount was to be multiplied with the regional yields.
Thus, the acreage premium climbed by 20 Euro to nearly 270 €/ha on average in the EU (yield
target 4.6 t/ha) in marketing year 2000/01. In the following marketing year 2001/02, in a
second step, a further rise by 20 Euro to an average of 290 €/ha took place.
The basic rate of the obligatory set aside was fixed at 10% for the period 2000/01 to 2006/07.
Not changed was the rule that the Agricultural Council may alter the set-aside rate when
proposed by the Commission and in accordance with actual market and price developments. As
is known, the Commission made use of this right and proposed a change for marketing year
2008/09 following the tight supply and demand situation. The instrument of voluntary set aside
remained in place. The set-aside compensation was adjusted to the basic amount of the
compensatory payments of 63 €/t. Thus, on average, it slumped in the EU from 317 €/ha
(68.83 €/t multiplied by 4.6 t/ha) in marketing year 1999/2000 to 290 €/ha (63 €/t multiplied
by 4.6 t/ha) on July 1, 2001 and further to 270 €/t (58.67 €/t multiplied by 4.6 t/ha) on July 1,
2001. In order to give farmers the possibility to better align their planting intentions with the
Rue du Trône 98 • B-1050 Bruxelles • Tel. +32 2/502 08 08 • Fax. +32 2/502 60 30 • E-mail: [email protected]
price signals coming from the market it was decided to adjust the compensatory payments for
oilseeds in three steps to those fixed for grain (63 €/t).
The border protection for cereals was adapted to the level of the intervention price, i. e. the
import threshold (155% of the intervention price) was reduced from 184.78 €/t on July 1, 1999
to 170.89 €/t on July 1, 2000 and to 157.03 €/t on July 1, 2001.
In the Agenda 2000 the EU already established the basis for the entry of the Central and
Eastern European countries into the Community. The enlargement of the EU to 25 members
was formally concluded by the European Council on December 13, 2002 in Copenhagen.
Estonia, Latvia, Lithuania, Poland, the Slovak Republic, the Czech Republic, Slovenia, Hungary
as well as Malta and Cyprus acceded to the EU on May 1, 2004. The accession countries
committed themselves to take over the legal framework governing EU agriculture. Thus also the
Market Regulation for Grain was to be applied as from May 1, 2004, but with two important
exceptions. First, the countries were exempted from the obligatory set aside as heavy political
and economic changes had led to sharp declines in the acreage after 1990 so that the
production potential had obviously not been fully exploited. Second, the new member states
were allowed to grant one and the same single compensatory payment to all farmers. A
regionalization was no option due to bad or hardly existing and available historic data but also
because of unsatisfactory control mechanisms. Nevertheless, from the day of their accession
these countries were integrated into the internal market for grain and subject to all import and
export regulations of the Market Regulation for Grain.

Rue du Trône 98 • B-1050 Bruxelles • Tel. +32 2/502 08 08 • Fax. +32 2/502 60 30 • E-mail: [email protected]
10. Fundamental Reform of the Common Agricultural Policy in 2003
The accession of the Central and Eastern European countries in May 2004 involved no
substantial increase in the EU budget. To the contrary, the budget ceiling of 40.5 billion Euro for
the agricultural sector was maintained. Thus it became clear that a further substantial reform of
the agricultural policy was inevitable.
Such fundamental reform had been agreed upon by the EU Agriculture Ministers already on
June 26, 2003, almost one year before the accession took place. A key element of this reform
was the almost total decoupling of most subsidies from the production volume. This aimed at
giving the farmers the possibility of reacting more market oriented respectively adapting their
planting intentions to the signals coming from the market. Only some limited coupled elements
were maintained which can be granted under certain defined conditions by the member states
to avoid abandonment of production. The new compensatory payments were renamed “single
farm payments” and introduced in marketing year 2004/05. For the first time the granting of
such payments was linked to the farmers’ compliance with certain standards, for example as
regards the environment or food safety (“cross-compliance”). In addition, a general reduction in
the direct payments was introduced (“modulation”) in order to finance the new rural
development policy (Second Pillar of the Common Agricultural Policy).
Also the mechanisms for financial discipline were changed of course. This applies in particular
to the milk sector but also to the Market Regulation for Grain. As Regulation No. 1766/92
already had undergone several changes over the years respectively had been adjusted to the
resolutions of the AGENDA 2000, it was replaced by the new Regulation No. 1784/2003.
The EU Commission could not force through its demand for a further reduction of the
intervention price. Thus the intervention price remained at 101.31 €/t as from July 1, 2004 - the
date at which Regulation 1784/2003 began to apply. Also the minimum import price was not
changed and remained at 157.03 €/t. The monthly increments, however, were cut by half to
0.46 Euro from 0.92 Euro per tonne and month previously, while no change was made to the
increments to be paid for the period November to May.
The intervention for rye was abolished. The last quantities of rye were offered into intervention in
marketing year 2003/04 and the member states accepted the proposal of the EU Commission
to completely abolish rye intervention. This measure was taken in order to avoid that rye was
mainly produced for offering it into intervention instead of offering it on the market, which had
more and more been the case in the years prior to the abolishment. Contrary to general fears
that the abolishment would lead to a dramatic price reduction followed by a sharp decline in the
acreage, the rye market consolidated very quickly and a new price level developed that really
reflected the actual demand.
The import and export regime was more or less not affected by the 2003 reform. A strong
influence on the market, however, had the introduction of tariff quotas for medium and low
quality wheat as from January 1, 2004. The introduction of such quotas was the reaction to the
sharply rising wheat imports of the EU, mainly from Ukraine and Russia, and aimed at
preventing the intervention stocks from rising again. Despite this, intervention stocks increased
further due to significantly growing surpluses, mainly of maize in Hungary.
Rue du Trône 98 • B-1050 Bruxelles • Tel. +32 2/502 08 08 • Fax. +32 2/502 60 30 • E-mail: [email protected]
As a result of the slump in the livestock sector and the good EU-wide grain harvest in 2004,
large quantities of maize and also of wheat were offered into intervention in Hungary, but also in
other member states. Thus the intervention stocks increased dramatically and reached more
than 14 mln tons by the end of marketing year 2005/06, a level that had not been achieved for
many years. Therefore the EU Commission made the proposal to abolish the maize intervention
which, however, did not meet with the approval of the Agricultural Council. Finally, a
compromise was found according to which the quantity of maize that can be offered into
intervention was to be reduced gradually down to zero. Thus, for marketing year 2006/07 a
maximum limit of 1.5 million tons was set which was to fall to 700,000 t in 2007/08 and then
to zero at the start of marketing year 2008/09. Due to the current market situation, however,
these limits have so far actually not been reached.
Rue du Trône 98 • B-1050 Bruxelles • Tel. +32 2/502 08 08 • Fax. +32 2/502 60 30 • E-mail: [email protected]
11. Outlook - A Single Common Market Regulation, WTO Round and Health
Check
The reform of the Market Regulation for Grain is not yet finished. Additional amendments in
connection with the introduction of one single Common Market Regulation for all agricultural
products, the current DOHA Round negotiations of the WTO and the Health Check discussions
will lead to further changes.
The most important impact will in all probability have the WTO negotiations and the already
concluded elimination of all export subsidies. This will make grain exports out of EU intervention
much more difficult in future. The EU Commission has already taken account of this and has
demanded within the framework of its propositions for the Health Check to phase out also the
intervention for barley and sorghum to zero. Only the intervention for bread wheat should
remain in place - with certain possible changes. It is planned to replace the procedure of grain
being offered into intervention and then being accepted by the intervention agencies by a tender
system. Thus the system that is already valid for all other market regulations within the EU will
also become applicable to the grain intervention. However, this would mean that the principle of
one uniform wheat intervention price for all member states must be given up as the tenders will
be invited on a regional basis. Consequently, the EU Commission considers to replace the
intervention price by a reference price although a further reduction of the current price level of
101.31 €/t is not required.
In light of the changed market conditions, the EU Commission also proposed the permanent
abolition of the mandatory set-aside requirement.
The decision to cut the maize intervention quantity to zero until 2008/09 obliges the EU
Commission at the same time to introduce a new import system. How this system will look like,
is not yet clear (at the beginning May 2008), but it seems likely that the up to now valid system
of variable import duties that depend on the world market prices will be replaced by a
combination of fixed import duties and tariff quotas (without any tariff burden). Such system
may probably already be introduced at the beginning of marketing year 2009/10.
…/…

Rue du Trône 98 • B-1050 Bruxelles • Tel. +32 2/502 08 08 • Fax. +32 2/502 60 30 • E-mail: [email protected]
APPENDIX 1A: EU Grain Production 1961 to 2007
Wheat, Durum & Barley
area 1,000 ha
yield 100kg/ha
production 1,000 t area yield
production area yield
production area yield
production
EU-6 1961 9 043 24,8 22 457 1 428 12,3 1 759 4 262 23,9 10 173
1962 9 794 29,8 29 193 1 438 12,2 1 754 4 136 29,4 12 150
1963 9 002 26,6 23 947 1 398 13,7 1 915 4 555 29,2 13 315
1964 9 706 30,0 29 114 1 361 11,2 1 523 4 398 30,4 13 364
1965 9 810 30,8 30 247 1 308 15,6 2 040 4 562 29,8 13 602
1966 9 187 28,5 26 159 1 334 13,5 1 802 4 922 28,5 14 008
1967 8 821 34,7 30 581 1 442 19,4 2 794 5 134 35,0 17 946
1968 9 204 35,2 32 361 1 575 15,4 2 433 5 157 33,9 17 504
1969 9 028 33,8 30 510 1 652 18,3 3 024 5 332 33,6 17 941
1970 8 519 33,5 28 530 1 752 17,9 3 134 5 524 29,1 16 053
1971 8 616 38,1 32 843 1 776 21,4 3 794 5 290 34,9 18 439
1972 8 696 40,2 34 955 1 754 20,1 3 523 5 279 38,8 20 478
EU-9 1973 9 852 41,8 41 161 1 677 18,2 3 043 9 588 39,0 37 370
1974 10 217 44,1 45 047 1 740 19,4 3 384 9 522 40,2 38 268
1975 9 323 39,1 36 483 1 835 23,0 4 214 9 964 36,3 36 135
1976 10 084 38,0 38 295 1 879 18,8 3 534 9 891 33,8 33 477
1977 9 424 41,5 39 079 1 372 16,3 2 243 10 470 39,5 41 374
1978 9 923 47,3 46 966 1 767 21,4 3 779 10 584 41,4 43 783
1979 9 992 45,9 45 838 1 762 21,1 3 724 10 598 40,1 42 497
1980 10 516 48,8 51 293 1 829 22,3 4 082 10 444 42,7 44 591
EU-10 1981 11 294 46,8 52 835 2 081 22,0 4 578 10 655 40,4 42 999
1982 11 486 51,0 58 601 2 123 19,3 4 092 10 282 44,2 45 437
1983 11 729 50,3 58 944 2 171 18,5 4 020 9 769 41,1 40 152
1984 12 073 61,2 73 926 2 249 27,0 6 080 9 470 51,1 48 371
1985 11 389 56,2 64 042 2 338 23,0 5 371 9 387 47,9 44 960
EU-12 1986 13 706 50,4 69 133 2 760 25,7 7 092 13 554 37,7 51 092
1987 13 781 49,5 68 174 2 829 26,6 7 529 13 115 39,2 51 353
1988 13 484 53,0 71 523 2 717 25,5 6 918 13 064 41,6 54 343
1989 14 189 53,7 76 232 2 811 23,3 6 541 12 618 40,7 51 299
1990 13 540 57,0 77 198 2 986 24,9 7 434 12 222 41,2 50 387
1991 13 351 59,4 79 367 3 387 33,5 11 343 12 063 42,6 51 380
1992 13 504 56,1 75 813 3 244 27,9 9 046 11 510 37,5 43 212
1993 12 294 60,1 73 881 2 891 24,0 6 934 10 177 42,1 42 877
1994 12 243 60,9 74 553 3 038 27,0 8 206 9 695 40,1 38 864
EU-15 1995 13 411 60,1 80 600 3 147 22,5 7 086 10 988 39,5 43 418
1996 13 750 63,6 87 421 3 189 27,4 8 744 11 434 46,1 52 665
1997 14 062 62,2 87 523 3 248 22,7 7 373 11 853 44,2 52 370
1998 14 020 67,4 94 453 3 229 29,2 9 435 11 362 45,4 51 556
1999 13 520 66,0 89 173 3 615 23,5 8 483 10 858 44,9 48 723
2000 14 235 67,1 95 532 3 705 26,0 9 650 10 680 48,1 51 364
2001 12 977 64,1 83 157 3 768 22,5 8 483 10 743 44,8 48 083
2002 14 052 67,1 94 275 3 963 24,9 9 858 10 518 45,6 47 989
2003 13 311 61,6 81 969 3 854 22,5 8 669 10 549 44,2 46 601
EU-25 2004 19 433 64,1 124 539 3 802 29,3 11 156 13 104 47,2 61 831
2005 19 304 59,6 115 097 3 258 22,9 7 476 13 120 40,4 53 062
2006 18 976 57,4 108 939 2 856 27,7 7 902 13 334 41,3 55 036
EU-27 2007 21 407 52,2 111 666 2 727 27,3 7 435 13 706 42,0 57 586 1 Rye, Oats, Sorghum, Mixed Grains, Triticale
Source: Eurostat, FAO, Toepfer
Wheat excl. Durum Durum Barley
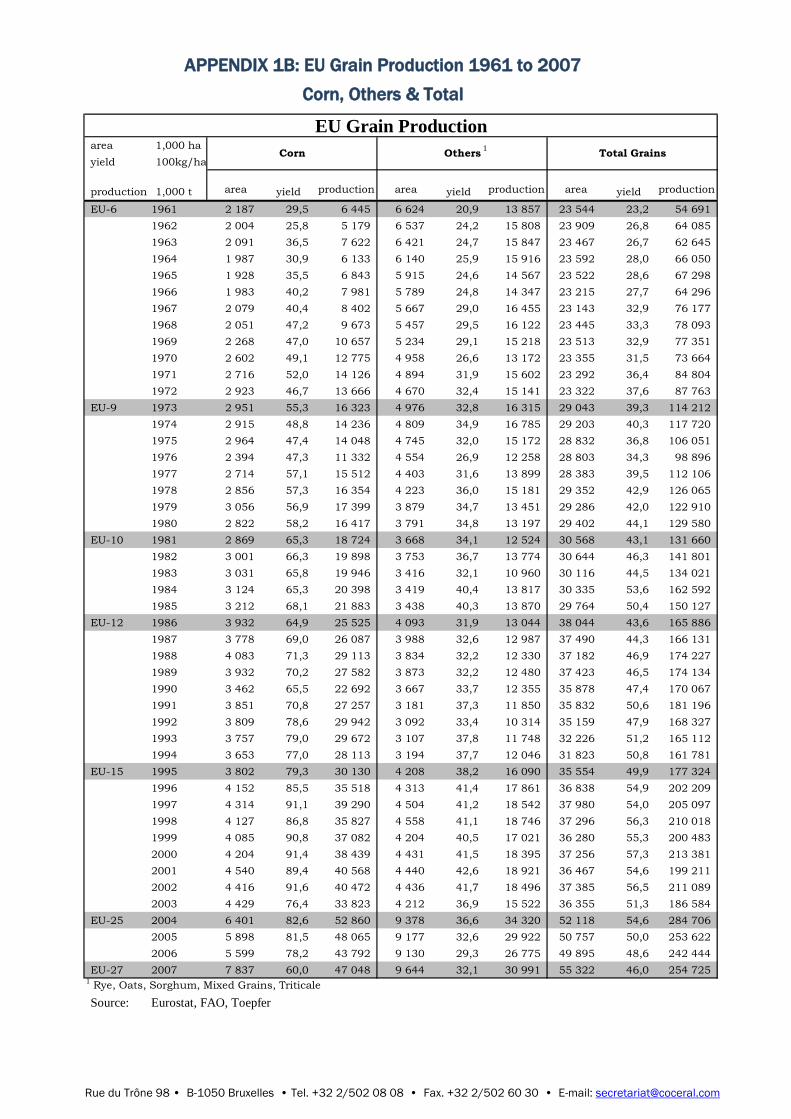
Rue du Trône 98 • B-1050 Bruxelles • Tel. +32 2/502 08 08 • Fax. +32 2/502 60 30 • E-mail: [email protected]
APPENDIX 1B: EU Grain Production 1961 to 2007
Corn, Others & Total
area 1,000 ha
yield 100kg/ha
production 1,000 t area yield
production area yield
production area yield
production
EU-6 1961 2 187 29,5 6 445 6 624 20,9 13 857 23 544 23,2 54 691
1962 2 004 25,8 5 179 6 537 24,2 15 808 23 909 26,8 64 085
1963 2 091 36,5 7 622 6 421 24,7 15 847 23 467 26,7 62 645
1964 1 987 30,9 6 133 6 140 25,9 15 916 23 592 28,0 66 050
1965 1 928 35,5 6 843 5 915 24,6 14 567 23 522 28,6 67 298
1966 1 983 40,2 7 981 5 789 24,8 14 347 23 215 27,7 64 296
1967 2 079 40,4 8 402 5 667 29,0 16 455 23 143 32,9 76 177
1968 2 051 47,2 9 673 5 457 29,5 16 122 23 445 33,3 78 093
1969 2 268 47,0 10 657 5 234 29,1 15 218 23 513 32,9 77 351
1970 2 602 49,1 12 775 4 958 26,6 13 172 23 355 31,5 73 664
1971 2 716 52,0 14 126 4 894 31,9 15 602 23 292 36,4 84 804
1972 2 923 46,7 13 666 4 670 32,4 15 141 23 322 37,6 87 763
EU-9 1973 2 951 55,3 16 323 4 976 32,8 16 315 29 043 39,3 114 212
1974 2 915 48,8 14 236 4 809 34,9 16 785 29 203 40,3 117 720
1975 2 964 47,4 14 048 4 745 32,0 15 172 28 832 36,8 106 051
1976 2 394 47,3 11 332 4 554 26,9 12 258 28 803 34,3 98 896
1977 2 714 57,1 15 512 4 403 31,6 13 899 28 383 39,5 112 106
1978 2 856 57,3 16 354 4 223 36,0 15 181 29 352 42,9 126 065
1979 3 056 56,9 17 399 3 879 34,7 13 451 29 286 42,0 122 910
1980 2 822 58,2 16 417 3 791 34,8 13 197 29 402 44,1 129 580
EU-10 1981 2 869 65,3 18 724 3 668 34,1 12 524 30 568 43,1 131 660
1982 3 001 66,3 19 898 3 753 36,7 13 774 30 644 46,3 141 801
1983 3 031 65,8 19 946 3 416 32,1 10 960 30 116 44,5 134 021
1984 3 124 65,3 20 398 3 419 40,4 13 817 30 335 53,6 162 592
1985 3 212 68,1 21 883 3 438 40,3 13 870 29 764 50,4 150 127
EU-12 1986 3 932 64,9 25 525 4 093 31,9 13 044 38 044 43,6 165 886
1987 3 778 69,0 26 087 3 988 32,6 12 987 37 490 44,3 166 131
1988 4 083 71,3 29 113 3 834 32,2 12 330 37 182 46,9 174 227
1989 3 932 70,2 27 582 3 873 32,2 12 480 37 423 46,5 174 134
1990 3 462 65,5 22 692 3 667 33,7 12 355 35 878 47,4 170 067
1991 3 851 70,8 27 257 3 181 37,3 11 850 35 832 50,6 181 196
1992 3 809 78,6 29 942 3 092 33,4 10 314 35 159 47,9 168 327
1993 3 757 79,0 29 672 3 107 37,8 11 748 32 226 51,2 165 112
1994 3 653 77,0 28 113 3 194 37,7 12 046 31 823 50,8 161 781
EU-15 1995 3 802 79,3 30 130 4 208 38,2 16 090 35 554 49,9 177 324
1996 4 152 85,5 35 518 4 313 41,4 17 861 36 838 54,9 202 209
1997 4 314 91,1 39 290 4 504 41,2 18 542 37 980 54,0 205 097
1998 4 127 86,8 35 827 4 558 41,1 18 746 37 296 56,3 210 018
1999 4 085 90,8 37 082 4 204 40,5 17 021 36 280 55,3 200 483
2000 4 204 91,4 38 439 4 431 41,5 18 395 37 256 57,3 213 381
2001 4 540 89,4 40 568 4 440 42,6 18 921 36 467 54,6 199 211
2002 4 416 91,6 40 472 4 436 41,7 18 496 37 385 56,5 211 089
2003 4 429 76,4 33 823 4 212 36,9 15 522 36 355 51,3 186 584
EU-25 2004 6 401 82,6 52 860 9 378 36,6 34 320 52 118 54,6 284 706
2005 5 898 81,5 48 065 9 177 32,6 29 922 50 757 50,0 253 622
2006 5 599 78,2 43 792 9 130 29,3 26 775 49 895 48,6 242 444
EU-27 2007 7 837 60,0 47 048 9 644 32,1 30 991 55 322 46,0 254 725 1 Rye, Oats, Sorghum, Mixed Grains, Triticale
Source: Eurostat, FAO, Toepfer
EU Grain Production
Corn Others Total Grains1
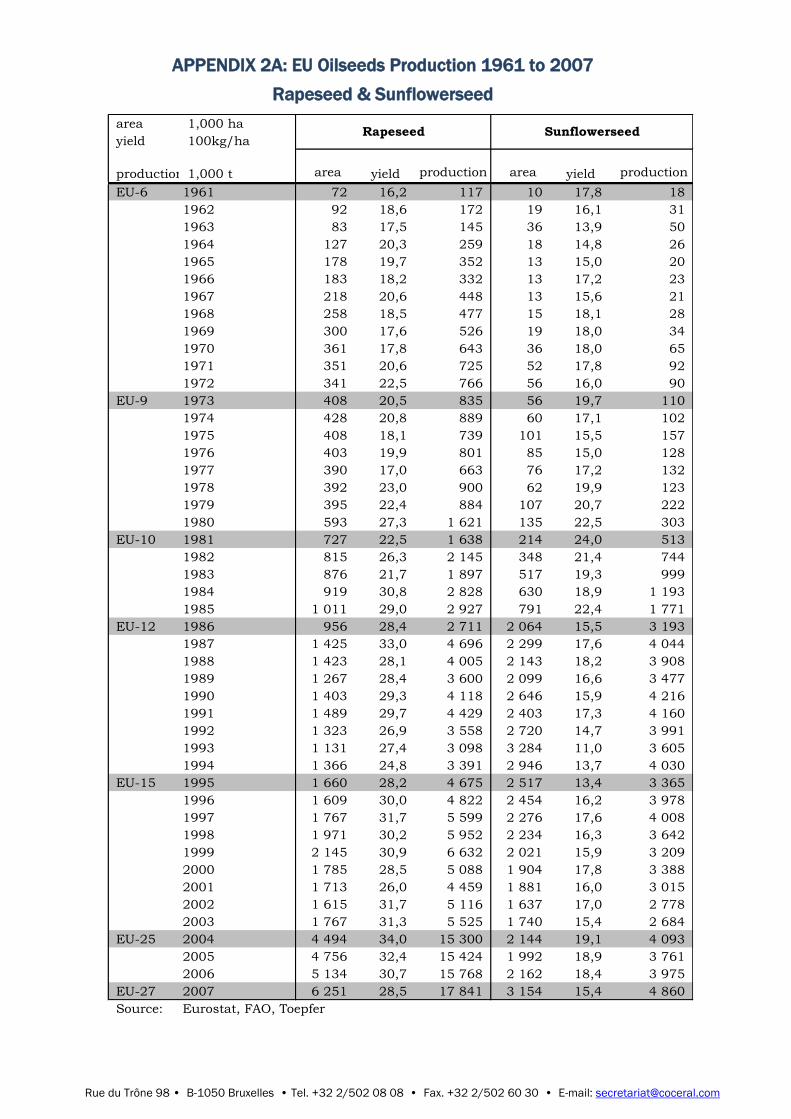
Rue du Trône 98 • B-1050 Bruxelles • Tel. +32 2/502 08 08 • Fax. +32 2/502 60 30 • E-mail: [email protected]
APPENDIX 2A: EU Oilseeds Production 1961 to 2007
Rapeseed & Sunflowerseed
area 1,000 ha
yield 100kg/ha
production 1,000 t area yield
production area yield production
EU-6 1961 72 16,2 117 10 17,8 18
1962 92 18,6 172 19 16,1 31
1963 83 17,5 145 36 13,9 50
1964 127 20,3 259 18 14,8 26
1965 178 19,7 352 13 15,0 20
1966 183 18,2 332 13 17,2 23
1967 218 20,6 448 13 15,6 21
1968 258 18,5 477 15 18,1 28
1969 300 17,6 526 19 18,0 34
1970 361 17,8 643 36 18,0 65
1971 351 20,6 725 52 17,8 92
1972 341 22,5 766 56 16,0 90
EU-9 1973 408 20,5 835 56 19,7 110
1974 428 20,8 889 60 17,1 102
1975 408 18,1 739 101 15,5 157
1976 403 19,9 801 85 15,0 128
1977 390 17,0 663 76 17,2 132
1978 392 23,0 900 62 19,9 123
1979 395 22,4 884 107 20,7 222
1980 593 27,3 1 621 135 22,5 303
EU-10 1981 727 22,5 1 638 214 24,0 513
1982 815 26,3 2 145 348 21,4 744
1983 876 21,7 1 897 517 19,3 999
1984 919 30,8 2 828 630 18,9 1 193
1985 1 011 29,0 2 927 791 22,4 1 771
EU-12 1986 956 28,4 2 711 2 064 15,5 3 193
1987 1 425 33,0 4 696 2 299 17,6 4 044
1988 1 423 28,1 4 005 2 143 18,2 3 908
1989 1 267 28,4 3 600 2 099 16,6 3 477
1990 1 403 29,3 4 118 2 646 15,9 4 216
1991 1 489 29,7 4 429 2 403 17,3 4 160
1992 1 323 26,9 3 558 2 720 14,7 3 991
1993 1 131 27,4 3 098 3 284 11,0 3 605
1994 1 366 24,8 3 391 2 946 13,7 4 030
EU-15 1995 1 660 28,2 4 675 2 517 13,4 3 365
1996 1 609 30,0 4 822 2 454 16,2 3 978
1997 1 767 31,7 5 599 2 276 17,6 4 008
1998 1 971 30,2 5 952 2 234 16,3 3 642
1999 2 145 30,9 6 632 2 021 15,9 3 209
2000 1 785 28,5 5 088 1 904 17,8 3 388
2001 1 713 26,0 4 459 1 881 16,0 3 015
2002 1 615 31,7 5 116 1 637 17,0 2 778
2003 1 767 31,3 5 525 1 740 15,4 2 684
EU-25 2004 4 494 34,0 15 300 2 144 19,1 4 093
2005 4 756 32,4 15 424 1 992 18,9 3 761
2006 5 134 30,7 15 768 2 162 18,4 3 975
EU-27 2007 6 251 28,5 17 841 3 154 15,4 4 860
Source: Eurostat, FAO, Toepfer
Rapeseed Sunflowerseed
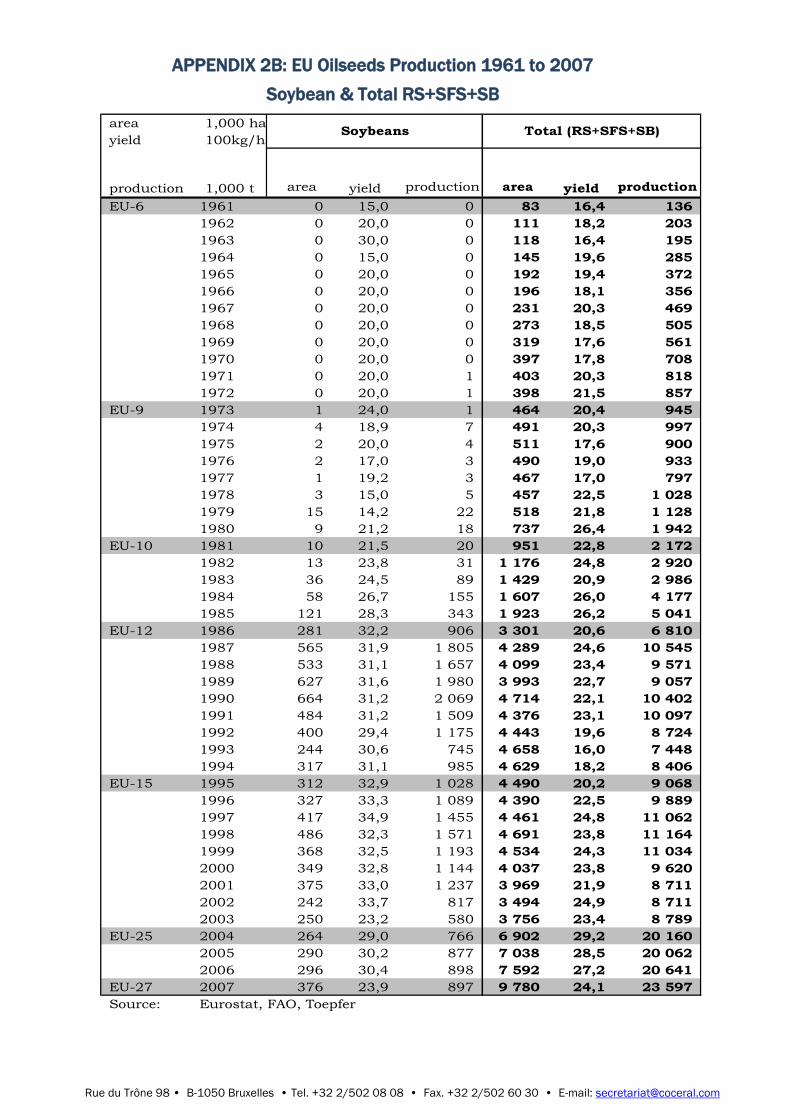
Rue du Trône 98 • B-1050 Bruxelles • Tel. +32 2/502 08 08 • Fax. +32 2/502 60 30 • E-mail: [email protected]
APPENDIX 2B: EU Oilseeds Production 1961 to 2007
Soybean & Total RS+SFS+SB
area 1,000 ha
yield 100kg/ha
production 1,000 t area yield production area yield
production
EU-6 1961 0 15,0 0 83 16,4 136
1962 0 20,0 0 111 18,2 203
1963 0 30,0 0 118 16,4 195
1964 0 15,0 0 145 19,6 285
1965 0 20,0 0 192 19,4 372
1966 0 20,0 0 196 18,1 356
1967 0 20,0 0 231 20,3 469
1968 0 20,0 0 273 18,5 505
1969 0 20,0 0 319 17,6 561
1970 0 20,0 0 397 17,8 708
1971 0 20,0 1 403 20,3 818
1972 0 20,0 1 398 21,5 857
EU-9 1973 1 24,0 1 464 20,4 945
1974 4 18,9 7 491 20,3 997
1975 2 20,0 4 511 17,6 900
1976 2 17,0 3 490 19,0 933
1977 1 19,2 3 467 17,0 797
1978 3 15,0 5 457 22,5 1 028
1979 15 14,2 22 518 21,8 1 128
1980 9 21,2 18 737 26,4 1 942
EU-10 1981 10 21,5 20 951 22,8 2 172
1982 13 23,8 31 1 176 24,8 2 920
1983 36 24,5 89 1 429 20,9 2 986
1984 58 26,7 155 1 607 26,0 4 177
1985 121 28,3 343 1 923 26,2 5 041
EU-12 1986 281 32,2 906 3 301 20,6 6 810
1987 565 31,9 1 805 4 289 24,6 10 545
1988 533 31,1 1 657 4 099 23,4 9 571
1989 627 31,6 1 980 3 993 22,7 9 057
1990 664 31,2 2 069 4 714 22,1 10 402
1991 484 31,2 1 509 4 376 23,1 10 097
1992 400 29,4 1 175 4 443 19,6 8 724
1993 244 30,6 745 4 658 16,0 7 448
1994 317 31,1 985 4 629 18,2 8 406
EU-15 1995 312 32,9 1 028 4 490 20,2 9 068
1996 327 33,3 1 089 4 390 22,5 9 889
1997 417 34,9 1 455 4 461 24,8 11 062
1998 486 32,3 1 571 4 691 23,8 11 164
1999 368 32,5 1 193 4 534 24,3 11 034
2000 349 32,8 1 144 4 037 23,8 9 620
2001 375 33,0 1 237 3 969 21,9 8 711
2002 242 33,7 817 3 494 24,9 8 711
2003 250 23,2 580 3 756 23,4 8 789
EU-25 2004 264 29,0 766 6 902 29,2 20 160
2005 290 30,2 877 7 038 28,5 20 062
2006 296 30,4 898 7 592 27,2 20 641
EU-27 2007 376 23,9 897 9 780 24,1 23 597
Source: Eurostat, FAO, Toepfer
Soybeans Total (RS+SFS+SB)
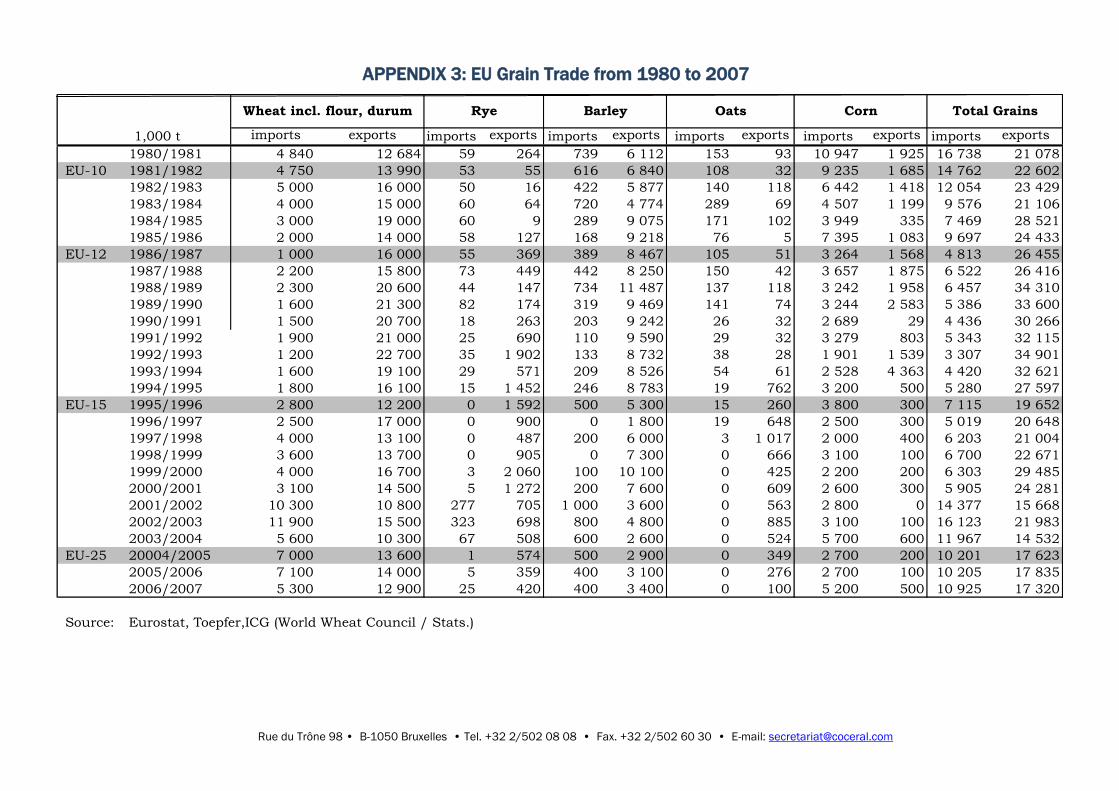
Rue du Trône 98 • B-1050 Bruxelles • Tel. +32 2/502 08 08 • Fax. +32 2/502 60 30 • E-mail: [email protected]
APPENDIX 3: EU Grain Trade from 1980 to 2007
1,000 t imports exports imports exports imports exports imports exports imports exports imports exports
1980/1981 4 840 12 684 59 264 739 6 112 153 93 10 947 1 925 16 738 21 078
EU-10 1981/1982 4 750 13 990 53 55 616 6 840 108 32 9 235 1 685 14 762 22 602
1982/1983 5 000 16 000 50 16 422 5 877 140 118 6 442 1 418 12 054 23 429
1983/1984 4 000 15 000 60 64 720 4 774 289 69 4 507 1 199 9 576 21 106
1984/1985 3 000 19 000 60 9 289 9 075 171 102 3 949 335 7 469 28 521
1985/1986 2 000 14 000 58 127 168 9 218 76 5 7 395 1 083 9 697 24 433
EU-12 1986/1987 1 000 16 000 55 369 389 8 467 105 51 3 264 1 568 4 813 26 455
1987/1988 2 200 15 800 73 449 442 8 250 150 42 3 657 1 875 6 522 26 416
1988/1989 2 300 20 600 44 147 734 11 487 137 118 3 242 1 958 6 457 34 310
1989/1990 1 600 21 300 82 174 319 9 469 141 74 3 244 2 583 5 386 33 600
1990/1991 1 500 20 700 18 263 203 9 242 26 32 2 689 29 4 436 30 266
1991/1992 1 900 21 000 25 690 110 9 590 29 32 3 279 803 5 343 32 115
1992/1993 1 200 22 700 35 1 902 133 8 732 38 28 1 901 1 539 3 307 34 901
1993/1994 1 600 19 100 29 571 209 8 526 54 61 2 528 4 363 4 420 32 621
1994/1995 1 800 16 100 15 1 452 246 8 783 19 762 3 200 500 5 280 27 597
EU-15 1995/1996 2 800 12 200 0 1 592 500 5 300 15 260 3 800 300 7 115 19 652
1996/1997 2 500 17 000 0 900 0 1 800 19 648 2 500 300 5 019 20 648
1997/1998 4 000 13 100 0 487 200 6 000 3 1 017 2 000 400 6 203 21 004
1998/1999 3 600 13 700 0 905 0 7 300 0 666 3 100 100 6 700 22 671
1999/2000 4 000 16 700 3 2 060 100 10 100 0 425 2 200 200 6 303 29 485
2000/2001 3 100 14 500 5 1 272 200 7 600 0 609 2 600 300 5 905 24 281
2001/2002 10 300 10 800 277 705 1 000 3 600 0 563 2 800 0 14 377 15 668
2002/2003 11 900 15 500 323 698 800 4 800 0 885 3 100 100 16 123 21 983
2003/2004 5 600 10 300 67 508 600 2 600 0 524 5 700 600 11 967 14 532
EU-25 20004/2005 7 000 13 600 1 574 500 2 900 0 349 2 700 200 10 201 17 623
2005/2006 7 100 14 000 5 359 400 3 100 0 276 2 700 100 10 205 17 835
2006/2007 5 300 12 900 25 420 400 3 400 0 100 5 200 500 10 925 17 320
Source: Eurostat, Toepfer,ICG (World Wheat Council / Stats.)
Wheat incl. flour, durum Rye Barley Corn Total GrainsOats

Rue du Trône 98 • B-1050 Bruxelles • Tel. +32 2/502 08 08 • Fax. +32 2/502 60 30 • E-mail: [email protected]
APPENDIX 4: EU Oilseed Trade from 1988 to 2006
1,000 t imports exports imports exports imports exports imports exports
1988/1989 2 402 1 837 1 574 1 511 11 161 239 15 137 3 587
1989/1990 2 299 1 643 1 551 1 167 13 982 321 17 832 3 130
1990/1991 2 077 188 1 488 1 073 13 056 491 16 621 1 752
1991/1992 2 314 2 053 1 841 1 222 14 147 406 18 302 3 680
1992/1993 1 768 2 021 1 546 65 14 967 327 18 281 2 413
1993/1994 2 350 1 877 1 601 25 13 600 307 17 551 2 209
1994/1995 1 395 72 1 743 121 16 070 46 19 208 239
EU-15 1995/1996 811 317 2 386 45 14 314 26 17 511 387
1996/1997 363 506 2 323 105 15 349 37 18 035 648
1997/1998 317 692 2 020 104 16 538 88 18 876 885
1998/1999 1 063 1 329 2 693 45 16 050 62 19 806 1 436
1999/2000 755 1 700 2 104 34 16 049 64 18 908 1 797
2000/2001 454 528 1 727 24 17 351 44 19 532 596
2001/2002 207 631 856 51 18 134 34 19 197 716
2002/2003 53 453 1 007 32 16 103 21 17 163 507
2003/2004 250 85 1 474 48 15 344 31 17 067 164
EU-25 20004/2005 161 289 754 109 15 443 104 16 358 503
2005/2006 520 103 1 727 52 13 700 126 15 947 280
Source: World Oil Annual
Rapeseed Sunflowerseed Soybeans Total Three