grandstanding in the venture capital industry: new...
TRANSCRIPT

1
Grandstanding in the venture capital industry: new evidence from IPOs and
M&As
Salma Ben Amor* and Maher Kooli**
Abstract
We provide new evidence on the grandstanding hypothesis by considering initial public offerings (IPOs) as well as mergers and acquisitions (M&As) exits for venture capital (VC) firms from 1995 to 2015. After correction for selection bias, we find that an exit strategy by acquisition has the same importance as an IPO in explaining incentives of young venture capital firms to grandstand. There is, however, no evidence that young VC firms exit companies closer to the next follow-on fund than older VCs. Our results show that, to build their reputation, young VC firms are willing to bear the cost of higher underpricing in the case of IPO exits and to accept a lower premium in the case of M&A exits. We also find that the presence of reputed VC affects significantly the probability of an IPO exit over an acquisition exit.
JEL: G32, G34 Keywords: Initial public offerings, M&A, Venture Capital, Grandstanding
* Professor of finance at the Université du Québec en Outaouais - Campus Saint Jerôme, 5 Rue Saint-Joseph,
Saint-Jérôme, Québec, CANADA J7Z 0B7; Tel: +1 450.530.7616, ext. 4116; Email: [email protected] ** Professor of finance at the School of Management, CDPQ Research Chair in Portfolio Management,
Université du Québec à Montréal, Department of Finance. Corresponding author, 315 Rue Sainte-Catherine
Est, Montréal, Québec, CANADA H2X 3X2, Tel: +1 514.987.3000, ext. 2082, Fax: +1 514.987.0422, Email: [email protected] We gratefully acknowledge the financial support of the CDPQ Research Chair in Portfolio Management of the School of Management (UQAM). We are responsible for any remaining errors.

2
1. Introduction
Experience and reputation are important factors in raising capital, especially for venture
capital firms. A common concern of venture capitalists (VCs) is the need to deliver positive
returns to maintain existing limited partners, to attract new investors, and to raise new
funds. Prior research considers that the common indicator of VC firm reputation is its IPO
success. Lerner (1994) and Gompers (1995) document that venture capital-backed
companies yield the highest return for venture investors when they go public. Nahata
(2008) finds that firms backed by more reputable VCs are more likely to exit successfully
and can access public markets more quickly. Studies that infer the quality of the venture
from the number of firms brought public, however, do not consider the case of M&As as
an exit channel. Gompers (1996) argues that the most effective way for young venture
capitalists to signal their ability to potential investors is to bring one of the portfolio
companies public in an IPO. According to Gompers (1996), young VCs have a strong
reason to grandstand by bringing firms public earlier than older VCs to establish a
reputation and raise capital for new funds. Lee and Wahal (2004) confirm the
grandstanding hypothesis and find that VC firms are willing to bear the cost of
underpricing when they take a company public to establish their reputation and raise more
funds in the future. Butler and Goktan (2013) examine VC backed IPOs and the role of
inexperienced VCs and find that young VC firms have a comparative advantage at
producing “soft information” about relatively opaque start-up companies.1 They conclude
that the need for soft information production could be an explanation to why start-up
companies would have a demand for young VC firms that are likely to grandstand.
Although an IPO is an attractive exit mechanism to realize returns, VC firms also have
the alternative of cashing out via an acquisition, a merger, or a trade sale. The appeal of
M&As has become popular over the past decade. According to the National Venture
Capital Association (NVCA) 2016 Yearbook, there were more exits by VCs through
1 According to Butler and Goktan (2013), the term “soft information” represents the type of information that VC firms generate about their portfolio companies through the use of their own network.

3
acquisitions than via IPOs for the period between 1985 and 2015 (see Figure 1).
Furthermore, acquisitions of venture-backed firms with disclosed values accounted, on
average, for $25.43 billion between 2004 and 2014, while IPOs of venture-backed firms
accounted for $10.25 billion. This decline in venture-backed IPOs is in line with an overall
decline in the IPO market. For instance, Gao, Ritter, and Zhu (2013) report that in the
U.S., the average of IPOs per year dropped from 310 IPOs per year during 1980-2000 to
only 99 IPOs per year during 2001-2012. Doidge, Karolyi, and Stulz (2013) confirm that
compared to other countries, the rate of small-firm IPO activity in the U.S. was low in the
2000s. Furthermore, Bayar and Chemmanur (2011) and Bayar and Chemmanur (2012)
confirm that an IPO is not always the best way to exit and that over the last decade, a
privately held firm was much more likely to have been acquired than to go public. Masulis
and Nahata (2011, p. 398) point out that “ (…), while IPOs are generally viewed as the
most profitable VC exit, acquisitions can also be very profitable, and can be the only
profitable exits in periods when the IPO market is weak or effectively closed.” The popular
press also highlighted many examples of the preference for M&As over IPOs as an exit
route for venture-backed firms. For example, “Forget IPOs, firms want to get bought”
(Wall Street Journal, November 2015, p. C1),2 and “Forget IPO. The new goal? Get
acquired” (Inc., September 2012).3 According to Bayar and Chemmanur (2011), the
upward trend in M&As exits indicates that the costs to private firms to go public via IPO
rather than to get acquired have risen significantly in recent years. Giving these key
changes and the importance of the exit decision to entrepreneurs and VCs, it is interesting
to further our understanding on the role of VC reputation and to examine whether young
VCs need to successfully sell privately held firms earlier than older VCs to establish a
2 “Forget Going Public, U.S. Companies Want to Get Bought (Wall Street Journal, November. 29, 2015) http://www.wsj.com/articles/forget-going-public-u-s-companies-want-to-get-bought-1448793190 3 Forget IPO. The new goal? Get acquired” (Inc., September 2012) http://www.inc.com/eric-markowitz/forget-ipo-the-new-goal-get-acquired.html

4
reputation. It is also interesting to examine if VC reputation affects the exit choice between
IPOs and acquisitions.
To answer these questions, we collect data on U.S. venture capital exits by IPOs and
M&As between 1995 and 2015. Empirical tests for a sample of 609 venture-backed IPOs
and 830 venture-backed M&As support grandstanding predictions. Specifically, our results
show that younger VC firms have strong incentives to exit earlier than older VC firms
through IPOs as well as M&As. We also find that the flow of capital into the lead VC
firm is positively related to the VC age and the number of IPOs or M&As done by the
VC firm. This result indicates that each additional successful exit attracts more capital
for a young VC firm than for a well-established VC firm.
Our study contributes to the existing literature on how young VC firms grandstand in
several ways and the importance of VC reputation.4 First, previous work focuses mainly
on IPOs. However, IPOs occur in about 10% of VC investments as an exit route, whereas
M&As occur approximately in about 20%. Further, as noted by Nahata (2008, p. 141)
“Although the ‘going public’ decision has been extensively studied both theoretically and
empirically, limited research exists on the acquisitions of private firms, particularly those
that are VC-backed.” Masulis and Nahata (2011) also note that an analysis on VC backed
acquisitions is lacking. In this study, we aim to fill this gap in the literature by examining
the grandstanding hypothesis using both U.S. IPOs and M&As.
Second, Gompers (1996), considers an IPO sample between 1978 and 1987 and finds that
young VC firms raise capital significantly sooner after the date of the IPO. The behavior
of young VCs, however, could be due to the quality of the privately held companies they
are financing rather than to their reputation. To address endogeneity concerns, we use
Heckman's (1979) correction procedure on a large dataset that covers the 1995-2015 period
and includes IPOs as well as M&As. We find that venture-backed acquisitions should be
of the same importance as venture-backed IPOs in explaining the grandstanding of young
4 Our study also complements Nahata and Krishnan et al. (2011). Nahata (2008) focuses on VC reputation and investment performance, while Krishnan et al. (2011) focus on VC reputation and post-IPO long run performance.

5
venture capitalists. We also add nuance to Gompers (1996)’s finding that young VC firms
will raise future capital sooner than old venture firms. Using a Cox hazard analysis to
control for the time between the IPO or the M&A exit and the next follow-on fund, we
find that more experienced venture capitalists raise capital sooner after a successful exit
by IPO or acquisition. In other words, VC reputation shortens the time of raising new
capital. Indeed, while reputational concerns could be a driver for young VC firms to raise
future funds quickly after the exit, experience, skills and networks of well-established VC
firms could help them to easily find capital providers as soon as possible after the exit, in
line with Hochberg, Ljungqvist, and Lu (2007).
Third, our paper contributes to a growing literature that examines the role of VC. Much
of this literature agrees on the fact that VCs do not only provide capital to young high
growth companies, they also provide screening, monitoring, certification, investment
expertise, networking, and promoting innovation and growth ((Lerner (1995), (Megginson
and Weiss (1991), Hellmann and Puri (2002) Nahata (2008), Krishnan et al. (2011),
Hochberg, Ljungqvist, and Lu (2007), and Chemmanur, Krishnan, and Nandy (2011),
Bernstein, Giroud, and Townsend (2016), and Gill and Walz (2016) among others). Thus,
VC reputation is an important asset to carry out these objectives. According to Gompers
(1996), for young VCs firms to build their reputation, they are willing to incur the costs
of higher underpricing. Underpricing is an indirect cost for VC firms and represents a
wealth transfer from existing shareholders (including VCs) to new ones. Lee and Wahal
(2004) also argue that IPO underpricing and IPO size are two measures by which venture
capital firms can signal their reputation. We complement this IPO evidence by examining
the case of M&A exits. To make the parallel with underpricing for IPOs, we investigate
the effect of the VC reputation on the acquisition premium and find a positive and
significant relation between the acquisition premium and the VC reputation. Thus, less
reputed VCs could bear the cost of building their reputation by negotiating less and
accepting a lower premium than more established VCs. Our result also confirms Masulis
and Nahata (2011)’s evidence that as young VCs are under strong pressure to establish a

6
successful track record in venture investing, they are willing to accept lower acquisition
prices to obtain profitable exits sooner.
Fourth, in addition to analyzing the grandstanding hypothesis, we dig deeper into the role
of VC and examine whether the most reputable VCs will choose to take their companies
public rather than to sell them to potential acquirers. Our findings thus add to the
literature examining the exit choice for private firms and help us to better understand the
differences between two important exit routes.
The remainder of this paper proceeds as follows. Section 2 describes our data and provides
comparative and descriptive statistics. Section 3 describes our empirical tests and results.
Section 4 provides further tests, and Section 5 concludes.
2. Data sources, sample selection and descriptive statistics
In this section, we present our data sources and highlight some descriptive statistics for
our retained sample. We build this study on data which come from different sources. First,
we obtain our data on VCs from the Thomson One Private Equity Database provided by
Thomson Financial. We focus on all U.S. venture capital exits by taking a firm public in
an IPO or selling it to a public acquirer between January 1995 and December 2015. We
exclude all exits for which venture capital firms could not be identified and collect data
about dates and sizes of new funds by tracking the fundraising history of U.S. venture
capital firms. To the extent that venture capitalists often syndicate their investments with
other venture firms, we are interested in the lead venture capitalist. If the company is
financed by more than one venture capital firm, we track the fundraising history for the
lead investor. We identify the lead venture capitalist as the venture investor with the
earliest and largest investment. If two firms provide the same amount of funding in the
first round, we consider the firm with the largest investment by cumulating the amount
invested across all financing rounds. We also eliminate venture-backed exits in which the
size and date of the next fund raised could not be identified for the lead venture capitalist.
Second, we crosscheck our data and complete the information on IPOs and M&As with
the New Issues database (for IPOs) and M&A database (for acquisitions), also provided

7
by Thomson Financial. Our final sample contains 609 U.S. VC-backed companies that exit
through IPOs and 824 U.S. VC-backed companies that exit through acquisitions.
To test the grandstanding hypothesis, we distinguish between companies backed by young
venture capital firms and those backed by more established venture capitalists based on
two measures of venture capital reputation.5 We form two groups of companies for venture-
backed IPOs and venture-backed acquisitions. The first measure is the venture capital
firm’s age. For comparison purposes, we follow Gompers (1996) and classify all lead venture
capital firms under six years old at the exit date (by IPO or acquisition) as “young” and
those six years old or more as “old”. However, giving our sample period and the foundation
date of almost venture capital firms in our sample, taking six years as a cutoff age would
not give us accurate conclusions, contrary to Gompers (1996), where the sample period is
between 1978 and 1987. Thus, we also classify all lead venture capital firms under 10 years
old as young and those 10 years old or more as experienced venture capitalists. Sørensen
(2007) argues, however, that VC age cannot accurately distinguish between active and
inactive investors. Therefore, we consider the number of previous IPOs or M&As
conducted by the lead venture capital firm as a second measure of VC reputation.
Specifically, we consider venture capitalists with the number of previous IPOs or M&As
under the median as young and those with the number of previous IPOs or M&As equal
to or over the median as old.
We follow much of the existing IPO and M&A literature by considering several control
variables. See the Appendix for more detailed variable definitions.
As a preliminary data investigation, we report descriptive statistics for the IPO and M&A
samples. Tables 1, 2, and 3 present summary information for IPOs and M&As backed by
young and old venture capital firms, using cutoff ages of 6 years old and 10 years old,
5 The extant literature has considered many alternative measures for VC reputation. For examples, Nahata (2008) considers the cumulative market capitalization of IPOs backed by the VC firm in
the IPO market and the VC’s share of aggregate investment in the VC industry. Krishnan et al. (2011) consider IPO market share, IPO frequency, VC age, VC capital, and cumulative IPO market share. For robustness, we also re-estimate our main results using different alternative candidates as VC reputation measures and they remain qualitatively similar.

8
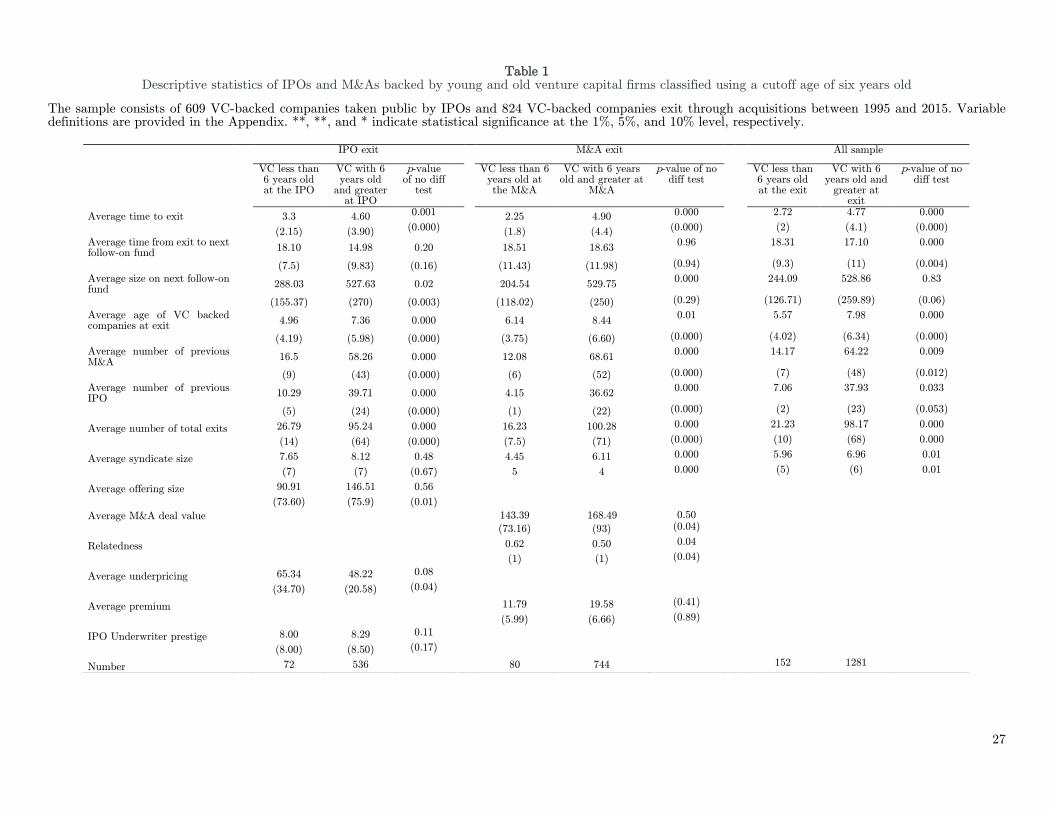
respectively, and the median number of previous IPOs and M&As. First, we find that
young venture capital firms exit their companies sooner than more established venture
capitalists, regardless of the measure of reputation used. For example, the time to exit by
IPOs for lead venture capital firms under six years old is 3.3 years, compared to 4.6 years
for old venture capitalists (see Table 1). The difference in means is statistically significant
at the 1% level. The results for venture-backed acquisitions show that the average time
from investment to exit is even shorter for young venture capital firms. Specifically, we
find that venture capital firms under 6 years old take on average 2.25 years to exit by
acquisition, compared to 4.9 years for more experienced venture capitalists. The difference
in means is also statistically significant at the 1% level. When we consider the full sample,
we find that younger venture capital firms have an incentive to exit the firm in which they
have invested through IPOs as well as through acquisitions as soon as possible (2.72 years
for young VCs vs. 4.77 years for older VCs), confirming the grandstanding hypothesis.
Second, unlike Gompers (1996), our results show that there is no evidence that young
venture capital firms exit companies closer to the next follow-on fund. Specifically, we find
no significant differences between the average time from the IPO to the next follow-on
fund for young and old venture capital firms when we consider a cutoff age of 6 years old
(see Table 1). Furthermore, when we consider a cutoff age of 10 years old, we find that,
on average, older venture capitalists bring companies public 14 months prior to the next
follow-on fund, compared to 19 months for younger venture capitalists. The difference in
means is statistically significant at the 5% level (see Table 2).
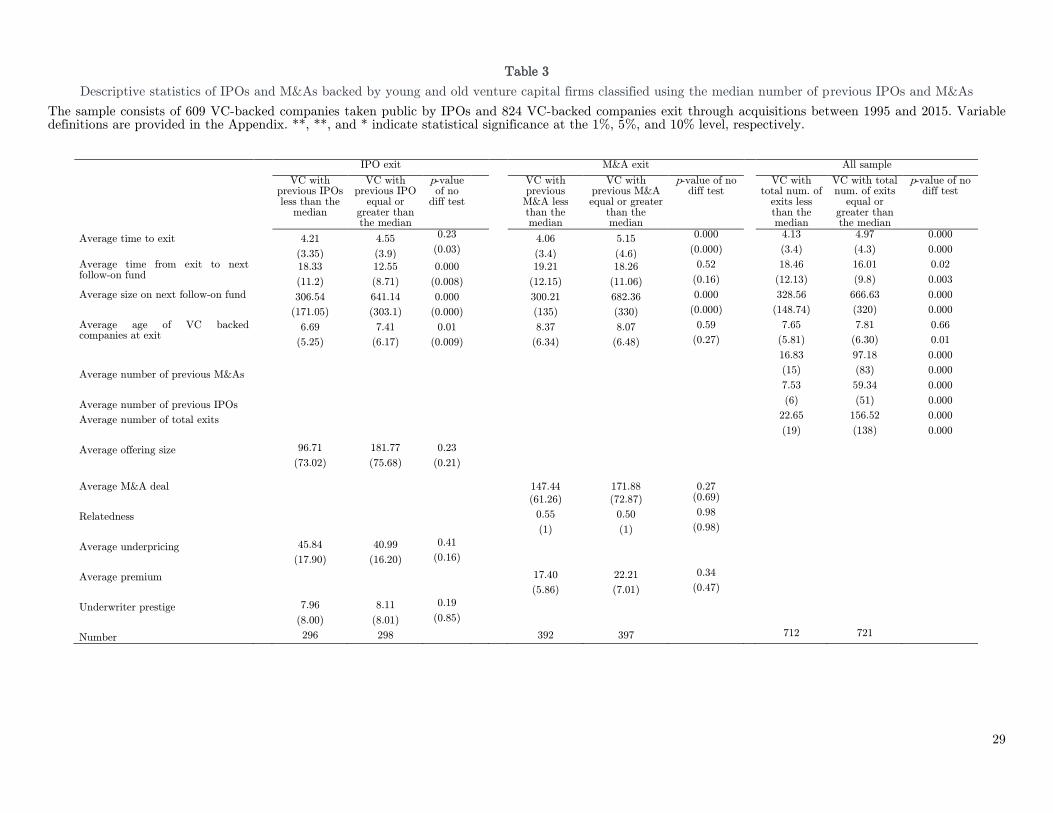
Using the number of previous IPOs as an alternative VC reputation measure, we find that
reputed venture capital firms bring companies public 12 months prior to the next follow-
on fund, while less reputed VC firms bring companies public 18 months prior to the next
follow-on fund. The difference in means is significant at the 1% level (see Table 3). In
other words, our results show that young venture capital firms take more time to raise a
new fund following their IPO exit.
Testing the grandstanding hypothesis using the acquisition sample, we find no significant
differences in the time between selling companies to a public acquirer and the next follow-
9
on fund. Our results show that it takes almost 18 months on average before venture capital
firms succeed in raising a new fund, regardless of their age or the number of previous deals.
Tables 1, 2 and 3 also report average (median) maturity of companies at the exit date.
When we consider the 10-year-old cutoff age (see Table 2), for example, we find that the
average age of the VC-backed company is 5.6 years at the IPO date for young venture
capitalists and 7.48 years for more established venture capitalists. We also find that the
average age of the VC-backed company is 6.89 years at the acquisition date for young
venture capital firms and 8.6 years for old venture capitalists. Both mean differences are
statistically significant at the 1% level. These results support the grandstanding hypothesis
for the IPO and acquisition samples. We also confirm these observations using a cutoff age
of 6 years old and the median number of previous IPOs and M&As as VC reputation
measures (see Tables 1 and 3).
Our results show that experienced venture capitalists are able to raise more money
immediately after their exit by IPO or acquisition. For example, taking the 10-year-old
cutoff age, we find that the average size of the next follow-on fund is $556.17 million for
old venture capitalists versus $293.80 million for young venture capital firms when the exit
strategy is the IPO. If venture capital firms choose to exit by acquisition, the average size
of the next follow-on fund is $576.76 million for old venture capitalists, while it is $235.96
million for young venture capital firms (see Table 2).
Tables 1, 2 and 3 also show that companies venture-backed by young venture capitalists
and going public in IPOs are more underpriced. For example, we find that the average
(median) underpricing is 51.34% (22.42%) for companies backed by young venture
capitalists, while it is 34.30% (15.00%) for companies backed by older venture capital firms
(see Table 2). We also find that the average offering size is smaller for IPOs brought to
market by young venture capitalists and that companies taken public by more established
venture capital firms tend to engage more prestigious underwriters, although these results
are not statistically significant. When VC exit through acquisitions, we find that the
average deal value is smaller for transactions involving young venture capital firms. For
example, we find that the average (median) deal value is $143.39 million ($73.16 million)

10
for acquisitions involving young venture capitalists compared to $168.49 million ($93
million) for those involving old venture capital firms. The difference in means is not
significant, but the difference in medians is statistically significant at the 5% level (see
Table 1). Our results also show that the average acquisition premium is higher if an
experienced VC firm is involved in the acquisition deal. For example, we find that the
average acquisition premium is 19.58% for companies backed by more experienced VC firm
compared to 11.79% for those backed by young VC firm, although those results are not
statistically significant (see Table 1).
To test the effect of the target company and the public acquirer being in the same industry,
we use Relatedness, a dummy variable taking the value of 1 if the company acquired is in
the same three digits SIC code as the public acquirer, and 0 otherwise. Our univariate
results show that young venture capital firms are more likely to sell the company to a
public acquirer who is in the same industry.
[Insert Tables 1, 2, and 3 here]
3. Empirical Analysis
To formalize our univariate analysis, we run a set of regressions using two different
dependent variables: (1) the logarithm of the size of the next fund raised by the lead
venture capital firm and (2) the time from the market exit to the lead venture capitalist’s
next fund. We estimate regressions for both IPO and M&A samples.
4.1. IPO exit
Previous studies have confirmed that younger VC firms have strong incentives to exit
earlier than older VC firms through IPOs. The behavior of young VCs, however, could be
due to the quality of the privately held companies they are financing rather than to their
reputation. To address endogeneity concerns, we use Heckman's (1979) correction
procedure. In the first step selection equation, we estimate the likelihood of reputable VCs
making their investment in privately held companies. Thus, we consider an indicator
variable denoting whether the lead VC is young or old (more established) as a dependent
variable. As instruments, we consider IPO firm age, VC syndicate size, IPO firm total
assets, lead VC size, number of companies lead VC has invested in, and VC investment

11
stage. Let’s note that to be valid instruments, these variables must be significant in the 1st
step selection equation (but not significant in the 2nd step equation). In the second stage,
we regress the size of the next fund raised by the lead VC on the VC reputation measure
including a set of control variables and the inverse Mills ratios (IMR) obtained from the
first step. As primary explanatory variables, we use VC age and the total number of
previous IPOs conducted by the lead VC (VC previous IPOs). For the VC firm’s age, we
consider (1) VC age dummy, a dummy variable equals 1 if the lead venture capital firm is
under 10 years old, and 0 otherwise, and (2) ln(VC age), the logarithm of the venture
capital firm’s age in years.
Following previous studies, we consider several control variables in the regressions. We
include the total number of IPOs in the previous four months and the value-weighted
CRSP market return for the year of the IPO as control variables related to the fundraising
activity of venture capital firms and market condition. We also control for the
underwriter’s prestige using an updated of Carter and Manaster (1990) ranking. Gompers
(1996) suggests that young venture capital firms are willing to incur the costs of higher
underpricing to build their reputation. Underpricing is an indirect cost for VC firms. It
represents a wealth transfer from existing shareholders (including VCs) to new ones. Lee
and Wahal (2004) also argue that IPO underpricing and IPO size are two measures by
which venture capital firms can signal their reputation. Thus, we include these two
variables in our regressions. Further, we include firm age to control for firm characteristics
and VC syndicate size, fraction of equity held by the lead VC after the IPO, and VC fund
type to control for VC characteristics. Although not reported, we include industry and
calendar fixed effects in all regressions. T-statistics appear in parentheses and are based
on standard errors robust to heteroscedasticity and adjusted for industry clustering.
Formally, we have:
1st step selection equation (Probit):
Prob (VC reputation measure for IPOs/M&As) = a0 + a1 Control variables + e, (1)
2nd step:
12
Size of the next fund raised by the lead VC for IPOs/M&As = b0 + b1(VC reputation
measure for IPOs/M&As) + b2 Control Variables + b3 IMR + n (2)
Table 4 reports the results for the IPO sample. The results from the selection equation
estimation show that VC reputation is significantly related to IPO firm age, to VC
syndicate size, to lead VC size, to lead VC investment experience, and to VC investment
stage. Specifically, we find that an investment by a reputable VCs is more likely if the
privately held firm is old, if the VC syndicate is large, if the lead VC has more investment
experience measured by the number of companies it has invested in, and if the VC
investment occurred when the portfolio company was not at an early/seed stage of
development lifecycle. All these instruments are statistically significant at the 1% level. In models 1 through 3, we separately include our VC reputation measures. Specifically, in
model 1 of Table 4, we include VC age dummy variable as a first measure of VC reputation.
We find that the coefficient of VC age dummy is negative and statistically significant at
the 5% level (-0.919, t-statistic= -2,464), indicating that the amount of capital raised by
VC firms under 10 years old is smaller than the capital raised by more reputable venture
capitalists. We also confirm this result using the logarithm of the venture capital firm’s
age instead of the VC dummy variable (model 2). The coefficient of ln(VC age) is positive
and significant at the 1% level (0.511, t-statistic= 4.058). Thus, more experienced venture
capital firms are able to raise more capital. In model 3, we consider the number of previous
IPOs by the lead VC firm as a measure of VC reputation. We find that the number of
previous IPOs by the lead venture capital firm is positively and significantly related to the
size of next fund raised after the IPO. The coefficient of VC previous IPOs is positive and
significant at the 1% level (0.245, t-statistic= 3.089). This result confirms that the amount
of capital raised by venture capitalists is sensitive to the number of previous IPOs,
consistent with the grandstanding hypothesis. It also suggests that more experienced VC
firms are able to raise more capital. The inverse Mills ratio derived from the specification
equation is statistically significant at the 1% level, confirming the importance to control
for the selection bias related to the VC’s choice of privately held companies. We also find
that the coefficient of the fraction of equity held by lead VC after IPO is positive and

13
significant at the 5% level. Thus, the commitment of lead VCs after IPO helps them to
raise more capital. In model 4 through 6, we replace Underpricing by IPO size to avoid
multicollinearity between both variables and confirm our previous results. As before, we
continue to find that lead VC reputation has a positive and significant effect on the size
of next fund.
[Insert Table 4 here]
We next analyze the likelihood and timing of rising money for follow-on funds after the
date of the IPO using a Cox hazard model, proposed by Cox (1972), where the logarithm
of the time from the IPO to the lead venture capitalist’s next fund is the dependent
variable. The basic model assumes the following form:
ikkii xxtth ....exp)()( 110 (3)
Where hi(t) is the conditional hazard rate defined as the probability of rising money for
follow-on funds after the date of the IPO. )(0 t is the baseline hazard function and the
second part of the equation is the exponentiated set of k covariates for firm i. The results
of the estimated Cox proportional hazards models are reported in Table 5. Since the
dependent variable is the logarithm of the hazard rate, a positive (negative) coefficient on
an explanatory variable indicates that changes in that variable decrease (increase) the time
from the IPO to the lead venture capitalist’s next fund.
We find that VC reputation has a negative impact on the time of raising capital for follow-
on funds. In other words, VC reputation shortens the time of raising new capital. The
coefficient of Ln(VC age) is negative and statistically significant at the 10% level (model
1). Thus, in contrast to Gompers (1996)‘s observation, more experienced venture capitalists
raise capital sooner after the IPO. This observation is in line with Hochberg, Ljungqvist,
and Lu (2007) who find that better-networked VC firms experience significantly better
fund performance, as measured by the proportion of investments that are successfully
exited through an IPO or a sale to another company. Further, we find a negative relation
between the underwriter’s prestige and the time of raising capital for follow-on funds. The
coefficient of Prestige is negative and statistically significant at the 5% (except in model
14
1). Thus, prestigious underwriters help VCs to stay active. Again, the inverse Mills ratio
derived from the specification equation is statistically significant at the 1% level,
confirming the importance to control for the selection bias. We also find that the higher
the underpricing, the longer time VC firms take after the IPO date to raise money for
follow-on funds. The coefficient of Underpricing in models 1, 2, and 3 of Table 5 are positive
and significant at the 1% level. Overall, our regression analysis results confirm that
reputation affects VC future fundraising.
[Insert Table 5 here]
4.2. M&A exit
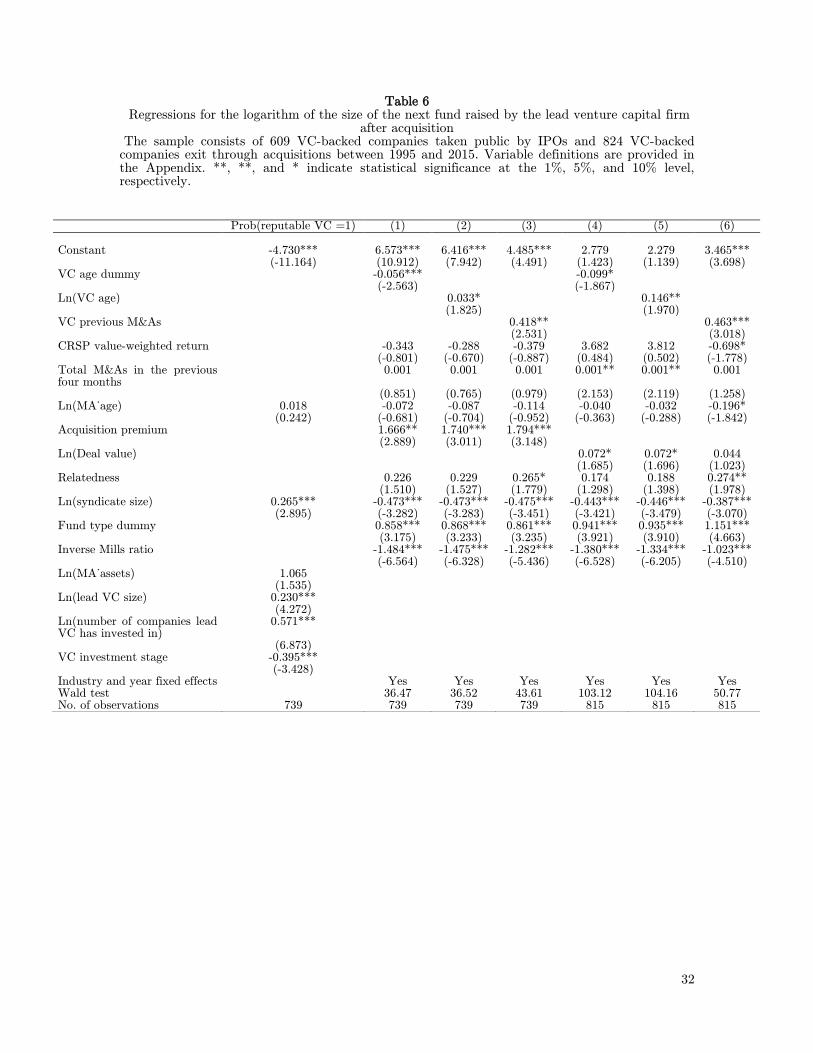
We estimate regressions of the size of the next fund raised by the lead venture capital firm
immediately after the M&A exit in Table 6. In models 1 through 3, we separately include
the three measures of VC reputation. In models 4 through 6, we replace Acquisition
premium by Ln(Deal value).
We consider the same set of control variables as for the IPO sample. We also include
Relatedness to control for the effect of the target company and the public acquirer being
in the same industry. We also use Heckman correction procedure and include the inverse
Mills ratio to control for the selection bias.
In model 1, the coefficient of VC age dummy is negative and significant at the 1% level (-
0.056, t-statistic = -2.563), suggesting that venture capital firms over 10 years old are
significantly able to raise more capital after successfully selling the company to a public
acquirer. Using the logarithm of venture capitalists’ age (model 2), we find that the
coefficient of Ln(VC age) is positive and significant at the 10% level (0.033, t-statistic =
1.825), confirming that more reputable venture capital firms are able to raise more capital.
In model 3 of Table 6, we find that the total number of previous M&As is significantly
and positively related to the size of the next follow-on fund. This result confirms that each
additional exit by M&A helps VC firms attain more reputation and succeed in raising
more money for future investments, once again supporting the grandstanding hypothesis.
Furthermore, we find that the coefficient of Acquisition premium is positive and significant
in models 1, 2 and 3. Thus, negotiating a better acquisition premium will help VCs to raise

15
more capital immediately after the acquisition exit. Table 6 also shows that venture capital
firms participating in large deals are significantly able to raise more capital. The coefficient
of Ln(Deal value) is positive and significant at the 10% level in models 4 and 5. Again, the
coefficient of the inverse Mills ratio is statistically significant for all models indicating the
importance of controlling for the selection bias. Overall, results in Table 6 show that exit
via acquisitions is as important as exit via IPOs in explaining VC fundraising.
[Insert Table 6 here]
In Table 7, we estimate the time between the M&A exit and the next follow-on fund by
lead VC in the Cox hazard framework. We find that VC reputation has a significant
impact on the time between the M&A exit and the next follow-on fund. For instance, the
coefficient of VC age dummy is positive and significant at the 5% level (model 1) while
the coefficients of Ln(VC age) and VC previous M&As are negative and statistically
significant at the 10% level (models 2 and 3). Thus, more experienced venture capitalists
raise capital sooner after a successful exit by acquisition. In other words, VC reputation
shortens the time of raising new capital.
We also find that independent VCs are significantly able to quickly raise new funds
following the acquisition. The coefficient of Fund type=1 is negative and significant at the
5% (models 1, 2, 3, and 6). Nahata (2008) points out that corporate VCs are generally less
experienced in venture financing than traditional VCs. Chemmanur, Loutskina, and Tian
(2014) also provide the evidence that CVCs firms are younger, riskier, and less profitable
that independent VC.6 Masulis and Nahata (2011) point out that CVC have weaker
financial incentives which makes them more risk averse and more worried to exit their
investments. Overall, we confirm that selling private firms to public acquirer is as
important as taking it public through an IPO to build VC reputation.
[Insert Table 7 here]
4. Further analysis
6 Also, see Chemmanur, Loutskina, and Tian (2014) for a detailed comparison between CVC and independent VC and Ivanov and Xie (2010) for an examination of the added value of CVCs relative to independent VCs.
16
In this section, we dig deeper into the role of VC. In particular, we examine the correlation
between VC firm reputation and IPO or M&A timing. We also explore the effect of VC
reputation on underpricing, acquisition premium, and IPO or M&A deal size.
4.1. IPO or M&A timing
Our descriptive statistics reported in Tables 1, 2 and 3 show that the time between the
first lead venture capital investment and the IPO or the M&A date is significantly shorter
for young venture capitalists. We also find that companies backed by new venture capital
firms are younger than those backed by more established venture capitalists. In this sub-
section, we analyze the correlation between VC firm reputation and IPO or M&A timing.
We consider (1) the time to exit and (2) the company age at the IPO or M&A exit as
timing measures and run a set of regressions using VC reputation measures as independent
variables. We use an accelerated failure time (AFT) model to test the relation between
VC reputation and time to exit. One feature of this model is that the baseline hazard
function follows an assumed density function based on prior expectations. Based on Akaike
Information Criterion (AIC) and Bayesian Information Criterion (BIC) results, we assume
that the baseline hazard function follows a log-logistic density function. Hence, we estimate
a log-logistic AFT model where the dependent variable is the number of years between the
exit date and the first investment date by the lead venture capital firm. A positive
(negative) coefficient on an explanatory variable indicates both a higher (lower) probability
of survival as well as an increasing (decreasing) expected duration. Specifically, we estimate
the following AFT model:
Ln(T) = b0 + b1(VC reputation measure for IPOs/M&As) + b2Control Variables + n (4)
Where T is the duration of VC backed firm before exit. The estimation results are reported
in Table 8. Panel A of Table 8 reports regression results for IPOs. We find that young
venture capital firms take companies public earlier than old venture capitalists. The
negative and significant coefficient of VC age dummy variable suggests that venture capital
firms under 10 years old take less time to bring companies to the market by IPOs than
more established VCs. We also find that duration before exit is positively and significantly

17
related to Ln(VC age) and VC previous IPOs , confirming that more experienced VC take
their time before exit.
These results support the grandstanding hypothesis. Further, we find that there a positive
and significant relation between Fund type and Time to exit, confirming that independent
VCs do not rush their exit. As noted by Chemmanur, Loutskina, and Tian (2014),
independent VCs are structured as limited partnerships and have full control over the
capital committed by their limited partners.
When we consider the company age at exit as a dependent variable, we find a negative
and significant relation between the IPO company age and the VC’s age. The coefficients
of all our VC reputation measures are statistically significant at the 1% level, suggesting
that companies backed by young venture capital firms are younger than those backed by
more reputable VCs. Once again, these results favor the grandstanding explanation.
Panel B of Table 8 reports regression results for M&As using the time to exit and the
company age at the M&A exit as dependent variables. We find that the duration before
exit is significantly shorter for young venture capitalists than more established venture
capitalists. The coefficient of VC age dummy is negative and statistically significant at the
1% level (-0.344, t-statistic = -6.275), suggesting that venture capital firms under 10 years
old exit through acquisitions earlier than old venture capitalists. Similarly, we find that
coefficients of ln(VC age) and VC previous M&As are positive and significant at the 1%
level. Thus, the logged survival time (and hence the expected duration) is an increasing
function of the venture capital firm’s age. Using firm age at exit as a dependent variable,
we find that companies acquired by public acquirers backed by venture capital firms under
10 years old are younger than those backed by more experienced venture capitalists. The
coefficient of VC age dummy is negative and statistically significant at the 1% level (-
0.214, t-statistic = -3.723). We also find the coefficient of ln(VC age) is positive and
significant at the 1% level (0.130, t-statistic= 3.194) and the coefficient of VC previous
M&As is positive and significant at the 10% level (0.130, t-statistic= 3.194), suggesting
18
that VC’s reputation is associated with a higher company age at the acquisition date.
Overall, these results are consistent with the grandstanding hypothesis.
[Insert Table 8 here]
4.2. IPO underpricing, M&A premium and VC reputation
Earlier, we noted that venture capital firms are willing to incur the costs of higher
underpricing to build their reputation. In this sub-section, to further examine this result,
we run a set of regressions using underpricing and IPO size as dependent variables. We
also separately consider different VC reputation measures as independent variables and
we control for IPO characteristics.
Panel A of Table 9 reports regression results for the IPO exit. We find that the coefficient
of VC age dummy (model 1) is positive and significant at the 5% level (0.138, t-statistic=
2.391). Thus, we confirm that companies backed by young venture capital firms are
associated with higher underpricing. Using the logarithm of the venture capital firm’s age
(model 2), we also confirm that greater underpricing is significantly associated with
younger venture capital firms. Our results imply that young venture capital firms could
incur the cost of higher underpricing if they are looking to increase their reputation to
raise more capital.
Furthermore, the control variable Ln(IPO age) has a negative and statistically significant
coefficient, confirming that younger IPO firms are more underpriced than older IPO firms.
We also find in model 1 that the underwriter’s prestige has a negative and significant effect
on the level of underpricing. Using IPO size as an alternative measure of reputation signal
does not alter our conclusions (models 4, 5, and 6). Our results are, however, not
statistically significant.
In panel B of Table 9, we examine the M&A sample. To make the parallel with the IPO
sample, we consider M&A premium and deal size. We run a set of regressions using M&A
premiums (models 1, 2 and 3) and M&A deal sizes (models 4, 5, and 6) as dependent
variables. We also separately consider different VC reputation measures as independent
variables and we control for M&A characteristics. The results show that there is a positive
and significant relation between M&A premium and VC reputation. Thus, less reputed

19
VCs could bear the cost of building their reputation by accepting a lower premium than
more established VCs. We also find that younger VCs participate in small deals to build
their reputation (models 4, 5, and 6). The positive coefficients of VC reputation are not,
however, significant. Further, we find that Fund type has a negative and statistically
significant coefficient, confirming Ivanov and Xie (2010)’s result that targets with CVC
backing tend to receive higher takeover premiums than their counterparts with
independent VC backing.
[Insert Table 9 here]
4.3. VC reputation and the exit choice (IPOs vs. M&As)
Previous studies such as Brau, Francis, and Kohers (2003), Poulsen and Stegemoller
(2008), Ball, Chiu, and Smith (2011), and Bayar and Chemmanur (2012) have examined
the determinants of exit choice for privately held firms. Bayar and Chemmanur (2011)
present a theoretical model to study the situation of an entrepreneur managing a private
firm backed by a VC. Nahata (2008) examines whether VC reputation confers performance
benefits to their portfolio companies and finds that companies led by more reputable VCs
are more likely to exit successfully. Poulsen and Stegemoller (2008) conclude that VCs
backing has an effect on the exit choice. Ball, Chiu, and Smith (2011) find that the choice
of an M&A exit over an IPO exit is negatively related to subsequent market returns and
that acquirers may turn to M&A for lack of better alternatives. They do not, however,
find that firm-specific market timing affects the choice between IPO and M&A exit. In
this subsection, we extend previous analyses by empirically examining the effect of VC
reputation on exit choice (IPOs vs. M&As). The exit likelihood is regressed on VC
reputation along with the other independent variables used in previous tests. The
dependent variable is a dummy variable which equals 1 if the private firm goes public and
0 if it is acquired. Formally, we estimate the following logistic model:
Prob (1 if IPO or 0 if M&A) = b0 + b1 VC reputation measure for IPOs/M&As + b2
Control variables + e (5)
The results are presented in Table 10. We find that the coefficient of VC age dummy
(model 1) is positive and statistically significant at the 1% level (1.210, t-statistic = 9.723),
20
the coefficient of Ln(VC age) (model 2) is negative and statistically significant at the 10%
(-0.154, t-statistic = -1.881), and the coefficient of total VC previous IPOs and M&As
(model 3) is negative and statistically significant at the 5% level (-0.002, t-statistic = -
2.484). Thus, VC reputation affects positively and significantly the probability of an IPO
exit over an acquisition exit. Overall, these observations confirm the importance of VC
reputation on the likelihood of exits via IPOs or acquisitions. They are also in line with
Nahata (2008), who finds a positive relation between VC’s share of cumulative IPO
capitalization and the probability of an IPO exit over an acquisition exit.
We also find that larger firms are more likely to go public. The coefficient of Ln(firm age)
is positive and statistically significant at the 5% level. Further, we find that market return
has a positive and significant effect on the probability of an IPO exit over an acquisition
exit. The coefficient of CRSP value-weighted return is positive and statistically significant
at the 1% level (models 1, 2, and 3). Brau, Francis, and Kohers (2003) also confirm the
effect of the “hotness” of the IPO market relative to the takeover market on the decision
to go public versus to be acquired. Furthermore, the coefficient of Ln(VC syndicate size)
is positive and statistically significant at the 1% level (models 1, 2, and 3). Thus, privately
held companies that are backed by larger VC syndicates are more likely to go public than
to be acquired.
We also find that firms that receive their VC funding in the early/seed stage of
development lifecycle are more likely to be acquired. The coefficient of VC investment
stage is negative and significant at the 1% level (models 1, 2, and 3). This result is in line
with Bayar and Chemmanur (2011)’s suggestion that later stage firms, more viable against
product market competition are more likely to go public, while earlier stage firms, less
viable against product market competition, are more likely choose to be acquired.
[Insert Table 10 here]
5. Conclusion
Previous literature on the venture capital industry has often considered that the most
effective way for a VC firm to signal its quality is to conduct a successful IPO. However,
21
the appeal of M&As has become popular over the last decade. Masulis and Nahata (2011)
point out that on average IPOs occur in about 10% of VC investments, whereas M&As
occur approximately in 20% of VC investments. Despite this upward trend of M&A as an
exit route, studies on the role of VC on acquisitions of privately held firms remain scarce.
We help fill this gap by examining the grandstanding hypothesis via IPOs as well as via
M&As for VC firms from 1995 to 2015. Our results show that not only taking companies
public by IPOs has an effect on young venture capitalists’ reputation and their ability to
raise more capital but also succeeding to sell the company to a public acquirer is an
important channel for young venture capital firms to easily access new investments and to
build their reputation. Thus, the desire to grandstand is similar in young venture capital
firms conducting IPOs or M&As. Our results are robust to different VC reputation
measures and controlling for selection issue.
We also find that for venture capital firms choosing to exit by IPOs, the size of the next
fund raised depends on the number of IPOs previously financed by the VC and VC age.
Similarly, for venture capital firms choosing to exit by selling the company to a public
acquirer, the size of next fund raised depends on the number of M&As previously financed
and VC age. Furthermore, we find that IPO or M&A timing is associated with reputational
concerns. The time it takes a company backed by a young venture capital firm to be
acquired is even less than the time it takes to go public by IPO. This result suggests that
an exit strategy by acquisition has the same importance as an IPO in explaining incentives
of young venture capital firms to grandstand.
Unlike Gompers (1996), we find no evidence that young venture capitalists were able to
raise more capital quickly after an IPO or an M&A than more established venture
capitalists. While reputational concerns could be a driver for young VC firms to raise
future funds quickly after the exit, experience, skills, and networks of well-established VC
firms could help them to easily find capital providers as soon as possible after the exit
(Hochberg, Ljungqvist, and Lu (2007)). Moreover, we find that to build their reputation,
young VC firms are willing to bear the cost of higher underpricing in the case of IPO exits

22
and to accept a lower premium in the case of M&A exits. We also find that independent
VCs are significantly able to quickly raise new funds following the acquisition.
In addition to testing the grandstanding hypothesis, this study illustrates the importance
of considering both IPOs and M&As as exit channels for privately held firms. It also
examines the effect of VC reputation on exit choice and confirms that the presence of a
reputed VC significantly affects the probability of an IPO exit over an acquisition exit.
References
Ball, Eric, Hsin Hui Chiu, and Richard Smith, 2011, Can VCs time the market? An
analysis of exit choice for venture-backed firms, Review of Financial Studies 24, 3105–
3138.
Bayar, Onur, and Thomas J. Chemmanur, 2011, IPOs versus Acquisitions and the
Valuation Premium Puzzle: A Theory of Exit Choice by Entrepreneurs and Venture
Capitalists, Journal of Financial and Quantitative Analysis 46, 1755– 1793.
Bayar, Onur, and Thomas J. Chemmanur, 2012, What drives the valuation premium in
IPOs versus acquisitions? An empirical analysis, Journal of Corporate Finance 18, 451–
475.
Bernstein, Shai, Xavier Giroud, and Richard R. Townsend, 2016, The Impact of Venture
Capital Monitoring, Journal of Finance 71, 1591– 1622.
Brau, James C., Bill Francis, and Ninon Kohers, 2003, The Choice of IPO versus Takeover:
Empirical Evidence, The Journal of Business 76, 583– 612.
Butler, Alexander W, and M. Sinan Goktan, 2013, On the role of inexperienced venture
capitalists in taking companies public, Journal of Corporate Finance 22, 299– 319.
Carter, R, and S Manaster, 1990, Initial public offerings and underwriter reputation,
Journal of Finance 45, 1045– 1067.
Chemmanur, Thomas J., Karthik Krishnan, and Debarshi K. Nandy, 2011, How does
venture capital financing improve efficiency in private firms? A look beneath the surface,
Review of Financial Studies 24, 4037– 4090.
Chemmanur, Thomas J., Elena Loutskina, and Xuan Tian, 2014, Corporate venture

23
capital, value creation, and innovation, Review of Financial Studies 27, 2434– 2473.
Cox, D R, 1972, Regression Models and Life-Tables, Journal of the Royal Statistical
Society. Series B (Methodological) 34, 187– 220.
Doidge, Craig, G Andrew Karolyi, and René M Stulz, 2013, The U.S. left behind?
Financial globalization and the rise of IPOs outside the U.S., Journal of Financial
Economics 110, 546– 573.
Gao, Xiaohui, Jay R Ritter, and Zhongyan Zhu, 2013, Where Have All the IPOs Gone?,
Journal of Financial and Quantitative Analysis 48, 1663– 1692.
Gill, Andrej, and Uwe Walz, 2016, Are VC-backed IPOs delayed trade sales?, Journal of
Corporate Finance 37, 356– 374.
Gompers, Paul A., 1995, Optimal Investment, Monitoring, and the Staging of Venture
Capital, Journal of Finance 50, 1461– 1489.
Gompers, Paul A., 1996, Grandstanding in the venture capital industry, Journal of
Financial Economics 42, 133– 156.
Heckman, J, 1979, Sample selection bias as a specification error, Econometrica 47, 153–
161.
Hellmann, Thomas, and Manju Puri, 2002, Venture Capital and the Professionalization of
Start‐ Up Firms: Empirical Evidence, Journal of Finance 57, 169– 197.
Hochberg, Yael V., Alexander Ljungqvist, and Yang Lu, 2007, Whom you know matters:
Venture capital networks and investment performance, Journal of Finance 62, 251– 301.
Ivanov, Vladimir I., and Fei Xie, 2010, Do corporate venture capitalists add value to start-
up firms? Evidence from IPOs and acquisitions of VC backed companies, Financial
Management 39, 129– 152.
Krishnan, C N V, V I Ivanov, R W Masulis, and A K Singh, 2011, Venture capital
reputation, post-IPO performance, and corporate governance, Journal of Financial and
Quantitative Analysis 46, 1295– 1333.
Lee, Peggy M., and Sunil Wahal, 2004, Grandstanding, certification and the underpricing
of venture capital backed IPOs, Journal of Financial Economics 73, 375– 407.
Lerner, Josh, 1995, Venture Capitalists and the Oversight of Private Firms, Journal of

24
Finance 50, 301– 318.
Lerner, Joshua, 1994, Venture capitalists and the decision to go public, Journal of Financial
Economics 35, 293– 316.
Masulis, Ronald W, and Rajarishi Nahata, 2011, Venture Capital Conflicts of Interest:
Evidence from Acquisitions of Venture-Backed Firms, Journal of Financial and
Quantitative Analysis 46, 395– 430.
Megginson, William L, and Kathleen A Weiss, 1991, Venture Capitalist Certification in
Initial Public Offerings, Journal of Finance 46, 879– 903.
Nahata, Rajarishi, 2008, Venture capital reputation and investment performance, Journal
of Financial Economics 90, 127– 151.
Poulsen, Annette B, and Mike Stegemoller, 2008, Moving from private to public ownership:
selling out to public firms versus initial public offerings, Financial Management 37, 81–
101.
Sø rensen, Morten, 2007, How smart is smart money? A two-sided matching model of
venture capital, Journal of Finance 62, 2725– 2762.

25
Appendix. Definitions of the variables used in this paper
Variables Definitions VC reputation: VC age dummy Dummy variable taking the value of one if the lead venture capitalist is less
than ten years old, else zero. Ln(VC age) The natural logarithm of the lead venture capital firm’s age in years VC previous IPOs or M&As Total number of previous IPOs or M&A conducted by the lead venture capital IPO or M&A characteristics: Underpricing
The difference between the first day closing price and the offer price given as a percentage of the offer price
IPO size The natural logarithm of the total capital raised at the time of the IPO Prestige Ln(IPO or M&A age) Ln(Assets) Acquisition premium
Dummy variable set to one if the IPO lead underwriter has an updated Carter and Manaster (1990) of eight or more, else zero.
The natural logarithm of company’s age at the effective date of the IPO or M&A in years The natural logarithm of the total asset of the IPO or target firm A proxy defined as the total deal value divided by the total sales of the target before the announcement date.
Ln(Deal value) The natural logarithm of acquisition deal value Relatedness Dummy variable taking the value of one if the company acquired is in the
same three digits SIC code as the public acquirer, else zero.
Market conditions CRSP value-weighted return
The value-weighted CRSP market return for the year of the IPO or M&A.
Total IPOs in the previous four months The cumulative number of IPOs in the previous four months Total M&As in the previous four months The cumulative number of M&As in the previous four months
VC characteristics Time to exit VC syndicate size Fund type Fraction of equity held by lead VC post-IPO Number of companies lead VC has invested in VC investment stage
The time between the first investment date by the lead venture capital firm and the exit date (IPO or M&A) The size of VC syndicate
Dummy variable set to one if VC is independent and zero if it’s a corporate investor Fraction of equity held by lead VC post-IPO Number of companies lead VC has invested in Dummy variable set to one if VC invested at early/seed stage, else zero

26
Figure 1 IPOs and M&As activities between 1995 and 2015, according to the National Venture Capital
Association (NVCA)
0
100
200
300
400
500
600
700
19
95
19
96
19
97
19
98
19
99
20
00
20
01
20
02
20
03
20
04
20
05
20
06
20
07
20
08
20
09
20
10
20
11
20
12
20
13
20
14
20
15
Total IPOs Total M&As Total IPOs and M&As
27
Table 1 Descriptive statistics of IPOs and M&As backed by young and old venture capital firms classified using a cutoff age of six years old
The sample consists of 609 VC-backed companies taken public by IPOs and 824 VC-backed companies exit through acquisitions between 1995 and 2015. Variable definitions are provided in the Appendix. **, **, and * indicate statistical significance at the 1%, 5%, and 10% level, respectively.
IPO exit M&A exit All sample
VC less than 6 years old at the IPO
VC with 6 years old
and greater at IPO
p-value of no diff
test
VC less than 6 years old at the M&A
VC with 6 years old and greater at
M&A
p-value of no diff test
VC less than 6 years old at the exit
VC with 6 years old and
greater at exit
p-value of no diff test
Average time to exit 3.3 4.60 0.001 2.25 4.90 0.000 2.72 4.77 0.000
(2.15) (3.90) (0.000) (1.8) (4.4) (0.000) (2) (4.1) (0.000)
Average time from exit to next follow-on fund
18.10 14.98 0.20
18.51 18.63 0.96 18.31 17.10 0.000
(7.5) (9.83) (0.16) (11.43) (11.98) (0.94) (9.3) (11) (0.004)
Average size on next follow-on fund
288.03 527.63 0.02
204.54 529.75
0.000 244.09 528.86 0.83
(155.37) (270) (0.003) (118.02) (250) (0.29) (126.71) (259.89) (0.06)
Average age of VC backed companies at exit
4.96 7.36 0.000
6.14 8.44 0.01 5.57 7.98 0.000
(4.19) (5.98) (0.000) (3.75) (6.60) (0.000) (4.02) (6.34) (0.000)
Average number of previous M&A
16.5 58.26 0.000
12.08 68.61 0.000 14.17 64.22 0.009
(9) (43) (0.000) (6) (52) (0.000) (7) (48) (0.012)
Average number of previous IPO
10.29 39.71 0.000
4.15 36.62 0.000 7.06 37.93 0.033
(5) (24) (0.000) (1) (22) (0.000) (2) (23) (0.053)
Average number of total exits 26.79 95.24 0.000 16.23 100.28 0.000 21.23 98.17 0.000
(14) (64) (0.000) (7.5) (71) (0.000) (10) (68) 0.000
Average syndicate size 7.65 8.12 0.48 4.45 6.11 0.000 5.96 6.96 0.01
(7) (7) (0.67) 5 4 0.000 (5) (6) 0.01
Average offering size 90.91 146.51 0.56
(73.60) (75.9) (0.01)
Average M&A deal value 143.39 168.49 0.50
(73.16) (93) (0.04)
Relatedness 0.62 0.50 0.04
(1) (1) (0.04)
Average underpricing 65.34 48.22 0.08
(34.70) (20.58) (0.04)
Average premium 11.79 19.58 (0.41)
(5.99) (6.66) (0.89)
IPO Underwriter prestige 8.00 8.29 0.11
(8.00) (8.50) (0.17)
Number 72 536 80 744 152 1281

28
Table 2 Descriptive statistics of IPOs and M&As backed by young and old venture capital firms classified using a cutoff age of ten years old
The sample consists of 609 VC-backed companies taken public by IPOs and 824 VC-backed companies exit through acquisitions between 1995 and 2015. Variable definitions are provided in the Appendix. **, **, and * indicate statistical significance at the 1%, 5%, and 10% level, respectively.
IPO exit M&A exit All sample VC less than
10 years old at the IPO
VC with 10 years old and
greater at IPO
p-value of no
diff test
VC less than 10 years old at the M&A
VC with 10 years old and
greater at M&A
p-value of no diff test
VC less than 10 years old at the exit
VC with 10 years old and
greater at exit
p-value of no diff test
Average time to exit 3.48 4.69 0.000 3.22 5.07 0.000 3.33 4.91 0.000 (2.60) (3.9) 0.000 (2.9) (4.5) 0.000 2.8 4.2 0.000 Average time from exit to next follow-on fund
19.01 14.34 0.01 18.73 18.58 0.93 18.84 16.76 0.10 (10.21) (9.53) 0.81
(12.01) (11.9) 0.34 11.63 10.76 0.31
Average size on next follow-on fund
293.80 556.17 0.001 235.96 576.76 0.000 259.67 567.92 0.000 (150) (282.8) 0.000
(126.33) (268.62) 0.000 129.75 275 0.000
Average age of VC backed companies at exit
5.60 7.48 0.000 6.89 8.61 0.008 6.36 8.13 0.000 (4.62) (6.08) 0.000
(5.35) (6.62) 0.000 5.04 6.42 0.000
Average number of previous M&A
9.75 43.68 0.000 15.15 77.60 0.000 15.40 71.65 0.000 (5.5) (29) 0.000 (10) (63) 0.000 9.5 58 0.000
Average number of previous IPOs
15.77 63.89 0.000 5.28 41.98 0.000 7.13 42.72 0.000 (9) (50.5) 0.000 (2) (27) 0.000 3 28 0.000
Average number of total exits 25.53 104.19 0.000 20 113.74 0.000 22.26 109.64 0.000 (15) (75) 0.000 (12) (86) 0.000 14 81 0.000 Average syndicate size 7.31 8.28 0.07 4.95 6.25 0.000 5.92 7.12 0.000 (7) (6) 0.07 (5) (4) 0.000 (5) (6) 0.000 Average offering size
90.27 156.84 0.38 (70.75) (77.62) 0.03
Average M&A deal
162.22 167.20 0.84
(72.25) (99) 0.04
Relatedness 0.53 0.51 0.70 (1) (1) 0.70 Average underpricing 51.34 34.30 0.006
(22.42) (15.00) 0.03
Average premium 12.65 21.13 0.13 (5.74) (6.28) 1.02 IPO underwriter prestige 7.93 8.06 0.35 (8.00) (8.01) 0.56 Number 132 477
190 634 322 1111
29
Table 3
Descriptive statistics of IPOs and M&As backed by young and old venture capital firms classified using the median number of previous IPOs and M&As
The sample consists of 609 VC-backed companies taken public by IPOs and 824 VC-backed companies exit through acquisitions between 1995 and 2015. Variable definitions are provided in the Appendix. **, **, and * indicate statistical significance at the 1%, 5%, and 10% level, respectively.
IPO exit M&A exit All sample
VC with previous IPOs less than the
median
VC with previous IPO
equal or greater than the median
p-value of no
diff test
VC with previous M&A less than the median
VC with previous M&A equal or greater
than the median
p-value of no diff test
VC with total num. of
exits less than the median
VC with total num. of exits
equal or greater than the median
p-value of no diff test
Average time to exit 4.21 4.55 0.23 4.06 5.15 0.000 4.13 4.97 0.000
(3.35) (3.9) (0.03) (3.4) (4.6) (0.000) (3.4) (4.3) 0.000
Average time from exit to next follow-on fund
18.33 12.55 0.000 19.21 18.26 0.52 18.46 16.01 0.02
(11.2) (8.71) (0.008) (12.15) (11.06) (0.16) (12.13) (9.8) 0.003
Average size on next follow-on fund 306.54 641.14 0.000 300.21 682.36 0.000 328.56 666.63 0.000
(171.05) (303.1) (0.000) (135) (330) (0.000) (148.74) (320) 0.000
Average age of VC backed companies at exit
6.69 7.41 0.01 8.37 8.07 0.59 7.65 7.81 0.66
(5.25) (6.17) (0.009) (6.34) (6.48) (0.27) (5.81) (6.30) 0.01
Average number of previous M&As
16.83 97.18 0.000
(15) (83) 0.000
Average number of previous IPOs
7.53 59.34 0.000
(6) (51) 0.000
Average number of total exits 22.65 156.52 0.000
(19) (138) 0.000
Average offering size 96.71 181.77 0.23
(73.02) (75.68) (0.21)
Average M&A deal
147.44
171.88
0.27
(61.26) (72.87) (0.69)
Relatedness 0.55 0.50 0.98
(1) (1) (0.98)
Average underpricing 45.84 40.99 0.41
(17.90) (16.20) (0.16)
Average premium 17.40 22.21 0.34
(5.86) (7.01) (0.47)
Underwriter prestige 7.96 8.11 0.19
(8.00) (8.01) (0.85)
Number 296 298 392 397 712 721

30
Table 4 Regressions for the logarithm of the size of the next fund raised by the lead venture capital firm
after IPO The sample consists of 609 VC-backed companies taken public by IPOs and 824 VC-backed companies exit through acquisitions between 1995 and 2015. Variable definitions are provided in the Appendix. **, **, and * indicate statistical significance at the 1%, 5%, and 10% level, respectively.
Prob(VC reputable) =1
(1) (2) (3) (4) (5) (6)
Constant -4.970*** 4.720*** 2.704* 3.780** 4.762*** 4.193** 4.336** (-8.964) (3.501) (1.898) (2.546) (3.173) (2.258) (2.415) VC age dummy -0.919** -0.910** (-2.464) (-2.436) Ln(VC age) 0.511*** 0.650*** (4.058) (3.361) VC previous IPOs 0.245*** 0.232*** (3.089) (2.675) Underpricing 0.058 0.066 0.086 (0.560) (0.642) (0.848) IPO size 0.006 -0.091 -0.079 (0.046) (-0.630) (-0.545) Prestige -0.105 -0.099 -0.065 -0.113 -0.084 -0.079 (-0.554) (-0.536) (-0.377) (-0.602) (-0.446) (-0.423) Ln(IPO age) 0.363*** -0.197 -0.138 -0.294* -0.209 -0.350* -0.338* (3.321) (-1.146) (-0.830) (-1.674) (-1.221) (-1.834) (-1.782) CRSP value-weighted return 4.884 4.530 6.523 4.791 0.413 5.885 (0.850) (0.807) (1.035) (0.828) (0.062) (0.852) Total IPOs in the previous four months
0.002 0.002 0.000 0.002 0.001 0.000
(0.796) (1.000) (0.185) (0.794) (0.295) (0.191) Ln(syndicate size) 0.300*** -0.250 -0.198 -0.411*** -0.250 -0.287* -0.425*** (2.832) (-1.554) (-1.266) (-2.724) (-1.548) (-1.724) (-2.596) Fraction of equity held by lead VC post-IPO
0.016** 0.018** 0.023*** 0.015** 0.026*** 0.022***
(2.100) (2.452) (3.205) (2.079) (3.305) (2.871) Fund type dummy 0.140 0.230 -0.034 0.143 0.066 -0.048 (0.487) (0.815) (-0.150) (0.497) (0.261) (-0.198) Inverse Mills ratio -1.324*** -1.174*** -1.717*** -1.325*** -1.922*** -1.858*** (-5.190) (-4.662) (-4.322) (-5.193) (-4.775) (-4.227) Ln(IPO assets) -0.046 (-0.886) Ln(lead VC size) 0.324*** (4.722) Ln(number of companies lead VC has invested in)
0.339***
(3.378) VC investment stage -0.446*** (-3.223) Industry and year fixed effects Yes Yes Yes Yes Yes Yes Wald test 67.14 80.97 77.94 67.00 72.41 64.37 No. of observations 523 523 523 505 523 521 505

31
Table 5
Regressions for time from IPO to the lead venture capital firm’s next fund The sample consists of 609 VC-backed companies taken public by IPOs and 824 VC-backed companies exit through acquisitions between 1995 and 2015. Variable definitions are provided in the Appendix. **, **, and * indicate statistical significance at the 1%, 5%, and 10% level, respectively.
Prob(VC reputable =1) (1) (2) (3) (4) (5) (6) VC age dummy 0.105 0.092 (0.687) (0.593) Ln(VC age) -0.125* -0.123* (-1.780) (-1.745) VC previous IPOs -0.010 -0.004 (-0.203) (-0.069) Underpricing 0.217*** 0.217*** 0.219*** (4.046) (4.013) (4.065) IPO size 0.083 0.079 0.079 (1.263) (1.196) (1.183) Prestige -0.220* -0.228** -0.234** -0.245** -0.253** -0.260** (-1.928) (-1.997) (-2.005) (-2.150) (-2.226) (-2.234) Ln(IPO age) 0.312*** -0.090 -0.086 -0.097 -0.131 -0.126 -0.138 (2.801) (-1.059) (-1.019) (-1.121) (-1.552) (-1.503) (-1.623) CRSP value-weighted return -0.063 -0.106 -0.076 -0.030 -0.078 -0.046 (-0.195) (-0.325) (-0.232) (-0.091) (-0.235) (-0.136) Total IPOs in the previous four months
0.002*** 0.002*** 0.002*** 0.002*** 0.002*** 0.002***
(2.643) (2.593) (2.601) (2.988) (2.924) (2.919) Ln(syndicate size) 0.249*** -0.078 -0.082 -0.093 -0.043 -0.047 -0.056 (2.370) (-1.057) (-1.103) (-1.214) (-0.590) (-0.643) (-0.743) Fraction of equity held by lead VC post-IPO
-0.003 -0.002 -0.002 -0.003 -0.002 -0.002
(-0.633) (-0.503) (-0.587) (-0.626) (-0.481) (-0.579) Fund type dummy -0.043 -0.056 -0.002 -0.043 -0.059 -0.004 (-0.289) (-0.376) (-0.011) (-0.289) (-0.394) (-0.028) Inverse Mills Ratio -0.457*** -0.518*** -0.449*** -0.423*** -0.488*** -0.411*** (-4.560) (-4.823) (-3.490) (-4.273) (-4.550) (-3.206) Ln(IPO assets) -0.031 (-0.591) Ln(lead VC size) 0.283*** (3.651) Ln(number of companies lead VC has invested in)
0.338***
(3.171) VC investment stage -0.451*** (-3.360) Industry and year fixed effects Yes Yes Yes Yes Yes Yes Wald_test 43.69 46.35 42.69 31.53 34.18 30.18 Loglikelihood -2561 -2559 -2450 -2567 -2565 -2457 No. of observations 516 516 497 516 516 497
32
Table 6 Regressions for the logarithm of the size of the next fund raised by the lead venture capital firm
after acquisition The sample consists of 609 VC-backed companies taken public by IPOs and 824 VC-backed companies exit through acquisitions between 1995 and 2015. Variable definitions are provided in the Appendix. **, **, and * indicate statistical significance at the 1%, 5%, and 10% level, respectively.
Prob(reputable VC =1) (1) (2) (3) (4) (5) (6) Constant -4.730*** 6.573*** 6.416*** 4.485*** 2.779 2.279 3.465*** (-11.164) (10.912) (7.942) (4.491) (1.423) (1.139) (3.698) VC age dummy -0.056*** -0.099* (-2.563) (-1.867) Ln(VC age) 0.033* 0.146** (1.825) (1.970) VC previous M&As 0.418** 0.463*** (2.531) (3.018) CRSP value-weighted return -0.343 -0.288 -0.379 3.682 3.812 -0.698* (-0.801) (-0.670) (-0.887) (0.484) (0.502) (-1.778) Total M&As in the previous four months
0.001 0.001 0.001 0.001** 0.001** 0.001
(0.851) (0.765) (0.979) (2.153) (2.119) (1.258) Ln(MA_age) 0.018 -0.072 -0.087 -0.114 -0.040 -0.032 -0.196* (0.242) (-0.681) (-0.704) (-0.952) (-0.363) (-0.288) (-1.842) Acquisition premium 1.666** 1.740*** 1.794*** (2.889) (3.011) (3.148) Ln(Deal value) 0.072* 0.072* 0.044 (1.685) (1.696) (1.023) Relatedness 0.226 0.229 0.265* 0.174 0.188 0.274** (1.510) (1.527) (1.779) (1.298) (1.398) (1.978) Ln(syndicate size) 0.265*** -0.473*** -0.473*** -0.475*** -0.443*** -0.446*** -0.387*** (2.895) (-3.282) (-3.283) (-3.451) (-3.421) (-3.479) (-3.070) Fund type dummy 0.858*** 0.868*** 0.861*** 0.941*** 0.935*** 1.151*** (3.175) (3.233) (3.235) (3.921) (3.910) (4.663) Inverse Mills ratio -1.484*** -1.475*** -1.282*** -1.380*** -1.334*** -1.023*** (-6.564) (-6.328) (-5.436) (-6.528) (-6.205) (-4.510) Ln(MA_assets) 1.065 (1.535) Ln(lead VC size) 0.230*** (4.272) Ln(number of companies lead VC has invested in)
0.571***
(6.873) VC investment stage -0.395*** (-3.428) Industry and year fixed effects Yes Yes Yes Yes Yes Yes Wald test 36.47 36.52 43.61 103.12 104.16 50.77 No. of observations 739 739 739 739 815 815 815

33
Table 7
Regressions for time from M&A to the lead venture capital firm’s next fund The sample consists of 609 VC-backed companies taken public by IPOs and 824 VC-backed companies exit through acquisitions between 1995 and 2015. Variable definitions are provided in the Appendix. **, **, and * indicate statistical significance at the 1%, 5%, and 10% level, respectively.
Prob (VC reputable =1) (1) (2) (3) (4) (5) (6) VC age dummy 0.238** 0.229** (2.110) (2.296) Ln(VC age) -0.128* -0.115* (-1.671) (-1.695) VC previous M&As -0.109* -0.088* (-1.876) (-1.760) CRSP value-weighted return 0.844*** 0.830*** -2.370 -3.862 -4.005 -4.571 (3.372) (3.310) (-0.421) (-0.826) (-0.858) (-0.964) Total M&As in the previous four months
0.001*** 0.001*** 0.001 0.001 0.002 0.002
(4.241) (4.146) (0.688) (0.803) (0.705) (0.682) Ln(MA_age) 0.086 -0.098 -0.100 -0.022 -0.037 -0.046 -0.048 (1.162) (-1.467) (-1.515) (-0.315) (-0.627) (-0.797) (-0.781) Acquisition premium 0.231 0.223 0.226 (0.776 (0.730) (0.678) Ln(Deal value) 0.031 0.033 0.019 (1.180) (1.256) (0.678) Relatedness -0.061 -0.074 -0.069 -0.045 -0.057 -0.068 (-0.691) (-0.845) (-0.747) (-0.578) (-0.737) (-0.811) Fund type dummy -0.352** -0.358** -0.342** -0.247* -0.237* -0.292** (-2.420) (-2.458) (-2.244) (-1.890) (-1.817) (-2.131) Ln(syndicate size) 0.278*** -0.044 -0.039 -0.016 -0.018 -0.010 -0.017 (3.141) (-0.581) (-0.495) (-0.195) (-0.261) (-0.146) (-0.235) Inverse Mills ratio -0.234*** -0.221*** -0.301*** -0.268*** -0.252*** -0.328*** (-3.101) (-2.908) (-2.890) (-3.853) (-3.612) (-3.490) Ln(MA_assets) 1.018*** (2.970) Ln(lead VC size) 0.241*** (3.890) Ln(number of companies lead VC has invested in)
0.603***
(5.771) VC investment stage -0.393*8* (-3.691) Industry and year fixed effects Yes Yes Yes Yes Yes Yes Wald_test 48.28 46.72 67.67 88.14 85.86 91.04 Loglikelihood -3064 -3065 -2903 -4100 -4102 -3880 No. of observations 629 629 604 806 806 771

34
Table 8
Regressions on the time to exit and firm age at the exit The sample consists of 609 VC-backed companies taken public by IPOs and 824 VC-backed companies exit through acquisitions between 1995 and 2015. Variable definitions are provided in the Appendix. **, **, and * indicate statistical significance at the 1%, 5%, and 10% level, respectively.
Panel B: M&A regressions (1) (2) (3) (4) (5) (6) Time to exit (years) firm age at exit Constant 0.746*** -0.047 0.200 1.991*** 1.564*** 1.774*** (5.238) (-0.291) (1.335) (11.474) (8.029) (9.880) VC age dummy -0.344*** -0.214*** (-6.275) (-3.723) Ln(VC age) 0.255*** 0.130*** (6.698) (3.194) VC previous M&As 0.121*** 0.042* (6.334) (1.745) CRSP value-weighted return 0.303** 0.284** 0.305** -0.035 -0.036 -0.026 (2.307) (2.180) (2.426) (-0.237) (-0.240) (-0.169) Total M&As in the previous four months -0.001* -0.001 -0.001 -0.000 -0.000 -0.000 (-1.758) (-1.566) (-1.240) (-0.467) (-0.346) (-0.182) Ln(syndicate size) 0.435*** 0.414*** 0.416*** -0.043 -0.051 -0.044 (11.119) (10.495) (10.741) (-0.925) (-1.082) (-0.890) Fund type dummy 0.055 0.048 0.025 0.013 0.011 -0.015 (0.690) (0.597) (0.328) (0.151) (0.126) (-0.158) Relatedness 0.066 0.078* 0.075 0.042 0.049 0.048 (1.462) (1.729) (1.643) (0.832) (0.980) (0.920) Industry and year fixed effects Yes Yes Yes Yes Yes Yes No. of observations 810 810 775 810 810 775 Adjusted R2 0.15 0.15 0.15 0.01 0.01 0.01
Panel A: IPO regressions (1) (2) (3) (4) (5) (6) Time to exit (years) firm age at exit Constant 1.111*** 0.522** 0.875*** 2.545*** 2.179*** 2.348*** (6.461) (2.515) (5.033) (20.365) (13.274) (16.840) VC age dummy -0.303*** -0.239*** (-4.027) (-4.257) Ln(VC age) 0.151*** 0.090*** (3.155) (2.761) VC previous IPOs 0.058** 0.058*** (2.356) (3.083) Prestige -0.040 -0.044 -0.062 -0.004 -0.010 -0.023 (-0.617) (-0.663) (-0.883) (-0.067) (-0.165) (-0.370) CRSP value-weighted return -0.064 -0.044 -0.020 -0.032 -0.013 -0.009 (-0.354) (-0.247) (-0.101) (-0.200) (-0.078) (-0.052) Total IPOs in the previous four months -0.003*** -0.003*** -0.003*** -0.001*** -0.001*** -0.002*** (-7.390) (-6.928) (-7.300) (-4.687) (-4.342) (-4.695) Ln(syndicate size) 0.266*** 0.281*** 0.260*** -0.169*** -0.158*** -0.177*** (5.551) (5.916) (5.595) (-4.429) (-4.124) (-4.485) Fraction of equity held by lead VC post-IPO
0.001 0.002 0.001 -0.004 -0.003 -0.004*
(0.517) (0.527) (0.287) (-1.636) (-1.499) (-1.741) Fund type dummy 0.183** 0.224** 0.206** 0.077 0.102 0.088 (2.049) (2.543) (2.329) (1.139) (1.506) (1.280) Industry and year fixed effects Yes Yes Yes Yes Yes Yes No. of observations 592 592 569 592 592 569 Adjusted R2 0.10 0.09 0.08 0.08 0.06 0.07

35
Table 9 Regressions on IPO underpricing and offering size
The sample consists of 609 VC-backed companies taken public by IPOs and 824 VC-backed companies exit through acquisitions between 1995 and 2015. Variable definitions are provided in the Appendix. **, **, and * indicate statistical significance at the 1%, 5%, and 10% level, respectively.
Panel B: M&A regressions (1) (2) (3) (4) (5) (6) Acquisition premium Ln(deal value) Constant 0.031 -0.018 -0.004 2.497*** 2.406*** 2.334*** (1.286) (-0.637) (-0.175) (6.771) (5.959) (6.246) VC age dummy -0.027** (-2.247) -0.088 Ln(VC age) 0.013** (-0.796) 0.012 (2.159) (0.149) VC previous M&As 0.002 0.007 (0.734) (0.163) Ln(MA_age) -0.004 -0.003 -0.001 -0.103 -0.102 -0.073 (-0.758) (-0.649) (-0.200) (-1.365) (-1.327) (-0.962) CRSP value-weighted return -0.008 -0.008 -0.026 0.028 0.032 -0.183 (-0.285) (-0.261) (-1.074) (0.096) (0.109) (-0.616) Total M&As in the previous four months -0.001 -0.001 -0.000 0.001*** 0.001*** 0.001*** (-0.722) (-0.558) (-0.219) (5.611) (5.580) (5.908) Relatedness -0.010 -0.010 -0.009 -0.011 -0.013 0.023 (-1.374) (-1.268) (-1.128) (-0.103) (-0.124) (0.204) Ln(syndicate size) -0.002 -0.002 0.001 0.156* 0.168* 0.131 (-0.302) (-0.310) (0.110) (1.757) (1.874) (1.443) Fund type dummy -0.018*** -0.018*** -0.017** 0.144 0.144 0.101 (-2.626) (-2.650) (-2.416) (0.897) (0.895) (0.600) Industry and year fixed effects Yes Yes Yes Yes Yes Yes No. of observations 593 593 568 810 810 775 Adjusted R2 0.01 0.05 0.03 0.04 0.04 0.04
Panel A: IPO regressions (1) (2) (3) (1) (2) (3) Underpricing Offering size Constant 0.420*** 0.686*** 0.539*** 5.163*** 5.339*** 5.233*** (3.167) (4.244) (3.823) (22.329) (21.311) (21.387) VC age dummy 0.138** 0.109 (2.391) (1.585) Ln(VC age) -0.061* -0.038 (-1.894) (-0.969) VC previous IPOs -0.014 -0.015 (-0.817) (-0.541) Prestige -0.083* -0.081 -0.084 -0.031 -0.028 -0.035 (-1.660) (-1.628) (-1.593) (-0.436) (-0.396) (-0.485) Ln(IPO age) -0.067* -0.076** -0.084** -0.137*** -0.145*** -0.140*** (-1.876) (-2.183) (-2.321) (-2.587) (-2.713) (-2.596) CRSP value-weighted return -0.159 -0.167 -0.180 -1.064*** -1.073*** -1.056*** (-1.068) (-1.136) (-1.173) (-5.466) (-5.493) (-5.274) Total IPOs in the previous four months 0.002 -0.002 0.003 -0.004*** -0.004*** -0.003*** (0.327) (-0.041) (0.342) (-9.487) (-9.822) (-8.821) Ln(syndicate size) 0.032 0.024 0.029 0.008 0.002 -0.004 (1.114) (0.859) (0.941) (0.160) (0.037) (-0.069) Fraction of equity held by lead VC post-IPO
0.001 0.001 0.001 0.002 0.001 0.002
(0.740) (0.677) (0.716) (0.564) (0.518) (0.503) Fund type dummy -0.035 -0.053 -0.037 -0.062 -0.073 -0.061 (-0.540) (-0.786) (-0.545) (-0.740) (-0.859) (-0.701) Industry and year fixed effects Yes Yes Yes Yes Yes Yes No. of observations 563 563 540 592 592 569 Adjusted R2 0.02 0.02 0.01 0.20 0.19 0.18
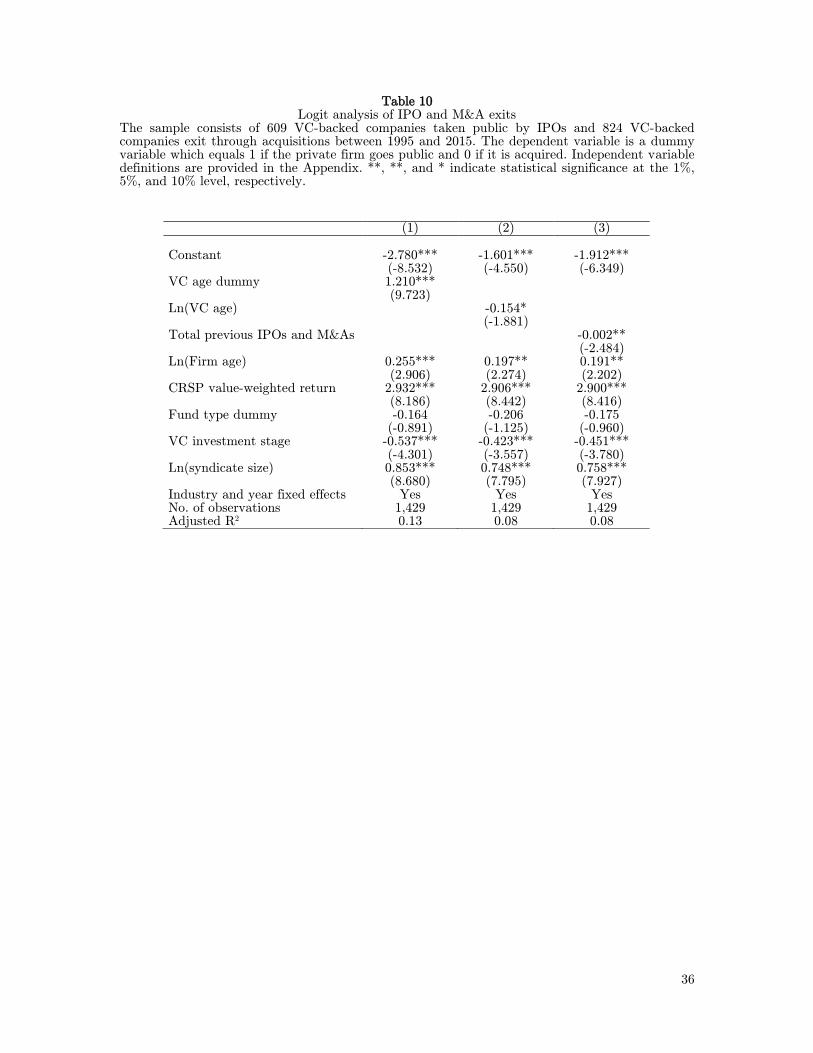
36
Table 10 Logit analysis of IPO and M&A exits
The sample consists of 609 VC-backed companies taken public by IPOs and 824 VC-backed companies exit through acquisitions between 1995 and 2015. The dependent variable is a dummy variable which equals 1 if the private firm goes public and 0 if it is acquired. Independent variable definitions are provided in the Appendix. **, **, and * indicate statistical significance at the 1%, 5%, and 10% level, respectively.
(1) (2) (3) Constant -2.780*** -1.601*** -1.912*** (-8.532) (-4.550) (-6.349) VC age dummy 1.210*** (9.723) Ln(VC age) -0.154* (-1.881) Total previous IPOs and M&As -0.002** (-2.484) Ln(Firm age) 0.255*** 0.197** 0.191** (2.906) (2.274) (2.202) CRSP value-weighted return 2.932*** 2.906*** 2.900*** (8.186) (8.442) (8.416) Fund type dummy -0.164 -0.206 -0.175 (-0.891) (-1.125) (-0.960) VC investment stage -0.537*** -0.423*** -0.451*** (-4.301) (-3.557) (-3.780) Ln(syndicate size) 0.853*** 0.748*** 0.758*** (8.680) (7.795) (7.927) Industry and year fixed effects Yes Yes Yes No. of observations 1,429 1,429 1,429 Adjusted R2 0.13 0.08 0.08