technology disclosure and capital market...
TRANSCRIPT

TECHNOLOGY DISCLOSURE AND CAPITAL MARKET UNCERTAINTY:
THE ROLE OF PATENTS *
Ali Mohammadi,1 Mehdi Beyhaghi,2 and Pooyan Khashabi3
Abstract
While R&D is necessary to create competitive advantage for firms, it can also create
information asymmetry between the management and capital markets, thus leading to forecast
difficulties and uncertainty about firms’ future prospects. Consequently, R&D-intensive firms
experience pressure from capital markets in the form of increase in cost of capital,
underinvestment, and undervaluation. We test whether patenting, as a technology disclosure
mechanism about firms’ R&D, is an effective strategy for mitigating such uncertainties. By taking
advantage of a quasi-natural experiment created by the American Inventor’s Protection Act (1999),
we provide causal evidence that information disclosure through patents does reduce uncertainty
about the firm in the capital market. The mechanism, however, is less effective when patents are
scientifically broader and entail higher ex-post value.
Keywords: Disclosure Strategy, Patents, Capital Market Uncertainty, Information asymmetry
* We owe thanks to Stefano Baruffaldi, Nada Basir, Victor Bennett, Massimo Colombo, Tolga Demir, Alfonso
Gambardella, Thorsten Grohsjean, Tobias Kretschmer, Johannes Luger, Virgilio Failia, Deepak Hegde, Myriam
Mariani, Alex Oettl, Thomas Rønde, Vahid Saadi, Farzad Saidi, Kourosh Shafi, Tim Simcoe, Olav Sorenson, Keyvan
Vakili, Theresa Veer, and seminar participants in the Annual Meeting of the Academy of Management, Copenhagen
Business School, the DRUID Conference, Ludwig-Maximilians-Universität, Munich Finance Day, Politecnico di
Milano, SKEMA, University of Utrecht, and University of Gothenburg. The views expressed in this article are solely
those of the authors. They do not necessarily reflect the views of the Federal Reserve Bank of Richmond or the Federal
Reserve System. 1 Royal Institute of Technology (KTH) - Department of Industrial Economics and Management (INDEK) and Swedish
house of finance. [email protected] 2 Federal Reserve Bank of Richmond. [email protected] 3 Ludwig-Maximilians-Universität (LMU), Munich School of Management, Institute for Strategy, Technology and
Organization, Munich, Germany. [email protected]

INTRODUCTION
Publicly traded firms in knowledge-intensive industries face an important dilemma. On the one
hand, gaining competitive advantage and outperforming competitors is only possible through
innovation which is achieved by investing in R&D and intangible assets (Cohen and Levinthal,
1990; Helfat, 1994; Katila and Ahuja, 2002). On the other hand, R&D investments make assessing
future prospects of these firms difficult for external stakeholders. While additional information is
required to evaluate such investment projects, their progress details and output is closely protected.
Therefore, R&D investments count as a source of information asymmetry between corporate
insiders and external stakeholders (Coff and Lee, 2003; Hall and Lerner, 2009). High engagement
in R&D therefore increases uncertainty in assessing firm’s value and its future market position
among capital market players (Scherer and Ross, 1990; Myers and Majluf, 1984). Because of this
uncertainty, R&D-intensive firms undergo a pressure from capital markets due to increased cost
of capital, underinvestment, and undervaluation (Laamanen, 2007; Litov, Morten and Zengers,
2012; Myers and Majluf, 1984) which can eventually lead to sub-optimal R&D investment, and
sacrifice of long-term value in favor of short-term earnings (Benner and Zenger, 2016; Graham,
Harvey, and Rajgopal, 2005).
In this paper, we focus on patenting and investigate whether, and under which conditions,
patenting can reduce the uncertainty created due to information asymmetry about R&D-intensive
firms in the capital market. We discuss how patent applications, as standardized sources of
disclosure on a firm’s new intangible assets, can mitigate the information asymmetry regarding
R&D projects. Hence, by reducing uncertainty, patenting may eventually serve as a strategy to
mitigate the above-mentioned dilemma for R&D-intensive firms.

Disclosure of information, through channels such as annual accounting statements or press
releases, is one of the few available strategies that R&D-intensive firms use to mitigate the costs
of uncertainty in raising capital (Balakrishnan et al., 2014; Bhattacharya and Ritter, 1983,
Washburn and Bromiley, 2014). Prior research shows that R&D-intensive firms benefit from
disclosure, as it reduces the uncertainty about them by helping capital market players, i.e. financial
analysts and shareholders, to better assess the firms’ future performance. Nevertheless, the rising
contribution of intangible and knowledge assets in firms’ value (Haskel and Westlake, 2017) has
made common accounting-based disclosure channels less informative and relevant about firms'
future prospects (Cañibano, Garcia-Ayuso, and Sanchez, 2000; Gu and Lev, 2017— see also
“Intangible Assets Are Changing Investment” 2017, The Economist). This calls for alternative
disclosure channels better suited to R&D-intensive industries. So, can patents be this suitable
disclosure channel?
A suitable disclosure channel for R&D-intensive context should have two conditions: first, it
should entail comprehensive information about firms’ new intangible assets. Second, it should be
capable of conveying this information to capital markets effectively and with relatively low cost.
Regarding the first, patents are important and credible sources of information about innovation. In
fact, the IP literature underlines disclosure of innovation as one of the two key functions of patents
(see e.g. Haeussler, Harhoff, and Mueller, 2009; Hall et al., 2014; Long, 2002; Williams, 2017).
Based on this feature, patenting is expected to be a suitable disclosure channel. However, there is
skepticism about the second condition, as some regard the information in patents as too technical,
irrelevant, and incomprehensible for capital market players (see e.g. Haeussler et al., 2009; Heeley,
Matusik and Jain, 2007). There is little academic evidence, however, about whether patents’
technical information is effectively digested in capital markets. Empirically, investigating the

causal effect of disclosure through patents in capital markets brings two key challenges. First,
patenting is a managerial choice, and therefore endogenous (James, 2014; James and Shaver,
2016). As Healy and Palepu (2001, p. 431) point out, “disclosure changes are unlikely to be random
events” and therefore, “it is difficult to draw strong conclusions about the direction of causality.”
Second, besides their disclosure function, patents have a protection function for innovation. So,
disentangling the effect of these two functions is a methodological challenge, and thus, is very
limited in the literature (see e.g. Hsu and Ziedonis, 2013). In this study, we take advantage of a
quasi-natural experiment, the passage of the American Inventor’s Protection Act of 1999 (AIPA),
to address the above challenges. Prior to the passage of AIPA, firms that applied for a patent were
not required to disclose information about their application before the patent’s grant date. As of
November 29, 2000, AIPA required the United States Patent and Trademark Office (USPTO) to
publish all US patent applications within 18 months of the first filing date. This exogenous shock
was unlikely to affect the protection function of patents, as the exclusive rights of the patentees to
practice inventions upon patent grant, stay unaffected. But it did have a significant impact on the
information disclosure function of patents in applications (Hegde and Luo, 2017). We then take
advantage of the exogenous variations in the disclosure effect of AIPA, based on Pre-AIPA
industry differences in filing-to-publication timing. While in some industries, there is a shorter
period between filing to publication, so that the disclosure effect of AIPA is small, in other
industries the period between filing to publication is longer, so that AIPA has a bigger disclosure
effect. This structure helps us to employ a difference-in-differences identification strategy, which
enables us to investigate the causal effect of disclosure through patent applications.
We use financial analysts’ earnings forecast errors as a proxy for the uncertainty about the
firm in capital markets (Gentry and Shen, 2013; Gu and Wang, 2005; Gu and Wang, 2005; Nicolai,

Schultz and Thomas, 2010). Our analysis shows that patent applications after the passage of AIPA,
compared to the patent applications before AIPA, brought a significant reduction in the uncertainty
about the applicant firm (lowering earnings forecast errors). The effect is significantly larger for
firms with above-industry R&D intensity and firms that increased their R&D intensity over the
analysis period. However, we find that firms filing broader and more valuable patents benefit
significantly less from the disclosure function, as uncertainty about their earnings are reduced by
less. An implication of this finding is that financial analysts assess the lower-value and less broad
patents more accurately, but their assessment of broader and higher-value patents shows larger
errors. This finding is consistent with the research stream showing that more novel and complex
technologies are less favored by capital markets, as they are costlier to be assessed by financial
analysts (Benner, 2010). This result presents a boundary condition on the strategic use of patents
to mitigate the uncertainty costs of R&D.
We run several analyses to test the robustness and underlying mechanisms in our findings. We
also conduct several analyses to check for alternative explanations and the validity of difference-
in-differences analysis. We also address possible overlap between AIPA and the dot com bubble.
This study contributes to the literature on R&D strategy, disclosure and patenting. Prior
literature has viewed the disclosure function of patents to target technology customers by
facilitating the markets for new technologies. It also viewed the disclosure function of patents as
a mechanism that helps inventors by facilitating cumulative innovation on previous technological
advancements. Our study introduces an additional function of patent disclosure targeting capital
markets, through reducing information asymmetry and uncertainty. As firms’ decision to patent
concerns a trade-off between benefits and costs of patenting (Bhattacharya and Ritter, 1983; Hall et
al, 2014; Somaya, 2012), our work contributes to the stream of research regarding patenting

decisions. By doing this, we present the effectiveness of patenting as a strategy to mitigate the
uncertainty costs of R&D, and discuss its limitations. Finally, by providing evidence about
strategic disclosure through patents in capital markets, our work contributes to the recent stream
of research studying disclosure from a strategic perspective (see e.g. James and Shaver, 2016;
Stern and James, 2016).
THEORY
R&D and uncertainty pressure from capital markets: a dilemma
R&D projects are inherently uncertain (Leiponen and Helfat, 2010). There are some aspects of
R&D projects that are unknown to both corporate insiders (firm management and the R&D team)
and externals— e.g. uncertainty regarding new scientific discoveries. There are however other
aspects of R&D projects on which insiders possess and develop knowledge, but this knowledge is
not typically diffused to outsiders – e.g. details on a recent developed technology, or an R&D
project failure. These aspects generate information asymmetry between managers and external
investors and, unlike the former, can be reduced by provision of relevant information from the side
of the firm. Our theory and arguments focus on how and under which conditions, this information
asymmetry can be reduced by the firm.
Why can the information asymmetry caused by R&D investments be value destroying? R&D
investments disrupt firms’ smooth flow of earnings in the short run. Therefore, external
stakeholders could become concerned about whether these investments are actually promising, or
merely a waste of resources. Relative to firm managers, external stakeholders have a harder time
to assess the quality of R&D efforts, their incremental progress, their chances of success, and the
prospects of their outcomes (Arora and Gambardella, 2010; Coff and Lee, 2002; Levitas and
McFayden, 2009; Myers and Majluf, 1984). Therefore, while R&D activities in a firm require

more information to evaluate the firm’s prospects, externals seldom have access to this
information. Each R&D investment, therefore, becomes a source of information asymmetry
between the management and the capital market (Aboodi and Lev, 2000; Bhattacharya and Ritter,
1983; Coff and Lee, 2003). Concurring, empirical studies have shown that corporate insiders,
compared to externals, can better identify mispricing on their stocks, and gain significantly more
in stock trading (Aboodi and Lev, 2000; Coff and Lee, 2003). Insufficient information makes it
difficult to analyze R&D-intensive firms, showing itself in forecast errors of financial analysts,
who are not able to predict the future prospects of these firms precisely. This gives rise to
uncertainty about the value of the firm in capital markets. This notion of uncertainty is in line with
the definition of Milliken (1987), as “an individual’s perceived inability to predict something
accurately”. In this framework, “an individual experiences uncertainty because he/she perceives
himself/herself to be lacking sufficient information to predict accurately…” Based on this
definition, R&D increases uncertainty about firms in capital markets. Empirical studies also
confirm that forecast errors by capital market analysts increase with high investment in R&D and
intangible assets (Miller, 1977; Ackert and Athanassakos, 1997; Gu and Wang, 2005; Kothari et
al., 2002). The relation between R&D and uncertainty, which is established in the literature, serves
as the baseline hypothesis in our setting.
Baseline hypothesis: R&D intensity is positively associated with uncertainty about firms
in capital markets.
In theory, with a perfectly complete market, investors would be able to fully diversify their stocks
and hedge the risks. However, in reality the markets are far from being complete. Therefore, capital
markets do not favor uncertainty. Investors, being risk-averse, would underinvest on uncertain
stocks, or demand a premium for bearing the uncertainty (Bartov et al., 2002, Diamond and

Verreecchia, 1991; Litov et al., 2012). Therefore, public firms pursuing higher R&D are more
likely to be undervalued at least in the short run, compared to their competitors with lower R&D
spending (Myers and Majluf, 1984; Heeley et al., 2007). Benner and Ranganathan (2012) and
Zuckerman (2000) argue that because strategies such as high focus on R&D can be associated with
lower market values, investors could take action by putting pressure on the firm’s management.
They can go as far as CEO dismissals (Puffer and Weintrop, 1991; Wiersema and Zhang, 2011).
To avoid such adverse consequences, managers, who typically have strong career concerns, may
react with strategies that in the long run negatively affect shareholders. These strategies involve
cutting back on R&D and innovation spending to satisfy capital markets’ short-term expectations
and to lift the pressure on management (Gentry and Shen, 2013; Scharfstein and Stein 1990). The
consequences of such strategies are sub-optimal R&D investments, suppression of innovation, and
sacrificing the long-term competitive advantage in favor of short-term earning. A large-scale
survey by Graham et al. (2005) reports that 78% of managers admit to decreasing R&D investment
or avoiding to start new projects, in favor of smoother earnings. Similarly, other empirical studies
suggest that managers frequently sacrifice, at least some, long-term investments in response to
pressure from the capital markets (Bartov, 1993; Healy and Wahlan, 1999). Benner and Zengers
(2016) featured this phenomenon more generally as “the lemons problem in markets for strategy’,
where they argue that information imperfections can enable routine and less value creating
strategies to be selected over higher value alternatives.
Disclosure as a solution to uncertainty pressure: the case of patenting
Because innovation is a necessary driver of performance in high-technology industries, it is not
sustainable for firms to forgo this input just to avoid the consequent pressure. Public firms need to
design strategies to reduce the uncertainty shaped by innovative activities. One strategy is
disclosing more information to decrease information asymmetries, and to reduce the uncertainty
associated with their firms in capital markets (Diamond, 1985; Diamond and Verrecchia, 1991;
James, Leiblein, and Lu, 2013; Narayanan et al., 2000). There is literature that provides evidence
of public firms disclosing information on a wide range of topics, including their recent progress,
new product attributes, and scientific publications (Amir and Lev, 1996; Jones, 2007; Narayanan
et al., 2000; Simeth and Cincera, 2017; Washburn and Bromiley, 2014). Financial analysts closely
follow all the statements made by corporates and heavily use information disclosed by them to
forecast the future value of firms, which they disseminate widely to investors (Healy and Palepu,
2001). This institutional function of analysts is central in making firms’ disclosures effective in
the capital market. Graham et al. (2005) report that 81.9% of managers disclose information
voluntarily with the motive to “reduce the information risk that investors assign to our stock.”
They also report that a considerable share of managers believe that disclosure “increases the
predictability of our company’s future prospects”. Consistent with the above, researchers have
documented empirical evidence for a positive association between a firm’s information disclosure
and its stock prices (Botosan and Plumlee, 2002; Jones, 2007), its liquidity (Balakrishnan et al.,
2014), and a negative association between a firm’s information disclosure and its cost of capital
(Botosan and Plumlee, 2002; Jones, 2007).
Empirical research on disclosure has focused on channels such as annual accounting
statements, conference calls, analyst briefings, and press releases (Botosan and Plumlee, 2002;
James and Shaver, 2016; Stern and James, 2016; Washburn and Bromiley, 2014). Nevertheless,
the rising role of intangibles in knowledge-intensive industries and their growing contribution to
firms’ value, has made traditional accounting based information less relevant to forecasting future
market prospects (Gu and Lev, 2017; Cañibano, Garcia-Ayuso, and Sanchez, 2000). An important
source of information, that is more relevant to firms’ intangible and knowledge assets, and has
been generally overlooked, is patent documents. Disclosure of information and provision of legal
protection, are two main functions of the patent system (see Long (2002) for an extensive
discussion). By securing the legal protection for inventions, patents encourage voluntary disclosure
of knowledge and facilitate the functioning of market for technologies and ideas (Anton and Yao
2002; Arora and Gambardella, 2010; Gans, Hsu, and Stern, 2008; Hegde and Lou, 2017; William,
2017). Patents are excellent sources of information about firms’ innovative processes and products.
Patent documents typically contain valuable and key information about the firm’s corresponding
R&D projects and their development. Therefore, patents can demonstrate the value of technology
possessed by firms (Stephan, 1996). The information disclosed through official patent applications
is more credible than other disclosure sources, since inaccurate claims may risk delay or denial of
patent grant. As Hegde and Lou (2017) argue about patent applications, “…disclosure through an
official, standardized, and centralized repository may affect market transactions in ways that
cannot be achieved through [other] voluntary disclosure”. So when the patent filings information
is publicly disclosed, corporate externals may use the technological information in these filings to
evaluate the firm’s investment payoff, and future position (Hall, Jaffe, and Trajtenberg, 2005).4
It is not immediately obvious from the literature that disclosure of information contained in patent
documents can reduce uncertainty in capital markets (see e.g. Haeussler et al., 2009; Heeley et al.,
2007). This skepticism stems from the technicality of language in patent documents that were
originally written to be understood by someone who is “skilled in the art” (Patent Law 35 U.S.C.
4 A related stream of research has studied the effect of patenting through signaling (Spence, 1973). This mechanism,
however, is different compared to the disclosure mechanism. Signaling is concerned with providing signals, which
can be used for inference on unobservable factors (e.g. a startup’s overall quality). Disclosure is about revealing
information on a particular matter directly – R&D output in our case. Signaling is generally relevant to young startups
where there is very little observable information or records available about them. Therefore, signaling literature mostly
targets startup-relevant issues such as startup funding, survival, and IPO.

112.), and not for average capital market players. Thus, this form of disclosure could only be
effective if agents in the financial sector are specialized and skilled, and therefore able to
understand and interpret such informational input. Despite this skepticism in the literature, there
is indeed growing evidence showing that science graduates including PhDs, postdocs, and former
academic faculty are being employed as financial analysts. As a recent article in Science highlights,
many investment firms are attracting scientists “…who combine strong analytical skills with deep
scientific knowledge to advise on investments in science-based businesses. These scientifically
trained financial analysts fulfill an important function: assessing the economic value and predicting
the future performance of products, companies, and industries” (Swarup, 2008 p.1266). An
interviewed analyst with post-doctoral education mentions that: “…my knowledge […] enabled
me to make judgment calls about the likelihood of a product in R&D making it to the market”
(Swarup, 2008, p. 1266). Also, a Biotech analyst who has a PhD in protein engineering, remarked
that key to this career is the ability of “…translating the language of science into the language of
investment”. The Institutional Investor Magazine annually ranks the best analyst in each industry
and, to illustrate, the star analyst in biotechnology for 11 consecutive years has been a medical
doctor from the Johns Hopkins University School of Medicine. Thus, one can assume that financial
analysts in specialized R&D-intensive industries, are actually hired to go through and analyze
information in scientific documents such as patents, to generate more accurate forecasts based on
these sources. In line with these bodies of evidence, various practitioner guides for financial
analysts classify patents as one of the “economic moats” that needs to be analyzed to identify the
value of a firm (see e.g. Dorsey, 2009). Thus, we expect to find that patents reduce the information
asymmetry between firms and capital markets, and consequently reduce the uncertainty about
them.

H1a. Patents reduce uncertainty about public firms in capital markets through their disclosure
function.
Hypothesis 1a states that public firms benefit from disclosure through patents in capital markets.
We further argue that this benefit is more pronounced for public firms with higher R&D intensity.
With higher R&D intensity, more information is required to measure the value of the firm (Heeley
et al., 2007). Accessing information and accurately evaluating the future prospects of R&D
intensive firms becomes increasingly costly for financial analysts. This leads to more errors than
otherwise in forecasting, and to higher uncertainty about a firm’s value. As public firms with
higher R&D experience higher uncertainty cost, we expect that they will also benefit more from
disclosure through patents. Thus, we hypothesize:
H1b. The disclosure function of patents in reducing uncertainty is more effective for firms with
higher R&D intensity.
It is important to note that patents differ significantly in their characteristics (Gambardella,
Harhoff and Verspagen, 2008; Hall, Jaffe and Trajtenberg, 2005). For instance, while a large share
of patents have small value, small fraction of patents are extremely valuable. Prior literature has
argued that patents ex-post value is correlated with novelty and complexity of technology (Ahuja
and Lampert, 2001). We argue that the technological complexity and scientific broadness of
valuable patents can affect their information conveying mechanism to capital market, and to
financial analysts specifically. Valuable patents are usually related to wider technical fields
(Lerner, 1994, Harhoff and Wagner, 2009), or are built on relatively broader sets of scientific areas
(Trajenberg, Henderson and Jaffe, 1997). For financial analysts who specialize in certain and
narrow fields, understanding the precise future prospects of a broad patent can be challenging and
costly. Also, more valuable patents are likely to entail more novel and complex knowledge in
scientific frontiers, in which analysts could lack the expertise to analyze, or would need to exert
more costly effort to understand (Benner, 2010). Besides, technological novelty itself increases the
uncertainty in valuation as it increases the likelihood of being among the outliers of impact
(Verhoeven, Bakker and Veugelers, 2016). These factors (i.e. broadness, and value) which in
general are closely connected to technological complexity and novelty of patents, distort the
disclosure function of patents. Thus, capital market analysts are likely to make both upwards and
downwards errors when evaluating public firms filing broader and higher value patents. As a result,
disclosure via patenting as a partial solution to reduce the uncertainty pressure associated with
R&D, can be less effective for their cases. Thus, we hypothesize:
H2a. The disclosure function of patents in reducing uncertainty is less effective for firms
issuing scientifically broad patents.
H2b. The disclosure function of patents in reducing uncertainty is less effective for firms
issuing patents with higher value.
RESEARCH SETTING AND METHOD
Disclosure shock: the American inventors protection act
Our theoretical discussion is primarily concerned with disclosure through patents. To test for
the effect of disclosure, we need a change that affects the disclosure function of patents, without
affecting their protection function. The American Inventor’s Protection Act, serves well for this
purpose, as we explain in details below.
Before 2000, there was a key feature in the US patent system that made it quite exceptional
compared to the rest of the world. Unlike other major patent systems (e.g., in Japan or Europe),
patent application details were publicly disclosed in the US, only after the patent had been granted

(Gallini, 2002). In theory, this could have taken up to 20 years (Graham and Hegde, 2015). This
feature, postponed the disclosure function of patenting to the grant date, which was typically a few
years after the application date. The American Inventor’s Protection Act (AIPA) was a new IP law
passed by Congress and effectuated from 29 November 2000, which required all the patent
applications filed in the US to be laid open for public inspection 18 months after the initial
application date, regardless of the patent being granted. 5 This act harmonized the US patent law
with the rest of the world. AIPA was designed to facilitate early disclosure of inventions and
support inventors by reducing the probability of them inadvertently working on a technology that
infringed on a part of another pending patent (Gallini, 2002). The enforcement of this act, as an
exogenous shock, disclosed key information about firms’ R&D output, since patent applications
include credible information about an invention’s existence, technical aspects, and scope (Graham
and Hedge, 2015). Therefore, and as Williams (2017) argues, AIPA provides a suitable and a
natural setting for analyzing the effect of disclosure. Recent studies have already used AIPA as an
exogenous shock to technology disclosure (see e.g. Hegde and Lou, 2017; Mohammadi and
Khashabi, 2017; Saidi and Zaldokas, 2017).
Regarding the effectiveness of AIPA, one might wonder if firms voluntarily disclosed their
technological details before AIPA through other channels – e.g. by posting on their webpage or
issuing reports. Nevertheless, this practice is very uncommon. Hegde and Lou (2017) discuss
several reasons for this behavior. First the information disclosed through official patent
applications is more credible than that in other disclosure channels — including web posting—
because the technology holder may risk delay or denial of their patent applications by making
5 Applicants in US patent applications could still opt for secrecy by submitting a request to the USPTO any time before
expiry of 18 months since the application date. However, Graham and Hedge (2015) show that a very small percentage
of patent applications in the US opt for pre-grant secrecy.

imprecise claims. Second, patent publications are systematically catalogued, and are easier to be
accessed and searchable through centralized repositories. This centralized repository will also
enable capital market players to find and compare relevant technologies against each other. This
channel of disclosure can reduce the search costs more effectively than other channels for capital
market players. Third, due to verifiability of disclosure through patent publication, the holder of
the disclosed technology can sue others for potential infringements and demand for remedies for
the period between the publication and the patent grant. This recourse limits the misappropriation
concern, and is not available for technology disclosures through other channels, which is another
reason why firms did not disclose before AIPA. US patent system allows for a short “general grace
period” – typically 12 months. Any technology that is publicly disclosed beyond this period is not
eligible to be patented, as it is regarded as “prior art” (Franzoni and Scellato, 2010). Worldwide
International Patent Office (WIPO) and The European Patent Office (EPO) do not consider the
grace period. So disclosing the invention prior to patent filing makes it count as “prior art” and
ineligible to receive legal protection from these patent systems. This factor also strongly
discourages firms from disclosing their inventions – through web posting and similar channels—
before filing it as a patent application.
The disclosure effect of AIPA on capital markets was not uniform across industries. As Saidi
and Zaldokas (2017) argue, in industries with longer time lags between application and patent
grant, AIPA made a more significant impact in disclosing information about firms, than otherwise.
In industries where patent grants happened soon after their application, AIPA’s effect, which
assured a maximum lag of 18 months, was less significant.6 To illustrate, we can compare a case
6 There is no evidence that variations in application to grant lags are linked to strategic decisions of firms, but most
likely a result of technical complexities and requirements of the patent review process in that industry.
where average lags between application and patent grant were 12 months, to a case where average
lags between application and patent grant were 24 months. For the former, prior to AIPA analysts
could access the content of all patent documents filed in the foregoing year and earlier. However,
for the latter, prior to AIPA the analyst had access to content of all patent documents filed in the
foregoing two years and earlier. Hence the information set of analyst in analyzing the former case,
is larger than the latter case. The effect of AIPA which harmonizes the time of disclosure is larger
for the case that lags between application and patent grant prior to AIPA, were larger. Following
Saidi and Zaldokas (2017), we consider industry level differences in patents’ application-to-grant
lags, as a source of exogenous variation in the intensity of AIPA effect. Hence, in our empirical
analysis, the treatment group variable (Treatment) is defined as a continuous variable at industry
level (based on SIC 4-digit codes7), and it measures the mean difference in years between the
application and the grant date, across all patents granted to publicly listed firms in the respective
industry between 1995 and 2000. In the section “Internal Validity of Difference-in-difference
Analysis” we report several additional analyses to verify suitability of AIPA as our identification
strategy.
Sample and data sources
We build our sample by merging three sources of data: (i) Standard and Poor’s Compustat on
publicly traded firms in the USA, (ii) the Institutional Brokers Estimate System (I/B/E/S) on
financial analysts, and (iii) the Kogan et al. (2017) patent database. We extract information
regarding the financial statements for all publicly traded manufacturing companies in the United
States (Standard Industrial Classification (SIC) 2000-3999) from Compustat until the end of 2006.
7 In the robustness check we also use SIC 2-digit codes, which yield very similar results. These analyses are available
upon request.

Following the related literature (Chen and Miller, 2007; Gentry and Shen, 2013), in extracting firm
data, we considered the following criteria for selecting a sample firm: (i) the firm has total assets
of more than $10 million; (ii) it does not report R&D expenses amounting to more than sales, and
(iii) it is in an industry, defined as four-digit SIC codes, with at least five companies. Next, we
match our sample firms with the patent database created by Kogan et al. (2017),8 which contains
information on patent applications and grants, the identity of patent assignees, and citations. This
dataset consists of all US patents granted during the period 1926-2010 (7.8 million patents). The
database has PERMNO identifiers for each assignee that allows for matching with firm level
financial data extracted from the Compustat. Lastly, we use I/B/E/S to extract data on analysts’
earnings forecasts, and we match the firm forecasts with the two other data sources. Our final
sample includes 6,536 firm-year observations of 1,042 firms, between 1995 and 2005, which had
at least one patent before and one patent after AIPA. We limit the sample to this period since the
AIPA was enacted in November 2000, which is the middle point of our analysis window.9
Variables
Uncertainty associated with a firm in capital market. As our key dependent variable, we
measure the level of uncertainty that is associated with a public firm in capital markets. Since lack
of information about a firm can give rise to uncertainty about its prospective value, it is likely to
increase the error in financial analysts’ earnings forecasts. The dependent variable measures the
ex-ante perceived uncertainty (Bromiley, 1991) by financial analysts, which can be reduced by
accessing the relevant information (Milliken, 1987). Following prior studies (Gu and Wang, 2005;
8 Available at https://iu.app.box.com/patents. 9 In the robustness check we eliminated year 2000 from our sample. Results remain similar and are available upon
request. We also changed the time period to 1996-2005, again finding results to be similar.

Nicolai et al., 2010), we measure the forecast error as the absolute value of the difference between
the last forecast provided by the analysts and the actual earning, normalized by actual earning.
𝐴𝑛𝑎𝑙𝑦𝑠𝑡 𝑓𝑜𝑟𝑒𝑐𝑎𝑐𝑡 𝑒𝑟𝑟𝑜𝑟𝑖𝑡 = (∑ |(𝑎𝑐𝑡𝑢𝑎𝑙 𝐸𝑃𝑆𝑗𝑖𝑡−𝐸𝑃𝑆 𝑓𝑜𝑟𝑒𝑐𝑎𝑠𝑡𝑖𝑡)
𝑎𝑐𝑡𝑢𝑎𝑙 𝐸𝑃𝑆𝑖𝑡| 𝑁𝑖𝑡⁄ ) (1)
In equation (1), EPS stands for the earnings per share, subscript i refers to firm i, subscript j
refers to analyst j and subscript t refers to time (fiscal year). 𝑁 refers to number of analysts
following firm i at time t. In each year, analysts could issue more than one forecast for a firm;
however, it is shown that markets assign higher value to the last forecast preceding the actual
earnings announcement, as it is regarded to be the most updated and precise one (Bartov et al.,
2002). So, to measure 𝐸𝑃𝑆 𝑓𝑜𝑟𝑒𝑐𝑎𝑠𝑡𝑖𝑡, we use the last forecasts before the end of the fiscal year
(Gentry and Shen, 2013). Using the absolute value helps us avoid the possibility of negative and
positive values canceling each other out, and also helps us capture the uncertainty and deviations
in the forecast (both positive and negative). For each year we use the mean of the analyst’s forecast
error for all analysts covering the firm. In our sample there is, on average (median), a gap of about
37 (27) percent between analyst earnings forecast and actual earnings (analyst forecast error).
Alternatively, as a robustness check, we also use the median of analyst forecast error. We also
used the other proposed measures such as standard deviation of analyst forecast error (Bromiley,
1991), coefficient of variation in analyst forecasts (Bromiley, Rau, and Zhang, 2017; Brown,
Richardson and Schwager, 1987) and we used normalization by end-of-the year price per share
(Miller and Reuer, 1996) instead of the actual EPS. The results are very similar, and available upon
request.

Disclosure shock variables. The first independent variable for our difference-in-differences
strategy, is the shock dummy (Post-AIPA), taking the value of one for years after the U.S enacted
the AIPA (after 2000) and zero for years before that.
For building the treatment variable, following Saidi and Zaldukas (2017), we define
Treatmenti at the industry level (4-digit SIC codes), and measure the mean difference in years
between the application date and the grant date, across all patents granted to publicly listed firms
in the respective industries between 1995 and 2000. To do so, we first calculate the measure in
months, and then transform it to years by dividing it by twelve.10 In our sample, the treatment
variable is on average 2.3 years (27 months).
R&D intensity. To test our baseline hypothesis, following Chen and Miller (2007), we use
R&D expenditures divided by sales as a proxy for R&D intensity. R&D intensity captures the
importance of R&D and knowledge creation in firm’s strategy (Cohen and Levinthal, 1990). The
average firm invests 6.2 percent of their sales in R&D. In our sample, firms invested on average
$204 million in R&D, and had total sales of $3,334 million. To ensure our results are not driven
by the denominator, as a robustness check we also used R&D expenditure divided by total assets
(Levitas and McFadyen, 2009). The results stay the same.11 Approximately 13 percent of our
observations have missing values in R&D expenditure. Following prior research, we replace the
missing values with zero (Gentry and Shen, 2013, Henderson, Miller, and Hambrick, 2006). The
underlying assumption is that R&D expenditures are negligible for these firms. However, to ensure
10 As an alternative treatment, we created an ordered variable which assigns a value from 1 to 4, for each quartile of
our continuous treatment variable. We also, in order to remove the variation for treatment variable smaller than 1.5
years (18 months), replaced the treatment variable with 1.5 whenever the treatment variable is less than 1.5 years. In
both cases results are very similar, and they are available upon request. 11 In our robustness check we also use R&D intensity relative to industry level R&D intensity. Results are available
upon request.

that our results are not driven by this assumption we ran a separate analysis including only the
firms that report their R&D expenditures and found very similar results.12
Control variables. We include several control variables that could affect analyst forecast errors.
First, we include the stock of patents measured as number of patent applications in the last three
years (natural logarithm+1).13 Firms in our sample have on average (median) 163 (16) patent
application in the preceding three years. The ownership of firms might also affect forecast error.
We include institutional ownership, which measures the share of ownership by institutional
investors in our analysis. The institutional investors are sophisticated investors who are able to
monitor managers and reduce uncertainty about firm prospects by sending certification signals. In
our sample, on average, institutional investors own 52 percent of a firm’s equity. The number of
analysts that cover a firm can increase the level of publicity firm gets, which in turn can increase
scrutiny by investors. Hence, we include analyst coverage in our model, which measures the
number of security analysts tracking and issuing earnings forecasts for a firm. On average, 10
analysts cover each firm in our sample. Further, cash holdings provide flexibility for innovative
firms and can help them deal with unpredicted issues. Cash holding can affect the uncertainty
about firm earnings forecasts. We include cash in our model, measured by the natural logarithm
of cash balance at the end of a fiscal year in USD millions. Firms, on average, hold $360 million
in cash. The probability of bankruptcy can also affect the uncertainty in analyst forecasts. Hence,
we include Altman’s Z (Altman, 1968) as a measure of a firm’s distance from bankruptcy.14
Altman’s Z on average is equal to 5.2 which implies that the average firm is in the safe zone
12 Moreover, we obtained similar results when we included a dummy for firms that do not report R&D investment. 13 As alternatives we also used number of patents in the previous year, and number of patent applications in the current
year. Results are very similar, and are available upon request. 14 The Altman’s Z is calculated as follows: Altman’s Z = (1.2*(Working Capital / Total Assets) + 1.4*(Retained
Earnings / Total Assets) + 3.3*(Earnings before Interest and Taxes / Total Assets) + 0.6*(Market Value of Equity /
Total Liabilities) + 0.999*(Sales/ Total Assets)). The higher the Altman’s Z, the lower the risk of bankruptcy.

(Altman, 1968). Similarly, the performance of a company in comparison to its competitors can
shape analysts’ earnings forecasts. We measure the performance as return on assets (ROA),
defined as the ratio of net income before extraordinary items to average value of assets. We include
in our model the difference between performance of a firm in the preceding year, and the average
industry level ROA in the four-digit SIC code. Firms in our sample have, on average, 1.7 percent
larger ROA than the average of industry. We also include two time varying characteristics of
industry (four-digit SIC) to capture uncertainty in a firms’ market, namely the industry level
analyst forecast error, and the industry sales growth. In order to take macro-economic changes
into account that may affect earnings forecast we also include year fixed effects.15 Appendix 1
reports all variables and their definition. Table 1 reports descriptive statistics including mean and
standard deviation in addition to correlation of variables.
[Table 1 about here]
Method
To examine whether or not analysts’ earnings forecast error is affected by information disclosure
of patent documents due to enactment of AIPA, we use a difference-in-differences strategy. This
method allows us to estimate the effect of treatment on the analysts’ forecast error by comparing
what happened to the treatment group before and after the treatment, against what happened to the
control group, in the same period. Despite the continuous nature of the treatment variable in our
model, the interpretation remains similar to a simple binary treatment model (Angrist and Pischke,
2009). Using difference-in-differences, we estimate the following specification in equation (2).
15 In a separate analysis, we also included Tobin’s Q, total assets, Debt to assets and firm size as natural logarithm of
sales. The results obtained are similar. Since they are highly correlated with analyst coverage and cash holding, in
order to avoid multicollinearity problems, we did not include them in the main analysis.

𝐴𝑛𝑎𝑙𝑦𝑠𝑡 𝑓𝑜𝑟𝑒𝑐𝑎𝑐𝑡 𝑒𝑟𝑟𝑜𝑟𝑖𝑡 = β1 Post AIPAt + β2Treatmenti + β3Treatmenti ×Post AIPAt + β4 Zit + Yt + ui +
εit, (2)
In equation (2), Analyst forecast errorit is forecast error for firm 𝑖 at time 𝑡, Treatmenti is
defined at the industry level, and measures the intensity in the effect of AIPA. Post-AIPAt is a
dummy variable which equals 1 for the post-AIPA period from 2001 to 2005. Zit is a vector of time
varying controls discussed in the previous section. Respectively, ui and Yt denote firm and year
fixed effects. The coefficient of interest in equation (2) is β3, which varies at the 𝑖𝑡 level. 16 Given
the continuous nature of our treatment variable, the difference-in-differences estimate should be
interpreted as the average treatment effect on the treated (ATT). We use a fixed effect panel model
which allows us to take into account the time-invariant firm effects and also to consider time
effects. Further, since we are using panel data, and error terms can be serially correlated for a
given firm, we cluster robust errors around firms. Alternatively, we also cluster standard errors at
industry level. Results are very similar and available upon request.
Internal Validity of Difference-in-differences Analysis. Our use of the difference-in-differences
method is based on several assumptions. Before turning to the main analysis, we discuss several
pre-tests to verify the validity of difference-in-differences estimates. The results are reported in
the appendix section.
First, in our theoretical arguments we assume that AIPA does not have major effects on the
patenting and quality of innovations, and only increases the information disclosure through patent
documents. In our setting, it means increase in the treatment variable after AIPA should not be
correlated to the patenting and quality of innovations. So, we first examine whether firm level
16 Due to inclusion of firm fixed effect in analysis we cannot estimate β2, as Treatmenti drops from the regression
estimates.

patenting and patent quality are significantly different pre- and post-AIPA. We measure firm-level
patenting by firms’ yearly total number of patents (in an unreported analysis we also used weighted
patents, in which each patent was weighted by number of patent applications in the same year and
same technology class), and proxy patent quality by firms’ total number of citations, average
number of forward citations, and the number of citations to the most cited patent.17 The results
show that there are no statistically significant differences (P-values are respectively: 0.338, 0.157,
0.772, and 0.436) at different levels of treatment in firm-level patenting and patent quality (Post-
AIPA × Treatment) before and after AIPA in our sample (Appendix 2).
The difference-in-difference analysis also relies on the parallel trends assumption in the pre-
treatment period. This implies if there were no shock, we would not have observed any different
trends between treatment and control. We verify this assumption by conducting four sets of
analyses, following Roberts and Whited (2006). First, we graphically explore the trend of our
dependent variable in the highest quartile of treatment (quartile=4; strongest treatment), versus the
variable in the lowest quartile (quartile=1; weakest treatment, which serves as the control group in
this test). The graph in Figure 1 shows that both groups, regarding mean financial analysts’ error,
had very similar trends pre-AIPA, which confirms the parallel trend assumption. However, after
AIPA, firms in the highest quartile seem to experience a significant reduction in analyst forecast
error, and thus diverge from firms in the lowest quartile.
As the second test, we repeat our analysis on a 10-year period prior to AIPA (1990-1999) with
a placebo shock. We assume that in the middle of this 10-year period (1995) a fake AIPA had
happened (fake-AIPA). We would expect not to observe similar effects to the real AIPA in our
17 The citations are measured in 5 years after patent application.

analysis. Repeating our analysis using this new time window shows that the coefficients are not
statistically significant (P= 0.311) from zero (Appendix 3, Model 1). We also repeat our analysis
by considering pre-AIPA dummies, when the shock had not happened, and their interactions with
the treatment variable. “The estimated treatment effect on pre-policy change should be statistically
indistinguishable from zero to ensure that the observed change is more likely due to the treatment,
as opposed to some alternative force” (Roberts and Whited, 2006: 529). The results show that the
effect of pre-AIPA dummies are statistically indistinguishable from zero (P-values are
respectively: 0.579, and 0.557), while the effect of after-AIPA is statistically significant,
confirming the validity of the shock (Appendix 3, Model 2).
[Figure 1 about here]
In the difference-in-difference analysis our treatment is calculated at the industry-level. One
concern could be that other industry characteristics are correlated with our treatment variable so
that the results are not driven by the treatment necessarily. Hence as the third pre-test, we check
for correlations between several pre-AIPA industry level characteristics (at 4-digit SIC) with the
treatment variable. These characteristics include analyst coverage, R&D intensity, capital
expenditure (CAPX), analyst error, sales growth, number of patents and average citations per
patent. The analyses are conducted at industry-year level. Results show that there is no statistically
significant correlation (P-values are respectively: 0.630, 0.242, 0.451, 0.552, 0.241, 0.276, and
0.754) between the treatment variable and other industry level characteristics (Appendix 4).

RESULTS
Main results
Our main analysis focuses on the effect of disclosure through patent documents due to AIPA, on
analyst forecast error.18 Table 2 reports the results of our difference-in-differences analysis. Model
1 reports the effect of AIPA on the forecast error within the full sample. We can see that an increase
in the R&D intensity is associated with increases in the analyst forecast error (2.790, p=0.024).
This supports our baseline hypothesis that increasing R&D intensity, reduces the accuracy of
forecast of firms’ future prospects and the uncertainty about the firm in capital market. Also, the
estimates show that after the passage of AIPA, average analyst forecast error reduces more for
firms with higher pre-AIPA delays between patent application and grant (larger treatment) relative
to other firms. The coefficient of interest, for Post AIPA× treatment, is negative and statistically
significant (-0.158, p=0.006). It implies that for one standard deviation increase in treatment
variable, the average analyst forecast error reduces by around 26% of mean value of analyst
forecast error. This provides support for H1a.
[Table 2 about here]
The estimates for control variables in table 2 also show intuitive effects. We observe that
increasing institutional ownership is associated with lower analyst forecast error (-0.642,
p=0.003), which is intuitive since institutional ownership signals lower uncertainty about a firm.
Similarly, by increasing Altman’s Z, analyst error is reduced (-0.009, p=0.029). This implies that
when a company faces lower probability of bankruptcy, the analyst error is less, as there is less
18 As our main analysis, we investigate the link between patent disclosure and uncertainty. The consequent negative
relation between uncertainty and firms’ market value is already established in the literature. Nevertheless, we also
empirically tested the relation between analyst forecast error and firm value, measured as market value of equity,
market to book value, and Tobin’s Q. The results confirm the findings of the prior literature, and show that there is a
negative and statistically significant correlation between analyst forecast error and firm value. These results are
available upon request.

uncertainty about the firm. When we also look at performance of firm (ROA) in comparison to
industry, the results show that better performing firms have lower analyst forecast error (-0.638,
p=0.068). We also note the positive correlation between industry analyst error (0.674, p=0.000)
and the firm’s analyst forecast error.
To test H1b, we divide our sample based on R&D intensity relative to industry average. We
also build a further test based on firms which increased their R&D intensity compared to previous
year. This division is motivated by analysts’ expertise in a specific industry and a specific firm.
Hence, we divide our sample according to whether firms have higher R&D intensity than average
of industry (Model 2) or lower R&D intensity than average of industry (Model 4). We also divide
our sample according to whether firms increased their R&D intensity relative to the preceding
year’s R&D intensity (model 3), or did not increase their R&D intensity (Model5). The result is
consistent with H1b, confirming that the effect of treatment is larger for firms with higher R&D
intensity (-0.134, p=0.082 vs. -0.055, p=0.13), and when firms increase their R&D intensity (-
0.170, p=0.010 vs. -0.085, p=0.215).
[Table 3 about here]
As discussed in the theory section, patents vary significantly in broadness and value. In Table
3, we turn our attention to the heterogeneity in patents broadness and ex-post value, measured by
patent scope, originality and forward citation, and test whether they affect the disclosure function
of patents. In H2a we argued that the disclosure effect of patents in reducing uncertainty is less
effective for firms issuing scientifically broad patents. We consider two proxies for patent
broadness, patent scope (Lerner, 1994) and originality (Trajtenberg et al., 1997). Patent scope
shows that patent is related to which technological fields. The broad patents are usually related to
larger number of technological field. Similar to Lerner (1994) we build for each firm an annual

average of patent scope computed as the number of different four-digit IPC classification codes.
Then we classify firms with higher than industry average as the high patent scope sample (model
1), while the rest are categorized as the low patent scope sample (model 2). The originality index
indicates the diversity of the patents cited by that patent. Originality is computed as the Herfindahl
index of technical classes of cited patents (Trajtenberg et al., 1997). We compute for each firm an
annual average of originality. Then we classify firms with originality higher than industry average
as the high originality sample (model 3), while the rest are categorized as the low originality
sample (model 4). The split sample analysis shows that disclosure effect is most evident in firms
with patents that have lower patent scope and originality (model 2: -0.219, p=0.004 and model 4:
-0.223, p=0.002), while we do not find a similar effect in firms with patents that have higher patent
scope and originality (Model 1: -0.112, p=0.156; Model 3: -0.115, p=0.141). The results support
H2a.
To test H2b, we split our sample to distinguish between firms with patents that have higher
ex-post value, and firms with patents that have lower ex-post value. To do this, we classify firms
by their patents’ average citations, and by their highest cited patent. First, we calculate the firms’
annual average citation per patent, and classify firms with higher than industry average as the high
citation sample (model 5), while the rest are categorized as the low citation sample (model 6).
Second, we identify firms’ annual highest cited patents, calculate the industry mean, and classify
firms with higher than industry average as the high max citation sample (model 7), and the rest as
the low max citation sample (model 8). The split sample analysis shows that disclosure effect is
most evident in firms with patents that have lower ex-post value (model 6: -0.169, p=0.015 and
model 8: -0.228, p=0.002), while we do not find a similar effect in firms with patents that have

higher ex-post value (Model 5: -0.029, p=0.768 and model 7: 0.002, p=0.908). These results
confirm hypothesis 2b.
Further tests
Heterogeneity in the effect of AIPA. In the previous section, we showed that disclosure through
patent documents following AIPA, does reduce analyst forecast error. In this section, we run
several analyses to test the underlying mechanism that drives our results. To this end, we focus
first on the heterogeneity of AIPA’s effect, arguing that if disclosure truly drives the results, its
effect should be more significant and larger for firms prone to higher uncertainty due to
information asymmetry. As discussed in our theory, R&D increases information asymmetry and
uncertainty, but this effect can be more severe when there are no other channels of information
about firms. Firms that already benefit from other informational sources are expected to be less
subject to information asymmetry and so, benefit less from AIPA. To check for this mechanism,
we focused on three firm characteristics, namely the size of firm (based on size of assets),
institutional ownership, and dividend payment. Academic literature has shown that information
asymmetry is more relevant about smaller firms (e.g. Chae, 2005; Demsetz, 1986). Also, as
institutional ownership signals good performance (Boone and White, 2015), we expect firms with
lower institutional ownership to suffer more from capital market uncertainty. We classified firms
as small vs. large, and high vs. low institutional ownership relative to the average of the industry.
Table 4 reports the results of our split sample analysis. This shows that the effect of AIPA is
significantly larger for smaller firms (Model 2, -0.184, p=0.005) and firms with lower institutional
ownership (Model 4, -0.234, p=0.000), compared to larger firms (Model 1, -0.005, p=0.947) and
firms with higher institutional ownership (Model 3, -0.027, p=0.738).

Dividend policy is the other determinant we consider for the relevance of information
asymmetry. Finance literature has studied the determinants of public firms’ dividend policy.
Signaling to capital market has been discussed as a first-order driver of dividend payment policies
(Bhattacharya, 1979; Johnson, Lin and Son, 2006). The studies indicate that firms will pay
dividends when it is especially difficult for external investors to gauge a firm’s future prospects.
In other words, firms that need to signal their future profitability, are more likely to pay dividends,
compared to more established firms with higher stakeholder confidence regarding benefits from
share price growth. Thus, we expect disclosure through patents to have a greater impact on the
dividend paying firms, for which, the information asymmetry issues are more relevant. We split
the sample by distinguishing between dividend paying vs. non-dividend paying firms (models 5
and 6). Results confirm our arguments, showing that the effect of AIPA is larger for dividend
paying firms (Model 5, -0.112, p=0.007), in contrast to non-dividend paying firms (Model 6, -
0.087, p=0.558). Results in Table 4 confirm that the effect of AIPA is significantly larger for firms
that are associated with higher information asymmetry, compared to firms associated with lower
information asymmetry.
[Table 4 about here]
In the next section, we turn our attention to industry characteristics that can influence the
impact of disclosure through AIPA on financial analyst forecast error.
Discrete and complex industries. In the main analyses, we argue that AIPA has led to an
increase in information disclosure by making information on a firm’s technology available in
patent documents. In some industries there is a transparent relation between product and patented
technology, while in others the relationship is much more complex (Heeley et al., 2007). We expect
disclosure to be more effective in the former case, as it conveys more useful information for

forecasting firm performance. In this section, we explore the variation in this relation as another
test for our mechanism. In Table 5 (models 1 and 2) we repeat the analysis of Table 2 in subsamples
of transparent (discrete) and non-transparent (complex) industries. We classify firms according to
Cohen, Nelson, and Walsh (2000) and Heeley et al. (2007), considering industries with ISIC code
lower than 2900 (e.g. pharmaceutical and chemical industries) as transparent (discrete). All other
industries in our sample are classified as non-transparent (complex). Consistent with informational
value of patents, we find that the information disclosure after AIPA is more important for firms in
discrete industries (Model 2, -0.193, p=0.001) where there is a transparent relationship between
product and patented technology. We do not find similar results for non-transparent industries
(Model 1, -0.095, p=0.333).
[Table 5 about here]
Role of foreign patents. Prior to AIPA, the US applications were disclosed only after patents
had been granted. However, in almost every other patent system, the applications were disclosed
18 months after the filing date. Therefore, US patent applications with foreign equivalents were
already disclosed by the foreign country in which they were filed, 18 months after the application
date (Hegde and Lou, 2017). Even though patent publication in foreign countries might not be the
same as publication in the US, we argue that disclosure through patent documents due to AIPA
should be more effective for firms in industries that are less likely to file for foreign patents. To
test this argument, we divided our sample according to the median number of foreign patents in
their industries (family size) prior to AIPA.19 Table 5 (Models 3 and 4) shows that information
disclosure after AIPA is more important for firms of smaller than median family size (Model 4, -
19 We extract data on foreign patents from the PATSTAT database.

0.207, p=0.003). We do not find similar results for firms of larger than median family size (Model
3, -0.088, p= 0.310).
Additional Robustness Tests. First, a source of heterogeneity in analyst forecasts can stem
from differences in analysts’ abilities and skills. Therefore, it can be argued that analyst forecast
error could be influenced by heterogeneity among analysts. This is especially important since in
our main analysis we cannot argue that analysts prior to and after AIPA are the same ones. To
address this concern, we take advantage of the analyst identification code in I/B/E/S data. We
repeat all our analyses using analyst-firm-year as the unit of observation, instead of the previously
used firm-year as the unit of observation. This approach helps us to consider analyst fixed effect
in addition to firm and year fixed effects in our tests. By including analyst fixed effect, we consider
the changes in analyst forecast error for the same analyst pre and post AIPA. The result (Appendix
5) are very similar to main findings.
Second, if AIPA’s effects truly stem from disclosure through patents, we should not observe
any significant impact of AIPA in firms that have not filed patents after AIPA. Accordingly, our
tests show no statistically significant change for the subsample of firms that have not filed patents
after AIPA, nor for firms that did not patent throughout our entire sample. Results are available
upon request.
Third, AIPA coincided with the internet bubble (dot com) and the stock market crash that
followed. To address the potential effect of the dot com bubble, we take several steps. Our sample
includes only manufacturing firms, while the internet bubble had the most visible effect on
information technology firms that are usually classified in the service sector. Further, to assure that
our results are not driven by the dot com bubble, we control for two time-varying characteristics
of industry (industry level analyst forecast error, and industry sales growth) to capture uncertainty

in a firms’ market due to the bubble. We also, Following Ljungqvist and Wilhelm (2003), exclude
the industries20 that where most affected by the dot com bubble. Our results remain similar and are
available upon request.
Discussion and Conclusion
This study targets an important dilemma of public firms in knowledge-intensive industries: the
uncertainty pressure from capital markets resulting from R&D investments. The dilemma has
substantial effects on public firms, their management and stakeholders. The recent buyout of Dell
Inc. provides a good demonstration of the effects of this pressure. A year after one of the biggest
public-to-private buyouts in history, Michael Dell, the founder and company’s acquirer pointed
out “…the required pace of innovation and investment, and an affliction of short-term thinking…”
as his reasons to go private (The Wall Street Journal, November 24th, 2014). Going private is not
typically a feasible solution to the above mentioned dilemma. Many public firms therefore, fall
into short-termism by cutting back on R&D to lift the capital market pressure. This practice drops
the long-term value of the firm and hurts its shareholders. Satisfying capital markets to avoid the
R&D and uncertainty dilemma has led to the conjecture that many problems in the US economy
stem from excess short-termism. As Donaldson, the head of the Securities and Exchange
Commission (2003-2006) remarked about the financial crisis, “…the excessive focus by too many
corporations on achieving short-term results certainly is one of the root causes for some of the
problems we face today” (Rummel, 2008). While avoiding the dilemma is not possible or efficient,
20 SIC codes 3571, 3572, 3575, 3577, 3578 (computer hardware), 3661, 3663, 3669 (communications equipment),
3674 (electronics), 3812 (navigation equipment), 3823, 3825, 3826, 3827, 3829 (measuring and controlling devices),
4899 (communication services).

public firms may consider alternative strategies to reduce this uncertainty to alleviate its
consequences.
We investigate whether (and under what conditions), disclosure of firms’ new knowledge
assets through patenting can mitigate this dilemma. Our findings highlights the role of patents
through their disclosure function, on reducing uncertainty about innovative firms in the capital
market. By showing this, our study unveils a new aspect of patent value, which to date has largely
been overlooked: the disclosure function of patents to capital markets. Traditionally, disclosing
information in patent documents has been considered to target technology customers and
inventors. By linking disclosure through patents to their capital market performance, our work
contributes to the stream of research on firms’ trade-off between patenting and secrecy. Our work
adds to the literature in support of patenting by documenting a positive benefit of patents for the
IP holders in capital markets. However, by providing a boundary condition of this benefit, we offer
clear managerial implications for such decisions.
Besides mitigating short-termism, our findings point to an important economic effect of
disclosure through patents. By reducing the forecast error of financial analysts, patenting facilitates
efficient allocation of resources in the capital markets. Also, by partially solving underinvestment
on R&D-intensive firms, disclosure through patents supports corporate innovation.
References
Ackert LF, Athanassakos G. 1997. Prior Uncertainty, Analyst Bias, and Subsequent Abnormal Returns.
Journal of Financial Research 20(2): 263-273.
Ahuja G, Katila R. 2001. Technological acquisitions and the innovation performance of acquiring firms:
A longitudinal study. Strategic Management Journal 22(3): 197-220.
Ahuja G, Lampert CM. 2001. Entrepreneurship in the large corporation: A longitudinal study of how
established firms create breakthrough inventions. Strategic Management Journal 22(6-7): 521-
543.
Akerlof, GA. 1970. The market for lemons: Quality uncertainty and the market mechanism. The
Quarterly Journal of Economics, 488-500.
Altman, EI. 1968. Financial ratios, discriminant analysis and the prediction of corporate bankruptcy. The
Journal of Finance 23(4): 589-609.
Amir E, Lev B. 1996. Value-relevance of nonfinancial information: The wireless communications
industry. Journal of Accounting and Economics 22(1-3): 3-30.
Angrist J, Pischke J-S. 2009. Mostly Harmless Econometrics: An Empiricist's Companion. Princeton
University Press.
Anton JJ, Yao DA. 2002. The sale of ideas: Strategic disclosure, property rights, and contracting.
Review of Economic Studies 69(3): 513-531.
Arora A, Gambardella A. 2010. Ideas for rent: an overview of markets for technology. Industrial and
Corporate Change 19(3): 775-803.
Balakrishnan K, Billings MB, Kelly B, Ljungqvist A. (2014) Shaping Liquidity: On the Causal Effects
of Voluntary Disclosure. Journal of Finance, 69(5): 2237-2278.
Bartov E. 1993. The Timing of Asset Sales and Earnings Manipulation. The Accounting Review 68(4):
840-855.
Bartov E, Givoly D, Hayn C.2002. The rewards to meeting or beating earnings expectations. Journal of
Accounting & Economics 33(2): 173-204.
Benner MJ. 2010. Securities Analysts and Incumbent Response to Radical Technological Change:
Evidence from Digital Photography and Internet Telephony. Organization Science 21(1): 42-62.
Benner MJ, Ranganathan R. 2012. Offsetting illegitimacy? How pressures from securities analysts
influence incumbents in the face of new technologies. Academy of Management Journal 55(1):
213-233.
Benner MJ, Zenger T. 2016. The Lemons Problem in Markets for Strategy. Strategy Science 1(2): 71-89.
Botosan CA, Plumlee MA. 2002. A Re-examination of Disclosure Level and the Expected Cost of
Equity Capital. Journal of Accounting Research 40(1): 21-40.
Bhattacharya S. 1979. Imperfect Information, Dividend Policy, and "The Bird in the Hand" Fallacy. Bell
Journal of Economics 10(1): 259-270.
Bhattacharya S, Ritter JR (1983) innovation and communication - signaling with partial disclosure.
Review of Economic Studies 50(2): 331-346.
Boone AL, White JT. 2015. The effect of institutional ownership on firm transparency and information
production. Journal of Financial Economics 117(3): 508-533.
Bromiley P. 1991. Testing a Causal Model of Corporate Risk Taking and Performance. Academy of
Management Journal 34(1): 37-59.
Bromiley P, Rau D, Zhang Y. 2017. Is R&D risky? Strategic Management Journal 38(4): 876-891.
Brown L, Richardson G, Schwager S. 1987. An Information Interpretation of Financial Analyst
Superiority In Forecasting Earnings. Journal of Accounting Research 25(1): 49-67.

Chae J. 2005. Trading Volume, Information Asymmetry, and Timing Information. The Journal of
Finance 60(1): 413-442.
Chan LKC, Lakonishok J, Sougiannis T. 2001. The stock market valuation of research and development
expenditures. Journal of Finance 56: 2431–2456.
Cañibano, L., Garcia-Ayuso, M., & Sanchez, P. 2000. Accounting for intangibles: a literature review.
Journal of Accounting Literature, 19, 102.
Chan LKC, Lakonishok J, Sougiannis T. 2001. The stock market valuation of research and development
expenditures. Journal of Finance. 56: 2431–2456.
Chen W-R, Miller KD. 2007. Situational and institutional determinants of firms' R&D search intensity.
Strategic Management Journal 28(4): 369-381.
Coff RW, Lee PM. 2003. Insider trading as a vehicle to appropriate rent from R&D. Strategic
Management Journal 24(2): 183-190.
Cohen WM, Levinthal DA. 1990. Absorptive-Capacity - a New Perspective on Learning and Innovation.
Administrative Science Quarterly 35(1): 128-152.
Cohen WM, Nelson RR, Walsh JP. 2000. Protecting Their Intellectual Assets: Appropriability
Conditions and Why U.S. Manufacturing Firms patent (Or Not), National Bureau of Economic
Research: http://www.nber.org/papers/w7552.
Demsetz H. 1986. Corporate Control, Insider Trading, and Rates of Return. American Economic Review
76(2): 313-316.
Diamond DW. 1985. Optimal Release of Information By Firms. The Journal of Finance 40(4): 1071-
1094.
Diamond DW, Verrecchia RE. 1991. Disclosure, Liquidity, and the Cost of Capital. The Journal of
Finance 46(4): 1325-1359.
Dorsey P. 2009. Morningstar's Approach to Equity Analysis and Security Valuation. In The Valuation
Handbook. Thomas R, Gup BE (eds.), John Wiley & Sons, Inc.
Franzoni C, Scellato G. 2010. The grace period in international patent law and its effect on the timing of
disclosure. Research policy, 39(2), 200-213.
Gallini NT. 2002. The Economics of Patents: Lessons from Recent U.S. Patent Reform. Journal of
Economic Perspectives 16(2): 131-154.
Gambardella A, Harhoff D, Verspagen B. 2008. The value of European patents. European Management
Review 5(2): 69-84.
Gans JS, Hsu DH, Stern S. 2008. The impact of uncertain intellectual property rights on the market for
ideas: Evidence from patent grant delays. Management Science, 54(5): 982-997.
Gentry RJ, Shen W. 2013. The impacts of performance relative to analyst forecasts and analyst coverage
on firm R&D intensity. Strategic Management Journal 34(1): 121-130.
Graham JR, Harvey CR, Rajgopal S. 2005. The economic implications of corporate financial reporting.
Journal of Accounting & Economics 40(1-3): 3-73.
Graham S, Hegde D. 2015. Disclosing patents' secrets. Science 347(6219): 236-237.
Gu F, Lev B. 2017. Time to Change Your Investment Model. Financial Analysts Journal, 73(4), 23-33.
Gu F, Wang WM. 2005. Intangible assets, information complexity, and analysts' earnings forecasts.
Journal of Business Finance & Accounting 32(9-10): 1673-1702.
Haeussler C, Harhoff D, Mueller E. 2014. How patenting informs VC investors - The case of
biotechnology. Research Policy 43(8): 1286-1298.
Hall B and Lerner J. 2009. the financing of R&D and innovation. In Hall, B. H. and N. Rosenberg (eds.),
Handbook of the Economics of Innovation, Elsevier-North Holland.

Hall B, Helmers C, Rogers M, Sena V. 2014. The Choice between Formal and Informal Intellectual
Property: A Review. Journal of Economic Literature, 52(2): 375-423.
Hall B, Jaffe A, Trajtenberg M. 2005. Market value and patent citations. Rand Journal of Economics
36(1): 16-38.
Harhoff D, Scherer FM, Vopel K. 2003. Citations, family size, opposition and the value of patent rights.
Research Policy 32(8): 1343-1363.
Harhoff D, Wagner S. 2009. The Duration of Patent Examination at the European Patent Office.
Management Science 55(12): 1969-1984.
Haskel J, Westlake S. 2017. Capitalism without Capital: The Rise of the Intangible Economy. Princeton
University Press.
Healy PM, Wahlen JM. 1999. A Review of the Earnings Management Literature and Its Implications for
Standard Setting. Accounting Horizons 13(4): 365-383.
Healy PM, Palepu KG. 2001. Information asymmetry, corporate disclosure, and the capital markets: A
review of the empirical disclosure literature. Journal of Accounting & Economics, 31(1-3): 405-
440.
Heeley MB, Matusik SF, Jain N. 2007. Innovation, appropriability, and the underpricing of initial public
offerings. Academy of Management Journal 50(1): 209-225.
Hegde D, Luo H. 2017. Patent Publication and the Market for Ideas. Management Science.
Helfat CE. 1994. Evolutionary Trajectories in Petroleum Firm R&D. Management Science 40(12):
1720-1747.
Henderson AD, Miller D, Hambrick DC. 2006. How quickly do CEOs become obsolete? Industry
dynamism, CEO tenure, and company performance. Strategic Management Journal 27(5): 447-
460.
Hsu DH, Ziedonis RH. 2013. Resources as dual sources of advantage: Implications for valuing
entrepreneurial-firm patents. Strategic Management Journal 34(7): 761-781.
James SD, Leiblein MJ, Lu S. 2013. How Firms Capture Value From Their Innovations. Journal of
Management 39(5): 1123-1155.
James S. 2014. The Use of Voluntary Public Disclosure and Patent Strategies to Capture Value from
Product Innovation. Journal of Applied Business and Economics 16(5): 11-26.
James SD, Shaver JM. 2016. Motivations for Voluntary Public R&D Disclosures. Academy of
Management Discoveries 2(3): 290-312.
Johnson SA, Lin J-C, Roy Song K. 2006. Dividend policy, signaling, and discounts on closed-end funds.
Journal of Financial Economics 81(3): 539-562.
Jones DA. 2007. Voluntary disclosure in R&D-Intensive industries. Contemporary Accounting Research
24(2): 489-522.
Katila R, Ahuja G. 2002. Something old, something new: A longitudinal study of search behavior and
new product introduction. Academy of Management Journal 45(6): 1183-1194.
Kogan L, Papanikolaou D, Seru A, Stoffman N. 2017. Technological Innovation, Resource Allocation,
and Growth. The Quarterly Journal of Economics 132(2): 665-712. Laamanen T. 2007. On the role of acquisition premium in acquisition research. Strategic Management
Journal. 28(13): 1359–1369.
Lerner J. 1994. The Importance of Patent Scope: An Empirical Analysis. RAND Journal of Economics
25(2): 319-333.
Leiponen A, Helfat CE. 2010. Innovation objectives, knowledge sources, and the benefits of breadth.
Strategic Management Journal, 31(2), 224-236.

Levitas E, McFadyen MA. 2009. Managing liquidity in research-intensive firms: signaling and
cash flow effects of patents and alliance activities. Strategic Management Journal 30(6):
659-678.
Litov LP, Moreton P, Zenger TR. 2012. Corporate Strategy, Analyst Coverage, and the
Uniqueness Paradox. Management Science 58(10): 1797-1815.
Ljungqvist A, Wilhelm WJ. 2003. IPO Pricing in the Dot-com Bubble. The Journal of Finance
58(2): 723-752.
Long C. 2002. Patent signals. University of Chicago Law Review 69(2): 625-679.
Miller EM. 1977. Risk, Uncertainty, and Divergence of Opinion. The Journal of Finance 32(4):
1151-1168.
Miller KD, Reuer JJ. 1996. Measuring Organizational Downside Risk. Strategic Management
Journal 17(9): 671-691.
Milliken FJ. 1987. Three Types of Perceived Uncertainty about the Environment: State, Effect,
and Response Uncertainty. The Academy of Management Review 12(1): 133-143.
Mohammadi, A, Khashabi P. 2017. Embracing the sharks: the impact of startups’
misappropriation concern on the likelihood, size and timing of corporate venture capital
investments. Social Science Research Network, http://ssrn.com/abstract=2715925.
Myers SC, Majluf NS. 1984. Corporate financing and investment decisions when firms have
information that investors do not have. Journal of Financial Economics 13(2): 187-221.
Narayanan VK, Pinches GE, Kelm KM, Lander, DM. 2000. The influence of voluntarily
disclosed qualitative information. Strategic Management Journal, 21(7): 707-722.
Nicolai AT, Schulz A-C, Thomas TW. 2010. What Wall Street Wants - Exploring the Role of
Security Analysts in the Evolution and Spread of Management Concepts. Journal of
Management Studies 47(1): 162-189.
Puffer SM, Weintrop JB. 1991. Corporate performance and CEO turnover - the role of
performance expectations. Administrative Science Quarterly 36(1): 1-19.
Roberts MR, Whited TM. 2013. Endogeneity in empirical corporate finance1. George, M,
Constantinides M, Rene MS, ed. Handbook of the Economics of Finance (Elsevier,
London), 493-572.
Saidi F, Zaldokas A. 2017. How Does Firms’ Innovation Disclosure Affect Their
Banking Relationships? Social Science Research Network, http://ssrn.com/abstract=2715925.
Scharfstein D, Stein J. 1990. Herd Behavior and Investment. American Economic Review 80(3):
465-479.
Scherer FM, Ross D. 1990. Industrial market structure and economic performance. University of
Illinois at Urbana-Champaign's Academy for entrepreneurial leadership historical
research reference in entrepreneurship.
Simeth M, Cincera M. 2016. Corporate Science, Innovation, and Firm Value. Management
Science 62(7): 1970-1981.
Somaya D. 2012. Patent Strategy and Management: An Integrative Review and Research
Agenda. Journal of Management 38(4), 1084-1114.
Stephan PE. 1996. The Economics of Science. Journal of Economic Literature 34(3): 1199-1235.
Stern I, James SD.2016. Whom are you promoting? Positive voluntary public disclosures and
executive turnover. Strategic Management Journal 37(7): 1413-1430.
Swarup, A. 2008. Analyzing Scientific Investments. Science. 322 (5905): 1266-1267.
Trajtenberg M, Henderson R, Jaffe A. 1997. University Versus Corporate Patents: A Window
On The Basicness Of Invention. Economics of Innovation and New Technology 5(1): 19-
50.
Verhoeven D, Bakker J, Veugelers R. 2016. Measuring technological novelty with patent-based
indicators. Research Policy 45(3): 707-723.
Washburn M, Bromiley P. 2014. Managers and Analysts: An Examination of Mutual Influence.
Academy of Management Journal 57(3): 849-868.
Wiersema MF, Zhang Y. 2011. CEO dismissal: the role of investment analysts. Strategic Management
Journal 32(11): 1161-1182.
Williams HL. 2017. How Do Patents Affect Research Investments? National Bureau of Economic
Research Working Paper Series No. 23088.
Zuckerman EW. 2000. Focusing the corporate product: Securities analysts and de-diversification.
Administrative Science Quarterly, 45(3): 591-619.

Figure 1- Financial analyst’s gap (error) for firms on top quartile (4) and low quartile (1) of lag
between patent application and patent grant prior to AIPA.
.1.2
.3.4
.5
An
aly
st ga
p
2001Data Year - Fiscal
Quartile=1 Quartile=4

Table 1-Descriptive statistics and correlation (N=6,536)
Mean S.D. 1 2 3 4 5 6 7 8 9 10 11
1- Analyst forecast error 0.376 2.081 - 2- Treatment 2.301 0.637 -0.01 - 3- Post-AIPA 0.389 0.488 -0.01 0.05 - 4- R&D intensity 0.062 0.084 0.08 0.18 0.12 -
5- Patent stock 2.972 1.956 -0.04 0.13 0.18 0.18 -
6- Institutional ownership 0.523 0.261 -0.08 -0.04 0.20 -0.03 0.12 - 7- Analyst coverage 10.494 9.358 -0.07 0.12 0.06 0.17 0.53 0.28 - 8- Cash(log) 3.799 2.182 -0.06 0.16 0.29 0.12 0.60 0.12 0.56 - 9- Altman's Z 5.228 7.635 -0.05 0.09 -0.05 0.19 -0.01 0.06 0.13 0.06 - 10- ROA- industry ROA 0.017 0.117 -0.09 0.04 0.04 -0.11 0.07 0.08 0.16 0.11 0.20 - 11- industry analyst gap 0.438 0.973 0.33 0.02 -0.01 0.06 -0.02 -0.03 -0.02 -0.03 -0.01 -0.01 -
12- industry sales growth 0.205 1.304 0.00 -0.03 -0.06 -0.01 -0.03 -0.02 0.01 -0.01 0.01 -0.01 0.00
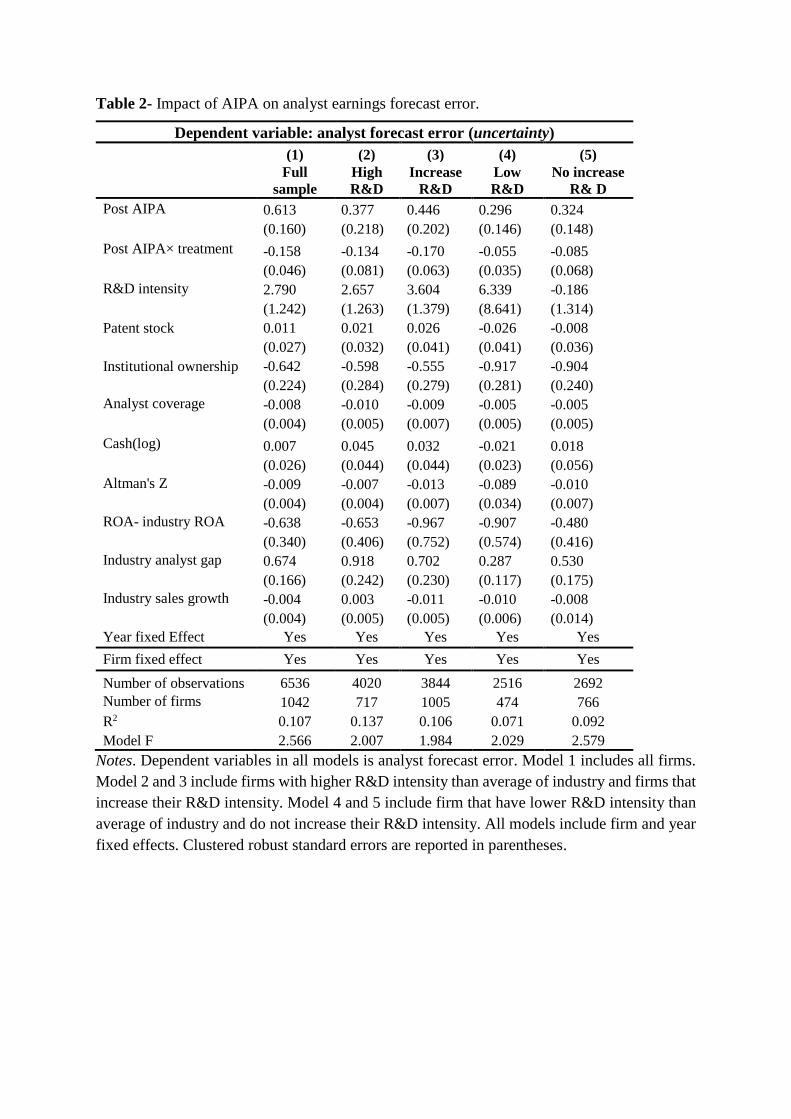
Table 2- Impact of AIPA on analyst earnings forecast error.
Dependent variable: analyst forecast error (uncertainty)
(1) (2) (3) (4) (5)
Full
sample
High
R&D
Increase
R&D
Low
R&D
No increase
R& D
Post AIPA 0.613 0.377 0.446 0.296 0.324 (0.160) (0.218) (0.202) (0.146) (0.148)
Post AIPA× treatment -0.158 -0.134 -0.170 -0.055 -0.085 (0.046) (0.081) (0.063) (0.035) (0.068)
R&D intensity 2.790 2.657 3.604 6.339 -0.186
(1.242) (1.263) (1.379) (8.641) (1.314)
Patent stock 0.011 0.021 0.026 -0.026 -0.008
(0.027) (0.032) (0.041) (0.041) (0.036)
Institutional ownership -0.642 -0.598 -0.555 -0.917 -0.904
(0.224) (0.284) (0.279) (0.281) (0.240)
Analyst coverage -0.008 -0.010 -0.009 -0.005 -0.005 (0.004) (0.005) (0.007) (0.005) (0.005)
Cash(log) 0.007 0.045 0.032 -0.021 0.018 (0.026) (0.044) (0.044) (0.023) (0.056)
Altman's Z -0.009 -0.007 -0.013 -0.089 -0.010 (0.004) (0.004) (0.007) (0.034) (0.007)
ROA- industry ROA -0.638 -0.653 -0.967 -0.907 -0.480 (0.340) (0.406) (0.752) (0.574) (0.416)
Industry analyst gap 0.674 0.918 0.702 0.287 0.530 (0.166) (0.242) (0.230) (0.117) (0.175)
Industry sales growth -0.004 0.003 -0.011 -0.010 -0.008 (0.004) (0.005) (0.005) (0.006) (0.014)
Year fixed Effect Yes Yes Yes Yes Yes
Firm fixed effect Yes Yes Yes Yes Yes
Number of observations 6536 4020 3844 2516 2692
Number of firms 1042 717 1005 474 766
R2 0.107 0.137 0.106 0.071 0.092
Model F 2.566 2.007 1.984 2.029 2.579
Notes. Dependent variables in all models is analyst forecast error. Model 1 includes all firms.
Model 2 and 3 include firms with higher R&D intensity than average of industry and firms that
increase their R&D intensity. Model 4 and 5 include firm that have lower R&D intensity than
average of industry and do not increase their R&D intensity. All models include firm and year
fixed effects. Clustered robust standard errors are reported in parentheses.

Table 3- Impact of AIPA on analyst forecast error for firm with higher than industry average patent scope (model 1), originality (model 3), average
citation (model 5) and citation of the mostly cited patent (model 7) vs firm with lower than industry average patent scope (model 2), originality
(model 4), average citation (model 6) and citation of the mostly cited patent (model 8).
Dependent variable: analyst forecast error (uncertainty)
Broadness measures Value measures
(1) (2) (3) (4) (5) (6) (7) 8)
High patent
scope
Low patent
scope
High
originality
Low
originality
High
citation
Low
citation
High max
citation
Low max
citation
Post AIPA 0.274 0.632 0.376 0.505 0.003 0.460 0.064 0.527 (0.206) (0.204) (0.220) (0.203) (0.209) (0.187) (0.169) (0.177)
Post AIPA× treatment -0.112 -0.219 -0.115 -0.223 -0.029 -0.169 0.002 -0.228 (0.079) (0.075) (0.078) (0.071) (0.097) (0.065) (0.058) (0.070)
R&D intensity 3.395 3.639 -0.097 7.281 2.529 3.811 1.211 5.445
(1.573) (3.080) (0.819) (3.546) (2.291) (1.678) (1.020) (2.715)
Controls Yes Yes Yes Yes Yes Yes Yes Yes
Year fixed Effect Yes Yes Yes Yes Yes Yes Yes Yes
Firm fixed effect Yes Yes Yes Yes Yes Yes Yes Yes
Number of observations 2969 3567 2950 3586 2797 3739 2950 3586
Number of firms 831 866 822 888 779 911 763 859
R2 0.128 0.121 0.049 0.170
0.121 0.081 0.160 0.101
Model F 1.906 2.196 1.966 2.276 2.139 1.837 2.110 2.310
Notes. Dependent variables in all models is analyst forecast error. All models control for Patent stock, Institutional ownership, Analyst coverage,
Cash, Altman's Z, ROA- industry ROA, Industry analyst gap, Industry sales growth in addition to firm and year fixed effects. Clustered robust
standard errors are reported in parentheses.

Table 4- Heterogeneity of AIPA for firms with higher (Model 2, 4, 6) and lower (model 1, 3,
5) information asymmetry.
(1) (2) (3) (4) (5) (6)
Dependent variable: analyst forecast error (uncertainty)
Large
firm
Small
firm
High inst.
ownership
Low inst.
ownership
Non-Dividend
paying
Dividend
paying
Post AIPA -0.001 0.565 0.055 0.597 0.313 0.251
(0.228
) (0.156) (0.179) (0.211) (0.393) (0.107)
Post AIPA×
treatment -0.005 -0.184 -0.027 -0.234 -0.087 -0.112
(0.076
) (0.062) (0.081) (0.065) (0.161) (0.041)
R&D intensity 1.220 2.877 0.455 3.963 2.778 2.364
(1.415
) (1.356) (0.888) (1.899) (1.356) (1.952)
Controls Yes Yes Yes Yes Yes Yes
Year fixed Effect Yes Yes Yes Yes Yes Yes
Firm fixed effect Yes Yes Yes Yes Yes Yes
N 1363 5173 3449 3087 3083 3453
Number of firms 207 909 656 750 624 518
r2 0.237 0.097 0.083 0.139 0.142 0.069
Model F 1.898 2.457 2.994 1.644 2.080 1.624
Notes. Dependent variables in all models is analyst forecast error. All models control for Patent
stock, Institutional ownership, Analyst coverage, Cash, Altman's Z, ROA- industry ROA,
Industry analyst gap, Industry sales growth in addition to firm and year fixed effects. Clustered
robust standard errors are reported in parentheses.

Table 5- Impact of AIPA on analyst earnings forecast error in complex (Mode 1) and discrete
(Model 2) industries and in industries with large vs. small number of foreign patent family (Model
3 vs. 4).
(1) (2) (3) (4)
Complex Discrete
Family size>
mean
Family size<
mean
Post AIPA 0.345 0.330 0.236 0.526 (0.213) (0.173) (0.184) (0.202)
Post AIPA× treatment -0.094 -0.193 -0.088 -0.207
(0.097) (0.057) (0.087) (0.066)
R&D intensity 2.458 5.859 4.495 1.830 (1.266) (3.314) (3.070) (1.077)
Controls Yes Yes Yes Yes
Year fixed Effect Yes Yes Yes Yes
Firm fixed effect Yes Yes Yes Yes
N 4084 2445 3242 3287
Number of firms 670 372 491 551
Model F 2.991 1.603 1.973 1.875
Notes. Dependent variables in all models is analyst forecast error. All models control for Patent
stock, Institutional ownership, Analyst coverage, Cash, Altman's Z, ROA- industry ROA, Industry
analyst gap, Industry sales growth in addition to firm and year fixed effects. Clustered robust
standard errors are reported in parentheses.
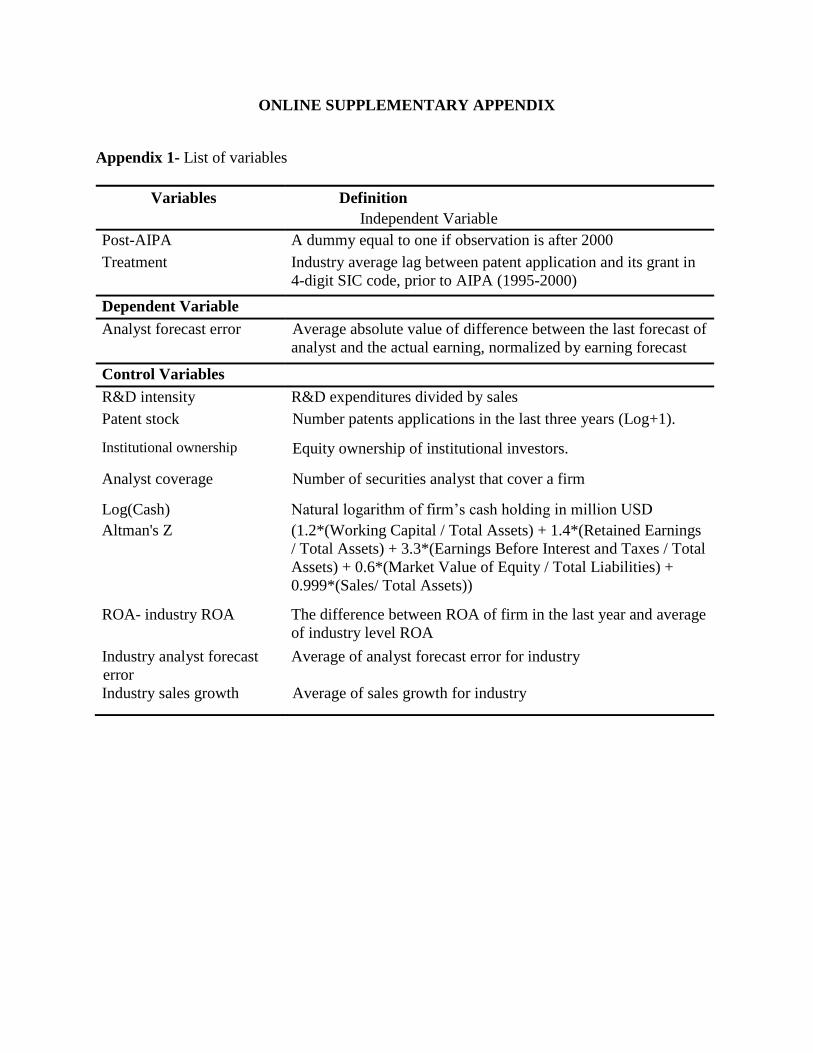
ONLINE SUPPLEMENTARY APPENDIX
Appendix 1- List of variables
Variables Definition
Independent Variable
Post-AIPA A dummy equal to one if observation is after 2000
Treatment Industry average lag between patent application and its grant in
4-digit SIC code, prior to AIPA (1995-2000)
Dependent Variable
Analyst forecast error Average absolute value of difference between the last forecast of
analyst and the actual earning, normalized by earning forecast
Control Variables
R&D intensity R&D expenditures divided by sales
Patent stock Number patents applications in the last three years (Log+1).
Institutional ownership Equity ownership of institutional investors.
Analyst coverage Number of securities analyst that cover a firm
Log(Cash) Natural logarithm of firm’s cash holding in million USD
Altman's Z (1.2*(Working Capital / Total Assets) + 1.4*(Retained Earnings
/ Total Assets) + 3.3*(Earnings Before Interest and Taxes / Total
Assets) + 0.6*(Market Value of Equity / Total Liabilities) +
0.999*(Sales/ Total Assets))
ROA- industry ROA The difference between ROA of firm in the last year and average
of industry level ROA
Industry analyst forecast
error
Average of analyst forecast error for industry
Industry sales growth Average of sales growth for industry
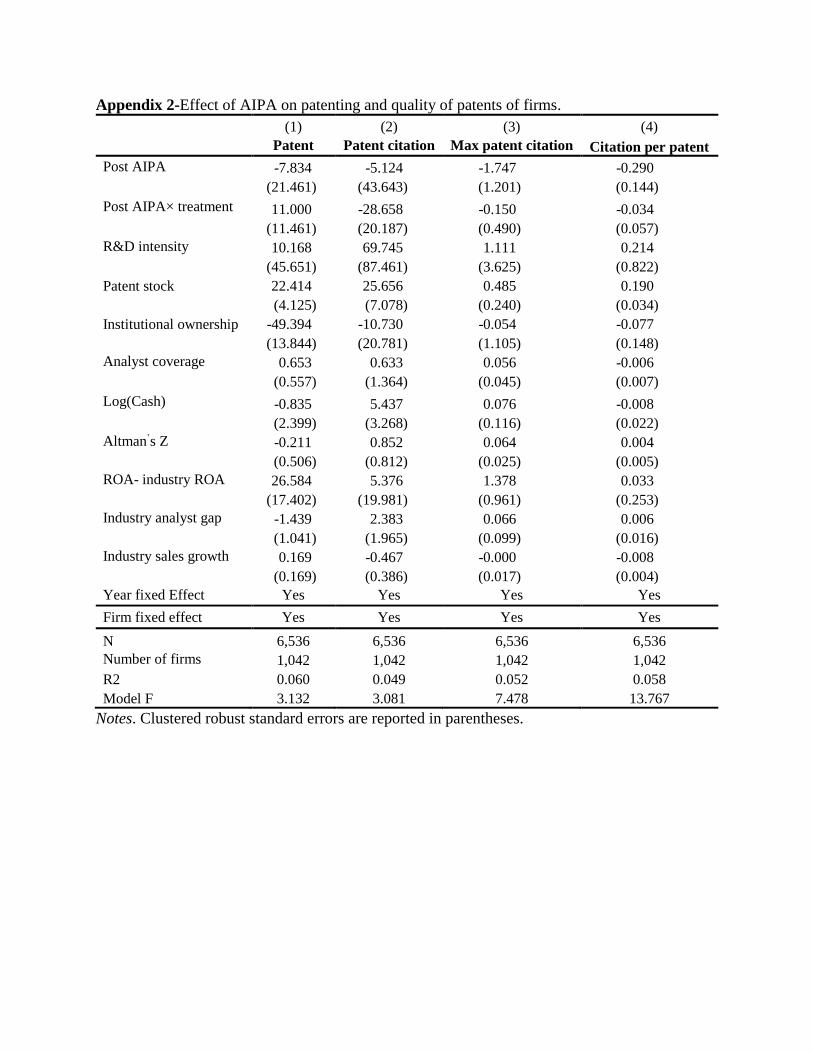
Appendix 2-Effect of AIPA on patenting and quality of patents of firms.
(1) (2) (3) (4)
Patent Patent citation Max patent citation Citation per patent
Post AIPA -7.834 -5.124 -1.747 -0.290 (21.461) (43.643) (1.201) (0.144)
Post AIPA× treatment 11.000 -28.658 -0.150 -0.034 (11.461) (20.187) (0.490) (0.057)
R&D intensity 10.168 69.745 1.111 0.214
(45.651) (87.461) (3.625) (0.822)
Patent stock 22.414 25.656 0.485 0.190
(4.125) (7.078) (0.240) (0.034)
Institutional ownership -49.394 -10.730 -0.054 -0.077
(13.844) (20.781) (1.105) (0.148)
Analyst coverage 0.653 0.633 0.056 -0.006 (0.557) (1.364) (0.045) (0.007)
Log(Cash) -0.835 5.437 0.076 -0.008 (2.399) (3.268) (0.116) (0.022)
Altman’s Z -0.211 0.852 0.064 0.004 (0.506) (0.812) (0.025) (0.005)
ROA- industry ROA 26.584 5.376 1.378 0.033 (17.402) (19.981) (0.961) (0.253)
Industry analyst gap -1.439 2.383 0.066 0.006 (1.041) (1.965) (0.099) (0.016)
Industry sales growth 0.169 -0.467 -0.000 -0.008 (0.169) (0.386) (0.017) (0.004)
Year fixed Effect Yes Yes Yes Yes
Firm fixed effect Yes Yes Yes Yes
N 6,536 6,536 6,536 6,536
Number of firms 1,042 1,042 1,042 1,042
R2 0.060 0.049 0.052 0.058
Model F 3.132 3.081 7.478 13.767
Notes. Clustered robust standard errors are reported in parentheses.

Appendix 3- Falsification test: Model 1 investigates effect on pre- AIPA period (1990-2000). Post
AIPA fake is the middle point of sample and receive value 1 after 1995. Model 2 is test of parallel
trend by including dummies for pre AIPA periods (Pre AIPA (-1) and Pre AIPA (-2)). Dependent
variables is analyst forecast error. All models include all control variables: R&D intensity,
Institutional ownership, Analyst coverage, Cash, Altman's Z, ROA- industry ROA, Industry
analyst gap, Industry sales growth in addition to firm and year fixed effects.
(1) (2)
Post AIPA 0.435
(0.206)
Post AIPA× treatment -0.152
(0.051)
Post AIPA fake 0.421
(0.253)
Post AIPA ×fake treatment -0.087
(0.078)
Pre AIPA(-1) -0.161
(0.351)
Pre AIPA(-1)× treatment 0.074
(0.128)
Pre AIPA(-2) 0.233
(0.413)
Pre AIPA(-2) × treatment -0.070
(0.136)
R&D intensity 6.200 3.013
(3.557) (1.34)
Controls Yes Yes
Year fixed Effect Yes Yes
Firm fixed effect Yes Yes
N 5424 6,536
Number of firms 966 1,042
Model F 5.799 2.544
Notes. All models control for Patent stock, Institutional ownership, Analyst coverage, Cash,
Altman's Z, ROA- industry ROA, Industry analyst gap, Industry sales growth in addition to firm
and year fixed effects. Clustered robust standard errors are reported in parentheses. .
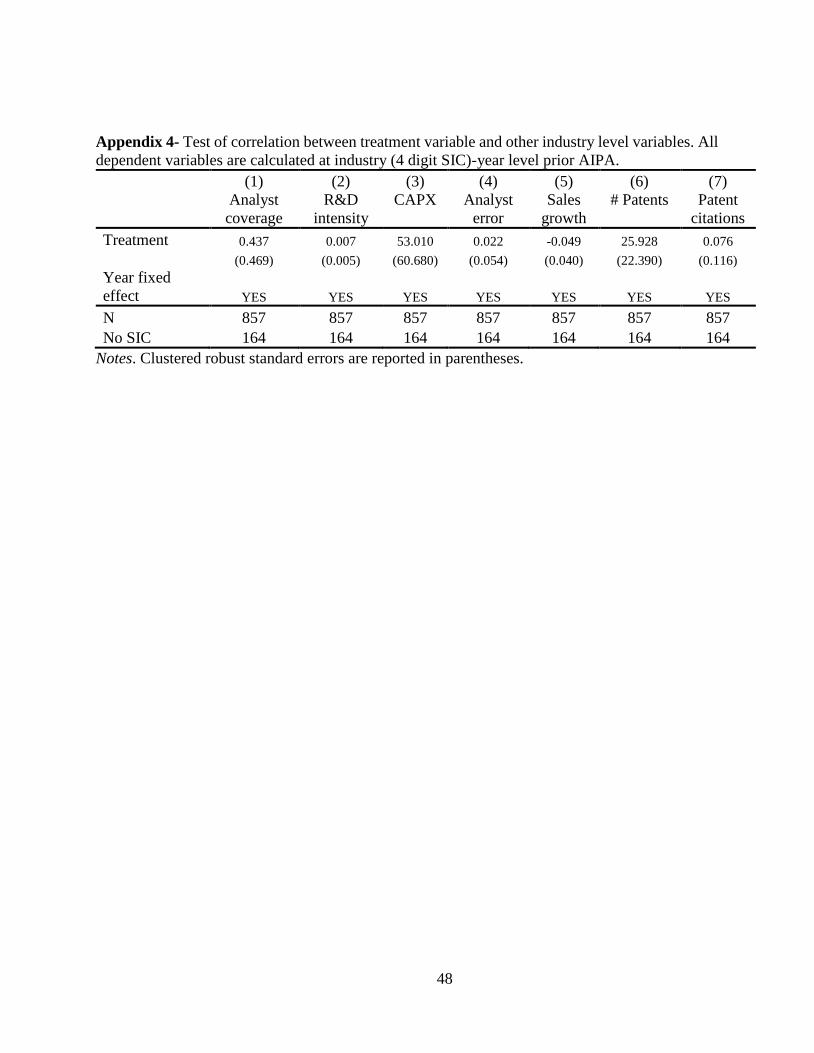
48
Appendix 4- Test of correlation between treatment variable and other industry level variables. All
dependent variables are calculated at industry (4 digit SIC)-year level prior AIPA.
(1) (2) (3) (4) (5) (6) (7)
Analyst
coverage
R&D
intensity
CAPX
Analyst
error
Sales
growth
# Patents
Patent
citations
Treatment 0.437 0.007 53.010 0.022 -0.049 25.928 0.076
(0.469) (0.005) (60.680) (0.054) (0.040) (22.390) (0.116)
Year fixed
effect YES YES YES YES YES YES YES
N 857 857 857 857 857 857 857
No SIC 164 164 164 164 164 164 164
Notes. Clustered robust standard errors are reported in parentheses.
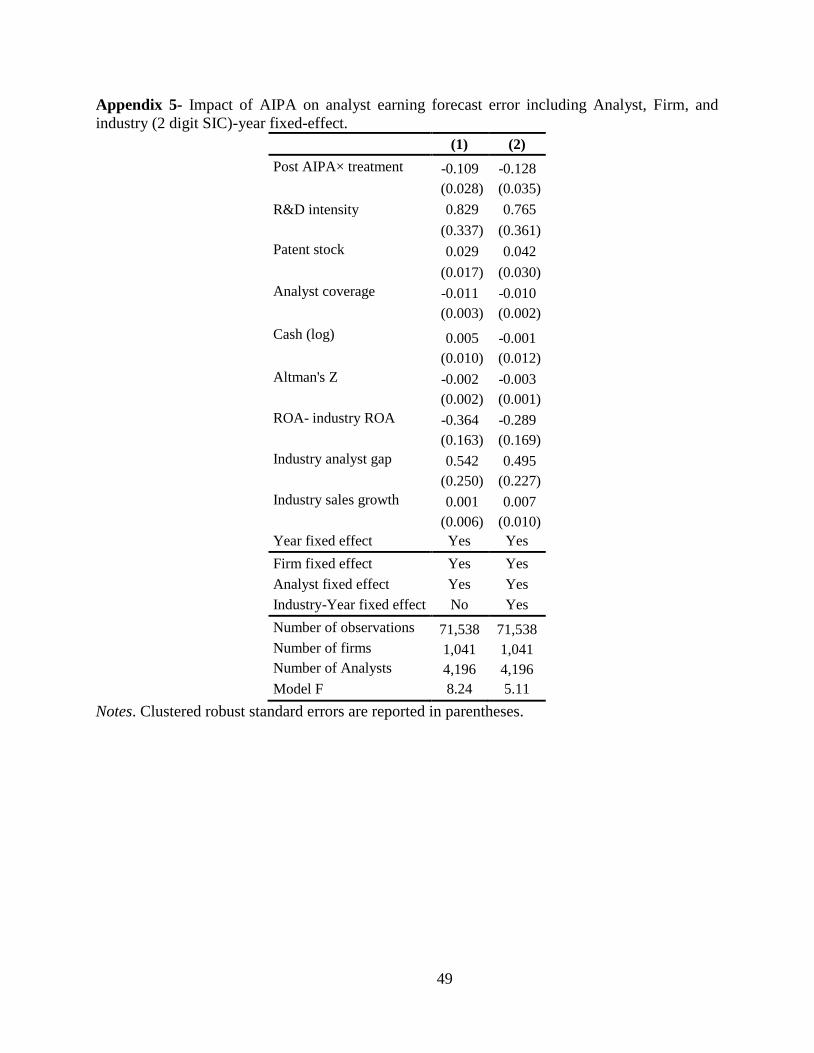
49
Appendix 5- Impact of AIPA on analyst earning forecast error including Analyst, Firm, and
industry (2 digit SIC)-year fixed-effect.
(1) (2)
Post AIPA× treatment -0.109 -0.128
(0.028) (0.035)
R&D intensity 0.829 0.765
(0.337) (0.361)
Patent stock 0.029 0.042
(0.017) (0.030)
Analyst coverage -0.011 -0.010 (0.003) (0.002)
Cash (log) 0.005 -0.001 (0.010) (0.012)
Altman's Z -0.002 -0.003 (0.002) (0.001)
ROA- industry ROA -0.364 -0.289 (0.163) (0.169)
Industry analyst gap 0.542 0.495 (0.250) (0.227)
Industry sales growth 0.001 0.007
(0.006) (0.010)
Year fixed effect Yes Yes
Firm fixed effect Yes Yes
Analyst fixed effect Yes Yes
Industry-Year fixed effect No Yes
Number of observations 71,538 71,538
Number of firms 1,041 1,041
Number of Analysts 4,196 4,196
Model F 8.24 5.11
Notes. Clustered robust standard errors are reported in parentheses.