graphical visualization of compiler optimizationswhalley/papers/jopl95.pdf · another advantage is...
TRANSCRIPT

Graphical Visualization of Compiler Optimizations*
MICKEY R. BOYD AND DAVID B. WHALLEYDepartment of Computer Science 4019, Florida State University, Tallahassee, FL 32306, U.S.A.
e-mail: [email protected] phone:(904) 644-3506
This paper describesxvpodb, a visualization tool developed to support the analysis of optimizationsperformed by the vpo optimizer. The tool is a graphical optimization viewer that can display thestate of the program representation before and after sequences of changes, referred to as transforma-tions, that results in semantically equivalent (and usually improved) code. The information andinsight such visualization provides can simplify the debugging of problems with the optimizer.Unique features ofxvpodbinclude rev erse viewing (or undoing) of transformations and the ability tostop at breakpoints associated with the generated instructions. The viewer facilitates the retargetingof vpo to a new machine, supports experimentation with new optimizations, and has been used as ateaching aid in compiler classes.
Keywords: Compilation Tools, Program Visualization, Optimization Viewer, Debugging
1. Intr oduction
To increase portability compilers are often split into two parts, a front end and a back end. The front
end processes a high-level language program and emits intermediate code. The back end processes the
intermediate code and generates assembly instructions for the target machine architecture. Thus, the front
end is dependent on the source language and the back end is dependent on the instruction set for the target
machine. Retargeting such a compiler for a new machine requires the creation of a new back end.While
the time and effort required to retarget a back end of a compiler to a new machine has decreased over the
years, performing this task in an expeditious manner still remains a problem. One reason is that the rate at
which new machines are being introduced has increased. Also, there is an increasing reliance on compilers
to perform highly sophisticated optimizations that exploit architectural features. Usually these optimiza-
tions can be applied most effectively in the back ends of compilers [1].
* A preliminary version of the optimization viewer was described inProceedings of the ACM SIGPLAN ’93 Conference on Program-ming Language Design and Implementationunder the title "Isolation and Analysis of Optimization Errors."A demonstration versionof the viewer is currently available for perusal.The files (which includes documentation, input data, and executables for a variety ofmachines) are available via anonymous ftp from ftp.cs.fsu.edu (128.186.121.27) in the /pub/whalley/xvpodb directory. Readers inter-ested in this research are encouraged to obtain these files and experiment with this demonstration version. Asis commonly the casewith graphical applications,xvpodbhas many characteristics that are difficult to describe in prose, but trivial to understand when seenand used.
-1-

Much of the effort required to retarget a back end occurs during testing. Long periods of time are
often spent attempting to determine why incorrect code is generated or why specific optimizations cannot
be applied.A significant portion of this effort is due to the inherent nature of optimizing compilers and the
inadequate debugging facilities of conventional source-level symbolic debuggers. Thereare many features
that a compiler writer would find useful when diagnosing problems in a optimizing compiler.
(1) Ideally, the program representation should appear in a easily readable display that is automaticallyupdated each time the data structure is changed.
The representation of a program being optimized is often stored in an encoded internal format. While the
compiler writer may have access to a function that will dump the contents of the data structure containing
this encoded information, repeatedly invoking this function is a tedious task.
(2) It would be desirable to have a tool that can indicate the exact portions of the representation that werealtered during a transformation.
An optimizer performs a series of transformations on the representation of a program.Each transformation
consists of a serial sequence of changes that results in semantically equivalent (and usually improved) code.
A compiler writer may wish to see the set of changes associated with a particular transformation.Even if
the compiler writer has the ability to dump the program representationin a readable format before and
after the transformation occurred, the actual differences may be difficult to detect.
(3) Programmersin general and compiler writers in particular would use data breakpoints more fre-quently if they were efficient and could be easily specified.
Data breakpoints are often available with source-level debuggers. Unfortunately, executing a debugger
while data breakpoints are set can result in prohibitively slow execution. Databreakpoints are also difficult
to set when dealing with dynamically allocated data structures (i.e. a traversal through the structure may be
required to specify the desired portion).Unlike many other types of applications, a large portion of the data
in compilers is dynamically allocated to hold the representation of the program being compiled.
(4) Theideal approach for discovering why an inv alid instruction(s) was generated is to set a data break-point on the specific invalid instruction(s) and view the transformations in reverse until the invalidinstruction(s) is discovered.
-2-

When diagnosing an error, a compiler writer may determine that a specific instruction (or set of instruc-
tions) caused the execution of the compiled program to produce incorrect output. The compiler writer
needs to know why the optimizer generated the incorrect instruction(s).Unfortunately, it is difficult to
reach the point that the invalid instruction(s) was generated during the compilation.1
A graphical optimization viewer, called xvpodb(X-windows VPO DeBugger), has been developed
that allows the programmer to view each optimization performed by the optimizer. One could obtain the
same information using a conventional source-level symbolic debugger to examine internal data structures.
However, this process is often slow, labor intensive, and prone to human error. The abstract, yet precise
way the transformations are presented by the viewer allows the compiler writer to see an application-
oriented view of the program representation, rather than struggling with inadequate debugging tools to
inspect the data structures.
The viewer, xvpodb, also recognizes the temporal aspect of a compilation.The vpo optimizer can
iteratively apply optimization phases many times during the optimization of a function.The viewer identi-
fies not only what changes occurred, but also when they occurred during the compilation (relative to other
changes). Conveying this temporal information to the compiler writer can simplify the eradication of bugs
that only manifest when a certain cascading set of optimization phases are applied to a specific function.
Selective viewing of the transformations performed byvpo is accomplished using breakpoints. The break-
point paradigm used inxvpodbis simple and efficient. It allows the compiler writer to quickly focus on the
desired portion of the compilation.The optimization viewer also has a feature that prevents a common
frustration that occurs with conventional source-level symbolic debuggers. Theviewer has the ability to
reverse the effects of any or all transformations performed in the order in which they were applied during
the compilation of a function.With this feature the compiler writer need not be concerned about executing
the optimizer "one step too far" and being forced to reexecute.
1 While data breakpoints are available (and inefficient) with some source-level debuggers, no current source-level debuggerssupport unlimited reverse execution.
-3-

This paper is structured as follows. Section2 describes the compiler that is viewed by usingxvpodb.
Section 3 depicts an overview of the functionality of the viewer. Section 4 illustrates some examples of
using the tool. Section 5 provides details about the implementation ofxvpodb. Section 6 discusses porting
the viewer to other machines and compilers. Section 7 gives insight about the viewer’s performance effi-
ciency. Section 8 describes related work and Section 9 summarizes the contributions of the paper.
2. Overview of the Compiler
The optimization viewer described in this paper supports the compiler technology known asvpo
(Very Portable Optimizer) [2], [3], [1]. The optimizer, vpo, replaces the traditional code generator used in
many compilers and has been used to build C, Pascal, and Ada compilers. The back end is retargeted by
supplying a description of the target machine. Using the diagrammatic notation of Wulf [4], Figure 1
shows the overall structure of a set of compilers constructed usingvpo. Vertical columns within a box rep-
resent logical phases which operate serially. Columns divided horizontally into rows indicate that the sub-
phases of the column may be executed in an arbitrary order. IL is the Intermediate Language generated by
a front end. Register transfer lists (RTLs) describe the effects of machine instructions and have the form of
conventional expressions and assignments over the hardware’s storage cells.For example, the RTL
r[1] = r[1] + r[2]; cc = r[1] + r[2] ? 0;
represents a register-to-register integer add on many machines. Whileany particular RTL is machine-
specific, the form of the RTL is machine-independent.
All phases of the optimizer manipulate RTLs. TheRTLs are stored in a data structure that also con-
tains information about the order and control flow of the RTLs within a function.One advantage of using
RTLs as the sole intermediate representation is that many phase ordering problems are eliminated. In con-
trast, a more conventional compiler system will perform optimizations on various different representations.
For instance, machine-independent transformations are often performed on intermediate code and machine-
dependent transformations, such as peephole optimizations, are often performed on assembly code.In
addition, local transformations (within a basic block) are often performed on DAG representations and
global transformations (across basic blocks) are often performed on three-address codes.Due to the
-4-

Front
End
Front
End
Front
End
Ada
Expanders
Code
Expanders
Code
Expanders
Machine
Description
Processor
register
MC68020VAX-11
MC88100
MIPSSPARC
transfers
Block Scheduling Delay
Slots
Basic
Analysis
Global
Branch Optimizations
Instruction Selection
Evaluation Order Determination
Register Allocation
Common SubexpressionElimination
Dead Variable Elimination
Code Motion
Recurrences
Strength Reduction
Induction VariableElimination
Object File
Code
IL IL IL
Instruction Fill
Opts Dataflow
CPascal
(source languages)
Intel 80386
Figure 1: Compiler Structure
overhead involved, translating from one representation to another is only typically done once. Thus, the
order in which optimizations are performed is fixed. By only using RTLs, most optimizations can be
invoked in any order and allowed to iterate until no further improvements can be found.
Another advantage is that since each RTL represents a legal machine instruction, the effect of a modi-
fication to the set of RTLs comprising a function is relatively simple to grasp. In contrast, most conven-
tional compiler systems generate code after optimizations. Thus, the optimizations are actually performed
on intermediate code. Since there is typically not a one-to-one mapping between an intermediate code
operation and a machine instruction, the effect of a modification on the final code that will be generated
may not be obvious in these systems.
-5-

3. FunctionalDescription of XVPODB
Thexvpodbviewer is a separate program that can execute concurrently with thevpooptimizer. Fig-
ure 2 depicts how viewing optimizations is typically accomplished.The circles represent processes and the
arrows show communication channels between the processes. The optimizer is executed within a source-
level debugger, which allows the compiler writer to control the execution of the compiler and inspect inter-
nal data structures. Information is passed fromvpo to xvpodbabout the compilation of a source file.The
message passing paradigm chosen provides the user with the option of executing vpo andxvpodbon two
different machines. Due to the use of X Windows, the user also has the option to view the output windows
of these two process groups on yet another machine. This allows the user to use the resources of up to three
machines, thus speeding up the debugging cycle.
The vpo optimizer will first pass a set of messages that describes the initial state of all RTLs in the
function currently being compiled before performing optimizations. After receiving these messages,
xvpodbwill display this initial set to the user. Subsequently, messages containing descriptions of all
XVPODB
X-Window Server
VPO
Symbolic
Debugger
Figure 2: Typical Use of XVPODB
-6-

changes to the RTLs as they occur will be passed toxvpodb, which stores them for later interpretation at the
request of the user. If a new file is compiled, then both the optimizer and xvpodb have to be reinitialized.
The viewer does not have to be executed concurrently with the compiler. A separate program was
developed to receive the messages from the compiler and store them in a file.Another simple program was
implemented to read the messages from a file and send them toxvpodb. Thus, vpo’s message sending
paradigm can be simulated without the overhead of performing the actual compilation. This feature is very
useful when usingxvpodbas a teaching aid.
Perhaps the best analogy forxvpodbwould be a video editing machine. The changes described in the
messages sent by the compiler are analogous to the individual frames of a movie. Thesequential sets of
changes that represent transformations are comparable to scenes in the movie. Thexvpodbviewer can be
thought of as a video editing machine that has the ability to show scenes in forward or reverse, to quickly
locate any scene or set of scenes in the movie, and to show as much or as little detail (individual frames)
about any scene in the movie as desired.Thus,xvpodbcan show a compiler writer exactly what happened
to the program representation during any portion of the optimization process. If one wishes to study a par-
ticular optimization phase, thenxvpodbcan depict only the transformations performed by that phase. If one
desires to examine a particular instruction, thenxvpodbcan isolate only those transformations that directly
affected that instruction. These breakpoint criteria can be combined.For example,xvpodbcan show any
changes to a selected instruction that occurred in a specified optimization phase during the entire optimiza-
tion process. All of these operations can be performed in both forward and reverse directions.
3.1. Main Window
Figure 3 depicts the main window of xvpodb. This window consists of three sections. The large
middle section of the window displays a portion of the RTL structure at a given point during the compila-
tion of one of the functions.2 The RTLs are shown contained in rectangles, which represent basic blocks.
The basic blocks are shown in the order in which they will appear when generated as assembly instructions.
2 The RTLs in Figure 3 describe SPARC instructions in the functionmklinewithin the UNIX utility banner.
-7-

Figure 3: Main Window for XVPODB
-8-

The RTLs themselves are displayed in human readable form (not the encoded internal format used byvpo).
The highlighted RTLs are those that are affected by the transformation being viewed. Thescrollbar to the
left of the display area can be used to view any part of the current set of RTLs.
Transfers of control between basic blocks are depicted using arcs (the arrowheads on the arcs indicate
direction of transfer). Short arcs with double arrows were used to represent arcs that are longer than two
screen lengths since long arcs are difficult to trace by a user and often resulted in a cluttered display.
Instead, the user can use the right mouse button to automatically follow the control flow between blocks.
The RTL display will be centered on the target block of a branch or jump by clicking the right mouse but-
ton on the header of the basic block containing the transfer of control.If the user clicks the right mouse
button while holding down the shift key in a basic block header, then the RTL display will be centered on
the basic block that branches or jumps to the specified block.3
In the top section of the window are a set of labels that provide information to the user. These labels
indicate the name of the function being examined, the optimization phase in which the current transforma-
tion is performed, the number of the current transformation, and the total number of transformations that
have been received for this function. Also shown is the current state of the transformation.A BEFORE
state indicates that the current transformation has not yet been applied to the RTLs displayed. If an RTL is
highlighted in a BEFORE state, then the RTL will be deleted or modified in some manner. An AFTER
state indicates that the current transformation has been applied. Highlighted RTLs in an AFTER state were
either inserted or altered.In addition, a label is displayed that shows the number of highlighted RTLs. A
user may find this number useful since all highlighted lines may not fit on the screen at one time.
The bottom section of the main window contains buttons that represent the different options available
to the user via mouse clicks.Four of these buttons resemble the controls on an audio cassette player
(including audio reverse). Whenthe Step Forward (>) and Step Backward (<) buttons are clicked,
xvpodbdisplays the next or previous transformation, respectively. The user can view a full transformation
3 If there is more than one branch or jump to the specified block, then a list of the blocks containing these transfers of controlwill be displayed.
-9-

with two clicks of the mouse.For instance, assume the viewer is displaying the BEFORE state of a trans-
formation (as in Figure 3).With one mouse click on the> button the AFTER state of the same transforma-
tion will be shown. Selecting> again will result in the BEFORE state of the next transformation being dis-
played. The< button works similarly, except that the user either proceeds from the AFTER state to the
BEFORE state of the same transformation or from the BEFORE state to the AFTER state of the previous
transformation. TheContinue Forward (>>) and Continue Backward (<<) buttons are similar to> and
<, except the viewer continues to apply transformations until either a breakpoint is reached or the end or
beginning of the transformation list is encountered.Breakpoints can be set, listed, and deleted by selecting
the Set/List/Delete Breakpoints button and using its associated windows. Managingbreakpoints is dis-
cussed in the following section.
The user can view the transformations serially or at specified breakpoints, either in the forward
(showing the transformations being applied) or reverse (showing them being undone) direction. In other
words, the user does not need to reexecute anything to view a previously applied transformation. The user
can reverse the effects of any or all transformations with a few mouse clicks. This process does not affect
the ability to interpret transformations in the forward direction.Thus, the user can view a transformation or
set of transformations being applied and reversed as many times and in as many areas of the compilation as
desired, which is very useful for comprehending the full effect of complicated transformations.Also, the
programmer need not compile the entire function to be able to view transformations. Theviewer will allow
the user to see any transformations that have already been received from vpo. The programmer can step
vpo using a source-level debugger through its optimization of a function one transformation at a time.
Thus, at any giv en point one can both view the graphical representation of the RTLs and study the actual
data structures and source code in the optimizer that produced it.
3.2. ManagingBreakpoints
There are three types of breakpoints inxvpodb. The simplest is atransformation numberbreakpoint.
The user enters a transformation number or numbers andxvpodbwill break at the BEFORE or AFTER
state of these transformations (depending on the direction of viewing). Sincevpo knows the number of
-10-

each transformation it sends toxvpodb, this provides a convenient way to coordinate breakpoints in both the
compiler and the viewer.4
The user selects a set of optimization phases to create anOptimization Phasebreakpoint. Afterclick-
ing on a continue button, the viewer will stop whenever one of these phases is encountered.The first or last
transformation in the phase will be displayed, depending on whether the>> or << button was selected.
The final type is anRTLbreakpoint. Theuser can choose a set of RTLs to be associated with a set of
optimization phases selected. The viewer will stop whenever any of the selected RTLs is changed in any
way during any of the selected phases for that breakpoint. Figure 4 shows several of the menus used to set
this type of breakpoint.
Figure 4: Setting Breakpoints in XVPODB
4 The transformation numberbreakpoints also allow a user to quickly view an inv alid transformation identified by the error iso-lation tool calledvpoiso[5].
-11-

The user also has the option to list and delete the existing breakpoints. The user can simply list the
transformation numbers associated with the currenttransformation numberbreakpoints and click on the
numbers to be deleted. More information is provided for theRTLbreakpoint, as shown in Figure 5.How-
ev er, these breakpoints are associated with actual instructions that may have been altered since the break-
point was set. The user needs information to remember the reason for setting the breakpoint.Therefore,
the user is also shown the transformation number and the text of each RTL in the breakpoint when the
breakpoint was set.
Figure 5: Listing and Deleting Breakpoints in XVPODB
3.3. OtherOptions
Selection of theOptionsbutton in the bottom section of the main window pops up a menu of buttons
that implement less commonly used features of the viewer. This menu is shown in Figure 6. The options
were placed in a separate menu to reduce screen clutter and provide a convenient place for future
-12-

Figure 6: Options Window
developers to add minor features to the viewer. The Proceed to Next Functionbutton is used to instruct
xvpodbto discard the current function data and interpret the next function that was compiled.The Go To
Initial Setbutton allows the user to undo all transformations for the current function. Thus, a view of the
-13-
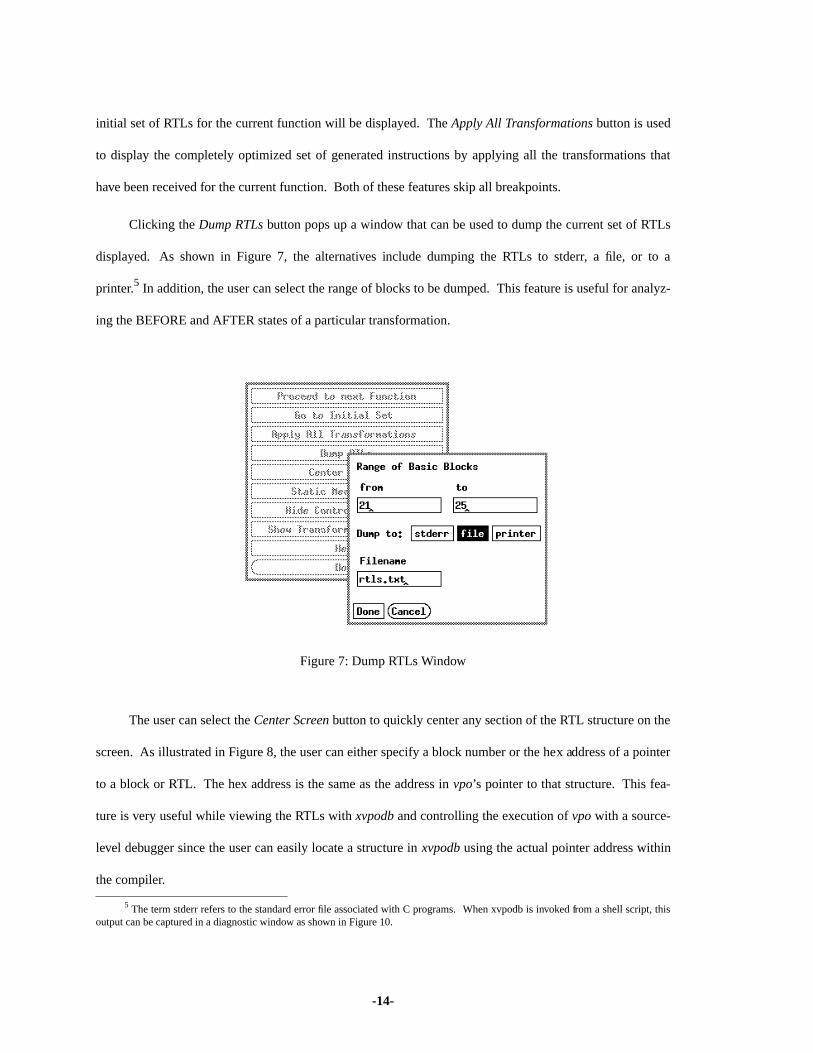
initial set of RTLs for the current function will be displayed.TheApply All Transformationsbutton is used
to display the completely optimized set of generated instructions by applying all the transformations that
have been received for the current function. Both of these features skip all breakpoints.
Clicking theDump RTLsbutton pops up a window that can be used to dump the current set of RTLs
displayed. Asshown in Figure 7, the alternatives include dumping the RTLs to stderr, a file, or to a
printer.5 In addition, the user can select the range of blocks to be dumped.This feature is useful for analyz-
ing the BEFORE and AFTER states of a particular transformation.
Figure 7: Dump RTLs Window
The user can select theCenter Screenbutton to quickly center any section of the RTL structure on the
screen. Asillustrated in Figure 8, the user can either specify a block number or the hex address of a pointer
to a block or RTL. Thehex address is the same as the address invpo’s pointer to that structure. This fea-
ture is very useful while viewing the RTLs withxvpodband controlling the execution ofvpowith a source-
level debugger since the user can easily locate a structure inxvpodbusing the actual pointer address within
the compiler.
5 The term stderr refers to the standard error file associated with C programs.When xvpodb is invoked from a shell script, thisoutput can be captured in a diagnostic window as shown in Figure 10.
-14-

Figure 8: Center Screen Window
Measurements about the current display of RTLs can be obtained by selecting theStatic Measure-
mentsbutton. Figure9 shows the window that pops up containing a scrollable display of information.The
set of natural loops with the number of instructions and memory references at each loop nesting level is
shown. A user can quickly grasp the benefit of the optimizations performed on a function by viewing these
measurements at the initial set of RTLs and after all transformations have been applied.
Figure 9: Static Measurements Window
Clicking theHide Controlflow Arcs toggle allows the user to turn off (or back on) the drawing of arcs
that represent the control flow between basic blocks. Arcs will be drawn by default. This feature is
-15-

convenient when using a very slow X server or if the RTLs are being displayed over a long haul network.
Sometimes it may not be clear to a user ofxvpodbexactly what changes occurred during avpo trans-
formation. Byselecting theShow Transformation Detailstoggle, the user will be shown information about
ev ery change message sent byvpo for a transformation. This information is displayed whenever the user
advances to the BEFORE state of a transformation.For instance, Figure 10 shows the details of the trans-
formation illustrated in Figure 3.
Figure 10: Transformation Details
3.4. ObtainingInformation on RTLs or Basic Blocks
Information is provided byxvpodbthat allows the user to easily locate the desired portion ofvpo’s
internal data structure.For example, the programmer can find the pointer address used byvpo for any RTL
or basic block simply by clicking on it inxvpodb. The user can use this pointer address in the source-level
debugger to access that actual portion of the data structure invpo.
If the user clicks the middle mouse button on an RTL in the main RTL display, then a window will
appear showing extended information about the RTL. This information includes separate lines for the text
of the RTL and its dead register list and side effects. Thispopup window is typically wide enough to com-
pletely display all of these fields.
Similarly, the user can click the middle mouse button on a basic block header to obtain extended
information about that basic block.This information, which is illustrated in Figure 11, includes the pointer
addresses of the block, its predecessors, and its successors.Some commonly used data and control flow
-16-

information is also calculated and displayed.
Figure 11: Detailed Basic Block Information Window
4. Examplesof Using the Viewer
To illustrate the power ofxvpodb, the process of using the viewer to diagnose an error and to under-
stand how a particular RTL was generated is described.
4.1. Diagnosingan Error
One of the major benefits ofxvpodb is to assist a compiler writer when diagnosing optimization
errors. To illustrate the use ofxvpodb in this process, the authors modified the code within thevpo
-17-

optimizer to erroneously perform induction variable elimination. The modification was to comment out the
code that checks if the induction variable was live after exiting the loop.6 Figure 12 shows the BEFORE
and AFTER states of the invalid transformation.7 The instruction incrementing induction variabler[10] is
deleted as a result of the transformation.Yet r[10] is used after the loop as an argument toprintf, as
depicted in the last RTL of block 6. Detecting that the RTL that incrementsr[10] should not have been
deleted is easily accomplished by being able to view the BEFORE and AFTER states of the transformation.
In addition, the compiler writer can reexecute vpo within a source-level debugger and stop at the point
before the transformation was performed to discover why the transformation occurred. This point in the
execution can easily be reached sincevpoalso counts the number of transformations performed during the
optimization of a function.A simple conditional breakpoint on the transformation counter will suffice.
Figure 12: Inspecting the BEFORE and AFTER States of an Invalid Transformation
6 We had to manufacture an error to illustrate usingxvpodbto find an optimizer problem since we currently don’t know of anyerrors in thevpocompiler.
7 Note that the BEFORE and AFTER states of a transformation cannot both be displayed at the same time inxvpodb. Display-ing both simultaneously was deemed to require too much space on a screen since a user will typically have another window displayingthe compiler being executed within a source-level debugger at the same time. Besides being able to rapidly flip between the BEFOREand AFTER states of a transformation using the> and< buttons, the user can dump the BEFORE and AFTER states of the basicblocks involved in the transformation to a file or a printer, as shown in Figure 7. In addition, the user can obtain details about the spe-cific set of changes that comprise a transformation, as shown in Figure 10.
-18-

4.2. UnderstandingHow an Instruction Was Generated
Another benefit ofxvpodbis to allow a compiler writer to quickly understand how a particular RTL
was generated. Initially, the user directs the optimization viewer to reach a point when the particular RTL
has been produced. This is easily accomplished by selecting theApply All T ransformations button
(located in the options menu), which causes the viewer to display the completely optimized set of RTLs.
For instance, Figure 13 shows the RTLs of a function after all optimizations have been applied. It may not
be obvious to a user how the fifth instruction in block 12, a left shift operation, was generated.Next, the
Figure 13: After All Optimizations
-19-

user sets anRTLbreakpoint to cause the viewer to stop on any change to the desired RTL. At this point the
user can view each transformation involving this RTL being undone by successively clicking <<.
Figures 14 and 15 shows the AFTER and BEFORE states of the previous transformation involving
the left shift instruction. The transformation can be analyzed by clicking< and> as many times as neces-
sary. By stepping backwards with the< button, the user is able to determine that the left shift was gener-
ated by applying strength reduction on a multiply operation, as shown in Figure 15. The user can click<<
Figure 14: After State of the Last Transformation Affecting the Instruction
-20-

until the transformations that produced the particular RTL are understood. If desired, the user could click
>> to view each transformation being reapplied to the RTL.8
Figure 15: Before State of the Last Transformation Affecting the Instruction
5. ImplementingXVPODB
The implementation ofxvpodb required obtaining information fromvpo about the compilation,
retaining this information, and interacting with the user.
8 If an invalid instruction has been identified and a tool like vpoiso[5] is unavailable, then this technique can also be used to vi-sually isolate the incorrect transformation.
-21-

5.1. ObtainingInformation from the Compiler
Thevpooptimizer was modified to send information about the optimization of a file toxvpodb. This
information was communicated via messages using UNIX sockets, but could easily be redone using remote
procedure calls (RPCs).Internet stream sockets were used to guarantee reliable communications and allow
long haul operation of the viewer. Most of the types of messages sent fromvpo to xvpodbare shown in
Table 1. The first set of messages in the table are used to indicate toxvpodbwhen the changes occurred
during the compilation. The second set of messages describe the actual changes to the program representa-
tion.
Coordination Messages
machine dependent informationbegin functionend functionbegin optimization phaseend optimization phasebegin transformationend transformationend compilation
Change Messages
create new basic blockfree up basic blockmodify basic block labelmodify control flow successor of blockmodify output position successor of blockinsert new RTLdelete RTLmove RTLmodify RTLmodify RTL dead register listmodify RTL side effect list
Table 1: Message Types fromvpoto xvpodb
The sequence of messages is described by the following BNF grammar.
-22-

<compilation> ::= MACHINE_DEPENDENT_MSG<function>*END_COMPILATION_MSG
<function> ::= BEGIN_FUNC_MSG<phase>*END_FUNC_MSG
<phase> ::= BEGIN_PHASE_MSG<transformation>+END_PHASE_MSG
<transformation> ::= BEGIN_TRANS_MSG<change>+END_TRANS_MSG
<change> ::= a specific change message
The <compilation> of a file produces a machine dependent information message, information about
zero or more functions, and a message indicating the end of the compilation of the file. The machine
dependent message contains information that allows xvpodbto properly recognize a memory reference and
a register for the target architecture.Each<function> consists of zero or more optimization phases
enclosed by messages that indicate the beginning and end of the function.Each optimization<phase>
consists of begin and end phase messages that bracket one or more transformations.Each<transfor-
mation> consists of one or more<change>s and is surrounded by messages indicating the beginning
and end of the transformation.
Functions that construct phase and transformation messages were invoked in vpoat the points that an
optimization phase or transformation could potentially begin and end.However, a begin transformation
message was not sent until it was determined that the transformation contained at least one change. If the
begin transformation message was the last message to be sent before an end transformation message was
constructed, then both messages were aborted.Likewise, a begin phase message was not sent until it was
determined that the phase contained at least one nonempty transformation.Av oiding the transmission of
empty phases and transformations reduced the socket traffic betweenvpo andxvpodband eliminated the
viewing of empty transformations by the user.
5.2. Main Data Structures
There are two main data structures inxvpodb, theOptimization Listand theScreen List. These data
structures are depicted in Figure 16.TheOptimization Listis a doubly linked list of nodes. Each of these
-23-

r[8]=(B[r[8]]{24)}24;
r[11]=r[11]+1;
r[9]=r[8];
r[8]=r[11];
IC=r[8]?0;
Optimization List Screen List
Figure 16: Main Data Structures in XVPODB
nodes represent a decoded message. This list is descended when performing forward transformations and
ascended when reversing transformations.A single pointer to this list represents the point during the com-
pilation that is currently being displayed byxvpodb. The act of stepping or continuing moves this pointer
in the appropriate direction. All transformations above the pointer and none below will have been applied
to the initial set of RTLs. Any information needed to reverse a change is stored in the node associated with
the change message when the transformation is applied.This information is used to restore the screen rep-
resentation of the RTL or basic block to its previous state while ascending the list (undoing transforma-
tions).
Thescreen listis a singly linked list of nodes, each node containing (among other things) one small
section of the main RTL viewing area. These nodes represent the current state of all RTLs and basic
blocks. Nodesare modified as transformations are applied or reversed. Asimple routine copies all of the
small screen sections to an area of memory that will be displayed after performing a step or continue opera-
tion. Thescreen listnodes are created, modified, or deleted as change messages are processed.
-24-

To illustrate how these data structures are manipulated, a description of the processing of change
messages in both directions is given. Figure10 shows the information represented by the three change
messages that comprise the transformation illustrated in Figure 3. The forward processing of themodify
RTLmessage requires storing a copy of the old RTL text in theOptimization Listnode associated with this
change message. After copying the old RTL text, the actual modification is applied to RTL text field in
both theOptimization ListandScreen Listnodes. Asimilar process will occur for themodify RTL dead
register listmessage, except the dead register list is copied and then updated. The forward processing of a
delete RTLchange requires saving the previous RTL’s ID (saving the location at which it can be reinserted
in preparation for reverse viewing) in theOptimization Listnode associated with this change message.In
addition, the character strings representing the RTL, the dead register list, and the side effect from the
Screen Listnode are copied into theOptimization Listnode. Aftercopying this information, theScreen List
node associated with the RTL is deleted.
The information saved during the forward processing of a transformation will be used when a trans-
formation is reversed. Thebackward processing of themodify RTLchange simply requires copying the
character string stored in the old RTL text field of theOptimization Listnode during the forward processing
of this change message to the RTL text field of both theOptimization ListandScreen Listnodes. Asimilar
process will occur for themodify RTL dead register list message, except the dead register list is restored.
Reversing thedelete RTLmessage requires creating aScreen Listnode and using the saved RTL’s ID to
place it in its former location in theScreen List. Next, the saved character strings in theOptimization List
node representing the RTL, dead register list, and side effect will be copied to their counterpart fields in the
Screen Listnode.
The exclusive use of RTLs as the intermediate representation invpogreatly simplified the design and
implementation ofxvpodb. Because there is only one type of data structure for the program representation,
only one algorithm had to be developed to process change messages and produce a view of the data struc-
ture.
-25-

5.3. DiagnosingConsistency Errors between the Compiler and the Viewer
One of the most challenging problems during the development ofxvpodbwas to ensure that the RTLs
displayed byxvpodbexactly matched the information in the data structures ofvpo. Thevpooptimizer is a
large program consisting of about 25,000 lines of source code.The optimizer had to be updated to accu-
rately report all changes associated with the RTLs toxvpodb. Specific changes could easily be overlooked
or reported inaccurately. In addition, a consistency error could occur if a transformation was applied or
reversed incorrectly inxvpodb. If an inconsistency between the structures invpoandxvpodbwas detected,
then the exact point invpoor xvpodbthat caused the inconsistency had to be found.
A method for performing a sanity check was developed to ease the diagnosis of consistency errors
between the compiler and the viewer. A programmer can issue a function call withinvpoat any point dur-
ing the compilation that will send toxvpodba set of messages that describe the current state of the RTLs in
vpo.9 The viewer compares this information to its internal representation of RTLs and will report any differ-
ences between the two structures. Thus,xvpodbcan be instructed to check itself for consistency, which
greatly simplified the debugging of both the viewer and the modifications tovpo.
6. Portability Issues
The optimization viewer is quite easy to retarget to versions ofvpo for other architectures.10 The
code comprisingxvpodb itself is machine-independent. The messages passed fromvpo to xvpodbare
accomplished via system calls using UNIX sockets. TheUNIX operating system has been retargeted to a
greater number of different machines than any other operating system. The optimization viewer was devel-
oped in X-Windows. AsUNIX has become the most popular and portable operating system, X-Windows
appears to be achieving the same goals as a graphical environment. Afinal feature that enhances portability
is that the general form of RTLs is machine-independent.This allows algorithms that perform transforma-
tions on the RTLs to be implemented in machine-independent code.Since most of the transformations on
9 This sanity check function reuses the same set of utility functions that send the initial set of messages toxvpodb.10 Currently,xvpodbcan display the effects of optimizations for versions ofvpo that have been retargeted to the SPARC and
Motorola 680x0 architectures.
-26-

RTLs in vpoare accomplished in a machine-independent fashion, there are few additional changes required
due to the addition ofxvpodbwhen retargetingvpoto a new machine.
One machine-dependent issue is how xvpodbcan recognize registers and memory references since
the form may vary with versions ofvpo retargeted to different machines. The viewer needs to recognize
memory references to accurately show information about the current display of RTLs when theStatic Mea-
surementsoption is selected.Similarly, registers have to be recognized to calculate the live registers enter-
ing and exiting a basic block when the middle mouse button is used to obtain the live register information
on a basic block.As mentioned previously, the first message sent fromvpo to xvpodbcontains machine-
dependent information for the target architecture.This information includes a set of two character
sequences that are associated with memory references.For instance, a integer memory reference in a
SPARC RTL has the formR[addr], where theaddr is the particular addressing mode used in the memory
reference. Thus,there is a memory reference whenever an R[ is encountered in a SPARC RTL. Other
information includes the characters preceding a left bracket that represent a register, the number of each
type of register, and the registers that should not be displayed in the live register information (e.g. the stack
and frame pointers).
The viewer could be adapted to display transformations in many other optimizing compilers without
an excessive amount of effort. The information about RTLs, dead register lists, and side effects were
decoded into character strings before being sent in messages toxvpodb. Many other optimizers maintain
the program representation in a single format comparable to that invpo (e.g. basic blocks, etc.).The
changes to the program representation during transformations in these other optimizers will also be compa-
rable (e.g. deletions, insertions, modifications, etc.).For instance, modifying the viewer to display transfor-
mations for agcccompiler would not be too difficult.
7. Performance Efficiency
There are three aspects of performance efficiency that should be considered. The first performance
issue is the overhead placed on the compiler. The second issue is the storage requirements for the viewer.
-27-

The final issue is the viewer response time to user selections.
It has been found that thevpooptimizer executes a little over two times slower on a SPARC 10 when
it has to send messages toxvpodb. Most of this time is due to interfacing with the operating system by
sending the messages via sockets. Initially, the authors considered makingxvpodbpart of the same process
as the optimizer. This idea was rejected due to concerns about the total memory requirements of such a
process and the flexibility that separating the viewer into a separate process would provide. For instance,
the authors have implemented a simple program to receive messages from the compiler and store them into
a file and a simple program to read these messages from the file and send them to the viewer. Thus, the
viewer can be executed without the compiler, which is quite useful for providing demonstrations to students
in a compiler class. At this point, the authors have found the optimizer overhead acceptable.
The amount of memory required byxvpodbcan be quite large depending upon the size of the source
file and the number of RTLs in a function.Whenever the viewer receives a message from the compiler, it
appends the message to theOptimization List. Messages are only deleted from theOptimization Listwhen
the user selects to proceed to the next function. If the source file being compiled contains many functions,
then there may be many messages sent toxvpodb. To avoid having to save an excessive number of mes-
sages in theOptimization Listat any one time, the compiler writer can invoke the optimizer from a source-
level debugger and not optimize a succeeding function until having completed viewing the current function.
The amount of memory needed to display the RTLs is dependent on the size of the current function.
First, the viewer must save information about each of the current RTLs being displayed in theScreen List.
Information from theScreen Listis copied to an area of memory that will be displayed each time a step or
continue operation is performed. The authors found that functions containing a very large number of RTLs
will cause the viewer to abort due to allocating too much memory to represent the pixels in the display,
which was apparently a limitation imposed by X-Windows. Therefore,xvpodbwas modified to limit the
maximum number of RTLs that could be displayed at any one time. When the limit is exceeded, only a
portion of the RTLs are displayed and the user is informed that the display is incomplete. This limit is large
enough that most compiled functions can be entirely viewed.
-28-

The viewer response time to user selections is very fast once the compiler stops sending messages to
xvpodb. Stepping forward or backwards is usually accomplished in less than one second. The response
time from continuing forward or backwards depends on the number of transformations to process, but typi-
cally can be accomplished in only a few seconds. Theresponse time to events that cause the RTL display
to be redrawn is also dependent on the number of RTLs that are currently being displayed.However, the
authors have found the response time acceptable even for functions that approach the maximum limit of
displayable RTLs.
8. RelatedWork
There have been several systems that provide some visualization support for the parallelization of
programs. Thesesystems include thepat toolkit [6], theparafrase-2environment [7], thee/spsystem [8],
and a visualization system developed at the University of Pittsburgh [9]. All of these systems provide sup-
port for a programmer by illustrating the dependencies that may prevent parallelizing transformations from
occurring. Auser can inspect these dependencies and assist the system by verifying whether a dependency
is valid or can be removed.
The UW Illustrated Compiler [10], also known asicomp, has been used by undergraduate compiler
classes to illustrate the compilation process.The icompcompiler graphically displays its control and data
structures during the compilation of a program.A feature called hookpoints is used to specify points in the
compiler to update the windows that have changed since the last hookpoint was executed. Byspecifying
hookpoints and breakpoints in the compiler a user can control the rate at which views are displayed during
a compilation.
There are many differences between the parallelization systems,icomp, and xvpodb. The main pur-
pose for developing the parallelization systems was to allow a programmer to assist in the process of paral-
lelizing code. The purpose for developing theicompcompiler was for use as a teaching tool in an under-
graduate compiler class. The main purpose for constructingxvpodbis to assist a compiler writer when
retargeting thevpo compiler to a new machine. Thexvpodbtool can also be used as a teaching tool in a
-29-

compiler class to illustrate various compiler optimizations.
The portion of the compilation process being viewed also differs between these systems. The paral-
lelization systems that illustrate a portion of the compilation process either illustrate source to source trans-
formations or depict high-level optimizations on intermediate code.The icompcompiler shows views of
different portions of the compilation process, which includes lexical analysis, parsing, semantic analysis,
and code generation.No optimizations are performed by the compiler. In contrast,xvpodbdisplays the
effects of optimizations on RTLs exclusively. Each RTL represents a valid instruction for a machine.Thus,
the effect that each transformation has on the final code that will be generated can be easily grasped by the
user.
There are also differences in how a particular transformation can be reached before it is displayed.In
general, the parallelization systems step the user through the transformations since the purpose is to have
the user assist in parallelizing the code.Always stepping through each transformation would not be feasi-
ble with icompandxvpodbdue to the number of transformations being applied.The icompcompiler allows
breakpoints and hookpoints to be set at different locations in the source code of the compiler. It does not
have the ability to stop when a user-specified portion of a view is updated. Thexvpodbtool allows break-
points to be set associated with updates to a specific portion of the information representing a function.
This feature is very useful for quickly isolating the transformations that effect a particular portion of the
program.
Only the University of Pittsburgh visualization system andxvpodballow rev erse viewing of transfor-
mations. Unlike xvpodb, the University of Pittsburgh visualization system can also prevent a transforma-
tion from occurring. This ability to undo transformations allows a user of their system to remove the
effects of a transformation deemed ineffective or inappropriate. Reverse viewing inxvpodballows a user to
quickly grasp how a particular portion of the code was generated.Reverse viewing was feasible in both of
these systems since the information about the program is represented in only a single type of data structure.
By retaining information about each change to this data structure, the ability to undo transformations can be
accomplished without excessive complexity.
-30-

9. Conclusions
The viewer described in this paper provides several important benefits when retargeting the back end
of a compiler. Displaying the program representation at any giv en point during the optimization of a func-
tion, stopping at breakpoints associated with the generated code, and reverse viewing of transformations are
all helpful features for analyzing problems with an optimizer. Compilers can also be used to guide instruc-
tion set design by determining if proposed architectural features can be exploited [11]. Decreasing the time
to retarget a compiler to a proposed architecture would also decrease the time required to design and
develop a new machine.
Additionally, xvpodbcan be used as a teaching aid for advanced compiler classes.Many recently
introduced machines require sophisticated compiler optimizations to exploit their architectural features.
Advanced compiler courses that present techniques to perform these types of optimizations may soon
become more common.A tool that would allow a student to interactively visualize the effect of each trans-
formation would be quite useful in illustrating these optimizations.
10. Acknowledgements
The authors thank Jack Davidson for allowing vpo to be used for this research. The identification of
each change and the sequences of changes that comprised the transformations invpowas simplified by the
high quality of coding ofvpo, which is in a very large part due to the efforts of Manuel Benitez.Charles
Kacmar provided useful information for using Xlib. Taliver Heath implemented the initial version of the
portion ofxvpodbthat calculates the dominator information. Ashwin Goyal implemented the initial version
of the portion ofxvpodbthat calculates the live register information.
11. REFERENCES
[1] M. E. Benitez and J. W. Davidson, “A Portable Global Optimizer and Linker,” Proceedings of theSIGPLAN ’88 Symposium on Programming Language Design and Implementation, pp. 329-338(June 1988).
[2] J.W. Davidson and C. W. Fraser, “Code Selection through Object Code Optimization,” Tr ansactionson Programming Languages and Systems6(4) pp. 7-32 (October 1984).
-31-

[3] J. W. Davidson, “A Retargetable Instruction Reorganizer,” Proceedings of the SIGPLAN ’86 Sympo-sium on Compiler Construction, pp. 234-241 (June 1986).
[4] W. Wulf, R. K. Johnsson, C. B. Weinstock, S. O. Hobbs, and C. M. Geschke, The Design of anOptimizing Compiler,American Elsevier, New York, NY (1975).
[5] D. B. Whalley, “Automatic Isolation of Compiler Errors,” ACM Transactions on Programming Lan-guages and Systems, (accepted August 1993).
[6] B. Appelbe, K. Smith, and C. McDowell, “Start/Pat: A Parallel-Programming Toolkit,” IEEE Soft-ware6(4) pp. 29-40 (July 1988).
[7] D. Polychronopoulos, M. Girkar, M. Haghighat, C. Lee, B. Leung, and D. Schouten, “Parafrase-2:An Environment for Parallelizing, Partitioning, Synchronizing, and Scheduling Programs on Multi-processors,”Proceedings of 1989 International Conference on Parallel Processing, pp. 39-48(August 1989).
[8] J. Browne, K. Sridharan, J. Kiall, C. Denton, and W. Eventoff, “Parallel Structuring of Real-TimeSimulation Programs,” COMPCON Spring ’90: Thirty-Fifth IEEE Computer Society InternationalConference. Intellectual Leverage. Digest of Papers., pp. 580-584 (February 1990).
[9] Chyi-Ren Dow, Shi-Kuo Chang, and Mary Lou Soffa, “A V isualization System for ParallelizingPrograms,”Proceedings of Supercomputing ’92, pp. 194-203 (November 1992).
[10] K. Andrews, R. R. Henry, and W. K. Yamamoto, “Design and Implementation of the UW IllustratedCompiler,” Proceedings of the SIGPLAN ’88 Symposium on Programming Language Design andImplementation, pp. 105-114 (June 1988).
[11] J.W. Davidson and D. B. Whalley, “A Design Environment for Addressing Architecture and Com-piler Interactions,”Microprocessors and Microsystems15(9) pp. 459-472 (November 1991).
-32-