graphing picture and bar graphs by giovanna giurdanella november 29 th, 2012
TRANSCRIPT
Graphing Picture and Bar Graphs
By Giovanna Giurdanella
November 29th, 2012
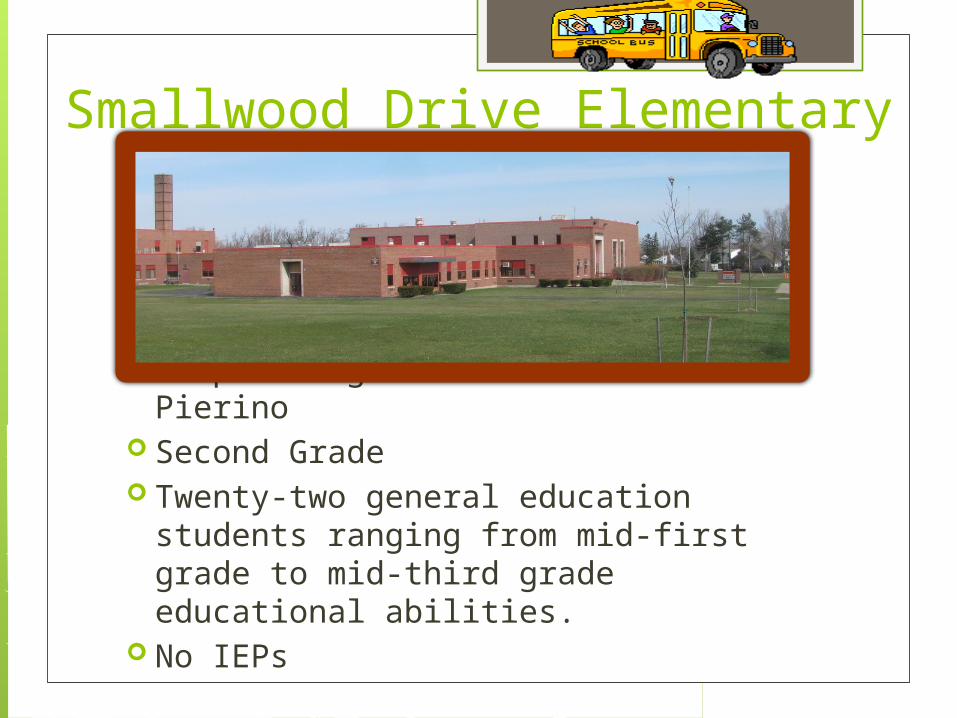
Smallwood Drive Elementary
Amherst Central School District Cooperating Teacher – Mrs. Karen
Pierino Second Grade Twenty-two general education students
ranging from mid-first grade to mid-third grade educational abilities.
No IEPs

Mrs. Pierino’s ClassLibrary Field Trip

Overview This lesson is for a 60 minute math block The lesson was spontaneously created to extend
the Pearson Education Investigation’s pocket chart tracker lesson.
Enduring Understanding(s): -A graph is a way of keeping track when we sort and count things (data).-It lets us see quickly how many things we have.-It helps us compare numbers of different things.-A picture graph uses pictures to represent the data collected and sorted.-A bar graph uses rectangles to represent data on a numbered plane.

Essential Question(s):-What are graphs used for? Guiding Question(s):-What is a graph?-What is a picture graph?-What is a bar graph?-Which is the most?-Which is the least?

Standards NYS Standards/
Performance Indicators Standard: 2.MD.10 Common Core Standard:
Mathematics Grade: Second Domain: Measurement and
Data Cluster: Represent and
interpret data Standard: Draw a picture
graph and a bar graph (with single-unit scale) to represent a data set with up to four categories. Solve simple put-together, take-apart, and compare problems using information presented in a bar graph.
Supporting Standards focus on student participation. Speaking and Listening to follow rules and collaboratively contribute to the lesson.

Objectives
Objective #1: Students sort and count objects to graph with 95 – 100% accuracy.
Objective #2: Students create a picture graph of cubes after counting and sorting them with 85 – 100% accuracy.
Objective #3: Students create a bar graph using M&Ms after counting and sorting them with 85 – 100% accuracy.

Smartboard• Students assist in
counting and recording data.
• Students come up to the Smartboard to add parts of the picture or bar to complete the graphs.
• Students compare which are most and least represented.

AssessmentCategory 4 3 2 1
Picture Graph
AccuracyWeight: 1pt
Score:___/4
-All the color categories are identified and the word is written out.-A cube/square is drawn as a link or individually to represent the number of cubes for each color.-The number of cubes illustrated is correctly quantified.-The colors of the most and least cubes are identified.
- Three out of four of the color categories are identified and the word is written out.-A cube/square is drawn as a link or individually to represent the number of cubes for each color.-One of the numbers of cubes illustrated does not match the quantified number.-The color of the most or least cubes is identified.
-Two out of the four of the color categories are identified but the word is not written out.-The bar is colored-in and segmented but does not resemble cube in the pictures.-Two or Three of the number of cubes illustrated do not match the quantified numbers.-The color of the most or least cubes is identified.
-The color category is not identified.-The bar is colored in but there is no representation of a cube picture.-The number of cubes illustrated is not quantified.-The colors of the most and least cubes are not identified.

Category 4 3 2 1
Bar GraphAccuracyWeight:
1pt
Score:___/4
-The boxes representing the number of M&Ms are colored representing the amount found in the bag.-The number of boxes colored is correctly quantified.-The colors of the most and least M&Ms are identified.
-The boxes representing the number of M&Ms are colored representing the amount found in the bag but one or two may be crossed out.-The number of boxes colored is correctly quantified.-The colors of the most or least M&Ms are identified.
-The boxes representing the number of M&Ms are colored representing the amount found in the bag but tree or four may be crossed out.-The number of boxes colored does not equal the number quantified.-The colors of the most or least M&Ms are identified.
-The boxes representing the number of M&Ms are not colored representing the amount found in the bag.-The number of boxes colored does not equal the number quantified.-The colors of the most or least M&Ms are not identified.
Assessment

Exemplars

Distinguished

Proficient

Developing

Summative

Modification

Data
0
2
4
6
8
10
12
14
16
18
20
Developing Proficient Distinguished
Formative
Summative
The data collection for the formative and summative assessments have treats to validity.

Reflection
Thank you to the Whatevers
The peer review process was exciting and challenged me as a lesson preparer.
The cool comments were great suggestions to help improve the hard work I had already put into my learning experience
