graphs, networks and python: the power of...
TRANSCRIPT


A little about me…


Graphs• Graph, G = (V, E)
• V = Vertices / Nodes
• E = Edges

NetworkX• Native graph structures for Python.
• Nodes can be any hashable object.
• Edges are tuples of nodes with optional edge data which is stored in a dictionary.
• Well maintained package

Lets make a Graphimport networkx as nx !import matplotlib.pyplot as plt ! !G = nx.Graph() !

Lets add some nodesimport networkx as nx !import matplotlib.pyplot as plt ! !G = nx.Graph() !G.add_node('1') !G.add_node('2') !G.add_node('3') !G.add_node('4') !G.add_node('5') !
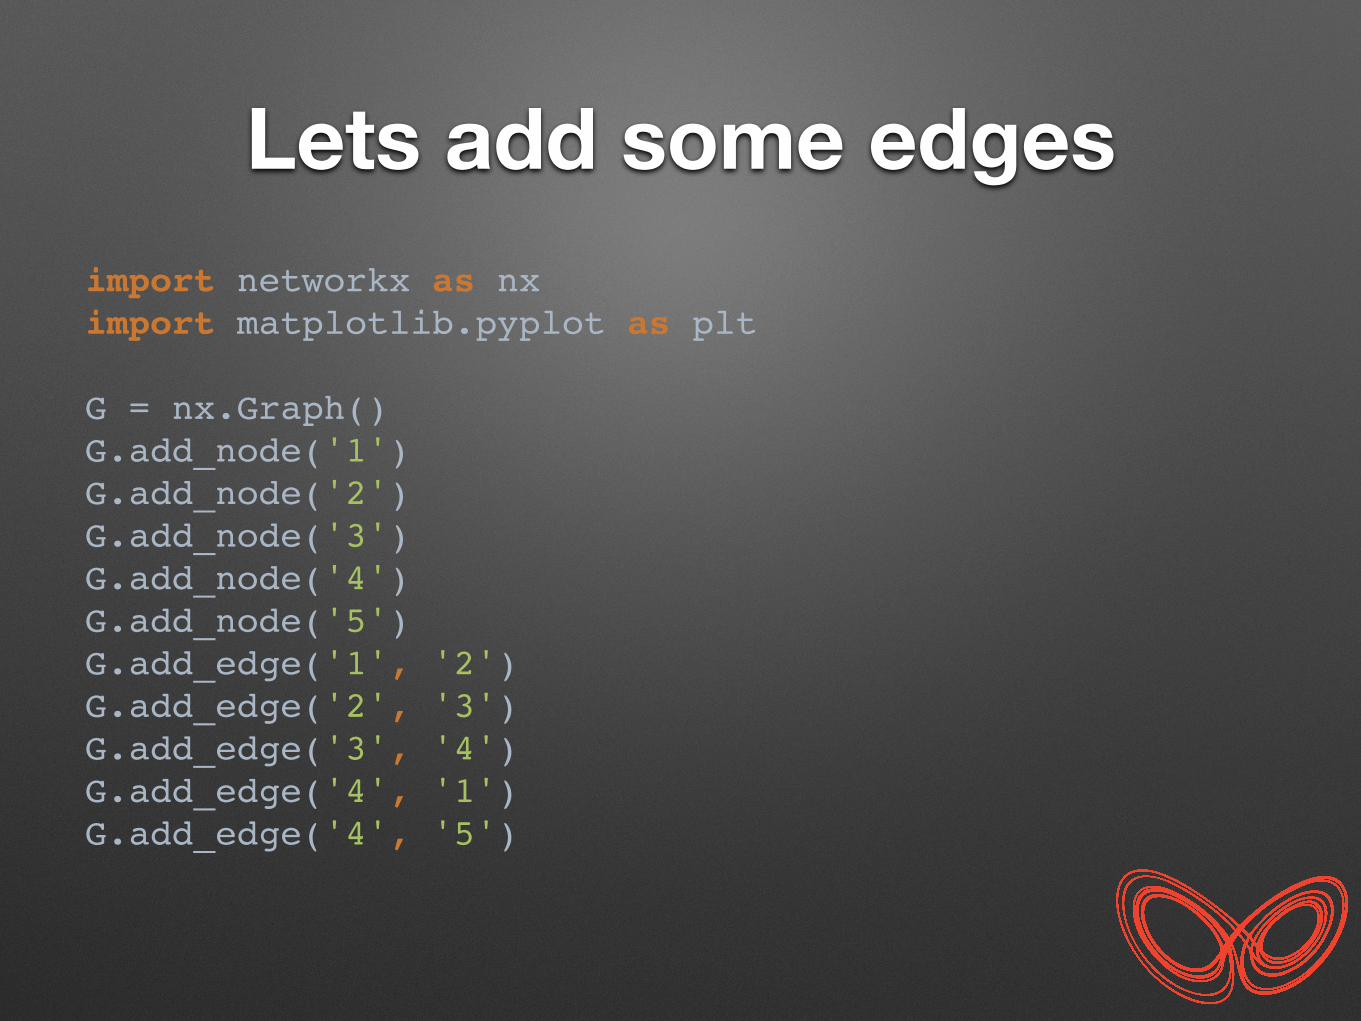
Lets add some edgesimport networkx as nx !import matplotlib.pyplot as plt ! !G = nx.Graph() !G.add_node('1') !G.add_node('2') !G.add_node('3') !G.add_node('4') !G.add_node('5') !G.add_edge('1', '2') !G.add_edge('2', '3') !G.add_edge('3', '4') !G.add_edge('4', '1') !G.add_edge('4', '5') !

Lets Visualise itimport networkx as nx !import matplotlib.pyplot as plt ! !G = nx.Graph() !G.add_node('1') !G.add_node('2') !G.add_node('3') !G.add_node('4') !G.add_node('5') !G.add_edge('1', '2') !G.add_edge('2', '3') !G.add_edge('3', '4') !G.add_edge('4', '1') !G.add_edge('4', '5') !nx.draw_spectral(G) !plt.show()

Now a directed graphimport networkx as nx !import matplotlib.pyplot as plt!!G = nx.DiGraph() !G.add_nodes_from(['1', '2', '3', '4', '5']) !G.add_edge('1', '2') !G.add_edge('2', '3') !G.add_edge('3', '4') !G.add_edge('4', '1') !G.add_edge('4', '5') !nx.draw_spectral(G) !plt.show()

Look Ma - No Nodesimport networkx as nx !!G = nx.DiGraph() !G.add_edge('1', '2') !G.add_edge('2', '3') !G.add_edge('3', '4') !G.add_edge('4', '1') !G.add_edge('4', '5') !

More Graphs• Networkx can generate lots of interesting graphs to
experiment with.
• Lets have a look at a few of them.

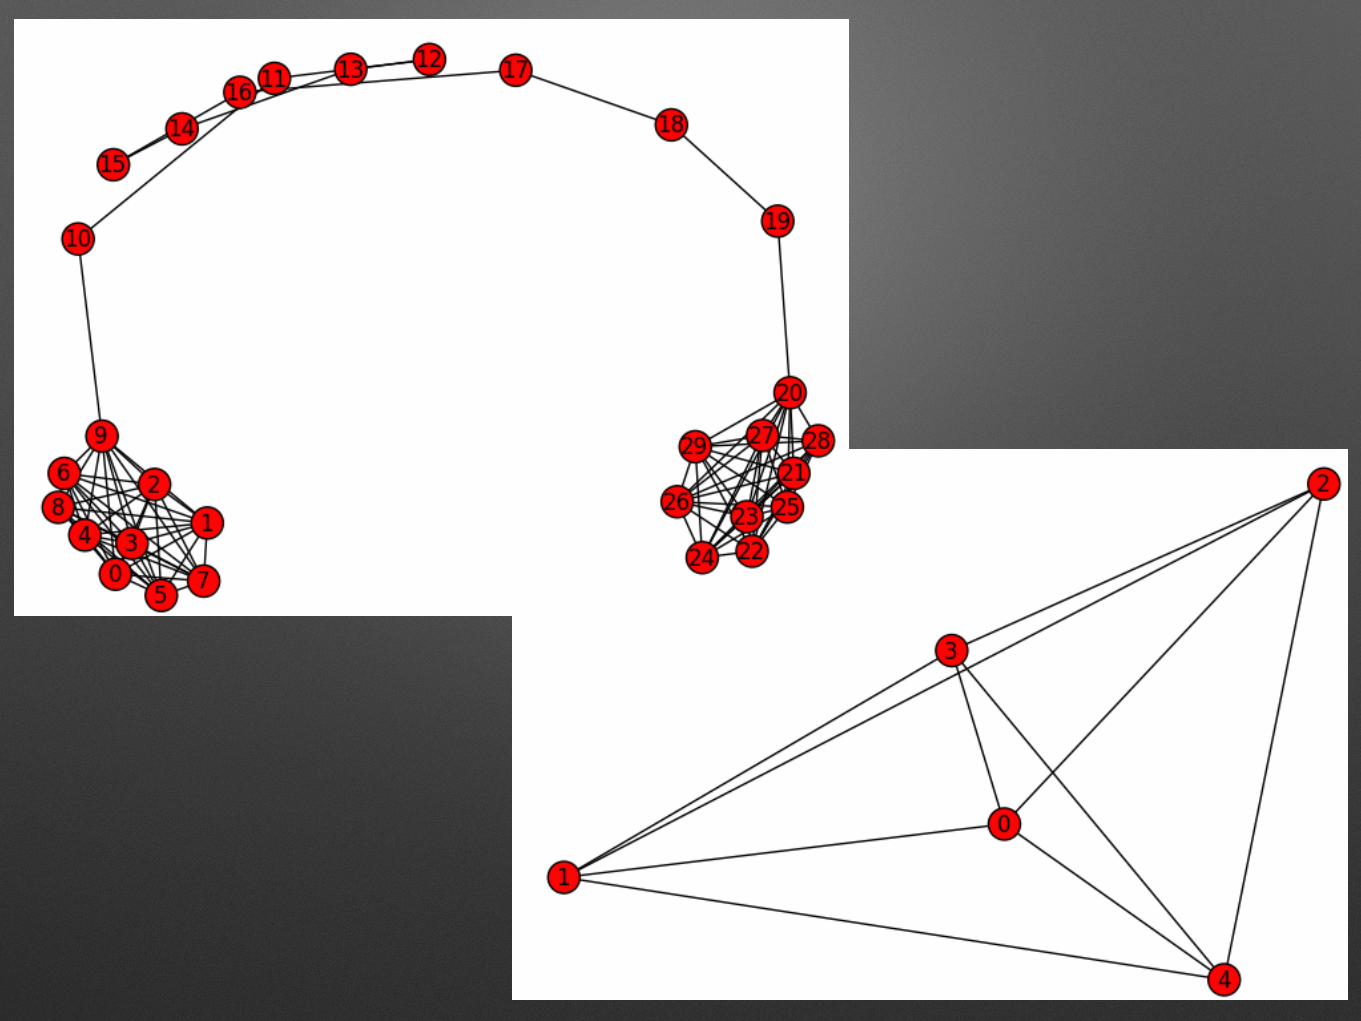
More Graphsimport networkx as nx !import matplotlib.pyplot as plt ! !K_5 = nx.complete_graph(5) !nx.draw(K_5) !plt.show() ! ! !barbell = nx.barbell_graph(10, 10) !nx.draw(barbell) !plt.show()
Erdos-Renyi• Named for Paul Erdős and Alfréd Rényi.
• The Erdős–Rényi model is a model for generating random graphs.
• The model sets an edge between each pair of nodes with equal probability.
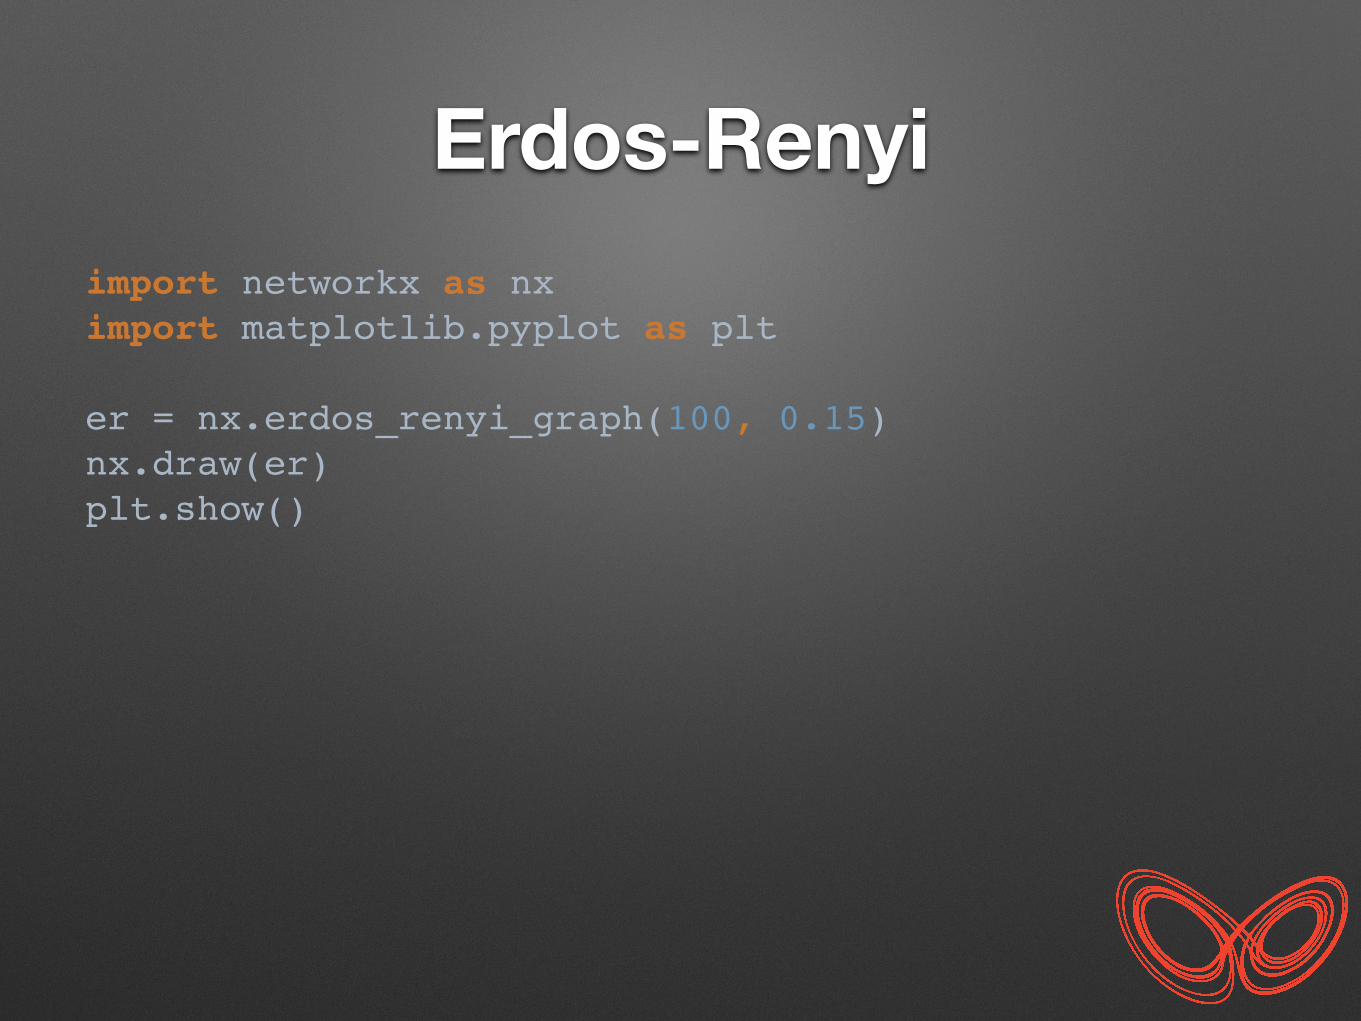
Erdos-Renyiimport networkx as nx !import matplotlib.pyplot as plt !!er = nx.erdos_renyi_graph(100, 0.15) !nx.draw(er) !plt.show() !


Watts-Strogatz• Named for Duncan J. Watts and Steven Strogatz.
• The Watts–Strogatz model produces graphs with small-world properties, including short average path lengths and high clustering.
• Most nodes are not neighbours but can be reached from every other node by a small number of hops or steps.

Watts-Strogatzimport networkx as nx !import matplotlib.pyplot as plt ! !ws = nx.watts_strogatz_graph(100, 15, 0.1) !nx.draw(ws) !plt.show() !


Barabasi - Albert• Named for Albert-László Barabási and Réka Albert.
• The Barabási–Albert model is an algorithm for generating random scale-free networks.
• Scale free describes the distribution of node degrees of the network.

Barabasi - Albertimport networkx as nx !import matplotlib.pyplot as plt ! !ba = nx.barabasi_albert_graph(100, 5) !nx.draw(ba) !plt.show()


Social Network Analyis• One major area of interest in network analysis.
• Networkx is well suited to this type of analysis.
• Interested in understanding graph properties that explain the social interaction.

Enron Data• Enron declared bankruptcy in 2001
• Enron email corpus contains data from about 150 users, mostly senior management of Enron.
• Converted the corpus to a TSV file of the form
SENDER RECIPIENTS EMAIL DATA …
str str,…,str

A Graphimport csv !import networkx as nx !!G = nx.Graph() ! !
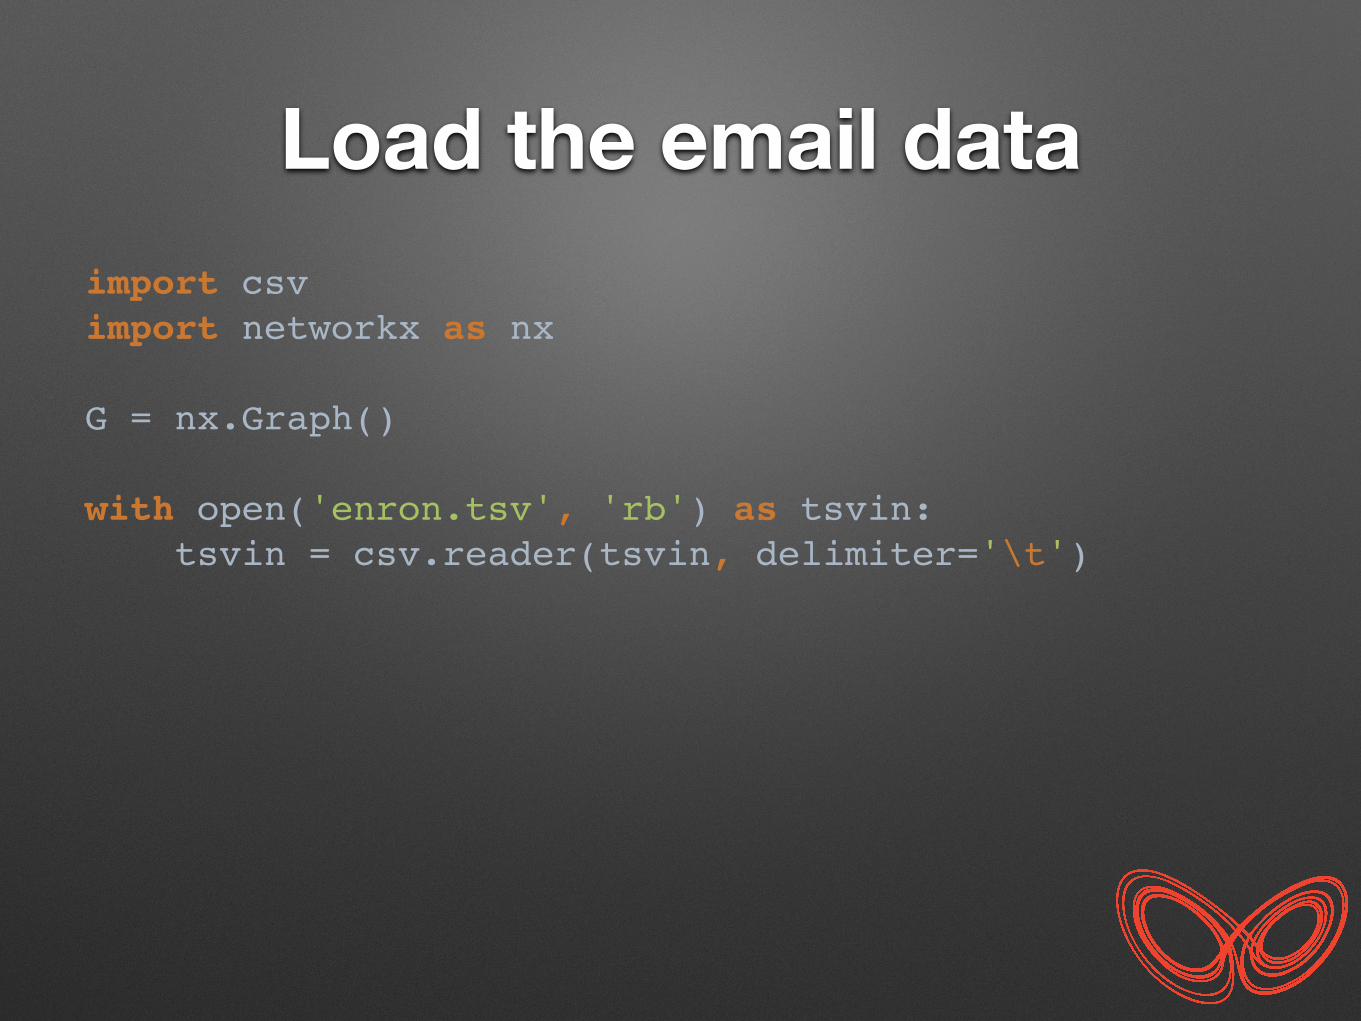
Load the email dataimport csv !import networkx as nx !!G = nx.Graph() ! !with open('enron.tsv', 'rb') as tsvin: ! tsvin = csv.reader(tsvin, delimiter='\t') !

Build the graphimport csv !import networkx as nx !!G = nx.Graph() ! !with open('enron.tsv', 'rb') as tsvin: ! tsvin = csv.reader(tsvin, delimiter='\t') ! ! for row in tsvin: ! sender = row[0] ! recipients = row[1].split(',') ! for recipient in recipients: ! G.add_edge(sender, recipient) !

And visualise!!!import csv !import networkx as nx !!G = nx.Graph() ! !with open('enron.tsv', 'rb') as tsvin: ! tsvin = csv.reader(tsvin, delimiter='\t') ! ! for row in tsvin: ! sender = row[0] ! recipients = row[1].split(',') ! for recipient in recipients: ! G.add_edge(sender, recipient) !!nx.write_gexf(G, 'enron.gexf')

So what?• Visualisations are pretty but…
• Networkx can help us do better
• Lets dive into some graph analysis

Node Degreenode_degree = nx.degree(G).items() !sorted_degrees = sorted(node_degree, key=lambda tup: tup[1]) !poi = [email for (email, degree) in sorted_degrees[-10:]]!!>>> ['[email protected]', '[email protected]', '', '[email protected]', '[email protected]', '[email protected]', '[email protected]', '[email protected]', '[email protected]', '[email protected]']

The People• Kenneth Lay - Chairman
• Jeff Skilling - CEO
• Tana Jones - Senior Legal Specialist
• Sally Beck - COO
• David Forster - Vice President
• Jeff Dasovich - Government Relation Executive

Subgraphsreal_poi = ['[email protected]', '[email protected]', '[email protected]', '[email protected]', '[email protected]', '[email protected]', '[email protected]'] ! !sub_G = G.subgraph(real_poi) !nx.draw(sub_G) !plt.show()

MultiGraphs• Allows you to have multiple edges between nodes. i.e.
one edge per email.
• Instead of G = nx.Graph() !
• Use G = nx.MultiGraph()

Relationships?• Neighbours G.neighbors('[email protected]')!G.neighbors_iter('[email protected]') !!
• Cliques nx.find_cliques(G)

Networkx Functionality
Other useful graph Packages• Gephi (http://gephi.github.io/)
• Pajek (http://pajek.imfm.si/doku.php)

Conclusion• Graphs are good
• Networkx is awesome
• Have fun :)

Questions
!
???