dan bridgman structures with python and networkx ... · structures with python and networkx dan...
TRANSCRIPT
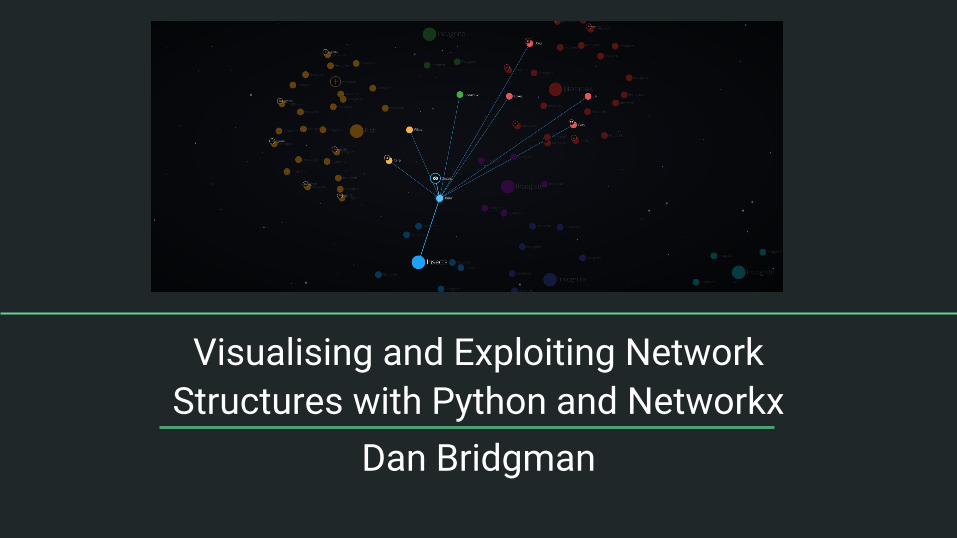
Visualising and Exploiting Network Structures with Python and Networkx
Dan Bridgman

Hello and thank you!
● Full time Data Scientist (PWC) and full time Data Geek
● Hybrid nerd and lover of outdoors● Absolute believer of the power of meetup
groups and social good in group settings● Mixes theory with practical experience on a
daily basis at PWC with Data Analytics
Agenda
● Brief introductions to Network/Graph theory topics● Brief summary of Force-directed graph drawing ● Example and why use these types of graphs?● Networkx & Python - What, why, how?● Leveraging code to interactively render graphs and derive insight + demo● Wrap-up + Q&A
Scene setting
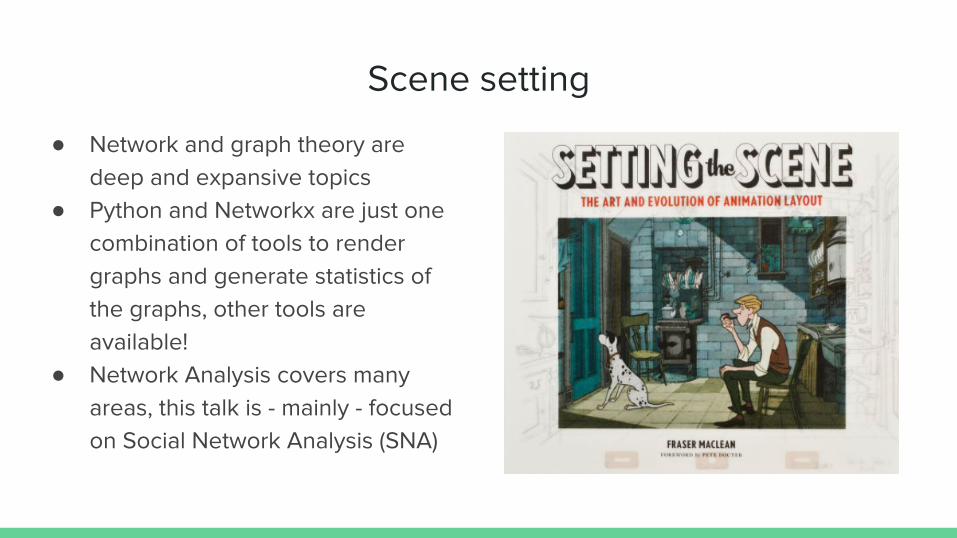
● Network and graph theory are deep and expansive topics
● Python and Networkx are just one combination of tools to render graphs and generate statistics of the graphs, other tools are available!
● Network Analysis covers many areas, this talk is - mainly - focused on Social Network Analysis (SNA)

Poll time!
Please go to: https://pollev.com/danbridgman060 and click on the answer you think is most appropriate to you! This helps me to guide the Presso :)
Network theory & analysis - Brief introduction
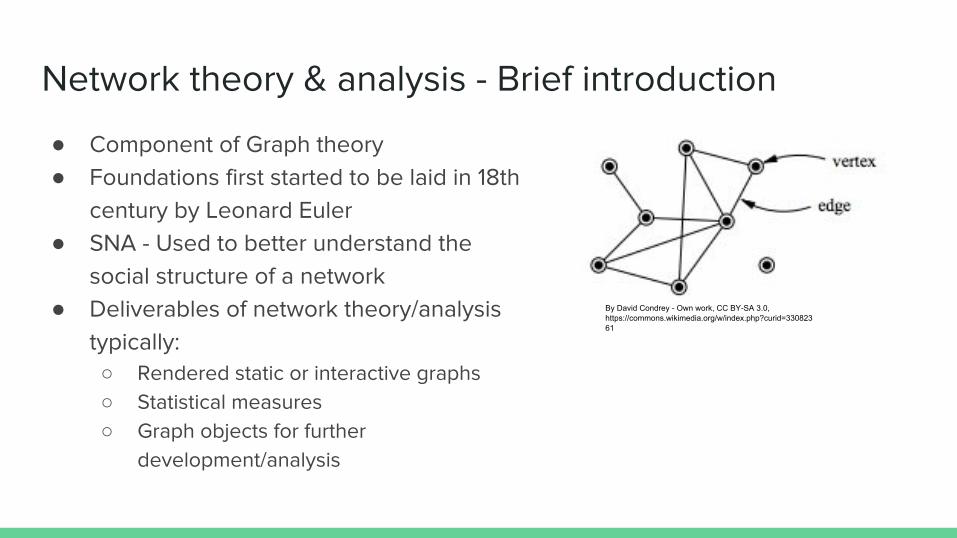
● Component of Graph theory● Foundations first started to be laid in 18th
century by Leonard Euler● SNA - Used to better understand the
social structure of a network● Deliverables of network theory/analysis
typically:○ Rendered static or interactive graphs ○ Statistical measures○ Graph objects for further
development/analysis
By David Condrey - Own work, CC BY-SA 3.0, https://commons.wikimedia.org/w/index.php?curid=33082361
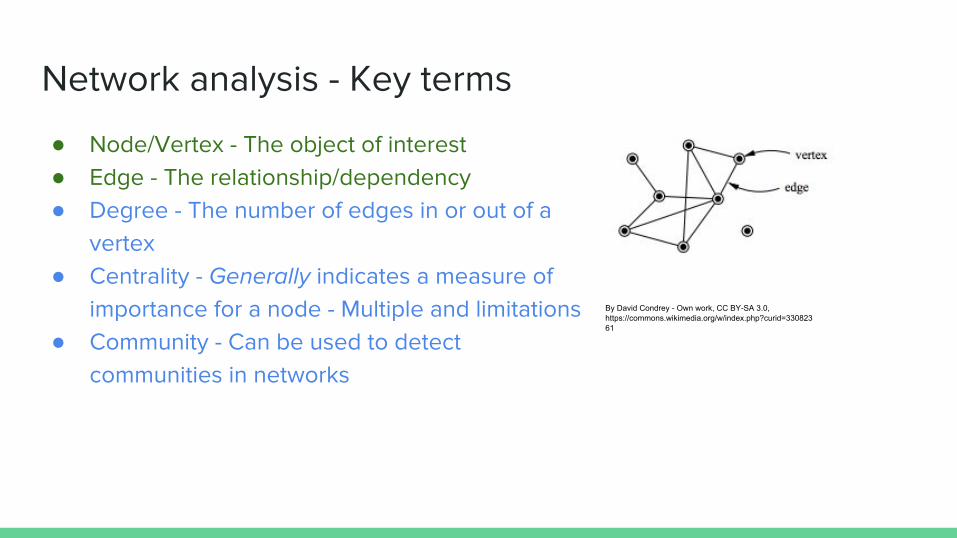
Network analysis - Key terms
● Node/Vertex - The object of interest● Edge - The relationship/dependency● Degree - The number of edges in or out of a
vertex● Centrality - Generally indicates a measure of
importance for a node - Multiple and limitations● Community - Can be used to detect
communities in networks
By David Condrey - Own work, CC BY-SA 3.0, https://commons.wikimedia.org/w/index.php?curid=33082361
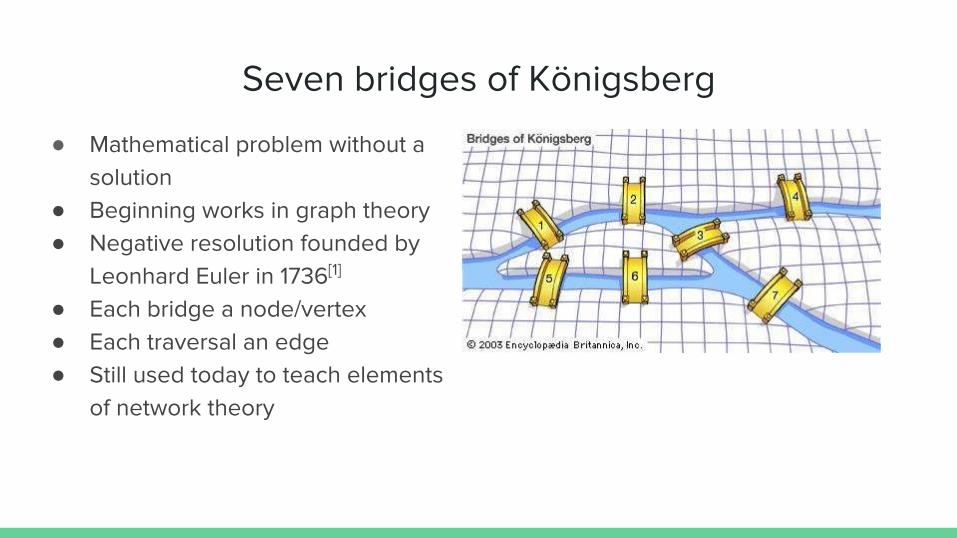
Seven bridges of Königsberg
● Mathematical problem without a solution
● Beginning works in graph theory● Negative resolution founded by
Leonhard Euler in 1736[1]
● Each bridge a node/vertex● Each traversal an edge● Still used today to teach elements
of network theory
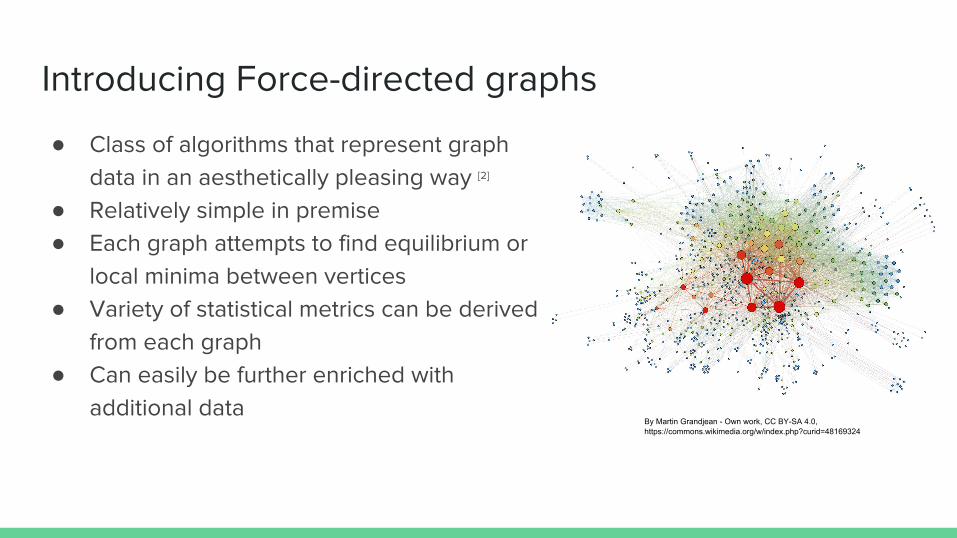
Introducing Force-directed graphs
● Class of algorithms that represent graph data in an aesthetically pleasing way [2]
● Relatively simple in premise● Each graph attempts to find equilibrium or
local minima between vertices● Variety of statistical metrics can be derived
from each graph● Can easily be further enriched with
additional dataBy Martin Grandjean - Own work, CC BY-SA 4.0, https://commons.wikimedia.org/w/index.php?curid=48169324
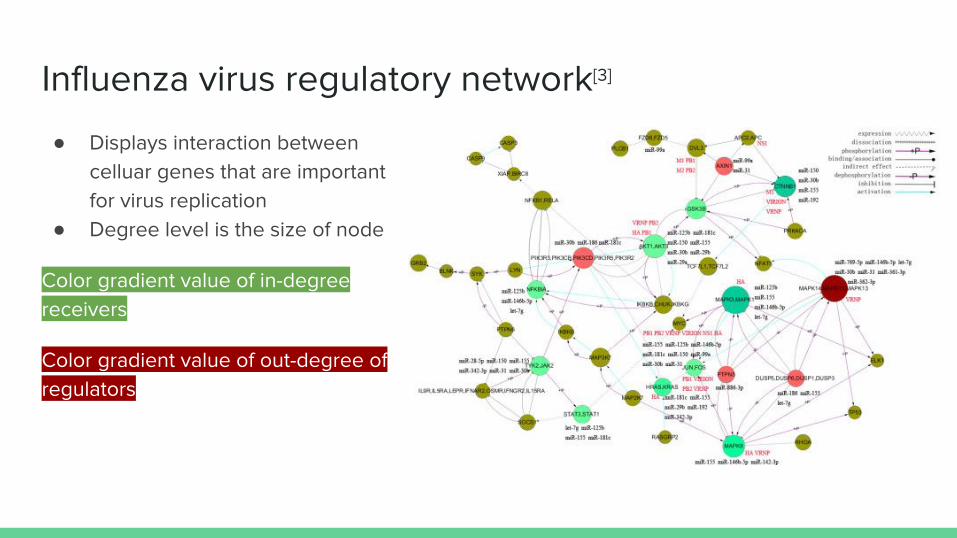
Influenza virus regulatory network[3]
● Displays interaction between celluar genes that are important for virus replication
● Degree level is the size of node
Color gradient value of in-degree receivers
Color gradient value of out-degree of regulators
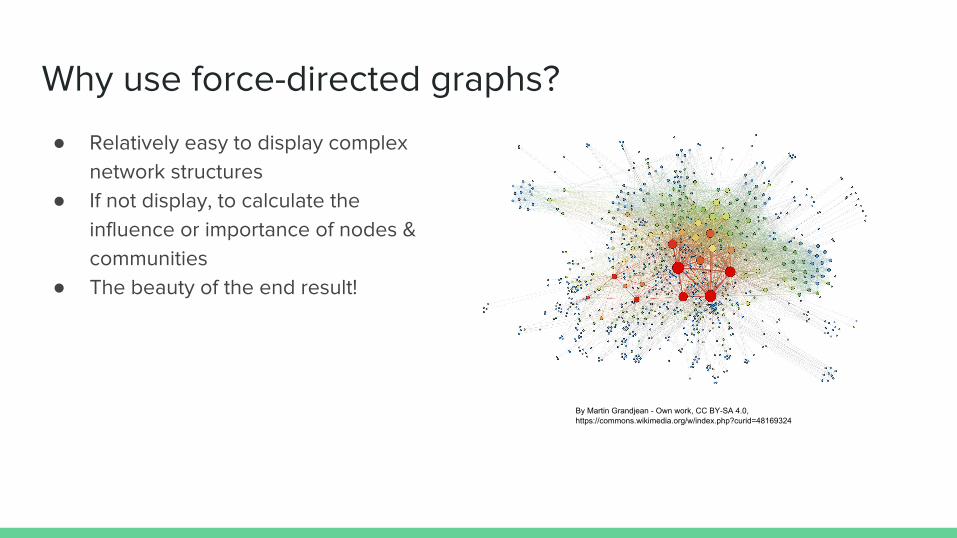
Why use force-directed graphs?
● Relatively easy to display complex network structures
● If not display, to calculate the influence or importance of nodes & communities
● The beauty of the end result!
By Martin Grandjean - Own work, CC BY-SA 4.0, https://commons.wikimedia.org/w/index.php?curid=48169324
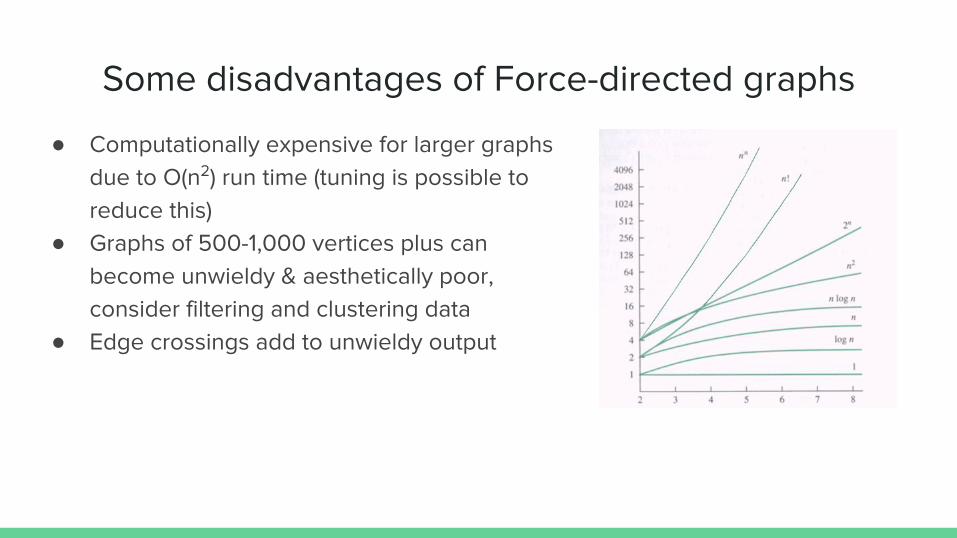
Some disadvantages of Force-directed graphs
● Computationally expensive for larger graphs due to O(n2) run time (tuning is possible to reduce this)
● Graphs of 500-1,000 vertices plus can become unwieldy & aesthetically poor, consider filtering and clustering data
● Edge crossings add to unwieldy output
What is Networkx?
● Networkx - Open source Python package● Installation is easy with pip: pip install
networkx
● Available for both Python 2.7 & 3.2● Networkx graph objects be exported for
other graph softwares to be used
“NetworkX is a Python language software package for the creation, manipulation, and study of the structure, dynamics, and function of complex networks.” [4]
Why Python and Networkx? Why not just Python or Networkx?
Both tools can achieve the majority of what we need to do BUT
Do you like reinventing wheels? I.e.
● Data manipulation● Graph rendering ● Graph computation● Deriving statistical value● Extensibility
How do you use Networkx & Python?
Jupyter - Great for prototyping graph applications/analysis(es)
Python & Flask - Great for turning a prototype into a lightweight API
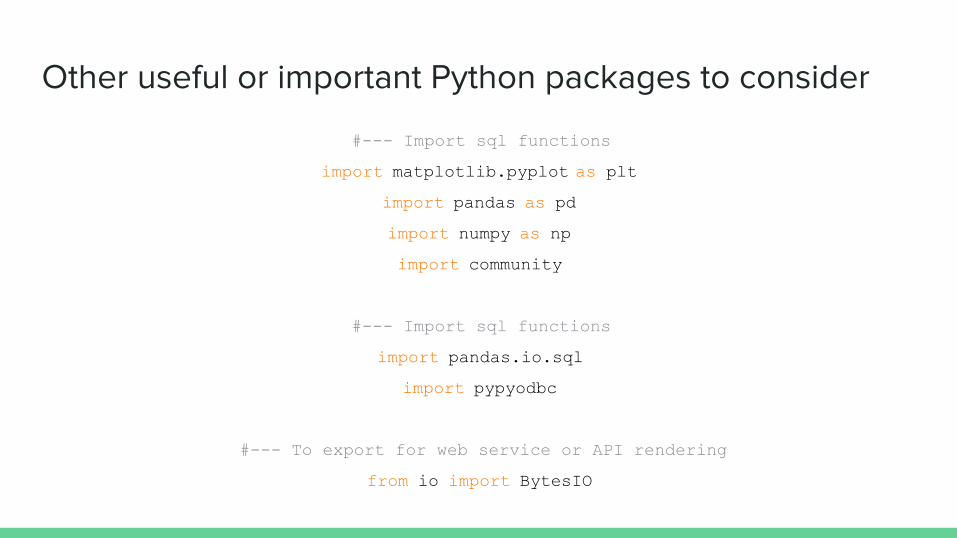
Other useful or important Python packages to consider
#--- Import sql functions
import matplotlib.pyplot as plt
import pandas as pd
import numpy as np
import community
#--- Import sql functions
import pandas.io.sql
import pypyodbc
#--- To export for web service or API rendering
from io import BytesIO
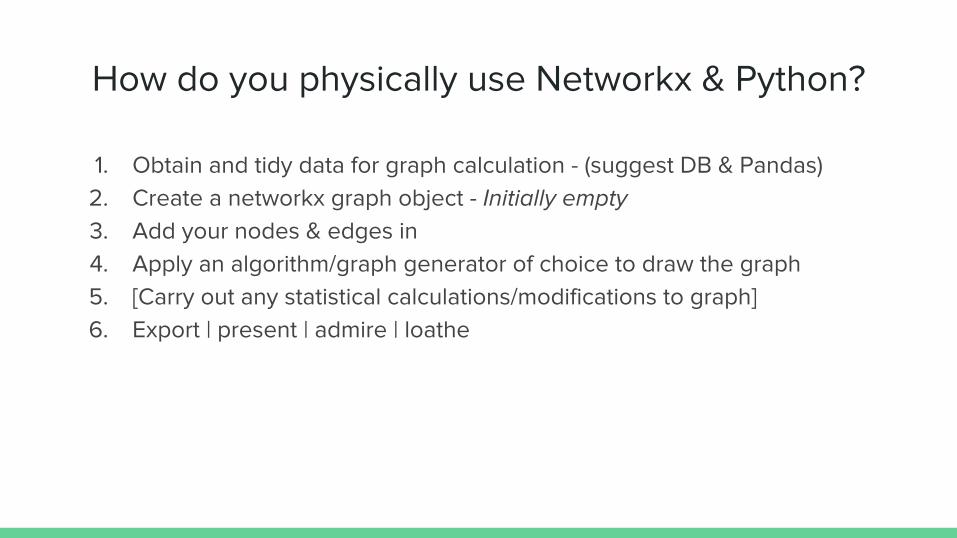
How do you physically use Networkx & Python?
1. Obtain and tidy data for graph calculation - (suggest DB & Pandas)2. Create a networkx graph object - Initially empty3. Add your nodes & edges in 4. Apply an algorithm/graph generator of choice to draw the graph5. [Carry out any statistical calculations/modifications to graph]6. Export | present | admire | loathe
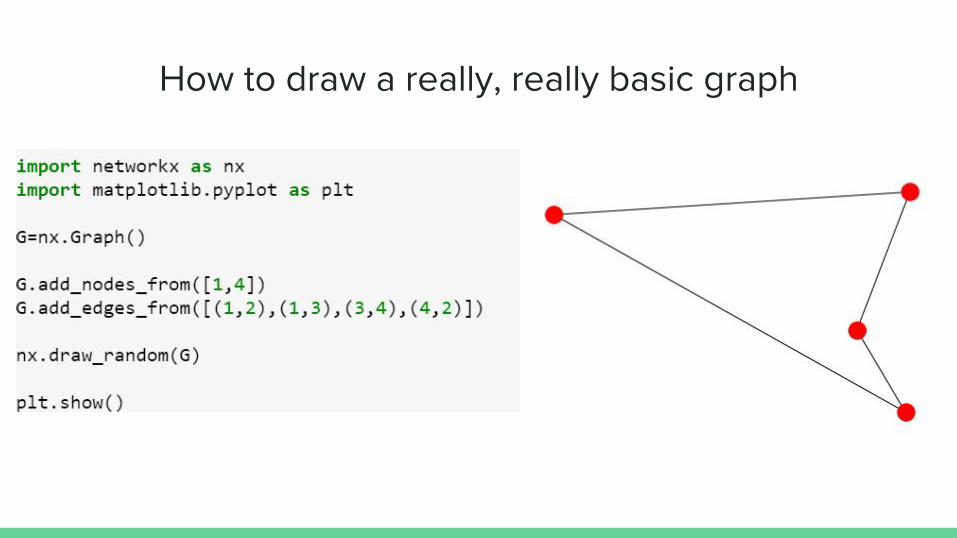
How to draw a really, really basic graph
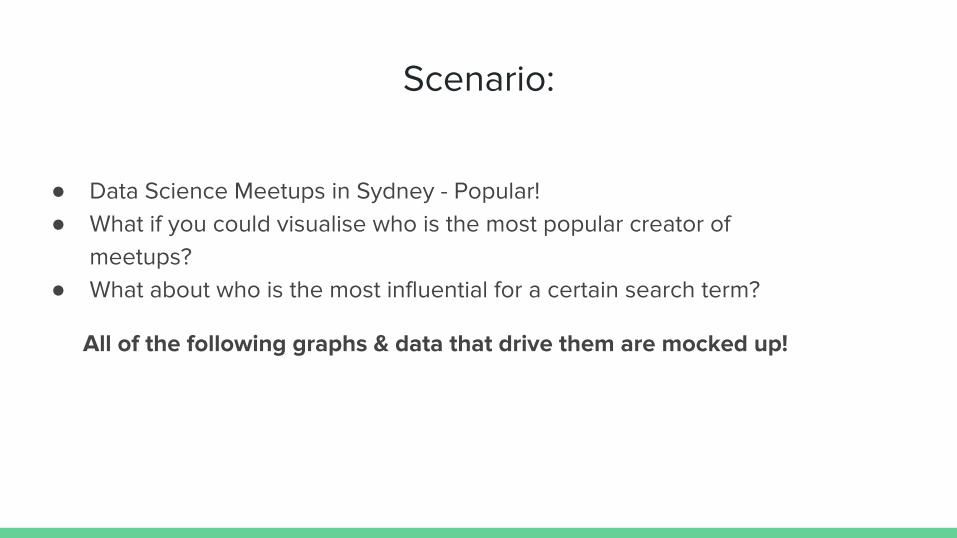
Scenario:
● Data Science Meetups in Sydney - Popular!● What if you could visualise who is the most popular creator of
meetups?● What about who is the most influential for a certain search term?
All of the following graphs & data that drive them are mocked up!
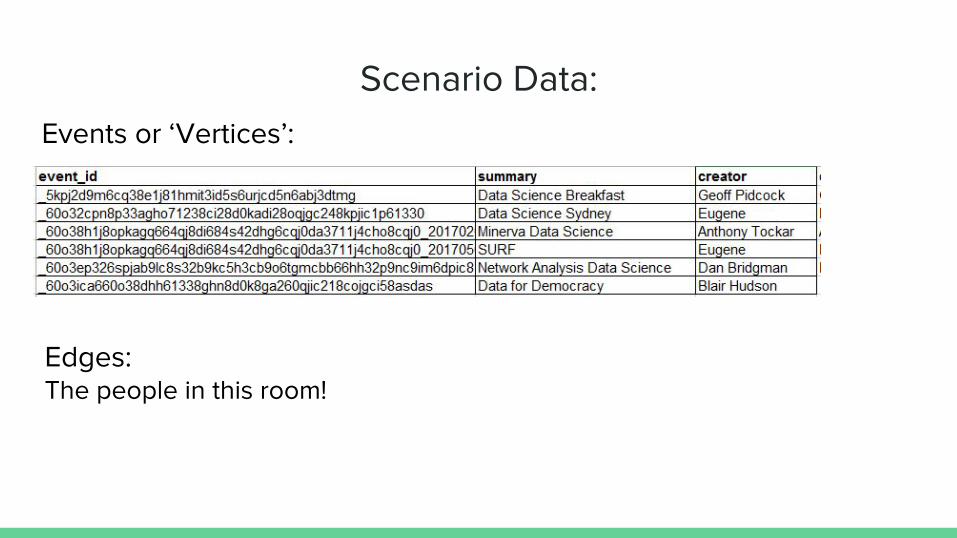
Scenario Data:Events or ‘Vertices’:
Edges:The people in this room!
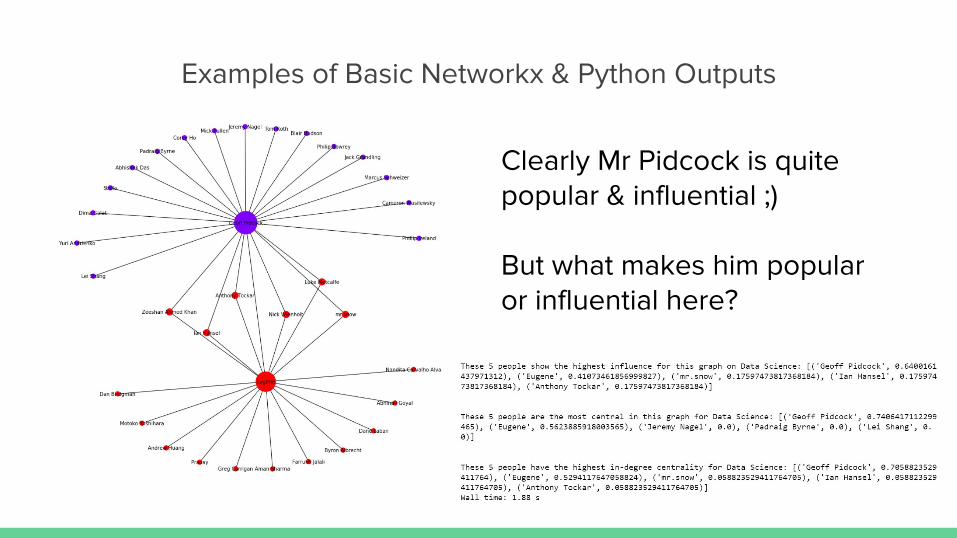
Examples of Basic Networkx & Python Outputs
Clearly Mr Pidcock is quite popular & influential ;)
But what makes him popular or influential here?
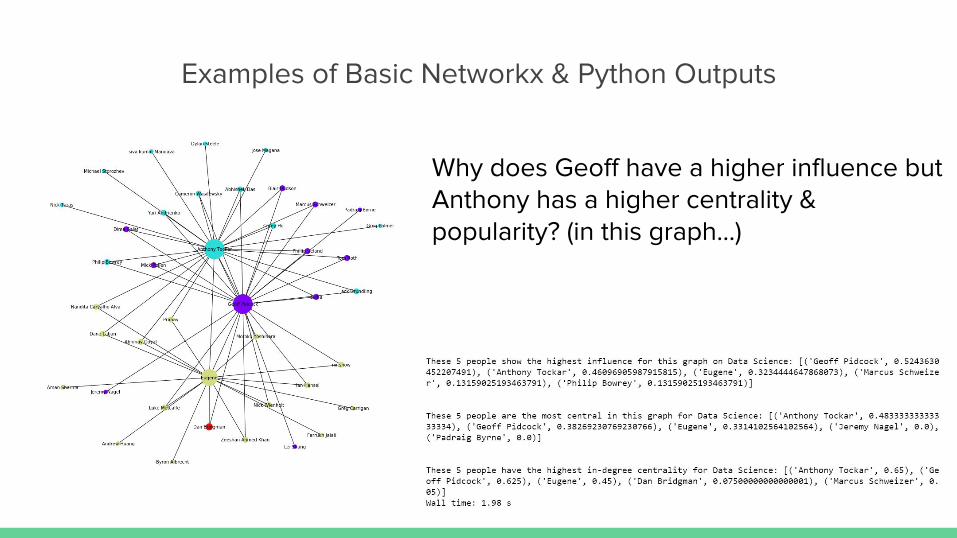
Examples of Basic Networkx & Python Outputs
Why does Geoff have a higher influence but Anthony has a higher centrality & popularity? (in this graph…)
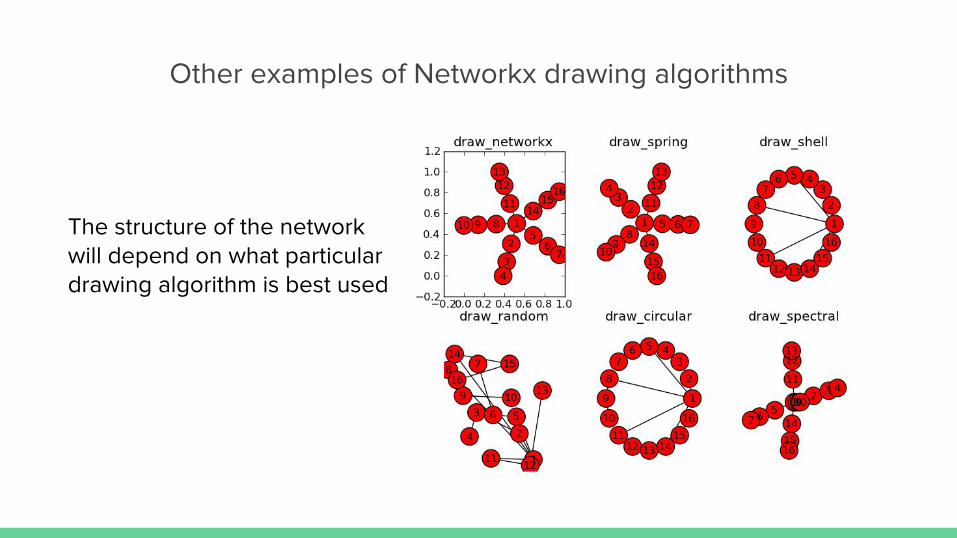
Other examples of Networkx drawing algorithms
The structure of the network will depend on what particular drawing algorithm is best used

Every piece of software has its gotchas...
● Networkx can and will flat out fail on some things
● Linear algebra calculations going awry● Weird singular matrix calculations
Thank you + Q&A/Discussion
References[1] - https://en.wikipedia.org/wiki/Seven_Bridges_of_K%C3%B6nigsberg
[2] - https://en.wikipedia.org/wiki/Force-directed_graph_drawing
[3] - https://www.researchgate.net/figure/Influenza-virus-related-regulatory-network-KEGG-pathway-analysis-was-performed-on_fig7_237015730
[4] - https://networkx.github.io/documentation/networkx-1.10/overview.html