gravity- and turbulence-dominated sediment motion · pdf filegravity- and turbulence-dominated...
TRANSCRIPT
Archives of Hydro-Engineering and Environmental MechanicsVol. 57 (2010), No. 1, pp. 43–59© IBW PAN, ISSN 1231–3726
Gravity- and Turbulence-Dominated Sediment Motion in theClear-Water Scour Process at a Vertical-Wall Abutment in
Pressurized Flow
Alessio Radice1, Francesco Ballio, Chau K. Tran
Alessio Radice, Politecnico di Milano, Piazza Leonardo da Vinci, 32, 20133 Milano, Italy,e-mails: [email protected], [email protected], [email protected]
(Received October 12, 2009; revised December 03, 2009)
AbstractResults on the motion of sediment particles on the bottom of the erosion hole are shownfor a clear-water scour experiment with a vertical-wall abutment. The paper presents aninvestigation of particle kinematics starting from the division of the grain instantaneousmovements into two populations, namely the “turbulence-dominated” events (those in whichthe particle motion is triggered by the turbulent flow field) and the “gravity-dominated”events (those in which the particles slide along the slopes of the scour hole due to geotech-nical instability). Attention is focused on the well developed stages of the erosion process.For such experimental times, the action of the principal vortex system is particularly evidentbecause the latter is not much stretched along the direction of the mean flow deviation, thanksto the increased flowing area. At the same time, the temporal unsteadiness of the vorticeslets a bimodal behaviour of the sediments to emerge. A relevant difference has been foundbetween the dynamics of gravity-dominated and turbulence-dominated events. In addition,it was found that the presence of geotechnical effects in the erosion hole may significantlyalter the scour rate. Potential implications of the present results for the modelling of localscour processes are described.
Key words: abutment scour, sediment kinematics, turbulence, sliding
1. Introduction
Local pier and abutment scour is a crucial topic in hydraulic engineering due tothe significant social and economical impact of bridge failure. Some case studiesare documented, for example by Melville and Coleman (2000), who also demon-strate the high cost of bridge repair or reconstruction. Therefore, reliable tools forscour prediction are necessary for both design and vulnerability evaluation of thestructures.
1 Corresponding author.

44 A. Radice, F. Ballio, C. K. Tran
Experimental measurement and numerical modelling of the scouring flow fieldclearly show the horseshoe vortex and the principal vortex as the most evidentfeatures of the flow pattern at piers and abutments, respectively (e.g. Dargahi 1989,Kwan and Melville 1994, Dey and Barbhuiya 2005, Nagata et al 2005, Kirkil etal 2008). The vortex structure typically presents a high turbulence level comparedto that of the incoming flow: for example, Graf and Istiarto (2002) measured highlevels of turbulent kinetic energy upstream of a cylindrical pier, finding that it wasalso increasing towards the bed; a similar result was found by Dey and Barbhuiya(2005) who measured the turbulent kinetic energy around a vertical-wall abutmenton a flat bed and within a scour hole, finding that it was larger in the secondcase; a significant turbulence level in the flow field within the scour hole was alsohighlighted by the Large Eddy Simulation (LES) model by Kirkil et al (2008). Thepresence of external turbulence is believed to cause the possible underestimationof the erosion depth that is typically obtained through numerical models usingsediment transport equations based on the time-averaged values (e.g. Nagata et al2005, Roulund et al 2005). The role of turbulence was also acknowledged by Sumer(2007) who suggested exploring the effect of external turbulence on bridge scourprocesses as a major route to be taken by future research, since presently no specifictools are available.
Temporal fluctuations in water velocity make the coherent vortical structuresunstable in time. For example, Dargahi (1989) showed that the horseshoe vortexupstream of a cylinder in flat bed could not be persistently observed. The temporalvariability of the vortex system was also detected by the LES model of Kokenand Constantinescu (2008). The distributions of velocity values in junction flowsoften present a bimodal shape (e.g. Devenport and Simpson 1990, Kirkil et al2008), indicating that two types of event are usually occurring in the vicinity ofthe obstacles. The kinematics of the bottom grains clearly reflects the flow pattern.Indeed, a succession of opposite motion events can also be detected, consideringthe sediment motion at a certain location within the erosion hole. This was demon-strated by the experimental measurements made by Radice et al (2008) and Radice(2009a) for rectangular and trapezoidal abutments, respectively. In these studies,motion events directed towards the obstacles and away from them were recognizedin the developed stages of the process. Radice et al (2008) associated the events ofsediment motion away from the abutment to sediment pickup and transport by theturbulent flow field, whilst those with motion towards the abutment were associatedto sediment sliding. On a qualitative basis the presence of geotechnical effects isrelatively well acknowledged: for example, Melville and Raudkivi (1977) describedthe sediments collapsing irregularly in sand avalanches and suggested that the scourprocess in evolved condition result from the combination of temporal mean shearstress, weight component (we should highlight here that the sediment weight is boththe resisting force for particle pickup and the driving force for geotechnical sliding)

Gravity- and Turbulence-Dominated Sediment Motion in the Clear-Water . . . 45
and turbulent agitation. As a matter of fact, Roulund et al (2005) incorporatedsediment sliding in their numerical model for local scour at a circular pier.
A quantitative definition of the relevance of sliding for the sediment kinematicsin a local scour process is still lacking. Therefore, the purpose of the present paperis to make a specific analysis of event separation, aimed towards a quantificationof the relevance of sediment sliding for proper process modelling.
2. Background
The experiment outlined in this paper was performed by Radice et al (2009b)at the Hydraulic Engineering Laboratory of the Politecnico di Milano, Italy. Theexperiment was run using a rectangular pressure duct having a cross section of40 × 16 cm2. Plastic cylinders with a characteristic size D = 0.36 mm and a den-sity of 1.43 kg/dm3 were used. The water discharge was equal to 18.5 l/s, whichcorresponded to incipient motion conditions for the sediments in the unobstructedpart of the duct. A vertical plate with a length of 10 cm was used as the abutment.Radice et al (2009b) compared the measured temporal trend of the erosion depthto that measured in an earlier experiment with a free surface, obtaining that flowpressurization did not significantly alter the dynamics of scour increase with time.The analysis presented in this paper, however, would not suffer from any possibledistortion due to flow pressurization. A reference system is used throughout themanuscript with the x axis aligned with the bulk flow and the y axis orientedleftwards. The coordinates of the upstream nose of the abutment are x = 100 cmand y = 30 cm. The components of the sediment velocity along the x and y axesare u and v, respectively.
Figure 1 presents the temporal development of the erosion depth, which wasmeasured at the upstream nose of the obstacle (x = 99 cm, y = 30 cm) and at thejunction between the duct wall and the upstream face of the abutment (x = 99 cm,y = 40 cm). The erosion depths at the abutment nose and at the junction point weremeasured by means of a laser triangulation sensor and of a ruler attached to thelateral wall, respectively. Consistently with the typical description of the process,the maximum scour is initially located near the abutment nose and it later migratestowards the lateral wall, where it finally remains permanently. The temporal riseof the erosion depth is logarithmic, with the scour rate being largest in the initialstage of the process and progressively lowering. As said in the Introduction, thebimodal nature of the sediment motion events is most evident for the developedstages of the process, where the scour rate is low. Therefore, the following analysiswill be focused on an experimental time as large as T = 2h 45’ (= 9900 s), forwhich a three-dimensional survey of the geometry of the erosion hole is available.The time under consideration is highlighted in the plot. The survey of the scourhole topography was made using the same laser sensor used for the measurement ofthe scour depth evolution at the abutment nose. The survey time was approximately

46 A. Radice, F. Ballio, C. K. Tran
Fig. 1. Temporal development of the scour depth d during the experimental test.The time used for the analysis is highlighted
1 h, during which the experiment was stopped, lowering the water discharge untilsediment motion ceased.
During the experiment, Radice et al (2009b) filmed the sediment motion usinga black and white CCD camera. Afterwards, the sediment kinematics was measuredusing the methodology devised by Radice et al (2006), which enables a Eulerianmeasurement to be made of the concentration C and vector velocity V of the movingparticles. Both quantities are defined and measured over a reference area A of thebed. Sediment concentration is defined as C = W /(A × D), where W is the volume ofmoving sediments. Sediment concentration was measured using a technique basedon image subtraction and filtering of the difference images. Sediment velocity wasmeasured by Particle Image Velocimetry. The solid discharge per unit width isthen defined as qs = C × V × D, in analogy with earlier literature definitions (e.g.Fernandez Luque and Van Beek 1976, Nino and Garcıa, Parker et al 2003). Thefocus area relative to the experimental time considered here is depicted in Figure2(a), where also the cells with A = 2 × 2 cm2 used for the Eulerian measurement areshown. The films taken by Radice et al (2009b) had a duration of 20 s, due to limitedpossibility of image storage in the RAM of the PC used. On the other hand, Radiceet al (2009b) showed that data from some successive sequences can be averagedtogether, provided that the averaging period is much smaller than the characteristictime scales associated with process development. In other words, the variation ofthe maximum erosion depth within the period considered for averaging must bea negligible fraction of the scour level previously achieved. Figure 2(b) presents thesediment motion pattern obtained by averaging data from eleven movies, to whichthe time period from 8960 to 11960 s corresponded (total film time is obviously 220s; the period of 3000 s results from time intervals needed for saving the video ontothe PC). Radice et al (2009b) interpreted the upstream direction of the sedimentmotion as a footprint of the principal vortex system, and used results similar to thatpresented here to hypothesize that the principal vortex is compound of at least two

Gravity- and Turbulence-Dominated Sediment Motion in the Clear-Water . . . 47
Fig. 2. a) map of the measuring grid over a picture of the scour hole (bulk flowdirection indicated); b) time-averaged sediment motion pattern (greyscale contour levels oftime-averaged solid discharge per unit width and sediment motion lines; locations used for
the plots in Figure 3 are indicated). In both pictures flow direction is rightwards
vortices with horizontal axis (one located around x = 95 cm, y = 30 cm and theother around x = 83 cm, y = 30 cm).
Radice et al (2008) showed that the instantaneous direction of the moving sedi-ments can be significantly different from the time-averaged one. In particular, Radiceet al (2008) showed that, at some locations, movements departing from the abut-ment and directed towards it continuously alternated. The authors hypothesizedthat the double behaviour is due to succession of scouring by the principal vortexand sediment sliding, and that it is weaker where the principal vortex system isstretched along the main flow direction. Figure 3 (the reader should now ignorethe circular sector, whose meaning shall be explained in the following sections)presents some sample polar plots of grain velocity, in which each marker repre-sents an instantaneous velocity value measured within the observation period. Theplots are consistent with the earlier findings: for example, considering position(1), which is upstream of the abutment and near the lateral wall of the duct (seeFigure 2), movements with u < 0 (consistent with the expected structure of theprincipal vortex) and u > 0 (consistent with geotechnical effect) can be observed.The transverse motion at position 1 is inhibited by proximity to the lateral wall. It isreasonable to expect a flow structure with small lateral velocity at that location. Asa result, the sediment transverse motion is also small and, on average, vanishing.Opposite movements are also evident for position (2), which is again upstream ofthe obstacle. On the contrary, the double behaviour is not apparent for position (3),which is on the abutment side.

48 A. Radice, F. Ballio, C. K. Tran
Fig. 3. Sample polar plots with indication of the boundary for selection of the“gravity-dominated” motion events. The grey diamond corresponds to average velocity (all
events). Location numbers correspond to those in Figure 2
3. Method of Analysis
The key object of the following analysis is the identification of the motion eventsthat can be associated with sediment sliding along the slopes of the erosion hole.We shall now point out that, in our opinion, it is hardly possible for a motion eventto be entirely due to geotechnical effects, with no role of the flow field. Therefore,in the following we will use the expression “gravity-dominated event” instead of“sliding event” to identify an event with a major role in the geotechnical component.In the same way, we will use the term “turbulence-dominated” to identify the otherevents. This section describes the method used to automatically label a motion eventas “gravity-dominated”.
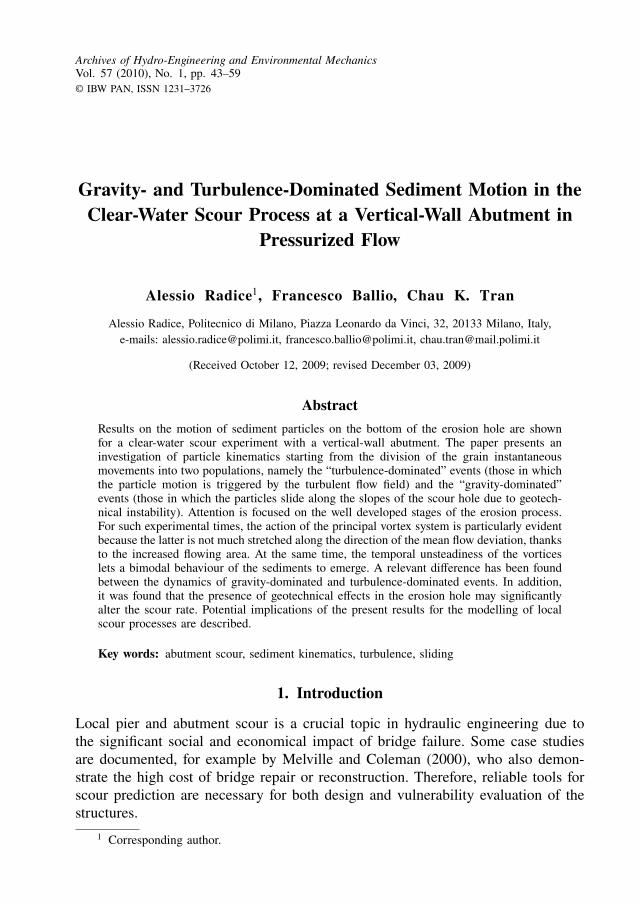
Figure 4(a) depicts the three-dimensional surface identifying the geometry ofthe erosion hole obtained from the survey. Furthermore, Figure 4(b) presents thecontour lines of bed elevation and the corresponding gradient map highlighting thelocal directions and intensities of maximum slope.
We define a gravity-dominated event as one satisfying two conditions, namely:(i) the direction of sediment motion and that of maximum slope delimit an anglewhose amplitude does not exceed π/4 (in absolute value); (ii) the velocity of themotion event is smaller than a threshold determined considering the ideal fric-tionless falling of a mass along a submerged inclined plane; in such condition,we assume that the effective acceleration responsible for mass falling is g×sinβ,with g and β being the acceleration due to gravity and the slope of the inclinedplane, respectively. In our ideal picture we determine the maximum velocity ofa gravity-dominated event w as the fall velocity with reduced gravity:
w =
√√√√√√√√√√ 43g sin β D (s − 1)
24µρwD
+ 1.5, (1)
Gravity- and Turbulence-Dominated Sediment Motion in the Clear-Water . . . 49
Fig. 4. a) bed topography in the scour hole, where z is the vertical upwards coordinate andz = 0 corresponds to the original bed level; b) contour lines of the scour depth d and gradientmap of the deepest part of the scour hole. In both pictures the abutment is indicated in grey.
Data not available for y > 38.5 cm
with the following symbol meaning: s = ρg/ρ, with ρg and ρ as the densities ofparticles and water, respectively, µ = dynamic viscosity of water. In the aboveexpression, the equation for the drag coefficient on the particle given by Chanson(1999) was used. It is acknowledged that the threshold for sediment velocity ispresumably overestimated, since we do not account for of any effect due to sedimentroughness; furthermore, the threshold is based on the asymptotic sliding velocityand does not account for any acceleration of the particles. In synthesis, the boundaryfor the identification of a gravity-dominated event in a polar plot is a circular sector(as those shown in Figure 3 for the sample locations considered).
4. Results
4.1. Statistical Distributions of Particle Velocity and Direction
We present the results of a statistical analysis of particle velocity and direction, interms of the probability density function (pdf) and of the Cumulative FrequencyDistribution (CFD). The distributions were computed with reference to all the datasamples for all the measuring locations upstream of the abutment (for a total cell

50 A. Radice, F. Ballio, C. K. Tran
number of 121) and are depicted in Figure 5. It should be pointed out here thata zero angle corresponds to a movement in the direction of the local gradient ofthe erosion hole that angles are positive if counter-clockwise. The distributions forgravity-dominated (GD) and turbulence-dominated (TD) events have been normal-ized, so that the sum of the areas of the two distributions equals the area of thepdf for all events (ALL). An overlap between the typical velocities for GD and TDevents can be detected from Figure 5(a), which is a consequence of low-velocityevents for the TD motion outside of the particle direction range for GD motion.The CFD of particle velocity (Figure 5b) shows that 40% of the TD events havea velocity lower than the threshold for identification of a GD event. The pdf ofsediment velocity for GD events presents an abrupt descent as the threshold isapproached, consistent with our approach involving a sharp distinction of eventswhile the transition between the two populations is relatively gradual. The pdf ofparticle direction for the TD events shows that the most frequent angle is around ±πthat, given the relative reference used, is opposite to the direction of maximum slopein the erosion hole. This is consistent with the expected structure of the principalvortex, having radial direction in the hole. On the contrary, and consistently withthe criterion for recognition, the pdf of direction for the GD events is boundedbetween ±π/4 and presents a peak for zero angle. As a result, the pdf of directionfor all the events presents (consistently with the earlier literature referenced above)a bimodal shape, with a mode aligned with the gradient and the other opposite to it.
4.2. Relationship between the Statistical Moments of the Quantities
Sediment motion physics can be analyzed through observation of the relationshipsbetween the concentration and velocity of the moving sediments and the resultingsolid discharge, as successfully proved by Ballio and Radice (2007) and Radiceand Ballio (2008) for one-dimensional bed load over a plain bed and by Radiceet al (2009b) for scour at a vertical-wall abutment. In the cited works, a differentrole of sediment concentration and velocity in determining the resulting sedimenttransport rate was demonstrated. In this paper, we hypothesize that the dynamics ofthe sediment transport process is different for the different event classes and thus wehave repeated the correlation analysis of Radice et al (2009b) having preliminarilydivided the sediment motion data into some populations based on event recognition.The event distinction is presented in Figure 6, where the GD events lie within thegrey sector and the TD events lie in the remaining part of the plot. Sub-parts of theTD domain can be further obtained considering the turbulence-dominated eventswith a velocity lower than the threshold for ideal sliding (TDV, region boundedby the thin dotted line) and the turbulence-dominated events with a direction com-parable to that for gravity-dominated motion (TDD, region bounded by the thickdash-dotted line). In the following, we will which refer again to statistics of the

Gravity- and Turbulence-Dominated Sediment Motion in the Clear-Water . . . 51
Fig. 5. a) probability density function of particle velocity; b) Cumulative Frequency Distri-bution of particle velocity; c) probability density function of particle direction compared tothe gradient of the erosion hole; d) Cumulative Frequency Distribution of particle direction
compared to the gradient of the erosion hole
global sample, which have been previously indicated with ALL. A remark has to bemade with reference to the intermittent nature of the sediment transport process.The analysis of Radice et al (2009b) has shown that the intermittency of sedimentmotion is relevant in local scour, that is, at a certain location the sediments donot move continuously within the observation period whilst some stillness termsare present. It is evident that the no-motion events are excluded from the analysispresented in this paper, which instead refers only to the instants with actual particlemovement.
The relationship between the first order statistics of the quantities is depictedin Figure 7, where each marker corresponds to a measuring location within theerosion hole. The lower bound of the concentration is evident in Figures 7(a) and7(b), as that quantity is limited by the value corresponding to a single movingparticle. The inclined upper boundary of the point cloud in Figure 7(c) is a reflec-tion of this behaviour. The relationship between concentration and velocity (Figure7a) highlights the separation between the GD and TD events. This is, to a certainextent, obvious, since the distinction between GD and TD has been made on thebasis of a velocity threshold, yet it should be borne in mind that labelling an eventas GD also requires satisfaction of a condition on velocity direction. If we consider

52 A. Radice, F. Ballio, C. K. Tran
Fig. 6. Distinction between the sediment motion events in a polar plot of sediment velocity.Codes: GD, gravity-dominated; TD, turbulence-dominated; TDD, turbulence-dominated witha direction within the threshold for GD; TDV, turbulence-dominated with a velocity lower
than the threshold for GD. TD comprises TDD, TDV and the external region
the comparison between the GD and TDV events (which are in this way boundedby the same velocity value), we can still see that TDV events are characterizedby average velocities slightly larger that those for the GD events, indicating thattypical velocities in turbulence-dominated event are larger than the correspondingones for gravity-dominated events. This shall be even more evident if we remem-ber that the threshold velocity used for identification of sediment sliding is anoverestimation based on ideal frictionless sliding. Sediment concentration range isinstead similar for GD and TDV. The analogy in the concentration range may beinterpreted assuming that GD events be not triggered by gravity alone, but, due forexample to sediment packing, a certain force exerted by the flow field is neededto activate sediment sliding along the slopes of the erosion hole. If we assumethat the footprint of a turbulent events has a certain size, then the concentration ofmotion will be similar for TD and GD. Finally, looking at the points for TDD inFigure 7(a), we see that the points for low concentration are more dense than thosefor high concentration, indicating that a motion towards the bottom of the erosionhole triggered by turbulence is typically moving few particles at a relatively highvelocity.
4.3. Relevance of Gravity-Dominated Events in the Scour Process
In the precedent sub-section the different dynamics of GD events compared to thatof the TD events has been demonstrated. While this is interesting from the pointof view of the physical processes involved, it is not ascertained yet whether or notgravity can significantly alter the scour development. A first index of the relevance

Gravity- and Turbulence-Dominated Sediment Motion in the Clear-Water . . . 53
Fig. 7. Relationship between the time-averaged solid discharge per unit width, sedimentconcentration and sediment velocity for the different event classes. See Figure 6 for legend
meaning
of gravity can be obtained considering the percentage of GD events over all themotion events at a single location. The relationship between such percentage andthe slope of the scour hole is depicted in Figure 8, where, again, each markercorresponds to a location in the erosion hole. The percentage of GD events doesnot appear to be correlated with the local slope of the hole (indicating that thedynamics of turbulence highly complicates the relationship between gravity andmotion). Most values are lower than 40%, with some isolated ones up to 70%.This, however, is still not enough to prove or confute the relevance of gravity,because the relative importance of this effect should be analyzed in terms of theresulting solid discharge.
We assume the average sediment motion at a certain location to be the result ofthe composition between two major driving effects, namely turbulence and gravity.Therefore, the sample of the instantaneous quantities measured at each location hasbeen divided into the GD and TD sub-samples, with the purpose to compare the twoaverage values representative of the two sub-samples. The comparison is depicted inFigure 9. The sediment concentration (Figure 9a) is similar for the two event types,as expectable given the above considerations. For sediment velocity (and then forsolid discharge) a preliminary consideration has to be made about the quantities tobe compared. As pointed out by Radice et al (2009a) the instantaneous magnitude ofsediment velocity and solid discharge is computed through a non-linear combinationof the components along the coordinate axes; the time-averaged value (for example

54 A. Radice, F. Ballio, C. K. Tran
Fig. 8. Relationship between slope of the erosion hole and percentage of gravity-dominatedevents
for velocity) can be computed in two ways (that will be indicated with differentsubscripts):
V1 =1N
N∑i=1
√u2
i + v2i ; (2)
V2 =
√√√ 1N
N∑i=1
ui
2 + 1N
N∑i=1
vi
2. (3)
In Equations (2) and (3), u and v are the instantaneous velocity components alongthe x and y axes, as previously defined, and N is the sample size. The V1 averageis an indicator of the process dynamics and of the typical strength of the drivingagent. By contrast, the scouring trend is related to the sediment continuity equationover a certain time period. Such equation involves the time-averaged componentsof sediment velocity (through a divergence operator, as shown below), which arerelated to V2. Precedent analyses were referred to the physics of sediment motionand, consistently with that, were focused on V1 (and on the analogous average forthe sediment transport rate). In this sub-section we are concerned with the erosivepattern and therefore the key quantity to which we will refer is V2 (and the analogousaverage for the solid discharge). The comparisons are set out in Figures 9(b) to 9(e).It is evident that, as expectable, both velocity and solid discharge are much largerfor TD than for GD as long the “1” averages are computed, whilst the propertiesbecome more similar if we compute the “2” averages. The result of the analysis isthat the GD events may be able to induce a solid discharge comparable to that forthe TD events, thanks to the direction of GD events being always similar whereasthat of the TD ones is much more dispersed.

Gravity- and Turbulence-Dominated Sediment Motion in the Clear-Water . . . 55
Fig. 9. Comparison between: a) sediment concentration, b) sediment velocity (cm/s) av-eraged with (2), c) sediment velocity (cm/s) averaged with (3), d) solid discharge (cm2/s)averaged like (2), e) solid discharge (cm2/s) averaged like (3), for GD and TD motion events
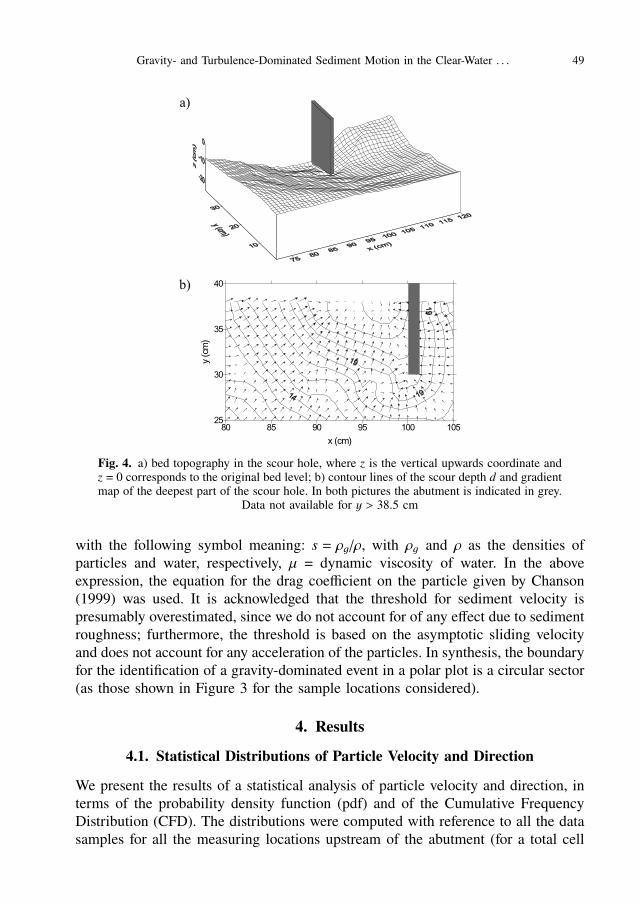
Another evaluation of the role of GD events is set out in Figure 10. In each plot,we present the contour lines (dashed, some values indicated) of the erosion depth,the gradient map of the erosion hole (arrows), the sediment motion lines (continuousline) and the sediment transport rate computed as the “2” average (greyscale contourlines). The time-averaged sediment motion pattern is computed for GD events inFigure 10(a), for TD events in Figure 10(b) and for all the events (that is, depictingthe actual resulting sediment motion pattern) in Figure 10(c). The sediment motionlines for GD are obviously consistent with the gradient map, given the thresholdon velocity direction for identification of a GD event. Furthermore, the sedimentmotion lines for the TD events and for the entire population are not much different,indicating that GD events do not affect much the general sediment direction. Onthe other hand, the total-averaged solid discharge is lower than the TD-averaged,due to the action of GD events. For example, maximum solid discharge of TDevents (Figure 10b) equals 0.075 cm2/s for the location x = 89 cm, y = 23 cm;corresponding solid discharge for ALL events is 0.062 cm2/s, with a significantreduction. As a consequence, the erosion pattern resulting from the data in Figure

56 A. Radice, F. Ballio, C. K. Tran
Fig. 10. Average sediment motion pattern for different events (GD, TD and ALL). Geometryof the erosion hole (dashed contour lines, gradient map) superimposed
10(b) will be different from that obtained from the data in Figure 10(c). We havecomputed a scour rate as:
d =∇ · qs1 − p
, (4)
where d is the local scour depth and p is porosity, assumed to be equal to 0.5.This value is larger than the typical ones, but we should consider that the sedimentsmoving are not as packed as in a layer of still particles. However, it is only a constantthat does not affect the resulting considerations. The map of the erosion trend isdepicted in Figure 11 for the three types of events. If we compute the average overall the locations as a global indicator of the scour rate, we find the latter being0.0044 cm/s for the TD map and 0.0024 cm/s for the ALL map, indicating that theestimated scour rate for TD events is 1.85 times that for the ALL events. It shouldbe remarked here that these scour rates cannot be compared to that obtained from
Gravity- and Turbulence-Dominated Sediment Motion in the Clear-Water . . . 57
Fig. 11. Average scour rate computed for different events (GD, TD and ALL). Dashedcontour lines indicate the erosion depth
the temporal development of the erosion depth, since the actual scour rate dependsalso on intermittency of sediment motion, that has been discarded in the presentanalysis.
5. Conclusions
In this work, we have presented a quantitative evaluation of the relevance of geotech-nical effects in the clear-water scour process at a vertical-wall abutment. Indeed, ithas been previously found in the literature that the principal vortex system is unsta-ble in time and that induces a bimodal behaviour of the sediments on the bottom ofthe erosion hole. Moreover, attempts to incorporate the effect of sediment slidingin the scour modelling have been proposed. Yet, to the best of our knowledge, noproper data were available for a proper quantification of the role of sliding in bridgescour.

58 A. Radice, F. Ballio, C. K. Tran
Starting from the measurements of the sediment kinematics taken during an ear-lier work, we have separated “gravity-dominated” effects and “turbulence-dominated”effects. A clear separation between these two types of events was not apparent. Wehave decided to recognize the GD events based on two criterions, namely (i) a di-rection of motion similar to the local slope of the scour hole and (ii) a velocitybounded by the maximum ideal velocity of sliding over an inclined plane.
The analysis of the experimental data has led to two major conclusions, namely(i) the dynamics of sediment motion in GD events is different from that in TD eventsand (ii) the presence of GD events may be able to alter the temporal development ofthe erosion process in the evolved scour stages. This findings support the need forproperly incorporating geotechnical effects in the modelling of local scour processes.On the other hand, a role of local turbulent events of the flow field has beenhypothesized for triggering the geotechnical sediment motion; therefore, it is notstraightforward to define proper strategies for modelling such effects. The presentpaper does not aim to provide fresh updates to modelling strategies, but furtherresearch will be devoted to gaining extensive data for proper support to modelling.
Acknowledgments
This research was supported by the Italian Ministry of University and Researchunder the “MOMICS” PRIN Program. The Directorate for Development Cooper-ation of the Italian Ministry of Foreign Affairs is acknowledged for the doctoratescholarship granted to Tran Kim Chau.
ReferencesBallio F., Radice A. (2007) Grain kinematics in weak linear transport, Archives of Hydro-Engineering
and Environmental Mechanics, 54 (3), 223–242.Chanson H. (1999) The Hydraulics of Open Channel Flow: an Introduction, Elsevier
Butterworth-Heinemann.Dargahi B. (1989) The turbulent flow field around a circular cylinder, Experiment in Fluids, 8, 1–12.Devenport W. J., Simpson R. L. (1990) Time-dependent and time-averaged turbulence structure near
the nose of a wing-body junction, Journal of Fluid Mechanics, 210, 23–55.Dey S., Barbhuiya A. K. (2005) Flow field at a vertical-wall abutment, Journal of Hydraulic Engi-
neering, 131 (12), 1126–1135.Fernandez Luque R., Van Beek R. (1976) Erosion and transport of bed-load sediment, Journal of
Hydraulic Research, 14, 127–144.Graf W. H., Istiarto I. (2002) Flow pattern in the scour hole around a cylinder, Journal of Hydraulic
Research, 40 (1), 13–20.Kirkil G., Constantinescu S. G., Ettema R. (2008) Coherent structures in the flow field around
a circular cylinder with scour hole, Journal of Hydraulic Engineering, 134 (5), 572–587.Koken M., Constantinescu G. (2008) An investigation of the flow and scour mechanisms around
isolated spur dikes in a shallow open channel: 2. Conditions corresponding to the finalstages of the erosion and deposition process, Water Resources Research, 44, W08407, doi:10.1029/2007WR006491.

Gravity- and Turbulence-Dominated Sediment Motion in the Clear-Water . . . 59
Kwan R. T. F., Melville B. W. (1994) Local scour and flow measurements at bridge abutments,Journal of Hydraulic Research, 32 (5), 661–673.
Melville B. W., Coleman S. E. (2000) Bridge scour, Water Resources Publications, LLC, HighlandsRanch, Colorado, USA.
Melville B. W., Raudkivi A. J. (1977) Flow characteristics in local scour at bridge piers, Journal ofHydraulic Research, 15 (4), 373–380.
Nagata N., Hosoda T., Nakato T., Muramoto Y. (2005) Three-dimensional numerical model for flowand bed deformation around river hydraulic structures, Journal of Hydraulic Engineering, 131(12), 1074–1087.
Nino Y., Garcıa M. (1994) Gravel saltation: 2. Modeling, Water Resources Research, 30, 1915–1924.Parker G., Seminara G., Solari L. (2003) Bed load at low Shields stress on arbitrarily sloping beds:
Alternative entrainment formulation, Water Resources Research, 39, 1183.Radice A., Ballio F. (2008) Double-average characteristics of sediment motion in one-dimensional
bed load, Acta Geophysica, 56 (3), 654–668.Radice A., Ballio F., Porta G. (2009a) Local scour at a trapezoidal abutment: sediment motion pattern,
Journal of Hydraulic Research, 47 (2), 250–262, doi: 10.3826/jhr.2009.3356.Radice A., Malavasi S., Ballio F. (2006) Solid transport measurements through image processing,
Experiments in Fluids, 41 (5), 721–734, doi: 10.1007/s00348-006-0195-9.Radice A., Malavasi S., Ballio F. (2008) Sediment kinematics in abutment scour, Journal of Hydraulic
Engineering, 134 (2), 146–156.Radice A., Porta G., Franzetti S. (2009b) Analysis of the time-averaged properties of sediment motion
in a local scour process, Water Resources Research, 54, W03401, doi: 10.1029/2007WR006754.Roulund A., Sumer B. M., Fredsøe J., Michelsen J. (2005) Numerical and experimental investigation
of flow and scour around a circular pile, Journal of Fluid Mechanics, 534, 351–401.Sumer B. M. (2007) Mathematical modelling of scour: A review, Journal of Hydraulic Research, 45
(6), 723–735.