stochastic nature of flow turbulence and sediment particle entrainment...
TRANSCRIPT

3
Stochastic Nature of Flow Turbulence and Sediment Particle Entrainment over the
Ripples at the Bed of Open Channel Using Image Processing Technique
Alireza Keshavarzi1,2 and James Ball2 1Water Department, Shiraz University, Shiraz
2School of Civil and Environmental Engineering, University of Technology Sydney, NSW, 2007,
1Iran 2Australia
1. Introduction
The formation of bed topography is the result of a complicated interaction between flow and sediment particles along the bed. Bed form and the geometry of ripples are also a function of bed roughness, median diameter of sediment particles and flow characteristics for example shear stress, separation and Froude number (Mogridge et al. 1994). Ripple geometry and its interaction with flow structure has been studied by many investigators; for example, Bagnold (1946), Carstens et al. (1969), Mogridge et al. (1994), Yalin (1977), Khelifa and Ouellet (2000), Miller and Komar (1980), and Nielsen (1992). In these studies, the geometry of bed ripples was found to be a function of turbulent shear stress parameters. Raudkivi (1997) pointed out that the ripples and vortices within the shear layer are affected by the flow depth, velocity distribution and shear stress on the bed. Despite more than three decades of investigation, there is still insufficient information to characterize ripple-flow interaction in adequate detail and over a range of turbulent flow conditions. One area where this lack of information exists is the application of image processing for
particle entrainment and analyze of the turbulence characteristics and flow over ripples. To
study the flow structure over the ripples, Sajjadi et al. (1996) found that the vortices that
form in the lee of ripples are important for the entrainment of sediment particles.
Keshavarzi and Ball (1999) used image processing technique to record entrained and
deposited particles over flat bed and found that there is an intermittent nature for particles
entrainment and deposition over the bed. Jeremy et al. (2005) used high resolution super-
VHS video system to monitor the development of the sand bed over a flat bed and observed
that initiation occurs at relatively low flow strengths, where sediment transport is patchy
and sporadic. Lajeunesse et al. (2010) used high speed video imaging system to record the
trajectories of the moving particles over flat bed and observed that entrained particles
exhibit intermittent motion composed of the succession of periods of flight and rest. Bennett
and Best (1996) conducted a series of experiment over fixed bed ripples and compared the
www.intechopen.com

Sediment Transport – Flow Processes and Morphology 70
spatial structure of flow over fixed symmetrical ripples to reveal the contrasts in the
dynamics of the flow separation zone over ripples. Kostachuck and Church (1993), Julien
and Klassen (1995), Kostaschuk and Villard (1996), Carling et al. (2000) and Kostachuck
(2000) have conducted field studies and concluded that the shear related coherent structures
were very important in bed form development and bed stability. Consideration of the
results from these studies indicates that the turbulence characteristics have a direct influence
on sediment entrainment and the ripple geometry.
2. Coherent structure of flow over the bed
Analysis of the turbulence characteristics is based on the concept of the bursting
phenomenon which was initially introduced by Kline et al. (1967) as a means of describing
the transfer of momentum between the turbulent and laminar regions near a boundary.
They defined bursting process as; Sweep event ( ' 0, ' 0u v ); Ejection event ( ' 0, ' 0u v );
Outward interaction event ( ' 0, ' 0u v ); and Inward interaction event ( ' 0, ' 0u v )
(Figure 1). The four bursting events have been identified having different effects on the
mode and rate of sediment transport (Bridge and Bennett 1992). Particle entrainment from
the bed is closely correlated to the sweep event (Thorne et al. 1989; Nelson et al. 1995;
Drake et al. 1988; Nakagwa and Nezu 1978; Grass 1971 and Keshavarzi and Ball 1997,
1999). Also the contribution of sweep and ejection events has been found to be more
important than outward and inward interactions. Furthermore, sweep and ejection events
occur more frequently than outward and inward interactions (Nakagwa and Nezu 1978;
Thorne et al. 1989; Keshavarzi and Ball 1997). In addition to the above characteristics, the
average magnitude of the shear stress during sweep event being much higher than the
time averaged shear stress (Keshavarzi and Ball 1997). A number of studies, for example,
Offen and Kline (1975) and Papanicolaou et al. (2002) investigated the characteristics of
the bursting process and its effect on particle motion. Consideration of this research led
Yen (2002) to point out the necessity to incorporate the bursting process into the
modelling of turbulent flow and sediment transport. Jafari Mianaei and Keshavarzi (2008,
2009) found that at the stoss side of ripples, ejection and sweep events and at the lee side
of the ripple outward interaction and inward interaction events were dominant. The
studies by Ojha and Mazumder (2008) showed that the ratio of shear stress for sweep and
ejection events along the dunes varied in an oscillatory pattern at the near bed region,
whereas such patterns disappear towards the outer flow. Also they found that along the
dune length, sweep events contribute to shear stress generation more than other events.
Termini and Sammartano (2009) investigated the effects of the variation of bed roughness
conditions on the vertical distributions frequency of the occurrence of ejection and sweep
events and concluded that the occurrence of sweep events increases as the bed roughness
increases. The structure of turbulent flow over the ripples in the bottom of an open channel is important for understanding of sediment particle entrainment and its transport. Two important issues which need to be understood in sediment movement are the stochastic nature of instantaneous shear stresses over a ripple bed and how it influences on sediment entrainment and transport. Therefore remains the necessity for sophisticated laboratory equipment to understand stochastic nature of flow over the ripples together with the hydrodynamic properties. Using the Acoustic Doppler Velocity meter (Micro-ADV) to
www.intechopen.com

Stochastic Nature of Flow Turbulence and Sediment Particle Entrainment over the Ripples at the Bed of Open Channel Using Image Processing Technique 71
measure three dimensional velocities, CCD camera to record images of particle motion and image processing technique enables to provide an accurate measurement of flow structure and particle entrainment from the bed.
3. Quadrant decomposition of velocity fluctuations
The bursting process consists of four categories of event; these categories are defined by the quadrant of the event. As shown in Figure 1, the events are:
Outward interaction event ' 0, ' 0u v
Ejection event ' 0, ' 0u v ,
Inward interaction event ' 0, ' 0u v and
Sweep event ' 0, ' 0u v .
Fig. 1. Quadrant analysis of bursting process
The velocity fluctuations and u v are defined as variations from the time-averaged (mean)
velocities in the longitudinal and vertical directions, ( u and v ), respectively. Algebraically,
they are defined by
u u u and v v v (1)
Where;
1
1 n
ii
u un
and 1
1 n
ii
v vn
(2)
n being is the number of instantaneous velocity samples.
The time-averaged instantaneous shear stress (Reynolds shear stress) at each point of flow is
defined as:
u v (3)
As shown by Jafari Mianaei and Keshavarzi (2008, 2009), the distribution of the
instantaneous velocities is influenced significantly by presence of ripples.
www.intechopen.com

Sediment Transport – Flow Processes and Morphology 72
4. Transformation of instantaneous shear stress
The magnitude of the time-averaged shear stress for each quadrant was found to be different, and to differ from the time-averaged instantaneous shear stress for the flow. The instantaneous shear stress for each event was normalized by the time-averaged shear stress at that point within the flow. Expressed algebraically, the non-dimensional instantaneous shear stress (C) was determined by
C (4)
In order to transform the normalized data into a normally distributed parameter, Keshavarzi and Ball (1997) applied a Box–Cox transformation (Box and Cox 1964) to transform the instantaneous shear stress to a normal distribution. Therefore, a Box–Cox transformation was applied to determine the mean magnitude of the normalized instantaneous shear stress. For this study, a Box–Cox power transformation was applied to transform the magnitude of instantaneous shear stress into a normal distribution. A Box–Cox power transformation for the parameter (C) is defined for non-zero values of k by:
( ) 1
( )C K
B C for 0, (5)
and
( ) ln( )B C C K for =0 (6)
where K is a constant and is transformation power. If all of the values in the time series are greater than zero then the constant K usually is set to zero. Keshavarzi and Ball (1997) applied the Box-Cox transformation to a full data set and suggested that K is equal to 0.272 for sweep events and 0.28 for ejection events. The inverse transformation which is the transformation B-1 of B(C) is given by:
1/( ) 1C B C
(7)
Mean values of the transformed data B(C) for each quadrant were calculated using
1
1( ) ( )
n
iki
B C B CN
k=1…..4 (8)
The inverse Box–Cox transformation was applied to these mean values to enable
determination of the time-averaged shear stress for each event and in a point of flow.
Consideration of the distribution of time-averaged shear stress over the ripples indicates
that there is an oscillatory pattern for the instantaneous shear stress along the bed.
5. Contribution probability of coherent flow and bursting events
Based on two dimensional velocity fluctuations, the occurrence probability of the bursting events for each quadrant is defined as;
www.intechopen.com

Stochastic Nature of Flow Turbulence and Sediment Particle Entrainment over the Ripples at the Bed of Open Channel Using Image Processing Technique 73
kk
nP
N (9)
4
1k
i
N n
(10)
Where Pk is the occurrence probability of an event in a quadrant, nk is the number of occurrences of each event, N is the total number of events and the subscript represents the individual quadrants (k=1…4). Using the above equations, the probability of each quadrant was computed at each point of flow within the depth. The contributions of coherent structures, such as the sweep (quadrant IV) and ejection (quadrant II) events, to momentum transfer have been extensively studied through quadrant analyses and probability analyses based on two-dimensional velocity information. Using similar techniques, the contributions of the four events to the entrainment and motion of sediment particles were determined from the experimental measurements. The studies by Jafari Mianaei and Keshavarzi (2008, 2009) indicates that at the stoss side of ripples, the time-averaged instantaneous shear stress of ejection and sweep events were dominant to the outward interaction and inward interaction events and at the lee side of the ripple it was vice versa. In other studies for example by Ojha and Mazumder (2008) it is shown that the ratio of time-averaged shear stress for sweep and ejection events along the dunes vary in an oscillatory pattern at the near bed region, whereas such pattern seems to disappear towards the outer flow. Termini and Sammartano (2009) concluded that the occurrence of sweep events increases as the bed roughness increases.
6. Modelling of time series of bursting events using markov process
As mentioned in previous sections, bursting events can be categorised into four quadrant zones which are outward interaction, ejection, inward interaction and sweep. The probability of movement from one category or zone to another is important. This movement of the events was investigated using a time series model. Consideration of the data indicates that the bursting process occurred in zone 4 at the first time step. In the second time step, the bursting event occurred in quadrant 1 and then the next bursting event occurred in quadrant 4. The next 4 bursting events were in the same quadrant. As a result, the sequence of 20 bursting events was found to be IV, I, IV, IV, IV, IV, IV, I, II III, II, II, II, IV, IV, IV, IV, IV, I, I, I. Hence, the turbulence of the flow results in a temporal sequence of bursting events. For the purposes of this study, the data were classified as discrete random variables and, hence, were analysed as a stochastic process or a Markov process. A discrete random variable {St} was defined as being a bursting event in a quadrant at time (t). Therefore, at time t, St can be in either quadrant 1, 2, 3 and 4, (outward interaction, ejection, inward interaction and sweep), respectively. In this study, the change in state was defined as a movement between quadrants and the transition probabilities for these changes were determined. It is worth noting that an event can be stable (the next bursting event occurs in the same quadrant) or can move to another quadrant. A Markov analysis looks at a sequence of events and analyzes the tendency of one event to be followed by another event. In the study reported herein, zero, first and second order Markov processes were considered. Details of these are
www.intechopen.com

Sediment Transport – Flow Processes and Morphology 74
A zero order Markov process requires that the current situation does not depend on the immediately previous situation.
A first order Markov process defines the current situation based only on the immediate past situation and can be expressed as
1 1 1 1, ,...,t t t t tpr s s s s pr s s (11)
A second order Markov process defines the current situation, based on the two previous situations. It can be expressed mathematically as:
1 1 1 1 1, ,..., ,t t t t t tpr s s s s pr s s s (12)
According to the concept of a first order Markove process, the probability of the next situation depends on the current situation, but it does not depend on the particular way that the model system arrived at the current situation. The transition probabilities of first order Markov process can be computed as:
1.
. ' 'ˆ no. '
ijij t t
i
nno of j s following i sP pr s j s i
total of i s n , 1,2,3,4i j (13)
where ni,j is the number of occurrences from situation i to situation j, ni. is the number of i’s in the series followed by another situations, so that ni.= ni1+ni2+ni3+ni4.The pi,j is estimated as the fraction of points for which St =i is followed by points with St+1=j. A second order Markov process defines the current situation, based on the two previous situations. The present situation St+1 can be found based on the situations at St and St-1. It means that the situation at (t+1) depends on the situation at (t) and (t-1). The second order Markov process is defined mathematically as:
1 1 1 1 1, ,..., ,t t t t t tpr s s s s pr s s s (14)
The transition probabilities of second order Markov process were obtained from the
conditional relative frequencies of transition counts. It can be computed as;
1 1
.
. ' ' 'ˆ , . ' '
, , 1,2,3,4
kijkij t t t
ki
nno of j s following i s following k sP pr s j s i s k
total no of i s following k s n
i j k
(15)
A zero order Markov process was examined also for comparison. If a zero-order Markov
process exists then the current situation does not depend on the previous situation. The
probabilities for a zero-order Markov process can be computed as:
ˆ ii
nP
n 1,2,3,4i (16)
where ni is number of situation i and n equal total number of sampling data.
To find the most appropriate model for prediction of the occurrence of bursting events, two
criteria can be used for assessment of the best order of the Markov process; these criteria are:
www.intechopen.com

Stochastic Nature of Flow Turbulence and Sediment Particle Entrainment over the Ripples at the Bed of Open Channel Using Image Processing Technique 75
The Akaike information criterion (AIC) (Akaike 1974; Tong, 1975); and
The Bayesian information criterion (BIC) (Schwartz, 1978; Katz, 1971). Both of these criteria are based on the log-likelihood functions for the transition probabilities of fitted Markov process. These log-likelihood functions depend on the transition counts and the transition probabilities. The log-likelihood functions for zero, first and second order Markov process are;
4
01
ˆln( )i ii
L n P
(17)
4 4
11 1
ˆln( )ij iji j
L n P
(18)
4 4 4
21 1 1
ˆln( )kij kijk i j
L n P
(19)
The AIC and BIC statistics are computed for each trial order m, using
( ) 2 * 2 * * ( 1)mmAIC m L s s (20)
( ) 2 * * (ln( ))mmBIC m L s n (21)
where s equals 4 and represents the four quadrant zones. The order m which produces the minimum value in either Equation (20) or (21) is
considered to be the most appropriate order of the Markov process.
Keshavarzi and Shirvani (2002) found that the minimum value for both the AIC and BIC
criteria was found to occur for a first-order process. Therefore, Keshavarzi and Shirvani
(2002) proposed that a first-order Markov process is an appropriate model for the
occurrence of bursting events. Hence, the type of bursting event at time tn+1 depends only
on the type of bursting event at time tn and, conversely, the situation at time tn depends only
on the situation at time tn-1.
7. Organization of the bursting events
The organization of bursting events and the associated coherent structures is still a major
concern and the focus of many studies. To find the organization of coherent structures in the
flow Keshavarzi and Shirvani (2002) applied a conditional probability analysis to the
experimental data and therefore a conditional probabilities or empirical conditional
probabilitiesy is proposed for organisation of the bursting process.
Base on the development of the conditional probabilities, Keshavarzi and Shirvani (2002)
identified three movement categories. These categories of movement between bursting
event states were:
Stable transition - a stable transition or movement between sequential bursting events
is defined as being events that remain in the same quadrant for two consecutive time
steps, i.e. ti and ti+1.
www.intechopen.com

Sediment Transport – Flow Processes and Morphology 76
Marginal or lateral transition - a marginal or lateral movement between sequential bursting events occurs when a bursting event in the following time step occurs in one of the neighbor quadrants, for example between quadrants 1 and 4, or 1 and 2, or 2 and 3 (or vice versa).
Cross transition – a cross transition or movement between sequential bursting events is defined as being events where sequential bursting events are diametrically opposed, for example from quadrant 1 to 3 or from quadrant 4 to 2.
These categories of movement between bursting events were applied in consideration of the occurrence of bursting events recorded in the experimental data. Points to note about the sequence of bursting events are:
First, it was found that the most probable next bursting event in a sequence occurs with a stable transition. This arises from the stable transition being stronger (having a higher probability) than marginal and cross transitions. In other words, when an event occurs in one of the quadrant zones at time step ti, the probability of the event to stay in the same zone at time step ti+1 is higher than other probabilities. Additionally it was apparent that, zone 4 is more stable than others. The stability of the events was sorted 4, 2, 1, and 3, in which the event in zone 4 (sweep event) is the most stable and zone 3 (inward interaction event) has the minimum stability.
The second category of movement was the marginal or lateral transition. As previously noted, this movement was defined as bursting events occurring in neighbouring quadrants. Compared to other categories, this movement was not as strong as the stable category. Finally, the marginal transition occurred more frequently between quadrants 4 and 1 than between other quadrants.
The third and final category was the cross transition. This category had the lowest probability compared to the stable and marginal categories.
8. Image processing and application in sediment transport
In spite of the importance of the initiation of individual sediment particles motion, no generally accepted definition exists due to the difficulty in defining of incipient of individual particle motion. One important reason for the lack of a general definition is the difficulty of observing sediment particles at the initiation of motion. Recently, the use of image processing techniques for observing sediment particles motion has been considered in some research studies. Examples of these studies which have considered image processing techniques include Keshavarzi and Ball (1999), Jafari Mianaei and Keshavarzi (2009), Nelson et al. (1995), Best (1992) and Drake et al. (1988) who used image processing techniques as a tool to investigate the intermittent nature of particle entrainment. Arising from these studies, it was considered that the application of image processing has potential to assist in understanding the processes influencing incipient particle motion. Motion picture photography is uniquely capable of detailed observation, quantitative tracking, and measurement of bed particle movement in clear water. This technique can show the entrainment of particles from the bed, settlement of particles, speed of particle movement, transport mode, and resting periods of a particle on the bed. With the capturing and collection of these data, it is possible to develop a statistical description of particle entrainment or sediment particle motion at the bed. In this study attention is paid to define the initiation of sediment particle motion over a movable bed with consideration of the bursting processes arising from flow turbulence. In order to understand the processes,
www.intechopen.com

Stochastic Nature of Flow Turbulence and Sediment Particle Entrainment over the Ripples at the Bed of Open Channel Using Image Processing Technique 77
image processing techniques were used to observe the particle movement over a designated area of the bed. The observed motion of sediment particles was characterised and a statistical description of the initiation of sediment particle motion and its correlation to the turbulence characteristics of the flow determined.
8.1 Image analysis of particles in motion 8.1.1 Basic concepts
The signal in image processing is a physical measure of the light intensity for the image. In a digital image, the signals are a series of digits or numbers, which are organised as an array in a file. Shown in Figure 2 is the concept of how an image can be converted to a digital signal. A signal may be continuous or discrete. In image processing the signals are in the form of a discrete signal. In order to analyse a series of sequential images spatially and temporally, it is necessary to apply statistical tools to these arrays to ascertain similarities or discrepancies.
Fig. 2. The conversion process and digitising an image (after Keshavarzi and Ball, 1999)
www.intechopen.com

Sediment Transport – Flow Processes and Morphology 78
8.1.2 Analysis techniques used
In order to analyse the captured images; two different techniques were used in this study.
These techniques were:
- A probability analysis of the entrained particles determined by counting the number of
particles in motion at an instant. This approach was useful to obtain an exceedance
probability of particles in motion in time respective to the exceedance probability of
shear stresses of the sweep events at the bed. The number of particles entrained into
motion was obtained through determination of the difference between sequential
images.
- Application of cross correlation and Fast Fourier transforms to determine the
displacement of particle between images and hence the particle velocity.
8.1.3 The subtraction technique and particle counting
The difference between two images f(x,y) and g(x,y), can be expressed as;
h(x,y)= f(x,y)- g(x,y),
where h(x,y) is a new image. Two images can be compared by computing the difference
between the light intensities at all pairs of corresponding pixels from image f(x,y) and image
g(x,y) (Adrian 1991, Willert and Gharib 1991). Here, this technique was used and a sequence
of images were compared to find the number of particles which were entrained and
deposited over a specified area and in a given time increment. A computer program written
in C++ was used to read a sequence of images in binary format and to produce an output
image which was the difference between the images.
8.1.4 Viewing of particles in new image
In order to view the difference between two images as an image, the subtracted light
intensities must be kept between 0 and 255, where the entrained and deposited particles are
denoted by black and white spots respectively. To keep the light intensities in this range, a
value of 255 must be added to the light intensities derived from subtraction of two images
and then the sum divided by two. From this computation, the difference between two
images can be obtained and the difference viewed as a new image. Thus result of this
procedure is shown in Figure 3 for a hypothetical sediment particle.
a) first image b) second image c) derived image
Fig. 3. A schematic illustration of image.
www.intechopen.com

Stochastic Nature of Flow Turbulence and Sediment Particle Entrainment over the Ripples at the Bed of Open Channel Using Image Processing Technique 79
Shown in Figure 4 are two sequential images captured during experimental run with the computed difference between these two images. If the two images are compared, the differences between these images are apparent and can be observed in the produced image. As shown in derived image, it is clear how many particles were entrained or deposited in a time increment. In the derived image the entrained particles appear as black spots and deposited particles are displayed as white spots. For statistical analysis of the particle entrained, a sequence of 81 images was compared in each experimental run. A manual counting of entrained particles was preferred due to the need for interpretation to ensure accurate counting of the particles. This need for interpretation arises from the potential for particles to be agitated but not moved. In this case the movement appears as a curved shadow line in the produced image and, therefore, was not considered as a moved particle. An example of this effect is shown in Figure 4. Keshavarzi and Ball (1999) were carried out an experimental study in a non-recirculating tilting rectangular flume of 0.61 m width, 0.60 m height and 35 m length. The sidewalls of the flume were made of glass, making it possible to observe and record the flow characteristics. It also made possible flow visualisation during the experimental tests. The bed of the flume was covered by sand particles of 2 mm nominal diameter. Construction of the flume enabled experimentation with different bed roughness and under different flow conditions. The movement of sand particles at the bed was observed and recorded with a high-resolution CCD camera. In order to get a clear picture; a slide projector was used to illuminate the specific area of the bed where the images were being recorded. Some precautions were made to ensure that a clear image was captured. For this analysis, a range of 5-25 frames per second were captured and digitized. The recorded video images were digitized into an array of 384 by 288 pixels with each pixel being quantized in 8 bits with light intensities ranging from 0 (for black) to 255 (for white). While the images were collected in colors, they were converted to a grey format for later analysis. The Grey format was selected due to its low requirements for storage and transfer to the computer. Using these derived images the numbers of the entrained and deposited particles in an instant of time were manually counted. In Figure 5 the time series of the number of entrained particles for a specified area are shown.
8.2 Relation between number of particle in motion and instantaneous shear stresses in sweep event The entrainment of particles from a mobile bed in an open channel flow has been investigated in several studies; for example by Einstein and Li (1958), where it was pointed out that this process is stochastic in nature due to the effect of turbulence. The number of entrained particles over a specified area varies with time. The entrained particles at any time depend on the instantaneous turbulent shear stress arising from the velocity fluctuations and the instantaneous shear stresses at the bed. Shown in Figure 5 is the number of particles in motion, at an instant of time and consequently how the entrained number of particle varies with time. The entrainment process can be defined by considering the instantaneous shear stress in sweep events and also the instantaneous number of particles in motion. In a study of sediment entrainment from the bed, Williams et al. (1989) and Nelson et al. (1995) investigated and found a high correlation between the streamwise velocity component and the sediment flux. Additionally, Nelson et al. (1995) found that the transport rate tends to be higher when the vertical velocity and Reynolds momentum flux are angled towards the bed. They found the best correlation between the sediment flux and the streamwise velocity
www.intechopen.com

Sediment Transport – Flow Processes and Morphology 80
component to occur with a lag of 0.1 second and consequently they suggested a measuring frequency of 10 Hz would give the best results in terms of time scales. A frequency rate of 10 Hz therefore was selected for this investigation.
Fig. 4. Two sequence of images with their difference.
www.intechopen.com

Stochastic Nature of Flow Turbulence and Sediment Particle Entrainment over the Ripples at the Bed of Open Channel Using Image Processing Technique 81
Fig. 5. Number of particles in motion in an increment of time (after Keshavarzi and Ball, 1999)
www.intechopen.com
Sediment Transport – Flow Processes and Morphology 82
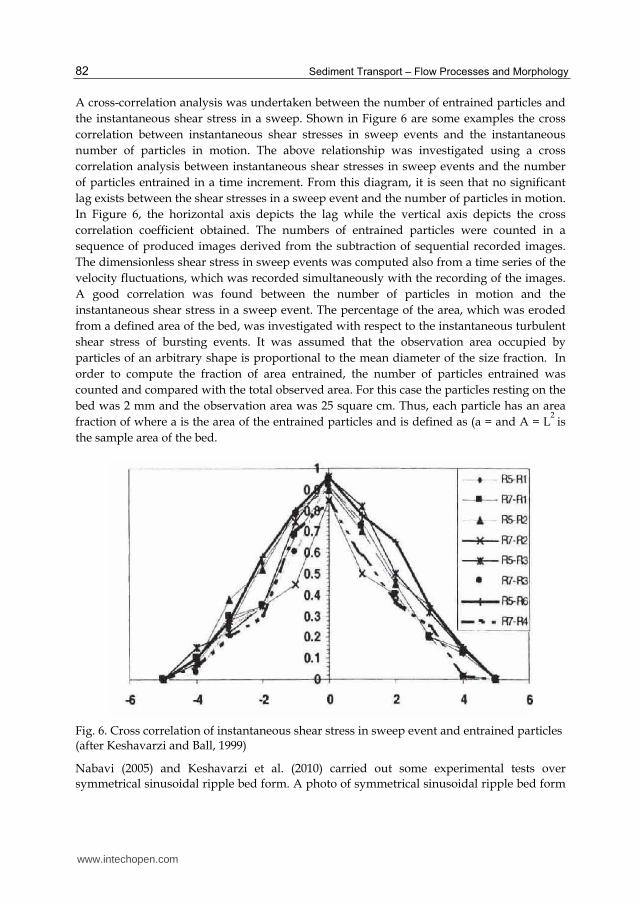
A cross-correlation analysis was undertaken between the number of entrained particles and
the instantaneous shear stress in a sweep. Shown in Figure 6 are some examples the cross
correlation between instantaneous shear stresses in sweep events and the instantaneous
number of particles in motion. The above relationship was investigated using a cross
correlation analysis between instantaneous shear stresses in sweep events and the number
of particles entrained in a time increment. From this diagram, it is seen that no significant
lag exists between the shear stresses in a sweep event and the number of particles in motion.
In Figure 6, the horizontal axis depicts the lag while the vertical axis depicts the cross
correlation coefficient obtained. The numbers of entrained particles were counted in a
sequence of produced images derived from the subtraction of sequential recorded images.
The dimensionless shear stress in sweep events was computed also from a time series of the
velocity fluctuations, which was recorded simultaneously with the recording of the images.
A good correlation was found between the number of particles in motion and the
instantaneous shear stress in a sweep event. The percentage of the area, which was eroded
from a defined area of the bed, was investigated with respect to the instantaneous turbulent
shear stress of bursting events. It was assumed that the observation area occupied by
particles of an arbitrary shape is proportional to the mean diameter of the size fraction. In
order to compute the fraction of area entrained, the number of particles entrained was
counted and compared with the total observed area. For this case the particles resting on the
bed was 2 mm and the observation area was 25 square cm. Thus, each particle has an area
fraction of where a is the area of the entrained particles and is defined as (a = and A = L2
is
the sample area of the bed.
Fig. 6. Cross correlation of instantaneous shear stress in sweep event and entrained particles (after Keshavarzi and Ball, 1999)
Nabavi (2005) and Keshavarzi et al. (2010) carried out some experimental tests over
symmetrical sinusoidal ripple bed form. A photo of symmetrical sinusoidal ripple bed form
www.intechopen.com

Stochastic Nature of Flow Turbulence and Sediment Particle Entrainment over the Ripples at the Bed of Open Channel Using Image Processing Technique 83
is shown in Figure 7. The experimentall studies by Nabavi (2005) and Keshavarzi et al.
(2010) were carried out in a non-recirculating glass flume located in the hydraulics
laboratory at Shiraz University. The glass flume consisted of a rectangular cross-section with
base width of 0.70m, height 0.60m and 15.50m length. The longitudinal slope of the flume
was set to 0.0005. The flow rate at the end of the flume was measured using a pre-calibrated
90o V-notch weir. A downstream adjustable gate was installed at the downstream end of the
flume to allow for adjustment of the flow depth and velocity within the flume. The
experimental measurements were made for three different forms of ripples; the wave
lengths of the ripples considered were 150, 200 and 250 mm while the height of the ripples
were 30 mm for all wave lengths. The flume bottom was covered with an erodible bed
material layer consisting of sand particles with mean average size (d50) of 0.62mm. A
schematic of the ripple dimensions considered is shown in Figure 8.
The experimental tests of Nabavi (2005) and Keshavarzi et al. (2010) were performed with
similar flow conditions. The flow rate for these tests was approximately 18.5 litres per
second and the flow depth was constant at 145 mm. The flow velocity was measured in
three dimensions using an Acoustic Doppler Velocity meter (Micro-ADV) at the points
within the flow. The measurements were made at eight depths within the flow; these depths
were 5, 10, 15, 20, 25, 30, 50 and 60 mm from the bed and at 16 longitudinal sections along
the flume. The distribution of instantaneous shear stress were calculated from experimental
data and they are shown in Figure 9 for 16 sections along the ripples. As it is shown in
Figure 9 the pattern of the distribution of instantaneous shear stress varied in each section
over the ripples.
Keshavarzi et al. (2010) determined the contributions of the four events to the entrainment
and motion of sediment from the experimental measurements. Shown in Figures 10 to 13 are
the frequencies of bursting events along the flume. From a quadrant analysis of velocity
fluctuations, it was found that at a level of 5 mm from the bed downstream of the second
ripple, Quadrants 1 and 3 were dominant when compared to Quadrants 2 and 4. This can be
interpreted as an expectation that sedimentation should occur at this location. However,
upstream of the ripple, Quadrants 2 and 4 were dominant to Quadrants 1 and 3. Therefore
entrainment would be expected to occur at this location. These expectations are confirmed
by measuring the bed profile over the ripples along the bed.
Fig. 7. A photo of the ripples
Jafari Mianaei and Keshavarzi (2009) used a ADV and CCD camera to record the entrained and deposited sediment particles with instantaneous velocity in 3 dimensions over the
=200, 250 & 300 mm
H=30 mm
www.intechopen.com

Sediment Transport – Flow Processes and Morphology 84
ripples at the bed of an experimental flume. They used similar technique used by Keshavarzi and Ball (1999) and measured the ratio of entrained particles to deposited particles along the channel and at the bed over the ripples.
Fig. 8. A schematic of the ripple dimensions considered in the study by Keshavarzi et al. (2010)
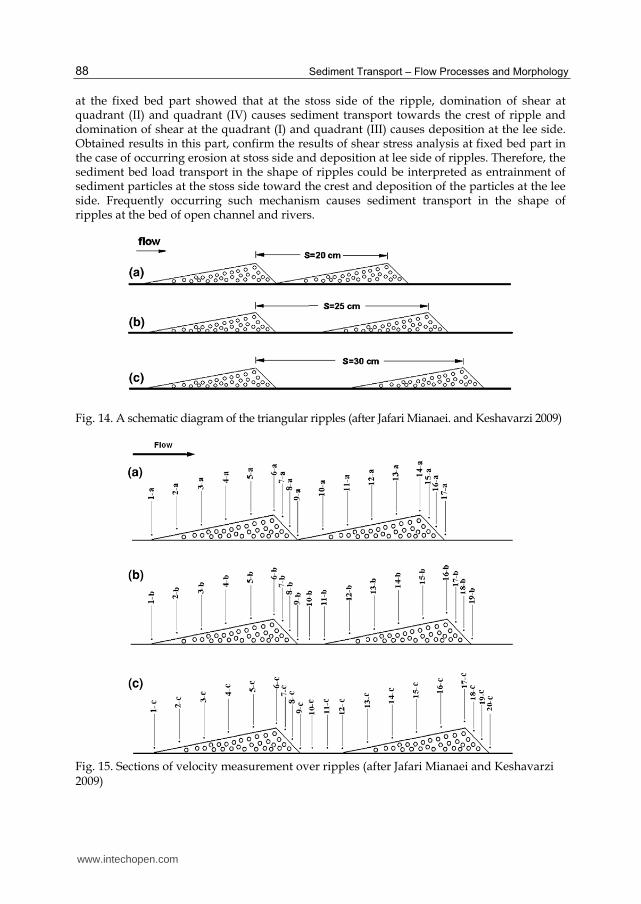
The experimental test by Jafari Mianaei and Keshavarzi (2008, 2009) were carried out in a physical model in hydraulic laboratory of Shiraz University. The floor and lateral walls are made of glass, which allows better side viewing of the flow and sediment movement in the flume. The glass-wall flume consisted of a rectangular cross section with base width of 0.70 m, height 0.60 m and 15.50 m length. The flow rate at the end of flume was measured using pre-calibrated right angle V-notches. For the fixed bed experiment, to model the ripples in physical modeling two artificial ripples in each run were used. Artificial ripples were considered as fixed bed. These bed forms were constructed out of two very different materials; aluminum plate and sand. Bed forms made from bent aluminum plate produced a fixed bed, necessary for sampling the velocity structure of the flow field. The aluminum forms also served as the moulds for generating the movable sandy bed forms for mobile bed experiment, necessary for image capturing. According to dimension of ripples formed at nature, height and length of each artificial ripple was 0.03 and 0.20 m, respectively. The stoss side of each form was inclined at 11 degrees from the horizontal, while inclination of the lee side was 31 degrees (according to the angel of repose) for modeling ripples. A schematic diagram of the ripples used in this experimental study is shown in Figure 14. Each bed form had no topographic variation in the cross-stream direction. The bottom of flume was covered with an erodible bed material layer consisting of sand particles with mean average size D50 of 0.62 mm for both fixed and mobile bed. These sand particles were used in order to fill the artificial ripples and shaping ripples at the bed of flume for making mobile bed. Three bed form configurations were used for both fixed and mobile experiments. In run (a), two bed forms were positioned back-to-back, the wavelength was 200 mm. In run (b), the bed forms were sufficiently separated and the wavelength was 250
www.intechopen.com

Stochastic Nature of Flow Turbulence and Sediment Particle Entrainment over the Ripples at the Bed of Open Channel Using Image Processing Technique 85
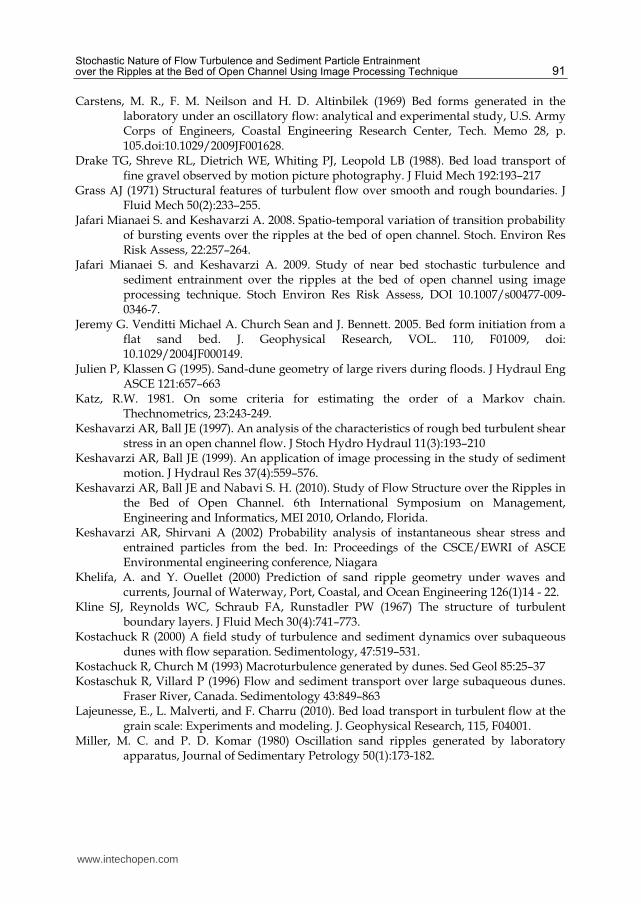
mm. For the final configuration, run (c), the wavelength was 300 mm. Figure 15 shows three bed form configurations of ripples and measured points over the ripples for velocity measurement in fixed bed part and image capturing in mobile bed part. At the fixed bed part, the instantaneous velocities of flow in three dimensions were measured with an Acoustic Doppler Velocimeter (microADV), developed by SonTek. The ADV was operated on a pulse-to-pulse coherent Doppler shift to provide three-dimensional velocity components at a rate of 50 Hz. The acoustic sensor consisted of one transmitting transducer and three receiving transducers. The receiving transducers were mounted on short arms
Fig. 9. Distribution of instantaneous shear stress over 16 sections along the ripples, Keshavarzi et al. (2010)
Section 1 Section 2 Section 3
Section 4
Section 5 Section 6 Section 7
Section 8
Section 9 Section 10 Section 11
Section 12
Section 13 Section 14 Section 15
Section 16
www.intechopen.com

Sediment Transport – Flow Processes and Morphology 86
Fig. 10. Bursting events at 5 mm from the bed
Fig. 11. Bursting events at 10 mm from the bed
Fig. 12. Bursting events at 15 mm from the bed
0
5
10
15
20
25
30
35
40
45
50
0 10 20 30 40 50 60 70X (cm)
Co
ntr
ibu
tio
nP
rob
ab
ilit
y(%
)
Q1
Q2
Q3
Q4
h
0
5
10
15
20
25
30
35
40
45
50
0 10 20 30 40 50 60 70X (cm)
Co
ntr
ibu
tio
n P
rob
ab
ilit
y (
%)
Q1
Q2
Q3
Q4
h
0
5
10
15
20
25
30
35
40
45
50
0 10 20 30 40 50 60 70X (cm)
Co
ntr
ibu
tio
nP
rob
ab
ilit
y(%
)
Q1
Q2
Q3
Q4
h
www.intechopen.com

Stochastic Nature of Flow Turbulence and Sediment Particle Entrainment over the Ripples at the Bed of Open Channel Using Image Processing Technique 87
Fig. 13. Bursting events at 20 mm from the bed
around the transmitting transducer at 120 degree azimuth intervals. Acoustic beams were emitted from the transmitting transducers. The beams travelling through the water arrived at a measuring point, located 50 mm below the transducer. The sampling volume of the ADV is very small, providing high spatial resolution and allowing measurements to be taken close to within about 5 mm of the boundary. They were reflected by the ambient particles within the flow being received by the receiving transducers. The processing module performed the digital signal processing required to measure the Doppler shifts. The data acquisition software provided real-time display of the data in graphical and tabular forms. For increasing accuracy of velocity sampling, velocity range should be determined. The velocity range determines the maximum velocity that can be measured. Typically the lowest setting that will cover the expected range of velocities should be chosen to minimize inherent signal noise. The results of analysis of the contribution of the probability of the bursting events are presented in Table 1, 2 and 3. According to analysis of bursting event it was found that at the stoss side of ripples, quadrants (II) and (IV) were dominant to the quadrants (I) and (III) and at the lee side of the ripple it was vice versa. Also the transition probabilities of the bursting events were determined. The results showed that stable organizations of each class of the events had highest transition probabilities whereas cross organizations had lowest transition probabilities. Additionally, an effort was made to find the average inclination angle of the bursting events in quadrants (II) and (IV). The results showed that the mean angle of events in quadrants (II) and (IV) increases at the downstream of stoss side to the crest in each experimental test. Also, at the lee side where the sediment particles were deposited, the inclination angles had the highest values. At the mobile bed part, an image processing technique was used to determine amount of deposited and entrained sediment particles over the ripples. The bed form movement was recorded using a digital camera taking pictures through a clear Plexiglas sidewall. These photographs were taken 1500 picture in 60s. Captured photographs were digitized. Resulting digital images were then used to quantify both the deposited and entrained in selected points over ripples. The results of captured picture in image processing are shown in Tables 4 to 6. If the ratio of deposited to entrained particles be more than 1, it means that deposition is dominant to entrainment and for less than 1, it is vice versa. As could be seen in the Tables 4, 5 and 6, at the stoss side of ripples, ratio of deposited to entrained particles is less than 1 and at the lee side it is more than 1. It shows that at the stoss side of ripples, erosion is dominant to deposition and at the lee side it is vice versa. Variation of shear stress
0
5
10
15
20
25
30
35
40
45
50
0 10 20 30 40 50 60 70X (cm)
Co
ntr
ibu
tio
n P
rob
ab
ilit
y (
%)
Q1
Q2
Q3
Q4
h
www.intechopen.com
Sediment Transport – Flow Processes and Morphology 88
at the fixed bed part showed that at the stoss side of the ripple, domination of shear at quadrant (II) and quadrant (IV) causes sediment transport towards the crest of ripple and domination of shear at the quadrant (I) and quadrant (III) causes deposition at the lee side. Obtained results in this part, confirm the results of shear stress analysis at fixed bed part in the case of occurring erosion at stoss side and deposition at lee side of ripples. Therefore, the sediment bed load transport in the shape of ripples could be interpreted as entrainment of sediment particles at the stoss side toward the crest and deposition of the particles at the lee side. Frequently occurring such mechanism causes sediment transport in the shape of ripples at the bed of open channel and rivers.
Fig. 14. A schematic diagram of the triangular ripples (after Jafari Mianaei. and Keshavarzi 2009)
Fig. 15. Sections of velocity measurement over ripples (after Jafari Mianaei and Keshavarzi 2009)
www.intechopen.com

Stochastic Nature of Flow Turbulence and Sediment Particle Entrainment over the Ripples at the Bed of Open Channel Using Image Processing Technique 89
Points 1 2 3 4 5 6 7 8 9 10 11 12 13 14 15 16 17
Quadrant (I) 19 18 19 22 24 24 26 25 26 18 16 16 18 19 27 27 31
Quadrant (II) 31 29 28 27 25 24 22 22 25 33 33 33 28 27 24 23 17
Quadrant (III) 19 20 21 22 25 23 27 29 27 16 17 15 20 20 26 26 34
Quadrant (IV) 32 33 32 28 27 28 26 24 22 32 33 35 33 34 24 24 17
Table 1. Contribution probability of the events in quadrant I, II, III and IV based on two-dimensional bursting processes over ripples for experiment (a)
Points 1 2 3 4 5 6 7 8 9 10 11 12 13 14 15 16 17 18 19
Quadrant (I) 16 19 21 24 19 23 25 36 34 16 17 18 17 19 19 27 30 31 32
Quadrant (II) 31 29 28 25 30 31 24 16 13 29 28 28 30 28 30 23 23 23 21
Quadrant (III) 19 21 22 25 20 20 26 32 39 16 18 18 19 21 19 25 27 28 27
Quadrant (IV) 33 31 29 27 31 26 24 16 15 39 36 36 34 33 31 25 21 18 20
Table 2. Contribution probability of the events in quadrant I, II, II and IV based on two-
dimensional bursting processes over ripples for experiment (b)
Points 1 2 3 4 5 6 7 8 9 10 11 12 13 14 15 16 17 18 19 20
Quadrant (I) 22 21 23 21 20 21 27 27 27 20 17 16 16 16 20 18 21 26 28 36
Quadrant (II) 27 28 26 27 28 27 23 24 24 33 35 38 34 32 27 28 27 25 23 18
Quadrant (III) 23 23 22 23 22 24 28 26 26 19 17 15 17 19 21 21 21 26 25 28
Quadrant (IV) 28 28 28 30 30 28 23 24 24 28 31 31 32 33 32 33 31 23 24 18
Table 3. Contribution probability of the events in quadrant I, II, II and IV based on two-
dimensional bursting processes over ripples for experiment (c)
Points 1 2 3 4 5 6 7 8 9 10 11 12 13 14 15 16 17
Deposited i l
316 288 286 269 365 307 285 289 283 366 234 230 263 290 279 284 297
Entrained i l
334 273 302 281 398 329 296 277 281 375 246 227 273 294 275 267 303
Ratio 0.94 1.05 0.94 0.95 0.91 0.93 0.96 1.04 1.01 0.98 0.95 1.01 0.96 0.99 1.01 1.06 0.98
Table 4. Ratio of deposited particles to entrained particles for run (a)
Points 1 2 3 4 5 6 7 8 9 10 11 12 13 14 15 16 17 18 19
Deposited i l
131 267 241 325 330 322 256 268 291 221 260 308 258 332 432 280 255 284 280
Entrained i l
122 277 247 332 353 350 244 248 263 242 281 358 275 356 460 339 261 249 251
Ratio 1.0 0.9 0.9 0.9 0.9 0.9 1.0 1.0 1.1 0.9 0.9 0.8 0.9 0.9 0.9 0.8 0.9 1.1 1.1
Table 5. Ratio of deposited particles to entrained particles for run (b)
www.intechopen.com

Sediment Transport – Flow Processes and Morphology 90
Points 1 2 3 4 5 6 7 8 9 10 11 12 13 14 15 16 17 18 19 20
Deposited l
239 248 309 371 305 329 379 453 499 554 450 409 433 328 348 404 299 242 263 379
Entrained l
253 254 321 396 326 355 384 449 478 580 481 434 454 353 358 443 312 243 235 321
Ratio 0.9 0.9 0.9 0.9 0.9 0.9 0.9 1.0 1.0 0.9 0.9 0.9 0.9 0.9 0.9 0.9 0.9 1.0 1.1 1.1
Table 6. Ratio of deposited particles to entrained particles for run (c)
9. Conclusion
In this study, the flow structure over the ripples was investigated experimentally. The focus of this study was the measurement and analysis of the dominant bursting events and the flow structures over ripples in the bed of a channel. Two sets of ripples 1) Symmetrical bell shaped ripples with different sinuosity wave length and 2) Asymmetrical triangular shaped with different wavelength were tested in a comprehensive laboratory study. The velocities of flow over the ripples were measured at the threshold of motion in three dimensions using an Acoustic Doppler Velocity meter (Micro-ADV) with a sampling rate of 50 Hz. These velocities were measured at 5, 10 15, 20, 25, 30 50 and 60 mm from the bed at 16 longitudinal positions along the flume for a total of 128 points. At the same time the particle motion was recorded using CCD camera. An image processing technique was used to extract information from the recorded images. Consideration of these results showed that upstream of the first ripple, bursting events in quadrants 2 and 4 are dominant, however, downstream of the ripple, the bursting events in quadrants 1 and 3 are dominant and that sediment deposition occurred downstream of the ripple.
10. References
Adrian, R.J.. (1991). Particle-imaging techniques for experimental fluid mechanics. Annual Reviews Fluid Mechanics, 23: 261-304.
Akaike, H.,1974. A new look at the statistical model identification. IEEE Trans. Autom. Control, AC-19:716-723.
Bagnold, R. A. (1946) Motion of waves in shallow water: interaction between waves and sand bottoms, Proceedings of the Royal Society of London, Ser. A, 187, pp. 1-18.
Bennett S, Best J (1996) Mean flow and turbulence structure over fixed ripples and the ripple–dune transition. In: Ashworth PJ et al. (eds) Coherent flow in open channels. John Wiley, NJ, pp 281-203.
Best, J., (1992). On the entrainment of sediment and Initiation of bed defects: insights from recent developments within turbulent boundary layer research. Sedimentology,39: 797-811.
Best, J., (1996). The fluid dynamics of small-scale alluvial Advances in dynamics and stratigraph Edited by P.A., and Dawson, M.R., John Wiley Sons, Chichester.
Box GEP, Cox DR (1964) An analysis of transformation. J Roy Stat Soc Ser B 26:211–252 Bridge JS, Bennett SJ. (1992). A model for entrainment and transport of sediment grains of
mixed sizes, shapes and densities. Water Resour Res, 28(2):337–63. Carling P, Golz E, Orr HG, Radecki-Pawlik A (2000). The morphodynamics of fluvial sand
dunes in the Ripple–dune transition 647 Rhine River, near Mainz, Germany. II. Hydrodynamics and sediment transport. Sedimentology 47:253–278
www.intechopen.com
Stochastic Nature of Flow Turbulence and Sediment Particle Entrainment over the Ripples at the Bed of Open Channel Using Image Processing Technique 91
Carstens, M. R., F. M. Neilson and H. D. Altinbilek (1969) Bed forms generated in the laboratory under an oscillatory flow: analytical and experimental study, U.S. Army Corps of Engineers, Coastal Engineering Research Center, Tech. Memo 28, p. 105.doi:10.1029/2009JF001628.
Drake TG, Shreve RL, Dietrich WE, Whiting PJ, Leopold LB (1988). Bed load transport of fine gravel observed by motion picture photography. J Fluid Mech 192:193–217
Grass AJ (1971) Structural features of turbulent flow over smooth and rough boundaries. J Fluid Mech 50(2):233–255.
Jafari Mianaei S. and Keshavarzi A. 2008. Spatio-temporal variation of transition probability of bursting events over the ripples at the bed of open channel. Stoch. Environ Res Risk Assess, 22:257–264.
Jafari Mianaei S. and Keshavarzi A. 2009. Study of near bed stochastic turbulence and sediment entrainment over the ripples at the bed of open channel using image processing technique. Stoch Environ Res Risk Assess, DOI 10.1007/s00477-009-0346-7.
Jeremy G. Venditti Michael A. Church Sean and J. Bennett. 2005. Bed form initiation from a flat sand bed. J. Geophysical Research, VOL. 110, F01009, doi: 10.1029/2004JF000149.
Julien P, Klassen G (1995). Sand-dune geometry of large rivers during floods. J Hydraul Eng ASCE 121:657–663
Katz, R.W. 1981. On some criteria for estimating the order of a Markov chain. Thechnometrics, 23:243-249.
Keshavarzi AR, Ball JE (1997). An analysis of the characteristics of rough bed turbulent shear stress in an open channel flow. J Stoch Hydro Hydraul 11(3):193–210
Keshavarzi AR, Ball JE (1999). An application of image processing in the study of sediment motion. J Hydraul Res 37(4):559–576.
Keshavarzi AR, Ball JE and Nabavi S. H. (2010). Study of Flow Structure over the Ripples in the Bed of Open Channel. 6th International Symposium on Management, Engineering and Informatics, MEI 2010, Orlando, Florida.
Keshavarzi AR, Shirvani A (2002) Probability analysis of instantaneous shear stress and entrained particles from the bed. In: Proceedings of the CSCE/EWRI of ASCE Environmental engineering conference, Niagara
Khelifa, A. and Y. Ouellet (2000) Prediction of sand ripple geometry under waves and currents, Journal of Waterway, Port, Coastal, and Ocean Engineering 126(1)14 - 22.
Kline SJ, Reynolds WC, Schraub FA, Runstadler PW (1967) The structure of turbulent boundary layers. J Fluid Mech 30(4):741–773.
Kostachuck R (2000) A field study of turbulence and sediment dynamics over subaqueous dunes with flow separation. Sedimentology, 47:519–531.
Kostachuck R, Church M (1993) Macroturbulence generated by dunes. Sed Geol 85:25–37 Kostaschuk R, Villard P (1996) Flow and sediment transport over large subaqueous dunes.
Fraser River, Canada. Sedimentology 43:849–863 Lajeunesse, E., L. Malverti, and F. Charru (2010). Bed load transport in turbulent flow at the
grain scale: Experiments and modeling. J. Geophysical Research, 115, F04001. Miller, M. C. and P. D. Komar (1980) Oscillation sand ripples generated by laboratory
apparatus, Journal of Sedimentary Petrology 50(1):173-182.
www.intechopen.com

Sediment Transport – Flow Processes and Morphology 92
Mogridge, G. R., M. H. Davies, and D. H. Willis (1994) Geometry prediction for wave generated bedforms, Coastal Engineering 22, pp. 255-286.
Nabavi S.H. (2005). Study of flow structure over the ripples at the bed of open channel. MS thesis, Water Department, Shiraz University, Shiraz, Iran.
Nakagwa H, Nezu I (1978) Bursting phenomenon near the wall in open channel flow and its simple mathematical model. Fac Eng Kyoto University, Japan XL (4) 40:213–240
Nelson JM, Shreve RL, McLean SR, Drake TG (1995) Role of near bed turbulence structure in bed load transport and bed form
Nielsen, P. (1992) Coastal bottom boundary layers and sediment transport, World Scientific, pp. 324.
Offen GR, Kline SJ (1975) A proposed model of the bursting process in turbulent boundary layers. J Fluid Mech 70:209–228.
Ojha S.P. and Mazumder B.S., 2008. Turbulence characteristics of flow region over a series of 2-D dune shaped structures. Advances in Water Resources 31:561–576.
Papanicolaou AN, Diplas P, Evaggelopoulos N, Fotopoulos S (2002) Stochastic incipient motion criterion for spheres under various packing conditions. J Hydraul Eng ASCE 128(4):369–380.
Raudkivi, A. (1997) Ripples of stream bed, Journal of Hydraulic Engineering 123:1 pp. 58-64. Sajjadi SG, Aldridge JN, Nicholas DJ (1996) Sediment transport mechanism over rippled
sand beds. In: Spaulding ML, Cheng RT (eds) Estuarine and coastal modelling. ASCE, New York, pp 669–680.
Schwarz, G., 1978. Estimating the dimension of a model. Ann. Stat., 6, 461-464. Sontek ADV Operation Manual (1997) Firmware version 4.0. Sontek, San Diego Termini D. and Sammartano V. (2009). Sediment flow interactions and effects on bed forms
mechanism. 7th ISE & 8th HIC Chile. Thorne PD, Williams JJ, Heathershaw AD (1989) In situ acoustic measurements of marine
gravel threshold and transport. Sedimentology, 36:61–74 Tong, H.,1975. Determination of the order of a Markov chain by Akaike's Information
Criterion. J. Appl. Probability, 12:488-497. Willert C.E. and Gharib, M., (1991). Digital particle image velocimetry. Experiments in Fluid;
10: 181-193. Williams, J.J., 1990. Video observations of marine gravel transport. Mar. Lett.,10:157-164. Williams, J.J., 1996. Turbulent flow in rivers. In Advances dynamics and stratigraphy. Edited
by P.A., and Dawson, M.R., John Wiley &Sons. Chichester. Yalin, M. S. (1977) On the determination of ripple length, Proceedings of the American
Society of Civil Engineers 103:HY4, pp. 439-442. Yen BC (2002) Stochastic inference to sediment and fluvial hydraulics. J Hydraul Eng ASCE
128(4):365–367.
www.intechopen.com

Sediment Transport - Flow and Morphological ProcessesEdited by Prof. Faruk Bhuiyan
ISBN 978-953-307-374-3Hard cover, 250 pagesPublisher InTechPublished online 26, October, 2011Published in print edition October, 2011
InTech EuropeUniversity Campus STeP Ri Slavka Krautzeka 83/A 51000 Rijeka, Croatia Phone: +385 (51) 770 447 Fax: +385 (51) 686 166www.intechopen.com
InTech ChinaUnit 405, Office Block, Hotel Equatorial Shanghai No.65, Yan An Road (West), Shanghai, 200040, China
Phone: +86-21-62489820 Fax: +86-21-62489821
The purpose of this book is to put together recent developments on sediment transport and morphologicalprocesses. There are twelve chapters in this book contributed by different authors who are currently involvedin relevant research. First three chapters provide information on basic and advanced flow mechanismsincluding turbulence and movement of particles in water. Examples of computational procedures for sedimenttransport and morphological changes are given in the next five chapters. These include empirical predictionsand numerical computations. Chapters nine and ten present some insights on environmental concerns withsediment transport. Last two contributions deal with two large-scale case studies related to changes in thetransport and provenance of glacial marine sediments, and processes involving land slides.
How to referenceIn order to correctly reference this scholarly work, feel free to copy and paste the following:
Alireza Keshavarzi and James Ball (2011). Stochastic Nature of Flow Turbulence and Sediment ParticleEntrainment Over the Ripples at the Bed of Open Channel Using Image Processing Technique, SedimentTransport - Flow and Morphological Processes, Prof. Faruk Bhuiyan (Ed.), ISBN: 978-953-307-374-3, InTech,Available from: http://www.intechopen.com/books/sediment-transport-flow-and-morphological-processes/stochastic-nature-of-flow-turbulence-and-sediment-particle-entrainment-over-the-ripples-at-the-bed-o