gray wolf post-delisting monitoring 2013 › ... › wolf › documents ›...
TRANSCRIPT
WISCONSIN GRAY WOLF POST-DELISTING MONITORING
27 JANUARY 2012 THROUGH 14 APRIL 2013
By David M. MacFarland and Jane E. Wiedenhoeft
BUREAU OF WILDLIFE MANAGEMENT
Wisconsin Department of Natural Resources
P.O. Box 7921
Madison, Wisconsin 53707

Introduction:
This report covers activities conducted from January 27th
, 2012 through April 14th
, 2013 on gray
wolf population monitoring in Wisconsin following the removal of wolves from the federal list
of threatened and endangered species in Wisconsin and other portions of the Western Great
Lakes Distinct Population segment.
Gray wolves (Canis lupus) were listed as Endangered in the Great Lakes region in 1967 and
1974 by the U.S. Fish and Wildlife Service (U.S. Fish and Wildlife Service 1992). The State of
Wisconsin listed wolves as Endangered in 1975, reclassified them to Threatened in 1999, and
delisted wolves to Protected Wild Animal on 1 August 2004. The Wisconsin Department of
Natural Resources (WDNR) has monitored wolves since 1979. A recovery plan with a
reclassification goal to Threatened status of 80+ wolves was completed in 1989 (Wisconsin DNR
1989), and a management plan was completed in 1999 (Wisconsin DNR 1999). The
management plan set a state delisting goal of a late winter count of 250 wolves outside of Indian
reservations, and a management goal of 350 wolves outside of Indian reservations.
The 1992 Federal Recovery Plan for the eastern timber wolf established reclassification goals of
80+ wolves for 3 years in Wisconsin, and a delisting goal of 100+ wolves for 5 years for
Wisconsin and Michigan (U.S. Fish & Wildlife Service 1992). Federal delisting also required a
stable population of 1251 to 1400 wolves in Minnesota, and approved management plans for
each state. Wolves were removed from the Federal endangered species list on January 27th
2012
and management authority was returned to the states.
The enclosed report describes wolf management activities conducted in Wisconsin between
January 27th
, 2012 and June 30th
, 2013, and represents the first full year of Post Delisting
Monitoring. Data are reported by wolf harvest units established in 2012 (figure 1). We report
data across 2 date ranges. Data reported by “reporting period” covers the full date range of this
report January 27th
2012-June 30th
2013. Data reported by “monitoring period” covers the wolf
monitoring year April 15th
2012-April 14th
2013. This is done to facilitate evaluation of
management actions which occurred between population estimates conducted in April of each
year.
WOLF POPULATION MONITORING
Wolf population monitoring was conducted using a territory mapping with telemetry technique.
A full description of methods is provided by Wydeven et. al (2009). During the 2012-2013
monitoring period 63 wolves were monitored by radio telemetry (Table 1b). Mortality on radio
collared wolves was higher than historic averages, 21 radio collared animals died during the
monitoring period (Table 2b). Radio telemetry collars were deployed on 25 wolves to support
monitoring efforts (Table 3).
The wolf population showed population growth through April, 2012 (figure 2) when the
minimum state-wide wolf population was estimated to be 815-880 (Table 1a). In the period
April 15, 2012 – April 14, 2013 WDNR personnel recorded 230 wolf mortalities (Table 2b)
representing 28.22% of the 2012 minimum population. The minimum state-wide wolf

population was estimated to be 809-834 in April, 2013 (Table 1b). The observed decline of
0.74% between year minimum counts suggests observed mortality levels did not significantly
impact the population.
Statewide Wolf Distribution
Wolf range was estimated to be 17,221 miles2 distributed through the northern (15,188 miles
2)
and central (2,033 miles2) forested regions of Wisconsin in April 2013(Figure 1). Two hundred
thirteen packs were identified in 2012 and 214 in 2013 (Tables 1a&b). Mean winter annual pack
territory size for 40 packs with 20 locations was estimated to be 43.1 mi2 (SD = 19.4) (Table
1b). Using the 2013 minimum population count of 809-834 wolves, wolf density is estimated to
be 1 wolf per 20.65 to 21.29 miles2 of wolf range. Density was calculated by dividing occupied
wolf range by the minimum population count range. This method differs from the density
calculations in prior WDNR reports. Public observations were collected to obtain information on
wolf distribution and to contribute to population estimates. A total of 276 observations were
reported (table 4, figure 3).
Wolf Mortality
Mortality was monitored through field observation, necropsy of collared and suspicious
mortalities, and mandatory reporting of harvest and depredation control mortalities. Cause of
death was determined through field investigation or necropsy.
Management actions increased wolf mortality rates within the reporting period. Newly
authorized harvest and depredation control actions represented the highest sources of mortality.
Human caused mortality represented 96.6% of mortalities with known cause (Tables 2a,b&c).
We speculate the reporting rate for wolf mortalities has declined since federal delisting, this may
partially explain the low number of natural mortalities detected.
Hunters and trappers were required to submit biological samples to WDNR. Teeth were
collected from all submitted carcasses and aged via cementum annuli by Matson’s Laboratory,
Milltown, MT. Wolves less than 1 year old represented 50% of the harvest sample and yearlings
represented 25% (table 5). Three females of prime breeding age (≥3 years old) were harvested
(table 6).
Disease / Parasite Occurrence in Wolves
Parasite occurrence was recorded from field investigations of non-harvest mortalities and when
live wolves were captured for research purposes. Symptoms consistent with mange were
recorded in 9.8% of examined mortalities (n=133) and 8.0% of research captures (n=25) (Table
3). Tick exposure was noted in 60.0% of research capture animals, tick exposure did not appear
to be unusually heavy in the 2012-2013 monitoring year. No disease related mortalities were
detected.
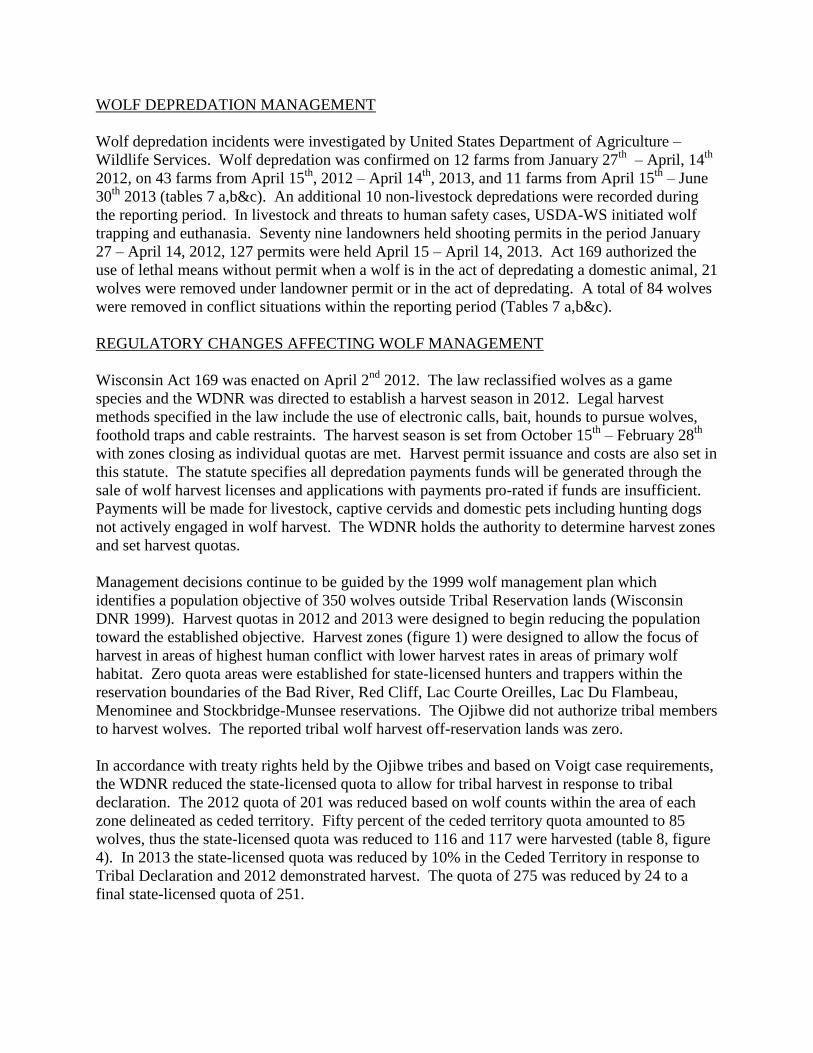
WOLF DEPREDATION MANAGEMENT
Wolf depredation incidents were investigated by United States Department of Agriculture –
Wildlife Services. Wolf depredation was confirmed on 12 farms from January 27th
– April, 14th
2012, on 43 farms from April 15th
, 2012 – April 14th
, 2013, and 11 farms from April 15th
– June
30th
2013 (tables 7 a,b&c). An additional 10 non-livestock depredations were recorded during
the reporting period. In livestock and threats to human safety cases, USDA-WS initiated wolf
trapping and euthanasia. Seventy nine landowners held shooting permits in the period January
27 – April 14, 2012, 127 permits were held April 15 – April 14, 2013. Act 169 authorized the
use of lethal means without permit when a wolf is in the act of depredating a domestic animal, 21
wolves were removed under landowner permit or in the act of depredating. A total of 84 wolves
were removed in conflict situations within the reporting period (Tables 7 a,b&c).
REGULATORY CHANGES AFFECTING WOLF MANAGEMENT
Wisconsin Act 169 was enacted on April 2nd
2012. The law reclassified wolves as a game
species and the WDNR was directed to establish a harvest season in 2012. Legal harvest
methods specified in the law include the use of electronic calls, bait, hounds to pursue wolves,
foothold traps and cable restraints. The harvest season is set from October 15th
– February 28th
with zones closing as individual quotas are met. Harvest permit issuance and costs are also set in
this statute. The statute specifies all depredation payments funds will be generated through the
sale of wolf harvest licenses and applications with payments pro-rated if funds are insufficient.
Payments will be made for livestock, captive cervids and domestic pets including hunting dogs
not actively engaged in wolf harvest. The WDNR holds the authority to determine harvest zones
and set harvest quotas.
Management decisions continue to be guided by the 1999 wolf management plan which
identifies a population objective of 350 wolves outside Tribal Reservation lands (Wisconsin
DNR 1999). Harvest quotas in 2012 and 2013 were designed to begin reducing the population
toward the established objective. Harvest zones (figure 1) were designed to allow the focus of
harvest in areas of highest human conflict with lower harvest rates in areas of primary wolf
habitat. Zero quota areas were established for state-licensed hunters and trappers within the
reservation boundaries of the Bad River, Red Cliff, Lac Courte Oreilles, Lac Du Flambeau,
Menominee and Stockbridge-Munsee reservations. The Ojibwe did not authorize tribal members
to harvest wolves. The reported tribal wolf harvest off-reservation lands was zero.
In accordance with treaty rights held by the Ojibwe tribes and based on Voigt case requirements,
the WDNR reduced the state-licensed quota to allow for tribal harvest in response to tribal
declaration. The 2012 quota of 201 was reduced based on wolf counts within the area of each
zone delineated as ceded territory. Fifty percent of the ceded territory quota amounted to 85
wolves, thus the state-licensed quota was reduced to 116 and 117 were harvested (table 8, figure
4). In 2013 the state-licensed quota was reduced by 10% in the Ceded Territory in response to
Tribal Declaration and 2012 demonstrated harvest. The quota of 275 was reduced by 24 to a
final state-licensed quota of 251.

WDNR personnel consulted with the Van Deelen lab at the University of Wisconsin Department
of Forest and Wildlife Ecology to assess the likely impacts of harvest on the wolf population.
Population modeling conducted by the Van Deelen lab estimates one-year population reduction
of 3.4-22.6% (median 12.72%) if the total 2013 quota of 275 is achieved, other mortality rates
remain at historic levels and depredation control results in removal of 10% of the wolf
population (unpublished data). This model predicts the wolf population will be 595 (95% CI:
512-677) in 20 years if harvest and mortality rates (percent of the population) remain constant.
Assumptions of this model include harvest occurs prior to the breeding season, background
mortality risk remains constant, harvest in MN and MI remain at 2013 rates, all mortality sources
are additive and wolf behavior and dispersal do not change in response to harvest.
LAW ENFORCEMENT
Population monitoring and law enforcement efforts detected 24 illegally killed wolves within the
monitoring period. Investigations were conducted in 35 cases and 15 citations were issued (table
9).
OTHER INFORMATION ON THE STATUS OF WOLVES
The Wisconsin Natural Resource Board directed the WDNR to develop a new wolf management
plan. The WDNR established a new wolf advisory committee made up of representatives from
the WDNR, USDA-WS, US Forest Service, US Fish and Wildlife Service, Great Lakes Indian
Fish and Wildlife Commission, WI Conservation Congress, WI Cattleman’s Association, WI
Bear Hunters Association, Timber Wolf Alliance, WI Bowhunters Association, WI Trappers
Association, Safari Club International, Hunters Rights Coalition, WI County Forest Association
and WI Wildlife Federation. The committee began wolf plan discussions in June, 2013. A
finalized and approved plan is anticipated to begin influencing management decisions in 2015.
Information on wolf prey species
White-tailed deer are a primary prey species in Wisconsin. White-tailed deer density remained
above management goals in all but 1 wolf harvest unit (Table 10). There have been no
significant changes in deer management which would limit wolf prey availability.
LITERATURE CITED
U.S. Fish and Wildlife Service. 1992. Recovery Plan for the Eastern Timber Wolf. Twin Cities, MN. 73 pp.
Wisconsin DNR. 1989. Wisconsin Timber Wolf Recovery Plan. Wisconsin Endangered Resources
Report. 50:37 pp.
Wisconsin Department of Natural Resources. 1999. Wisconsin Wolf Management Plan. Madison: PUBL-ER-099
99, Wisconsin Department of Natural Resources. http://dnr.wi.gov/files/PDF/pubs/ER/ER0099.pdf
Wydeven, A.P., J.A. Wiedenhoeft, R.N. Schultz, R.P. Thiel, R.L. Jurewicz, B.E. Kohn, and T.R. Van Deelen. 2009.
History, population growth, and management of wolves in Wisconsin. Pp. 87-105. in A.P. Wydeven, T.R. Van
Deelen, and E.J. Heske. Recovery of Gray Wolves in the Great Lakes Region of the United States: An Endangered
Species Success Story. Springer, New York, NY, USA. 350 pp.

Table 1a. Pack and lone wolf summaries for Wisconsin in winter 2011-2012.
Manage-ment Zone
# of Packs
# of Wolves in Packs Loners
Total # of Wolves
# of radio monitored Wolves
Average pack
territorya
(mi2)
1 Off Reservations 154 573-612 12 585-624 34
On Reservations 8 34-35 1 35-36 5
Total 162 607-647 13 620-660 39 48.5 N=37
2 Off Reservations 32 119-135 0 119-135 6
On Reservations 0 0 0 0 0
Total 32 119-135 0 119-135 6 33.8 N=6
3 Off Reservations 18 64-73 5 69-78 2
On Reservations 1 5 1 6 1
Total 19 69-78 6 75-84 3 17.3 N=2
4 Off Reservations 0 0 1 1 0
On Reservations 0 0 0 0 0
Total 0 0 1 1 0 -
Statewide Off Reservations 204 756-820 18 774-838 42
On Reservations 9 39-40 2 41-42 6
Total 213 795-860 20 815-880 48 45.2 N=45
Outside WI
1 3 1 4 0 -
aPack territory size is only calculated for packs with ≥20 radiolocations for the period 15 April 2011 to 14
April 2012.

Table 1b. Pack and lone wolf summaries for Wisconsin in winter 2012-2013.
Harvest Zone
# of Packs
# of Wolves in Packs Loners
Total # of
Wolves
# of radio monitored
Wolves
Average annual pack
territorya
(mi2)
Off Reservations 83 323-338 3 326-341 29
1 On Reservations 4 15 0 15 2
Total 87 338-353 3 341-356 31
45.7 (n=20)
Off Reservations 39 149-150 4 153-154 9
2 On Reservations 5 15 0 15 4
Total 44 164-165 4 168-169 13
54.3 (n=10)
Off Reservations 31 102-105 2 104-107 5
3 On Reservations 0 0 0 0 0
Total 31 102-105 2 104-107 5
35.1 (n=5)
Off Reservations 7 24 1 25 1
4 On Reservations 0 0 0 0 0
Total 7 24 1 25 1 -
Off Reservations 35 138-144 0 138-144 12
5 On Reservations 0 0 0 0 0
Total 35 138-144 0 138-144 12
18.3 (n=5)
Off Reservations 10 28 5 33 1
6 On Reservations 0 0 0 0 0
Total 10 28 5 33 1 -
Off Reservations 205 764-789 15 779-804 57
Statewide On Reservations 9 30 0 30 6
Total 214 794-819 15 809-834 63
43.1 (n=40)
Outside WI
2 6 3 9 -
a Pack territory size is only calculated for packs with ≥20 radiolocations for the period 15 April 2012 to 14
April 2013

Table 2a. Wolf mortality in Wisconsin 27 January 2012 to 14 April 2012.
Cause of Death Wolf Harvest Zones State
% of Total 1 2 3 4 5 6 Total
Human Caused Mortality
Agency Control 6 5 11
Landowner Control 1 1
Total Depredation Control 7 5 12 60%
Vehicle collision 1 2a
1 1 5 25%
Illegally killed 1 2 3 15%
Capture related 0
Unknown human caused 0
Total human caused 9 0 7 0 1 3 20 100%
Natural Mortality
Disease / Injury 0
Intra-specific aggression 0
Euthanized (non-control) 0
Unknown natural causes 0
Total natural causes 0 0 0 0 0 0 0
Unknown causes 0 0 0 0 0 0 0
Total Mortality 9 0 7 0 1 3 20 aIncludes 1 radio collared wolf not currently being monitored
Table 2b. Wolf mortality in Wisconsin 15 April 2012 to 14 April 2013.
Cause of Death Wolf Harvest Zones State
% of Total 1 2 3 4 5 6 Total
Human Caused Mortality
Agency Control 20a
22 4 46
Landowner Control 11b
2 1 4a
18
Total Depredation Control 31 24 1 8 64 28%
Harvested 32c
19 19 5 23a
19 117 51%
Vehicle collision 3c
6 1 1a
4 7 22 10%
Illegally killed 7c
2a
5a
1 4b
2 21 9%
Capture related 0
Unknown human caused 0
Total human caused 73 27 49 7 32 36 224 97%
Natural Mortality
Disease / Injury 0
Intra-specific aggression 1a
1 <1%
Euthanized (non-control) 0
Unknown natural causes 1a
1 <1%
Total natural causes 1 0 1 0 0 0 2 1%
Unknown causes 0 2 0 0 2 0 4 2%
Total Mortality 74 29 50 7 34 36 230 aIncludes 1 radio collared wolf
bIncludes 2 radio collared wolves
cIncludes 3 radio collared wolves
21 radio collared wolf mortalities

Table 2c. Wolf mortality in Wisconsin 15 April 2013 to 30 June 2013.
Cause of Death Wolf Harvest Zones State % of Total
Known Mortality
1 2 3 4 5 6 Total
Human Caused Mortality
Agency Control 2 4 6
Landowner Control 1 1 2
Total Depredation Control 3 1 4 8 57%
Vehicle collision 1 1 1 2 5 36%
Illegally killed
1 1 7%
Capture related
Unknown human caused
Total human caused 4 2 5 0 0 3 14 100%
Natural Mortality
Disease / Injury
Intra-specific aggression
Euthanized (non-control)
Unknown natural causes
Total natural causes 0 0 0 0 0 0 0 0%
Unknown causes 2 0 0 0 0 1a
3
Total Mortality 6 2 5 0 0 4 17 aIncludes 1 radio collared wolf
1 radio collared wolf mortality

Table 3. Wolf research captures (all captured wolves were fitted with radio telemetry collars) and detection of ectoparasites in captured wolves and non-harvest mortalities in Wisconsin from 27 January 2012 to 14 April 2013. Number with mange indicates symptoms consistent with mange, not positive diagnosis.
Sex Age # Avg. Weight # (%) w/Mange # (%) w/Ticks
ZONE 1 Research Captures
F A 5 75.8 (n=4) 0 3 F Y 2 64.5 (n=2) 0 1 M A 3 70.0 (n=2) 0 3 M Y 1 50.0 (n=1) 0 1
Zone 1 capture totals
11 captures 0 8 (73%)
Zone 1 mort. w/mange
51 Non-harvest mortalities
8 (16%)
ZONE 2 Research Captures
F A 3 68.5 (n=2) 0 3 (light) M A 2 87.5 (n=2) 1 1 (light)
Zone 2 capture totals
5 captures 1 (20%) 4 (80%)
Zone 2 mort. w/mange
10 Non-harvest mortalities
0
ZONE 3 Zone 3 mort.
w/mange 38
Non-harvest mortalities
5 (13%)
ZONE 4 Zone 4 mort.
w/mange 2
Non-harvest mortalities
0
ZONE 5 Research Captures
F A 4 72.2 (n=4) 0 1 (moderate) F Y 1 60.0 (n=1) 0 1 M A 4 86.0 (n=4) 1 1
Zone 5 capture totals
9 captures 1 (11%) 3 (33%)
Zone 5 mort. w/mange
12 Non-harvest mortalities
0
ZONE 6 Zone 6 mort.
w/mange 20
Non-harvest mortalities
0
STATEWIDE AVERAGES 25 Research captures 2 (8.0%) 15 (60%) 133 Non-harvest mortalities 13 (9.8%)

Table 4. Probable and possible wolf observations reported by natural resource agency personnel and private citizens in Wisconsin, 15 April 2012 to 14 April 2013.
Zone Number of Sightings
Wolves Seen
Track or Sign Observations
Total Wolf Observations
1 29 69 15 44
2 52 98 9 61
3 12 19 5 17
4 13 20 2 15
5 32 68 9 41
6 88 116 10 98
Statewide 226 390 50 276
Table 5: Age of wolves harvested in 2012 by harvest unit. Age data obtained through analysis of cementum annuli.
Table 6: Age of wolves harvested in 2012 by sex. Age data obtained through analysis of cementum annuli.
sex 0 1 2 3 4 5 6 7 8 9 total
M 32 17 15 2 2
1 69
F 20 11 3
1
1
1 37
unit 0 1 2 3 4 5 6 7 8 9 total
1 11 9 6 1 1 28
2 6 4 4 14
3 10 4 1 1 1 17
4 2 1 1 1 5
5 13 6 2 1 22
6 9 1 5 1 16
uk 1 1 2
total 52 26 18 2 3 0 1 0 0 2 104
% 50.00% 25.00% 17.31% 1.92% 2.88% 0.00% 0.96% 0.00% 0.00% 1.92%

Table 7a. Wolf depredation management in Wisconsin, 27 January 2012 to 14 April 2012. Wolf Harvest Zones STATE
1 2 3 4 5 6 TOTAL
Livestock cases
Depredation 8 1 9
Calves killed/ injured 5 1 6
Deer 1 1
Goats 2 2
Threat 3 1 1 5
Chronic farms affected 4 1 5 of 35 (14%)
Total Farms affected 9 1 1 1 12
Non-livestock cases
Depredation
1 1
Dogs killed/ injured while actively engaged in hunting activities
0
Dogs killed/ injured while not engaged in hunting activities
1 1
Threat 4 1 1 1 7
Control Actions
Wolves euthanized for control 6 5 11
Wolves killed on permit or in the act 1 1
Total Wolves killed for control 7 5 12
Shooting permits issued for control 48 2 10 2 7 10 79
Table 7b. Wolf depredation management in Wisconsin, 15 April 2012 to 14 April 2013. Wolf Harvest Zones STATE
1 2 3 4 5 6 TOTAL
Livestock cases
Depredation 22 3 17 2 4 48
Threat 10 2 1 1 1 15
Chronic farms affected 9 3 12 of 39 (31%)
Total Farms affected 23 5 7 3 5 43
Calves killed/ injured 18 / 2 3 18 3 5 / 1 47 / 3
Lambs 1 1
Goats 1 1
Chickens 9 1
Non-livestock cases
Depredation
5 2 1 8
Threat 2 4 1 7
Dogs killed/ injured while actively engaged in hunting activities
3 2 / 1 1 6 / 1
Dogs killed/ injured while not engaged in hunting activities
2 2
Control Actions
Wolves euthanized for control 20 22 4 46
Wolves killed on permit or in the act 11 2 1 4 18
Total Wolves killed for control 31 24 1 8 64
Shooting permits issued for controla
72 8 12 2 16 17 127 aNumber does not include reissue of permits to individuals who had a permit earlier during the monitoring period.

Table 7c. Wolf depredation management in Wisconsin, 15 April 2013 to 30 June 2013. Wolf Harvest Zones STATE
1 2 3 4 5 6 TOTAL
Livestock cases
Depredation 4 2 3 9
Calves killed/ injured 4 3 3 10
Threat 1 1 2
Chronic farms affected 4 1 0 5
Total Farms affected 5 3 3 11
Non-livestock cases
Depredation
1 1
Threat 1 1
Dogs killed/ injured while actively engaged in hunting activities
0
Dogs killed/ injured while not engaged in hunting activities
1 1
Control Actions
Wolves euthanized for control 2 4 6
Wolves killed on permit or in the act 1 1 2
Total Wolves killed for control 3 1 4 8
Shooting permits issued for controla
16 3 4 2 4 29 aNumber does not include reissue of permits to individuals who had a permit earlier during the monitoring period.
Table 8. Wolf harvest in 2012.
Zone
2011-2012 off-reservation
population mid-point
% Harvest
Goal Total Quota
Tribal Quota
State Quota
# Harvested
Days Open to Harvest
1 329.5 20% 65 33 32 32 49
2 171.5 20% 35 15 20 19 33
3 93 40% 37 19 18 19 70
4 26 40% 10 5 5 5 33
5 145.5 20% 25 2 23 23 58
6 37.5 75% 29 11 18 19 60
Statewide 803 25% 201 85 116 117 70
Table 9. Summary of law enforcement activity 1/1/12-6/30/13
# of Wolf Hunting related complaints received: 16
# of Wolf Trapping related complaints received: 12
# of Wolf related Investigations conducted: 35
# of Social Media Wolf related complaints/calls received: 34
# of Hunting related citations issued: 5
# of Trapping related citations issued: 10
# of Verbal Warnings Issued: 11
# of incidentally trapped wolves recovered: 4
# of Illegally harvested wolves recovered: 16
# of shot & unrecovered wolves found: 2
# of Unknown cause of death wolves found: 4
# of Other dead/injured wolves recovered: (car-kills, etc.) 12

Table 10. White-tailed deer density estimate in wolf harvest zones in 2012.
Wolf Harvest Zone
# of DMUs
Deer Range (mi2)
Deer Density Goal
(Deer/mi2)
Post-hunt deer density
(Deer/mi2)
1 16 5,953 18.1 20.1
2 15 5,264 20.3 18.7
3 10 3,435 22.2 29.4
4 6 1,830 21.5 32.2
5 6 2,492 25.7 31.5
6 66 17,099 23.5 48.3
TOTAL 119 36,073 22.1 35.6
Based on data on deer population estimates in Robert Rolley, 2013, Final Sex-Age-Kill 2012 Deer Population
Estimates, Harvest data update Feb. 15, 2013, unpublished.

Figure 1. Gray Wolf Distribution in Wisconsin: Winter 2012-2013

Figure 2. Changes in Wisconsin Gray Wolf Population: 1980-2013.
25 20 23 19 18 14 15 18 26 31 34 39 45 40 54
83 99
148 178
204
248 257
327 335
373
435
467
546 549
637
704
782
815 809
19
80
'81
'82
'83
'84
'85
'86
'87
'88
'89
19
90
'91
'92
'93
'94
'95
'96
'97
'98
'99
20
00
'01
'02
'03
'04
'05
'06
'07
'08
'09
20
10
11
12
13
Wolves
Packs
214

17
Figure 3. Verified, probable and possible wolf observation reports, 15 April 2012 to 14 April 2013.

18
Figure 4. 2012 Wolf harvest and control mortalities.