greasing the wheels of rural transformation? margarine …ehes.org/ehes_no43.pdf · ... eoin...
TRANSCRIPT
European
Historical
Economics
Society
EHES WORKING PAPERS IN ECONOMIC HISTORY | NO. 43
Greasing the Wheels of Rural Transformation? Margarine and
the Competition for the British Butter Market
Markus Lampe
Universidad Carlos III Madrid
Paul Sharp
University of Southern Denmark
JULY 2013
EHES Working Paper | No. 43 | July 2013
Greasing the Wheels of Rural Transformation? Margarine and
the Competition for the British Butter Market
Markus Lampe*
Universidad Carlos III Madrid
Paul Sharp**
University of Southern Denmark
Abstract We consider an example of the impact of a new good on producers of close substitutes: the
invention of margarine and its rapid introduction into the British market from the mid-1870s.
This presented a challenge to the traditional suppliers of that market, butter producers from
different European countries. We argue that the capacity to react quickly to the appearance of
this cheap substitute by improving quality and establishing product differentiation was critical
for the fortunes of butter producers. We illustrate this by discussing the different reactions to
margarine and quality upgrading in Ireland, Denmark and the Netherlands. A statistical
analysis using monthly data for Britain from 1881-87 confirms that margarine had a greater
impact on the price of poor quality butter than that of high quality butter, presumably because
it was a stronger substitute.
JEL Codes: L66, N53, O31
Keywords: Butter, margarine, dairies, new products, quality changes
Notice
The material presented in the EHES Working Paper Series is property of the author(s) and should be quoted as such.
The views expressed in this Paper are those of the author(s) and do not necessarily represent the views of the EHES or
its members
Acknowledgements: We would like to thank Mette Ejrnæs, Eva Fernández, Ingrid Henriksen, David Higgins, Brooks Kaiser, Jan Tore
Klovland, Michael Kopsidis, Eoin McLaughlin, Christopher Meissner, Kevin H. O’Rourke, Karl Gunnar
Persson, Ramon Ramon, and participants at seminars and conferences for helpful advice, data, comments and
suggestions. We would especially like to thank Andreea-Alexandra Maerean for very conscientious research
assistance. Markus Lampe also thanks the Spanish Ministry of Science and Innovation (project ECO2011-
25713).
* Paul Sharp, University of Southern Denmar, E-mail: [email protected] ** Markus Lampe, Universidad Carlos III Madrid, E-mail: [email protected]

2
I
At the intersection of industrial organization and international trade, the Economics of New
Goods is one of the liveliest fields of study in economics (see Breshanan and Gordon (eds.
1997)), and has largely focused on the effects of new consumption possibilities on consumer
welfare and behaviour2. It is also a central topic in economic history through the idea of an
‘Industrious Revolution’, as the consequence of a desire to purchase new goods (De Vries 2008,
Hersh and Voth 2009/11). What, however, seems to have been completely neglected is the
impact of new goods on established producers. This study aims to be a first step in rectifying
this omission through an investigation of the impact of the invention of margarine in 1869 on
major butter producers. Our approach is in part motivated by a series of recent studies in the
field of industrial organization which investigate the effects of new varieties on the prices of
existing goods and the profits of incumbent and new producers, following a pioneering study by
Hausman and Leonard (2002) on the introduction of the Kleenex Bath Tissue brand into the US
toilet paper market in the early 1990s.
As a cheap new substitute for butter, margarine certainly had an impact far beyond that of any
new brand of toilet paper. Focussing on the British market, we demonstrate that apart from
increasing the supply of ‘spreads’3, and helping reverse a decade-long trend of increasing
relative and absolute prices of butter4, the new product also had a major effect on producers,
and played an important role for the transformation of an entire industry. Butter exporting
countries who met the challenge by increasing quality, most spectacularly Denmark,
2 There are two main themes. The first is more oriented towards macroeconomics, and aims at estimating the
additional consumer welfare from new products (the classical study is Hausman 1997; see also Hersh and Voth
2009/11). The second considers how to correct price indices to take account of these benefits (see Feenstra 1994
and Broda and Weinstein 2006).
3 We call them this for convenience, although of course they were for example also used for cooking and frying.
4 For the evolution of the relative prices of animal products versus grains in Britain see Henriksen, Lampe and
Sharp 2012, Figure 3, and also Donnelly 1971, p. 131-132.
3
maintained their position on the British markets. Those that failed, for example Ireland, lost
ground.
The reasons for the success of Denmark and the failure of Ireland have in fact been the subject
of a long-running debate within economic history (see for example O’Rourke 2006). Much of
this relates to the revolutionary changes in Danish agriculture between 1860 and 1890: first,
with the emergence of factory creameries for centralizing butter production in the 1870s (Bjørn
1977), and then with the birth of the hugely successful cooperative creameries in the 1880s
(Henriksen 1992, Henriksen et al 2011). While it might be impossible to fully assess the role of
margarine in this process, we argue that its relative impact on butter prices acted as a catalyst,
accelerating the need to transform traditional structures. The speed and depth of this
adaptation then affected the relative position of the butter producers and with them important
parts of their respective economies.
To give some perspective to the importance of this industry for producing countries, in 1880-
84, milk and milk products accounted for about 27.5 per cent of Danish agricultural production
and about 11.4 per cent of GDP5. Exports of butter were 3.4 per cent of Danish GDP in the same
period, excluding an equal share of by-products like bacon as well as live cattle (Bjerke and
Ussing 1958, pp. 128, 146; Hansen 1984, p. 234, 246, Henriksen, Lampe and Sharp 2012). This
share was increasing rapidly to about 9 per cent in 1900 (Henriksen et al 2011, p. 490). In
Ireland, butter production represented 18.7 per cent of agricultural production in 1880
(O’Rourke 2006) and butter exports represented about 3.1 per cent of GDP in 1881, but their
importance was rather declining over time to about 2.1 per cent in 1901.6
From the British side, it is well known that butter was a major source of calories for workers,
increasing from around 3.3 per cent of total caloric intake per person in 1863, to around 5.8 per
5 These figures do not include by-products from pig-feeding, hides, skins, etc.
6 We arrived at these figures by multiplying the quantity of butter exports from Solar (1990, p. 159-160) with the
average of Kennedy and Solar’s (2007) prices for Irish butter (North/South), dividing them by Geary and Stark’s
(2002) GDP estimate for Ireland, transformed into current prices by Crafts (2005).

4
cent in 1889-90.7 Moreover, since fats are luxury proteins, the dietary importance and the
importance as a share of income must have exceeded this.
Below, we discuss the reactions of the main butter exporters to the invention of margarine, in
particular through improvements in quality. We demonstrate that the prices of poorer qualities
of butter were impacted on more greatly than that of better quality produce using a simple
econometric analysis of the prices, and we attribute this to the fall in demand for low quality
butter, as consumers substituted it for margarine. Finally, we turn briefly to the political and
legislative reaction to this. Before this, however, we first look at the introduction of margarine,
and its effects on the British market for spreads.
II
Margarine was initially produced from purified beef suet or caul fat of beef known as ‘oleo’,
flavouring, and colouring (Schrover 1990, p. 56; Miller 1989, pp. 101-102). It was invented in
1869 by the French chemist Hippolyte Mège-Mouriès, responding to a prize offered by
Napoleon III. He called his new butter substitute oleo-margarine,8 patented his invention in
1869, and then sold it to the Dutch company Jurgens (now part of Unilever) in 1871. The threat
to butter producers was immediately apparent. When coloured, it was a very close substitute
for butter, but could be produced at a fraction of the cost. Moreover, it was commonly mixed
with butter itself to become ‘butterine’. This was a good imitation of middle quality butter, and
7 According to Clark et al (1995, p. 223), poor working families consumed 9.1 pounds of butter per year in 1863,
while in 1889/90 members of families of textile workers consumed on average 19.5 pounds and those of metal
workers 24.5 pounds. The latter numbers seem to include a part of the cheese consumed, so we deduct 7.5 lbs
from each number, arriving at an average of 14.5 lbs per person. At a nutritional value of 7170 kcal per kg of
butter, the 1863 value is equivalent to 29600 kcal or 3.3 per cent of total caloric intake per person, and the 1889-
90 estimate to 47150 kcal or 5.8 per cent of annual caloric intake.
8 Snodgrass (1930), pp. 122-123; Hoffmann (1969), pp. 9-13.

5
indeed, before the introduction of legislation requiring it to be labelled otherwise (see Section
V), was usually exported and sold as such.9
Although the first joint stock company for production of margarine in the UK was registered on
26 May 187510 (BPP 1875), much margarine was imported and, as Figure 1 demonstrates, it
rapidly conquered an important share of the British import market, and much went to satisfy
the demand from the rapidly expanding industrial cities of the North of England (see for
example Drejer 1943), once it was ready for large-scale production.
[Figure 1 about here]
A large proportion of the imported margarine came from the Netherlands, where Jurgens and
Van den Bergh, competing butter merchants based in Oss, a town with a significant inland port
in Northern Brabant, had started to produce margarine in 1871 (Schrover 1990). Figure 2 shows
the boom in production of margarine in the Netherlands.
[Figure 2 about here]
Since oleomargarine was produced largely from beef, it was in part a by-product of dairying.
However, dairy producers in Europe did not gain from this, since it was largely supplied by
9 Subsequently, porcine lard was also used for margarine production, but the use of vegetable oils was very limited
before the development of fat hardening processes in 1902 (see Snodgrass 1930, pp. 138-141; Hoffmann 1969, p.
16).
10 Company registered for ‘The manufacture of margarine, stearine, or other fatty substances on premises lately
belonging to the Continental and Shipping Butter Company (Limited)’.
6
producers in the US, particularly New York and Chicago. Although the margarine produced
there was mostly consumed on the domestic market, the ingredient oleo was mostly exported
to the Netherlands, from which it was re-exported as margarine (see for example ‘Mælkeribrev
fra Amerika’, Ugeskrift for Landmænd 1880, 5:9, pp. 563-56611). As manufacturing processes
improved, and the quantity produced increased, the price of margarine fell rapidly compared to
the general price level in the late nineteenth century, as shown in Figure 3, thus making it a
more and more serious competitor to butter.
[Figure 3 about here]
The ways in which the main competitors for the British market reacted to this challenge were to
shape their relative fortunes for the next few decades. While the quantity of spreads imported
into Great Britain more than doubled between 1865 and 1890, from around 1.75 million to over
3.5 million cwt.,12 only about half that increase consisted of ‘butterine’, which by 1890 made up
around 30 per cent of the imports of spreads. The remainder was butter, for which the market
shares of the different supplying countries shifted remarkably. We argue that the
corresponding changes in the fortunes of butter producers were related to the rise of
margarine, whose role as a competitor to and substitute for butter had a far from uniform
impact on butter exporters. As Figure 1 demonstrates, the market share for some countries,
particularly Denmark, expanded rapidly, from 3.8 per cent of the market for butter to 31.7 per
cent, corresponding to 22.4 per cent of the market for spreads. The losers were in particular
Ireland, whose share shrank from 37.8 per cent in 1865 to just 22 per cent of butter and 15 per
11 The Danish journal Ugeskrift for Landmænd in the 1870s and 1880s, while clearly noting in various reports the
presence of and danger presented by margarine, is especially concerned with the production in the US, and notes
that the reputation of American butter producers was suffering due to this.
12 See also O’Rourke (2006), p. 169. At the same time, the population of Great Britain ‘only’ increased by about a
quarter (Maddison 2007).
7
cent of spreads imports. In fact, the amount of butter exported from Ireland in 1890 was some
13 per cent below the 1865 level. The Netherlands also saw a large fall in relative and absolute
terms, but this was more than made up for by her exports of margarine, which dominated that
market.13
III
To understand the differing fortunes of butter exporters, we focus here on three large suppliers
to the British market in the 1880s: Denmark, Ireland, and the Netherlands. We mostly ignore
the case of France. Although already in 1870 fresh, lightly salted butter from Normandy had
completely ousted the otherwise dominant Irish competitor in London (Donnelly 1971), this
was a different product to the butter that otherwise dominated the market, and it was to be far
less affected by the rise of margarine than the standard butter types.14 In fact, the solution to
the competition from margarine was to differentiate from it as much as possible.
Ireland was the traditional supplier of butter to Britain, as is apparent from Figure 1. In all years
before 1860, Irish producers had supplied more than 50 per cent of British butter imports;
subsequently, they failed to increase butter exports in absolute terms despite an expanding
market. Many explanations have been given for the failure of the Irish butter industry at the
end of the nineteenth century, particularly in comparison with the Danish example (see for
example Ó Gráda 1977 and O’Rourke 2006, 2007). One side of this was a signal failure to
increase quality. In fact, not only could Irish producers not compete with Danish butter in terms
of quality, but neither could they compete with margarine in terms of price. Quantifying this
13 Nevertheless, within the Netherlands, butter and margarine producers were not closely related and actually
located in different areas, as mentioned below.
14 Moreover, there was a clear tendency on the British market towards quality premia for fresher and lighter salted
foods at least since the 1870s, also for products such as milk (normally British supplied, but also from Normandy),
cream, pork or beef (French and Philips 2000, pp. 96-97). However, fresh butter required a wealthy local market,
and was thus not a viable alternative for most producers.

8
failure to increase average quality is unfortunately not easy, although the figures in Table 1
might be indicative. Here we show the quality distribution of the different classes of butter
traded via the Cork Butter Market in 1877-78, in October 1881 and in October 1883, the only
quantity data we could get hold of.
Table 1: Volumes of various qualities of the butter traded on the Cork Butter Market
1877-78 Oct 28, 1881 Oct 2, 1883
Class Firkins % Firkins % Firkins % 1st 135044 31.1 897 40.6 302 43.6 2nd 181608 41.8 989 44.8 122 17.6 3rd 102961 23.7 294 13.3 77 11.1 4th 13537 3.1 25 1.1 12 1.7 5th 1153 0.3 3 0.1 0 0.0
6th15 55 0.0 0 0.0 0 0.0 Superfine 124 17.9 Fine mild 50 7.2
Mild 5 0.7 Sources: Sheldon (1886), 359; Freeman's Journal and Daily Commercial Advertiser, “The Irish Butter
Manufacture. To the Editor of the Freeman,” 4 November 1881; Cork City and County Archive Website, “Butter
Inspection Slip, 1883”,
http://www.corkarchives.ie/merchantcity/home/provisionstrade/butterinspectionslip1883/.
According to O’Donovan (1940, pp. 311-312) only the first three qualities were actually fit for
human consumption, and we see the others were of tiny and declining importance. Among the 15 The worst quality butter on the Cork Market was also known as a ‘bishop’, the reason for which is unclear. C.B.
Gibson (1861, p. 379) recounts an episode illustrating unintended consequences of this:
Bishop Brinkley, of Cloyne, wandered one morning into the Cork Butter Market, and inquired of one of the porters,
to whom he was unknown, respecting the various classes of butter. “What do you call the best?” inquired Brinkley.
“The first quality, your honor.” “And the worst?” “The worst, your honor, is a bishop.” “A bishop,” said Brinkley, in
surprise. “Now, may I ask you, my good fellow, why you call the worst a bishop?” “Bekase, your honor, a bishop is
the very worst quality.” “I see,” said Brinkley, walking off.
9
better qualities, we see a clear shift from lower to higher qualities in a very short period of
time. Furthermore, for the 1880s, we find mentions of Cork 3rds in British Newspapers mostly in
the context of purchases for hospitals, workhouses, etc., and not so much for the regular
market. It seems that due to the large amount of salt in them they were both durable and at
the lower bound of being edible.16 For 4th quality butter, the Freeman's Journal and Daily
Commercial Advertiser reported on May 6, 1880 on a lecture by Rev. Canon Bagot, who had
actually compared a similar quality in a butter shop in Dublin to what he called ‘bosh’ – the
description of which is similar to that of butterine – finding that the first was inedible and the
second not, although both commanded similar prices.17
Weighing the quantities reported in Table 1 by their prices, it can be seen that the average
quality is increasing from 87 to 95 per cent of the price of Cork 1sts between 1877-78 and
October 1881. In addition to this, the author of our source for the 1881 data recounts that
there were also fine and superfine qualities traded in Cork, although not in large quantities. For
October 1883, we can quantify this, and see that the average quality is now, including the
milder, less salty varieties of superfine, fine mild and mild, 99.5 per cent of Cork 1st and 92.5 per
cent of Cork superfine prices. The fact that superfine quality accounts for 17.9 per cent of all
firkins, and another 43.6 per cent are Cork 1sts, can be compared to Danish butter (which we
discuss in detail below), of which the quality sold in London according to the author of our 1881
data source was actually “uniformly ‘superfine’”. So, despite the quality improvement, Irish
butter still lagged considerably behind its Danish counterpart. We can show this by comparing
the average quality of Irish butter to that of Danish butter on the London Provision Market.
According to this, in October 1881 the average Irish butter price for the varieties given in Table
1 was 74 per cent of the Danish top price, two years later, and including superfine varieties, it
16 See the Bristol Mercury and Daily Post, 3 October 1888; Preston Guardian, 28 March 1885; see also BPP (1881,
C.2778, p. 360-62) and BPP (1881, C.3096, pp. 57, 67), both reporting evidence collected by Her Majesty’s
Commissioners on Agriculture.
17 Freeman's Journal and Daily Commercial Advertiser, “Canon Bagot on Butter-Making. (From our Reporter),”
Dublin, 8 May 1880.
10
was 75 per cent of the best Danish price, so that, despite improvements in the average quality
of Cork butter no ground was won in comparison to Danish butter. As a reference for
comparison, for the whole of 1881 the average unit value of Danish butter imported into Britain
reported in British trade statistics was 86 per cent of the average quotation of best Danish
butter on the London provision market; this increased rapidly to 94 per cent in 1882 and
1883.18 In short, Danish style improvements proved difficult to implement in Ireland, both
regarding innovations in production and in marketing (see Donnelly 1971, p. 154-162, for the
important Cork butter market), with the result that the average quality of the Irish product mix
responded much slower to the new challenges and therefore in the 1880s and 1890s remained
clearly below that of Denmark (O’Rourke 2006; Higgins and Mordhorst 2008, p. 100).
Another exporter of historical significance was the Netherlands. Until the 1870s, Dutch butter
enjoyed a good reputation on the British market. However, as the demand for butter increased,
so too did the incentives for the individual farmer to tamper with it, in order to free ride on the
good reputation of the others, in later years particularly by mixing it with margarine. The
upshot of this was that as other countries started entering the market with good quality
products, the reputation of Dutch produce began to suffer, and this was quickly reflected in the
prices received. On the Leeuwarden market, the price of butter dropped by 21 per cent from 57
guilders per vierendeel19 in 1871/80 to 45 guilders in 1886/95 (Bieleman 1996, p. 27; see also
Van Stuyvenberg 1969, pp. 297-298, and Higgins and Mordhorst 2008, pp. 194-195). On the
London market, prices for best Friesland butter fell by 21.4 per cent between 1881 and 1886/7
(see Table 4 below), although they recovered somewhat subsequently.
The problems of Dutch butter producers went far beyond the price fall, however, which was in
fact a general phenomenon for butter producers as the supply expanded, since they also rapidly
18 For 1877-78, the comparison is more difficult, since for the autumn of 1877 we lack price quotations of Danish
butter in London. In December 1877 and June 1878, the highest quotation for Danish exceeded Cork 1sts by
around 15 per cent, which implies that the average Irish butter price was again around 76 per cent of best Danish.
19 1 vierendeel = 0.787 cwt = 40kg.

11
lost market share during the 1880s, in particular to Danish producers.20 Eventually, the sort of
innovations that the Danish introduced in the early 1880s, in particular cooperative creameries,
were introduced in the Netherlands, but only with a long lag – although the first cooperative
creamery in the Netherlands was founded in 1886, they only became prevalent in Friesland in
the 1890s (Bieleman 1996, p. 28). In other regions less associated traditionally with butter
exports, farmers attempted to apply new techniques in order to escape the declining prices, but
were frustrated by inadequate distribution networks (Bieleman 1996, p. 31).
The country which benefited most from the collapse of the market share of the Dutch and Irish
butter producers was Denmark. In fact, Denmark had a long tradition of exporting its finest
quality butter to Britain, although it took some time before direct trading routes were
established. Early attempts at export came with government supported attempts in the 1850s
to establish a steamship route from northern Jutland with Dampskibet Jylland, although this
only lasted from 1851-55 (Drejer 1925-33, pp. 312-4). During the 1860s high quality Danish
‘estate butter’ made its name on the British market (Thomsen et al 1966, p. 134). It was usually
exported via Hamburg and marked ‘Kiel’ or ‘Hamburg’, and sold with Schleswig and Holstein
butter on the English market as ‘Kieler-butter’ (Thomsen et al 1966, p. 169). This continued
until the Second Schleswig War of 1864, in which Denmark lost the Duchies of Schleswig and
Holstein to Prussia. Alternative export points were then sought, ending finally in the opening of
Esbjerg harbour in 1874, at which point regular steamships left for the UK. Danish butter rapidly
earned the preference of the British consumers. By 1872 Danish export butter commanded
higher prices than Irish, by 1878 higher than Dutch, and in 1879 it was declared the finest in the
world at an exhibition in London (Thomsen et al 1966, p. 145). Reflecting this, Danish butter
received the highest prices in Britain, with the exception sometimes of the aforementioned
fresh unsalted butter from Normandy (Faber 1893, 1901).
20 See Table 5 below: between 1881 to 1886 British butter imports from the Netherlands declined by 13.4 per cent
per year.

12
However, while estate butter enjoyed export success in the UK, its peasant-produced
counterpart did not, reflecting perhaps an example of the ‘Washington apples’ effect.21 Peasant
butter was routinely sold at a heavy discount compared to its competitor from the large estates
(Faber 1918, Drejer 1925-33). Attempts to improve the quality of peasant butter are already
apparent from the 1870s with the take-off of private creameries (Bjørn 1977). But its fortune
was only truly reversed with the invention of the automatic cream separator in 1878 and soon
after the cooperative form of production, and from this point peasant butter started to be
exported in a big way (Henriksen et al 2011). The price differential between estate and peasant
butter, which had been substantial, first narrowed and then disappeared (Thomsen et al 1966,
p. 144).22 Figure 4 illustrates the increase in the quality of Danish butter using the ratio
between the average and best prices reported. Poorer qualities of butter completely
disappeared during the 1890s, and were replaced by imported butter for baking and margarine
for household use (Bjørn 1982, p. 124).
[Figure 4 about here]
We cannot say with any great certainty that margarine provided the incentive for Danish butter
producers to increase the quality of their produce, although the increase from the late 1870s is
particularly notable. The lively Danish agricultural press23 reported frequently on developments
21 The ‘Washington Apples’ effect, also known as ‘Alchian-Allen conjecture’, states that because of fixed per unit
transport costs the composition of varieties of the same good in export markets (e.g., Indiana for apples in the US)
is biased towards high-quality varieties in comparison to the producer markets (Washington, in this example). See
Alchian and Allen (1964), Bauman (2004), Hummels and Skiba (2004).
22 Eventually estate butter suffered the same fate as its peasant counterpart, as the quantity and quality of
cooperative produced butter increased, it too suffered from being available in too small quantities of unreliable
quality after around 1900 (Faber 1918, p. 44).
23 Which comprised two and from the 1880s three agricultural periodicals.

13
abroad, and was clearly concerned with the potential impact of margarine, and writers
displayed an understanding of the steps necessary to preserve the good name of Danish
produce. For example, the prominent Danish agriculturalist, Edward Tesdorpf, noted in an
address to the Royal Agricultural Society of Denmark on 5 April 1882 that although margarine
had a negative impact on butter prices, the effect was less for top quality Danish produce
(Tesdorpf 1882, p. 193).
His is not the only contemporary account that provides some sense that margarine was one of
the more important factors giving an incentive to improve quality. One of the earliest mentions
comes from the United States, where a Committee of Congress in 1880 put forward the idea
that margarine might promote better quality butter, stating that ‘it will prevent the
manufacture of thousands of pounds of bad butter now made, and encourage the making of
first-class butter, and thus be a blessing to the dairymen, and that its price is essentially a
blessing to the poor.’ (BPP 1880, p. 445) In the context of the British market, although the usual
story is that Irish butter was outcompeted by high quality Danish produce (Donnelly 1971, Ó
Gráda 1977, Henriksen & O’Rourke 2005, O’Rourke 2006), many contemporaries believed that
it was in fact margarine which was responsible. For example, a report from a British
parliamentary select committee in 1885, declared that:
“As a matter of fact, Irish butter can only be sold now, with very great difficulty, in a few of the manufacturing districts of England, and the area of its consumption is becoming more limited every year. Its competition now is rather with the produce of the butterine factories, than with the butter shipped from France, Denmark, Germany, and Sweden. Butterine has realized a higher price in the English and Dublin markets for the past twelve months than secondary grades of Irish butter, and the bulk of Irish butter, unfortunately, is of secondary quality.” (BPP 1884-85, p. 728)
A further reference to bad quality butter being outcompeted by margarine is given in BPP
(1896, p. 278), and a negative angle is put on the story by McAlpine (1886, p. 17). Similar ideas
were expressed in the leading Danish agricultural journal, Tidsskrift for Landøkonomi:

14
“In earlier reports it has been suggested that the commoner butter qualities must sooner or later be outcompeted by the superior artificial butter production, which must necessarily take a large share of the market. The aforementioned annual report for the butter market in Newcastle confirms that this point in time has already been reached. The following statement in this summary of the year is revealing: ‘The lower grades of butter – previously sold under the name peasant butter – have disappeared from our market, and likewise it is extremely difficult to realize the prices, which were noted 8 to 10 years ago for best Danish quality, the reason being that the value of these goods is being checked and moderated by the finest qualities of artificial butter. In other words, artificial butter has become the factor, far more than the export of butter from other countries, that regulates the Danish market. After this, the report describes how Danish butter’s good reputation as the genuine non-blended article gives it a fortunate position when competing with artificial butter, while the butter production of other countries is already completely squeezed by artificial butter.’” (Sonne 1885, p. 63, our translation).
IV
So, by the early 1880s, the dominance of Danish butter on the British market was established,
both in terms of quality and quantity imported, a position that was maintained until the First
World War. Other countries, which were not so successful in differentiating their product from
margarine, lost market share. In order to quantify the role of margarine for this, we collected
high frequency price data for the rapid period of transformation in the 1880s. It is noticeable
that margarine was cheaper than any edible quality of butter, as Table 2 demonstrates.

15
Table 2: Average prices of butter and butterine 1881-1887
Shillings per cwt
Danish (Manchester) 134 Danish (London) 130 Kiel (Manchester) 128 Normandy (London) 125 Friesland (London) 117 Cork 1st 116 Cork 2nd 106 Cork 3rd 88 Butterine 79 Cork 4th 68 Cork 5th 53
Sources: See text.
Note: We calculate the annual average prices as calendar year means of the last monthly quotations for February,
April, June, August, October and December (cf. Klovland and Solar 2011). Cork 5th was not quoted after April 1886.
Our price data are monthly wholesale prices between January 1881 and June 1887. This period
is partly determined by the availability of margarine price data, but it also makes sense in other
ways. Before 1880, margarine only accounted for less than 10 per cent of imports of spreads,
while in 1881 that share had risen to an economically significant 17 per cent (see Figure 1).
Margarine imports and market shares continued to increase until 1887 (38 per cent), after
which they levelled off or even declined in relative terms, possibly due to an increasing
domestic production of margarine (which is difficult to measure) and some effect of the 1887
Margarine Act. The period 1880/81 to 1887 can thus be understood as the most violent and
unregulated phase of the ‘margarine invasion’, since the British 1887 Margarine Act entered
into force in 1888 only, while the Sale of Food and Drugs Act (SFDA) of 1875 was mostly aimed
at adulteration and fraud by retailers, not by producers or wholesale merchants, who
convinced legislators that adulteration originated mostly in retailing, not in previous stages of
16
production and distribution.24 So, while there must have been significant uncertainty among
consumers about whether butter was really butter, these information asymmetries should have
been much less important among the professional butter traders our price information comes
from. This, of course, will also make it more difficult for us to assess the impact on Dutch
butter, since best quality Friesland butter quoted on the London market probably escaped in
part from the uncertainties surrounding Dutch butter and margarine referred to above.
For butterine, our source is additional evidence handed in by Thomas Pearson, the manager of
the butter department of the Co-operative Wholesale Society of Manchester to the Select
Committee on the Butter Substitutes Bill (BPP 1887 (208), pp. 144-146). The Cooperative
Wholesale Society of Manchester was one of the biggest exporters of superior quality Irish
butter, shipping over £250,000 worth from Cork in 1882-83, almost 20 per cent of market
receipts (Donnelly 1971, p. 144). It was also a significant purchaser and re-seller of all other
kinds of import butter.25 Butterine accounted for only about 1 per cent of the volume of butter
sales of the company (BPP 1887 (208), p. 112), but the prices reported by Pearson are the only
high-frequency series we have been able to uncover for margarine in this early period. The data
we use also have the advantage of being consistent over time regarding quality. All prices he
reports refer to best quality butter and butterine, respectively. Apart from the butterine prices,
we also use the prices he reported for Danish and Kiel butter, which we label as ‘(Manchester)’.
In addition we use prices from the London Provisions Market for ‘Danish and Kiel’ (sometimes
also including Swedish), and Normandy, each time taking the month-end quotation for best
quality. For Danish and Friesland, this data was kindly provided by Jan Tore Klovland (see
Klovland 1993); for Normandy, we collected the data from British newspapers.26 From these
24 French and Philips (2000), pp. 37-38, interpret the SFDA 1875 as an example of business capture of regulation by
producers and wholesalers.
25 The minutes of evidence of the Select Committee record Pearson stating that his company was “the largest, I
suppose, in the world” when asked about their position as a butter purchaser (BPP 1887 (208), p. 112).
26 The “Commercial Intelligence” Section of the Manchester Times from 1881 to May 1885, the “Monetary and
Commercial/Money and Trade” section of the Bristol Mercury and Daily Post from June 1885 to December 1886
17
same sources we also collected the prices for Cork butter of 1st to 5th quality. Pearson also
reports prices for Cork butter from Ireland, but he does not report data for the winter months
(when markets were thin and only ‘stored’ butter was on the market), and moreover he only
gives prices for the top quality. The Cork prices we use, which involve occasional interpolations
for 1st and 5th quality in certain months27, in general move very similar to Pearson’s. A selection
of our data is given in Figure 5.
[Figure 5 about here]
Regarding research design and expectations, some studies which seem particularly related to
ours deal with the impact of private labels (or store brands) on the price and market share of
national brands. These generally find that this is accompanied by increasing prices for
competing national brands due to reactions like quality upgrading, product differentiation, and
retailers ‘targeting’ national brands by increasing their prices and placing competing store
brand items next to leading brands (Ward et al 2002, Bonfrer and Chintagunta 2004, Pauwels
and Srninvasan 2004, Bontemps et al 2005, Bontemps et al 2008).28 It seems likely that the
and the “Commercial Intelligence” section of the Freeman's Journal and Daily Commercial Advertiser (Dublin) from
January to July 1887.
27 The following prices were linearly interpolated due to missing observations: Kiel (Manchester): 1881:11,
1881:12; Cork 1st (Cork): 1882:01, 1882:02, 1883:01, 1883:02, 1884:01, 1884:02, 1884:03, 1885:01, 1885:02,
1885:03, 1886:01, 1886:02, 1887:01.
28 In the short run, however, when store brands were first introduced in the 1970s, they were ‘a cheap and nasty
generic substitute for the real thing’ (The Economist, “Make it your own”, 4 March 1995, p. 8, cited by Ward et al
(2002), note 2) and probably had a negative effect on both market share and the price of incumbent national
brands (see Ward et al 2002 and Putsis 1997). Similarly, Bergman and Rudholm (2003) find that the entry of
generics and potential competition lowered prices of branded pharmaceuticals in Sweden with data for 1972 to
1996.
18
introduction of margarine would have had similar effects: a negative effect on butter prices, but
an incentive to greater differentiation and improvements in quality for butter producers.
Using our prices, we thus seek to document more formally the differential impact of the
invention of margarine on the different butter producers. Ideally, we would like to examine
cross-price elasticities, and look for which varieties of butter were closest substitutes. Indeed,
contemporaries noted that periods of high butter prices were the ones where people
substituted to margarine (see for example Otto Mønsted 1933, p. 59 for the story in Denmark,
and Wiest 1916, pp. 206-8 who concludes the same for the United States)29. We do not,
however, have the consumption/production data we need30.
Thus, in order to test the hypothesis that poorer quality butter was affected to a greater extent
than better qualities by the arrival of margarine, we estimate simple multivariate error
correction models of various butter prices on the monthly wholesale margarine prices
described above, for the period January 1881 to June 1887. The elasticity of butter with respect
to margarine prices then gives an estimate of the responsiveness of the various qualities with
respect to the fall in margarine prices over this period. We can then compare the proportion of
the change in butter prices due to margarine out of the total observed change in prices. We
would expect this to be larger for poorer qualities if our hypothesis is correct.
Our econometric approach is inspired by the market integration literature (see for example
Ejrnæs and Persson 2000, 2010), and at the most basic level reflects the responsiveness of each
segment of the butter market to changes in the price of margarine, in this case its downward
trend over time. We stress here that an underlying assumption of this approach is that markets
were spatially integrated, so we are not testing for market integration in the usual sense. This
assumption, however, should not be problematic, as both evidence on the spatial integration of
29 Pioneers in investigating this relationship were Wiest (1916) and Pabst (1937) for the American market.
30 An obvious place to look seems to be the British trade statistics, but butterine/margarine was not separated
from butter until 1885.

19
the British market (see, e.g., Uebele 2011 for wheat) and the practice of quoting London, Cork
and other prices in daily newspapers all over the United Kingdom, shows.
We estimated the following vector error correction model by maximum likelihood using PcGive
1331:
�∆𝑝𝑡𝐵
∆𝑝𝑡𝑀� = �𝛼
𝐵
𝛼𝑀� (𝛽𝑝𝑡−1𝑀 − 𝜆) + �𝜀𝑡
𝐵
𝜀𝑡𝑀�
where 𝑝𝑡𝐵 and 𝑝𝑡𝑀 are the logarithms to the prices of butter and margarine respectively, 𝛼𝐵 and
𝛼𝑀 describe the speed of adjustment (error correction) to the cointegrating relationship
(1 − 𝛽𝑝𝑡−1𝑀 − 𝜆), 𝛽 gives the cointegrating relationship between the prices of butter and
margarine, and 𝜆 is a constant. The residuals 𝜀𝑡𝐵 and 𝜀𝑡𝑀 are assumed to be iid. normally
distributed (the misspecification tests are reported in the appendix). In each case we included
two lags and a full set of centred seasonal (monthly) dummies. The results are given in Table 3.
Here we have also reported the Johansen test for cointegration (H0: r=1), which always
suggested a rank of 1, i.e. one cointegrating vector, except in the case of (2), where we accept
the hypothesis that there was no cointegration (r=0).
31 Doornik, J.A. and D.F. Hendry (2009). PcGive 13. London: Timberlake Consultants Ltd.

20
Table 3: Error Correction Estimates for Butter Prices on Margarine Prices
HIGHER QUALITY
(1) (2) (3) (4)
Danish Danish32 Kiel Normandy
(Manchester) (London) (Manchester) (London)
∆P_B ∆P_M ∆P_B ∆P_M ∆P_B ∆P_M ∆P_B ∆P_M
α -0.78*** -0.05 -0.57+ 0.12+ -0.59*** 0.10 -0.56*** 0.23
(0.16) (0.19) (0.15) (0.12) (0.14) (0.15) (0.13) (0.15)
β -0.13*** -0.20+ -0.14* -0.23***
(0.05) (0.10) (0.08) (0.08)
Constant -4.43*** -4.11+ -4.33*** -3.85***
(0.24) (0.46) (0.34) (0.34)
Trend 0.00*** 0.00+ 0.00*** 0.00***
(0.00) (0.00) (0.00) (0.00) Seasonal dummies YES YES YES YES
Log-likelihood 288.89 259.19 280.08 287.29
H0: r=1 0.56 0.57 (r=0 accepted) 0.55 0.56
N 78 78 78 78
LOWER QUALITY
(5) (6) (7) (8)
Friesland Cork 1st Cork 2nd Cork 3rd
(London) (Cork) (Cork) (Cork)
∆P_B ∆P_M ∆P_B ∆P_M ∆P_B ∆P_M ∆P_B ∆P_M
α -0.61*** 0.15*** -0.54*** 0.21*** -0.35*** 0.28*** -0.30*** 0.18***
(0.13) (0.07) (0.14) (0.09) (0.13) (0.06) (0.11) (0.04)
β -0.38*** -0.40*** -0.48*** -0.47***
(0.14) (0.12) (0.13) (0.20) H0: β = 0.13
(t-value) 1.79 (*) 2.25 (**) 2.69 (***) 1.7 (*)
Constant -3.18*** -3.09*** -2.64*** -2.53***
(0.62) (0.54) (0.60) (0.92)
Trend 0.00*** 0.00*** 0.00*** 0.00***
(0.00) (0.00) (0.00) (0.00) Seasonal dummies YES YES YES YES
Log-likelihood 235.12 244.48 235.26 221.48
H0: r=1 (p-value) 0.58 0.54 0.45 0.33
N 78 78 78 78 Standard errors in parentheses; *** significant at 1%; ** significant at 5%; * significant at 10%; + no cointegration
32 These are actually the prices of butter from Denmark and Kiel (from the former Danish Duchy of Holstein in
Northern Germany).
21
The error correction (adjustment) coefficient, α, must be negative and significant to indicate
error correction (i.e. that one variable adjusts to the other). In each case the (Granger) causality
runs most clearly from the price of margarine to the price of butter, as is apparent because the
adjustment coefficient on 𝑝𝑡𝑀 is insignificant and/or small, while that on 𝑝𝑡𝐵 is significant and
large, thus implying that butter prices adjust mostly to margarine prices, but not the reverse.
This is less clear for the poorer qualities of Cork butter (regressions 7 and 8), which only serves
to emphasize the point that the markets for the poorest quality butter and margarine were
more closely linked.
The trend allows for a fall in the price of butter which is independent of the price of margarine,
probably capturing overall falling price levels in the 1880s (see figure 3). Although significant, it
is very small. The constant allows for non-zero trading costs. It should thus be larger for more
distant markets, where transportation costs are more important, and it of course also allows for
the consumers’ perceived quality differential between butter and margarine, which would be
reflected in a premium to butter. A negative coefficient implies a positive constant premium of
butter over margarine, and in fact the price gap is larger for the better than for the poorer
qualities.
The most important coefficient is β, which describes the equilibrium relationship. It is expected
to be negative (implying a positive relationship), reflecting our interpretation that both varieties
were substitutes since a price increase/decrease in one of them would be accompanied by a
similar price movement in the other variety: as margarine prices fell, consumers substituted
butter for margarine, lowering the demand for butter. As expected, the effect of changes in the
price of margarine was greater for the lower quality types of butter. So while a one per cent
decrease in the price of margarine would only lead to a 0.13 per cent fall in the price of Danish
butter in Manchester (or apparently no effect on the price of Danish butter in London, since we
do not find cointegration for this relationship), that of Cork 3rds would fall by almost 0.5 per
cent. In general, the elasticity for high quality butters (1-4) is about half or less that of the low

22
quality butters (5-8). Table 4 presents the size of the margarine effect on butter prices as a
proportion of the total observed change in prices.
Table 4: Percentage changes in prices of butter and margarine 1881-1887
Note: Price changes are based on the data underlying Table 2, comparing the average prices of the calendar year
1881 to those for the year running from July 1886 to June 1887, when our butterine series ends. Percentage
change from margarine is calculated by multiplying the estimated elasticity by the change in the butterine price.
Note that Danish butter prices in Manchester do not cointegrate with margarine prices (Table 3).
The change in the price is a function of both the effect from margarine, the supply of butter
more generally, and the price of inputs, as well as macroeconomic conditions. In fact, Table 4
demonstrates that Danish prices actually fell considerably more than Cork 1sts over this period,
albeit from higher levels with potentially higher margins and increasing revenue for producers.
This is because not just prices, but also quantities produced change vastly over this short
period, as Table 5 shows.
Danish (L) Danish (M) Kiel Normandy Friesland Cork 1st Cork 2nd Cork 3rd ButterineEstimated elasticity -0.13 0.00 -0.14 -0.23 -0.38 -0.40 -0.48 -0.47 N/A% change from margarine -2.2% 0.0% -2.4% -4.0% -6.5% -6.9% -8.3% -8.1% N/A% change from other -17.9% -26.0% -24.3% -10.8% -14.9% -4.9% -10.5% -9.1% N/A% change in price -20.1% -26.0% -26.7% -14.8% -21.4% -11.8% -18.8% -17.2% -17.2%

23
Table 5: Annual compound average growth rates of spreads imported into Britain, 1881-87
Ireland -2.4% Holland -13.4% Denmark 9.7% Germany 4.5% Belgium -9.2% France -2.6% Other Foreign -4.0% Margarine 21.7% Total 6.3% Butter only -1.8%
Source: Authors’ calculation from data underlying Figure 1.
Imports from the Netherlands and Belgium decreased the fastest (although they later partially
recovered in the 1890s), while imports of margarine and Danish butter increased at high annual
growth rates. The overall increase in supply of spreads of more than 6 per cent per year should
have affected prices negatively in general, most of this attributable to margarine. However, the
fast growth of supply of Danish butter, produced with increasing productivity and efficiency
both regarding milk production and its transformation into butter (Henriksen et al 2011, Lampe
and Sharp 2013), a consequence of adapting to the margarine challenge, contrasts with falling
imports from almost all other destinations. The ability of Denmark to adapt might in part be
due to the flexibility of the cooperative form of production (emulating advances already made
on the traditional estates), making the quality improvements easier to implement for large
numbers of peasant farmers.33
So while Danish butter saw similar falls to that of Irish over the years 1881-1887, only a small
fraction of this was due to the effect of margarine,34 compared to around fifty per cent for Irish
33 Thanks are due to an anonymous referee for pointing this out to us. See also Henriksen, Hviid and Sharp 2012.
34 In accordance with this, leading agriculturalists and merchants in Denmark saw margarine and potential
overproduction as the two main threats for Danish producers (Rützou 1887, p. 287, and the following discussion).

24
butter. It is difficult to establish a fully valid counterfactual scenario for the cost-benefit analysis
of the Danish and Irish strategies, but a first approximation might be to assume similar
increases in the supply of Danish butter, but not the quality. In this case, the price of Danish
butter might have suffered from a similar elasticity with respect to the price of margarine as
Cork 2nds and 3rds, and its price would then of course have fallen considerably more than that of
its Irish counterpart (which did not see similar increases in supply). Since, as discussed above, in
the 1860s and 1870s Danish peasant butter was comparable to the secondary qualities of Irish
butter, we can conclude that by upgrading to a uniform quality Danish peasants managed to
escape from the ‘margarine trap’.
V
The story above, of butter suffering due to the inability to differentiate it from margarine,
seems to be a clear case of where legislation would be necessary in order for consumers to
make informed decisions, and for producers to realize the proper price for their products. In
fact, laws to this effect were enacted in all countries, largely due to pressure from butter
producers, and margarine eventually became subject to a great deal of discriminatory
legislation35 (Van Stuyvenberg 1969), usually through a ban on adding yellow colouring, and
through ‘warning’ signs in places where margarine was sold. This legislation appeared too late,
however, to have an impact on the story told above, although some discussion of this seems
relevant here, in as much as it ensured that the reputation established by premium producers
of butter was maintained.
Denmark was the first to act, although margarine was relatively late coming to Denmark. Until
1884 it was imported (from Norway and Holland) and was known as Norwegian butter (a
Frenchman had started a factory in Oslo). But in 1884 the first margarine was produced in
Denmark. The threat to the reputation and price premium on Danish butter was obvious. In an
attempt to avoid this, Denmark passed the world’s first Margarine Law on 1 April 1885, 35 Not least in the United States (Dupré 1999, Miller 1989, Snodgrass 1930).

25
declaring that margarine should be clearly marked, and with a promise that, due to it taking the
law to new areas, it would be reconsidered after three years.
This failed to allay fears, however, and a political debate of perhaps unprecedented proportions
began, which ran through all levels of society (Higgins and Mordhorst 2008). Thus began the
‘Butter War’ or ‘Margarine War’ as it is sometimes known. In 1886 a commission was formed to
investigate the margarine problem, formed of the highly respected T.R. Segelcke from the Royal
Agricultural College in Copenhagen, two chemists, two estate owners, and a butter trader (but
notably no one from the margarine industry). They reported on 21 September 1886 that
margarine had indeed destroyed the Dutch butter industry, but that margarine was both
healthy and cheap, so they did not recommend a ban but rather simply new controls (Stranskov
et al 1998, pp. 66-7).
The situation remained volatile, however, eventually resulting in the passage of a much tougher
margarine law on 1 April 1888 (Strandskov et al 1998, p. 81), which enforced the display of
warning signs in stores selling margarine, forbade the mixture of margarine with more than 50
per cent butterfat36, and included a ban on the addition of yellow colouring to margarine37,
which was necessary to make it appear like butter, and without which exports to the UK were
impossible (Standskov et al 1998, p. 84). Finally, the Margarine Law of 1897 restricted the
amount of butter fat to be blended with margarine from 50 to 15 per cent, and it was forbidden
to add any preservatives other than salt (Drejer 1925-33, pp. 387-8). Interestingly, in fact,
36 As Otto Mønsted (1933), a large producer of margarine in Denmark, made clear, this provision was actually more
damaging for butter producers.
37 This was somewhat ironic, since Danish winter butter, produced by cows kept in barns, was naturally paler than
its summer counterpart, which was produced using cows grazed on grass, and was therefore often also coloured
(Stranskov et al 1998, p. 72). Note also that the Danish law was much less restrictive than those of some dairy
states in the United States. Miller (1989, p. 108-110) and Dupre (1989, p. 355) mention state legislation in New
Hampshire, West Virginia and Vermont from the 1880s and 1890s that required margarine to be coloured pink!

26
despite its importance for the Danish economy, the only laws for the dairy sector passed
between 1880 and 1900 were those concerning margarine.38
In the UK (and thus also Ireland), the regulatory framework in force in the early 1880s was the
Sale of Food and Drugs Act (1875), which, as French and Philips (2000) have highlighted, was
mostly aimed at preventing fraud and adulteration by retailers, stating that ‘no person shall sell
to the prejudice of the purchaser any article of food or any drug which is not of the nature,
substance, and quality of the article demanded by the purchaser’. When margarine appeared
prominently on the British market, butter producers requested similar protection to that in
Denmark. On January 1st, 1888, the Margarine Act 1887 entered into force. As in Denmark, the
law had been introduced to Parliament (House of Commons) by dairy interests, in this case six
Irish MPs, of which one was a Cork butter merchant and the others also had been elected by
dairy counties (French and Philips 2000., p. 41), while many of the experts informing the prior
parliamentary inquiry, among them Thomas Pearson, the source of our butterine prices,
thought the SFDA 1875 to be sufficient to prevent fraudulent margarine sales (French and
Philips 2000, p. 41). Inspired by the Danish Margarine Law of 1885, the UK Margarine Act aimed
at ‘the better prevention of the fraudulent sale of margarine’. It contained a number of
provisions designed to prohibit the sale of margarine as butter. For example, every
manufacturer of margarine was required to register with and to be inspected by the local
authority, a unique feature in British manufacturing regulations of the period, and packaging
was required to display clearly the word ‘Margarine’ (French and Philips 2000, pp. 41-42;
Higgins and Mordhorst, 2008, p. 193). However, the Margarine Act apparently did little to halt
38 Somewhat ironically, however, Danes soon became one of the leading consumers of margarine, a point noted by
Lenin, who considered it evidence of the cost to Danish peasants of capitalist agriculture: ‘Danish well-to-do
peasants, but above all the Danish capitalists, make a good deal of money from the butter trade. And yet Denmark
is the world’s biggest consumer of substitute butter, margarine! What is the explanation? It is very simple. The vast
majority of the Danish population, like that of any other capitalist country, consists of workers and propertyless
peasants. They cannot afford real butter. Even the middle peasants in Denmark, being in need of money, sell
abroad the butter they produce on their farms and buy the cheap margarine for themselves.’ Lenin (1973) vol. 18,
pp. 224-5.

27
margarine sales in Britain, leading to a new round of inquiries and legislative activity, ultimately
including new labelling requirements in the SFDA 1899, the 1902 Sale of Butter Regulation and
a new Butter and Margarine Act in 1907 (French and Philips 2000, pp. 45-61). French and Philips
(2000, p. 64) summarize the economic impact of these Acts and Regulations stating that they
‘failed to check the expansion of margarine sales’ (p. 64). So, while Danish margarine regulation
and the later activities of the Danish dairy representative in Britain, Harald Faber, seem to have
done much to establish confidence in Danish butter (Higgins and Mordhorst 2008; French and
Philips 2000, p. 49), the problems margarine caused for Irish producers were not solved by
British regulations.
In the Netherlands legislation similar to the Danish came far too late. It was only in 1889 that a
law concerning the butter trade (the Boterwet) was introduced to address the problems of
tampering and declining quality (Bieleman 1996, p. 19, Bieleman 2010, pp. 192-199).
VI
We analyse the impact of a new product, which despite different ingredients and production
technologies constituted a close substitute to existing low quality varieties, on the structure of
production and demand in an established market. We have shown, both from historical sources
and with formal econometric analysis, that the introduction of the new substitute, margarine,
had an impact on all established producers in the market for spreads, by increasing total supply.
After all, the invention of margarine by Mège-Mouriès responded to a prize offered by
Napoleon III due to rising relative prices of butter, indicating a shortfall of supply in relation to
demand in the middle decades of the nineteenth century (Snodgrass 1930, pp. 122-123;
Hoffmann 1969, pp. 9-13). The evolution of relative prices of animal products versus grains in
Britain (see Henriksen, Lampe and Sharp 2012, Figure 3, see also Donnelly 1971, p. 131-132)
and the quick success of butterine on the British market indicate that this phenomenon was not
unique to France, and hence the invention of margarine was not really an exogenous shock to
the butter industry, but endogenously determined.

28
However, the impact of the new substitute was different for different product varieties, and
hence low-quality butter producers suffered much more from the price reduction resulting
from the outward shift of the supply curve than those of high-quality varieties. In our case,
Danish producers of the best variety, estate butter, who already over the preceding decades
had been in a process of continuous quality improvements, were able to use the new challenge
to their advantage. Furthermore, the knowledge of producing and marketing high-quality
butter trickled down quickly to the average producer of former peasant butter. An upgrade of
average qualities and the disappearance of low quality varieties from the product portfolio then
became possible. We thus argue that the appearance of margarine ‘greased the wheels of
transformation’ in the sense that it provided critical incentives for the adoption of technologies,
institutions and marketing practices, such as cream-separators, winter dairying and the co-
operative form of production.39 This process happened in the other main supplier of butter to
the British market, Ireland, but producers there did not adapt quickly enough to the joint
challenge of Danish butter and cheap margarine. The reason for this is likely to be found in
domestic institutions regarding the organization of the production process. A similar
explanation might be given as to why margarine could emerge in the Netherlands and damage
the reputation of Friesland butter – the very reason for the ‘Butter War’ in Denmark.
Future research might attempt to compare our methodological approach and results to similar
cases in history, although we are not aware of similar studies in history or in economics, apart
from the industrial organization literature referred to above.40 Having deeper insights into the
39 The recent study by Higgins and Mordhorst (2008) of the Lurbrand for ‘Danish Produce’ established on the
British market in the last years of the nineteenth and the first decades of the twentieth century shows that Danish
‘quality upgrading’ was not the last stage of the process of maintaining and increasing the competitiveness of
Danish butter. Their account, however, is different from ours, since they refer to value creating beyond increasing
quality, as reflected in the creation and defense of ‘brand value’ to British consumers of Danish co-operative butter
(Higgins and Mordhorst 2008, pp. 196-198). The developments analyzed in the present article might therefore be
at a critical point in a virtuous circle.
40 An interesting example might be that of olive oil, where Ramon-Muñoz (2011a, 2011b) has named the collapse
of industrial markets (olive oil as lubricants) due to the ‘invasion of oleaginous products’ – palm oil, mineral oil and

29
effects of new products in existing markets might for example allow for insights into the
process of Schumpeterian ‘creative destruction’ – which, it seems, need not be so destructive
after all.
the like – since the early 1880s as a major incentive to improve and homogenize quality through the use of better
techniques. The storage time of olives before pressing was minimized, as was the risk of producing oil with a rancid
taste.

30
References
Alchian, A.A. and W.R. Allen (1964). University Economics, Belmont, CA: Wadsworth.
Annual Statement of the Trade and Navigation of the United Kingdom with Foreign Countries
and British Possessions in the Year [1860-1890], London: HMSO, 1861-1891.
Bauman, Y. (2004). ‘Shipping the Good Apples Out: A New Perspective’. Economic Inquiry 42:3,
pp. 534–536.
Bergman, M.A. and N. Rudholm (2003). ‘The Relative Importance of Actual and Potential
Competition: Empirical Evidence From the Pharmaceuticals Market.’ Journal of Industrial
Economics 51:4, pp. 455-467.
Bieleman, J. (1996). ‘Dutch agriculture 1850–1925 – Responding to changing markets’, Jahrbuch
für Wirtschaftsgeschicht 1996/I, pp. 11-52.
Bieleman, J. (2010). Five centuries of farming. A short history of Dutch agriculture, 1500-2000.
Wageningen: Wageningen Academic Publishers.
Bijdragen van het Statistisch Instituut 5 (1889), pp. 135-137.
Bjerke, Kjeld, and Niels Ussing (1958). Studier over Danmarks Nationalprodukt 1870-1950.
Copenhagen: G.E.C. Gads Forlag.
Bjørn, C. (1977). ‘Fællesmejerierne – En fase i Dansk Mejeribrugs Udvikling.’ Bol og by 2:1, pp.
65-80.
Bjørn, C. (1982). Dansk mejeribrug 1882-1914. Århus: De Danske Mejeriers Fællesorganisation.
Bjørn, C. (ed.) (1988). Det dansk landbrugs historie III, 1810-1914. Odense: Landbohistorisk
Selskab.
Bonfrer, A. and P.K. Chintagunta (2004). ‘Store Brands: Who Buys Them and What Happens to
Retail Prices When They Are Introduced?’ Review of Industrial Organization 24, pp. 195-218.
31
Bontemps, C., V. Orozco, V. Réquillart, and A. Trevisiol (2005). ‘Price Effects of Private Label
Development.’ Journal of Agricultural & Food Industrial Organization 3:1, Article 3.
Bontemps, C., V. Orozco, and V. Réquillart (2008). ‘Private Labels, National Brands and Food
Prices’. Review of Industrial Organization 33, pp. 1-22.
BPP (1875) (394). ‘Joint stock companies. Return to an order of the honourable the House of
Commons, dated 16 June 1875;--for, return of joint stock companies, to be made up to June
1875’.
BPP (1880) [C.2576] Commercial. No. 25. (Trade reports.) ‘Reports by Her Majesty's secretaries
of embassy and legation on the manufactures, commerce, &c., of the countries in which they
reside. Part IV’.
BPP (1881) [C.2778] Preliminary report from Her Majesty's Commissioners on Agriculture.
BPP (1881) [C.3096] Minutes of evidence taken before Her Majesty's Commissioners on
Agriculture. Vol. II.
BPP (1884-85) (288) Report from the Select Committee on Industries (Ireland); together with
the proceedings of the committee, minutes of evidence, and appendix.
BPP (1887) (208). Special report from the Select Committee on the butter substitutes bill;
together with the proceedings of the committee, minutes of evidence, and appendix.
BPP (1896) [C.8021] ‘Royal commission on agriculture. Minutes of evidence taken before Her
Majesty's Commissioners appointed to inquire into the subject of agricultural depression. With
appendices. Volume IV’.
Bresnahan, T.F. and R.J. Gordon (1997). The Economics of New Goods. Chicago: University of
Chicago Press.
Broda, Christian and David E. Weinstein (2006). ‘Globalization and the Gains from Variety.’
Quarterly Journal of Economics 121:2, pp. 541-585.

32
Christensen, J. (1985). Landbostatistik. Håndbog i dansk landbohistorisk statistik 1830-1900.
Copenhagen: Landbohistorisk Selskab 1985.
Clark, G., M. Huberman and P.H. Lindert (1995). ‘A British Food Puzzle, 1770-1850.’ Economic
History Review 48:2, pp. 215-237.
Crafts, N. (2005). ‘Regional GDP in Britain, 1871-1911: Some Estimates.’ Scottish Journal of
Political Economy 52:1, pp. 54-64.
De Vries, J. (2008). The Industrious Revolution: Consumer Behavior and the Household Economy,
1650 to the Present. Cambridge: Cambridge UP.
Donnelly, Jr., J.S. (1971). ‘Cork Market: Its Role in the Nineteenth Century Irish Butter Trade.’
Studia Hibernica 11, pp. 130-163.
Doornik, J.A. and D.F. Hendry (2009). Modelling Dynamic Systems: PcGive 13, Volume II.
London: Timberlake Consultants Ltd.
Drejer, A.A. (1925-33). ‘Mejeribruget’ in Det Danske Landbrugs Historie, Fjerde Bind.
Copenhagen: G.E.C. Gads Forlag.
Drejer, A.A. (1943). Mejeribrugets historie. Copenhagen: Gyldendal.
Dupré, R. (1999). ‘“If It's Yellow, It Must be Butter”: Margarine Regulation in North America
Since 1886’. Journal of Economic History 59:2, pp. 353-371.
Ejrnæs, M. and K.G. Persson (2000). ‘Market Integration and Transport Costs in France 1825-
1903: A Threshold Error Correction Approach to the Law of One Price’. Explorations in Economic
History 37:1, pp. 149-73.
Ejrnæs, M. and K.G. Persson (2010). ‘The gains from improved market efficiency: trade before
and after the transatlantic telegraph’. European Review of Economic History 14, pp. 361-381.
Faber, H. (1893). Dansk Smør paa det Sydengelske Marked. Copenhagen: Berlingske
Bogtrykkeri.

33
Faber, H. (1901). Det danske Smør paa det engelske Marked. Copenhagen: Særtryk af Beretning
om de samvirkende sjællandske Landboforeningers Virksomhed.
Faber, H. (1918). Co-operation in Danish Agriculture. London: Longmans, Green and Co.
Feenstra, R.C. (1994). ‘New Product Varieties and the Measurement of International Prices.’
American Economic Review 84:1, pp. 157-177.
Feinstein, C. (1991). ‘A New Look at the Cost of Living, 1870–1914.’ In J. Foreman-Peck (ed.),
Reinterpreting the Victorian Economy: Essays in Quantitative Economic History, Cambridge
University Press, 151-179.
French, M. and Philips, J. (2000). Cheated Not Poisoned? Food Regulation in the United
Kingdom, 1875-1938. Manchester: Manchester University Press.
Geary, F. and T. Stark (2002). ‘Examining Ireland’s Post-Famine Economic Growth Performance.’
Economic Journal 112, pp. 919-935.
Gibson, C.B. (1861). History of the county and city of Cork. Volume 2. T.C. Newby.
Hansen, S.A. (1984). Økonomisk vækst I Danmark 1914-1983. Copenhagen: Akademisk Forlag.
Hausman, J.A. (1997). ‘Valuation of New Goods under Perfect and Imperfect Competition.’ In:
Bresnahan and Gordon (1997), 207-248.
Hausman, J.A. and G.K. Leonard (2002). ‘The Competitive Effects of a New Product Introduction:
A Case Study’. Journal of Industrial Economics 50:3, pp. 237–263.
Henriksen, I. (1992). The Transformation of Danish Agriculture 1870-1914. In Persson (1993).
Henriksen, I. M. Lampe and P. Sharp (2011). ‘The Role of Technology and Institutions for
Growth: Danish Creameries in the late Nineteenth Century’. European Review of Economic
History 15:3, pp. 475-493.

34
Henriksen, I, M. Lampe and P. Sharp (2012). ‘The Strange Birth of Liberal Denmark: Danish trade
protection and the growth of the dairy industry since the mid-nineteenth century’. Economic
History Review 62:2, pp. 770-788.
Henriksen, I., M. Hviid and P. Sharp (2012). ‘Law and Peace: Contracts and the Success of the
Danish Dairy Cooperatives’. Journal of Economic History 72:1, pp. 197-224.
Henriksen, I. and K. H. O'Rourke (2005). ‘Incentives, technology, and the shift to year-round
dairying in late nineteenth-century Denmark.’ Economic History Review. Vol. LVIII, no. 3, pp.
520-545.
Hersh, J. and H. Voth (2009/11). Sweet diversity: Colonial goods and the rise of European living
standards after 1492. Universitat Pompeu Fabra Economics Working Paper 1163.
Higgins, D.M. and M. Mordhorst (2008). ‘Reputation and export performance: Danish butter
exports and the British market, c.1880 – c.1914’. Business History 50:2, pp. 185-204.
Hoffmann, W.G. (1969), ‘One hundred years of the margarine industry’ in J.H. Van Stuyvenberg
(ed.), Margarine: An economic, social, and scientific history, 1869-1969. Liverpool University
Press.
Hummels, D. and A. Skiba (2004), ‘Shipping the Good Apples Out? An Empirical Confirmation of
the Alchian-Allen Conjecture’. Journal of Political Economy 112:6, pp. 1384-1402.
Kennedy, L. and P. Solar (2007). Irish Agriculture. A Price History. Dublin: Royal Irish Academy.
Klovland, J.T. (1993). ‘Zooming in on Sauerbeck: Monthly Wholesale Prices in Britain 1845-
1890’. Explorations in Economic History 30:2, pp. 195–228.
Klovland, J.T. and P. Solar (2011). ‘New series for agricultural prices in London, 1770–1914’.
Economic History Review 64:1, pp. 72-87.
Lampe, M. and P. Sharp (2013). ‘The Productivity and Efficiency Effects of Revolutionary Change
in Agriculture’ (manuscript).

35
Lenin, V.I. (1973). Collected Works, vol. 18. Moscow: Progress Publishers.
Maddison, A. (2007). Contours of the world Economy, 1-2030 AD: Essays in Macroeconomic
History. Oxford: Oxford University Press.
McAlpine, T.L. (1886). Oleomargarine and Margarine: A plain presentation of the most gigantic
swindle of modern times. New York: The Judson Printing Cor.
Miller, G.P. (1989). ‘Public Choice at the Dawn of the Special Interest State: The Story of Butter
and Margarine’. California Law Review 77:1, pp. 83-131.
Mitchell, B.R. (2003). International Historical Statistics. Europe 1750-2000. Fifth Edition.
Basingstoke: Palgrave Macmillan.
O’Donovan, J. (1940). The Economic History of Live Stock in Ireland. Cork: Cork University Press.
Ó Gráda, C. (1977). ‘The Beginnings of the Irish Creamery System, 1880-1914’. Economic History
Review 30:2, pp. 284–305.
O’Rourke, K.H. (2006). ‘Late 19th Century Denmark in an Irish Mirror: Land Tenure,
Homogeneity and the Roots of Danish Success,’ in J.L. Campbell, J.A. Hall and O.K. Pedersen
(eds.), The State of Denmark: Small States, Corporatism and the Varieties of Capitalism,
Montreal: McGill-Queen’s University Press, pp. 159-196.
O’Rourke, K.H. (2007). ‘Culture, Conflict and Cooperation: Irish Dairying Before the Great War.’
Economic Journal 117, pp. 1357-1379.
Otto Mønsted A/S (1933). Margarineindustrien i Danmark 1883-1933. Copenhagen: Egmont H.
Petersens Kgl. Hofbogtrykkeri.
Pabst, W.R. (1937). Butter and Oleomargarine. An Analysis of Competing Commodities. New
York: Columbia University Press.
Pauwels, K. and S. Srninvasan (2004). ‘Who Benefits from Store Brand Entry?’ Marketing
Science 23 (3), 364–390.
36
Persson, K.G. (ed.) (1993). The Economic Development of Denmark and Norway since 1870.
Aldershot, UK: Edward Elgar .
Putsis, W.R. Jr. (1997). ‘An Empirical Study of the Effect of Brand Proliferation on Private Label –
National Brand Pricing Behavior.’ Review of Industrial Organization 12, pp. 355–371.
Ramon-Muñoz, R. (2011a). ‘Technical change in Spain and Italy. The Case of the Olive Oil
Industry, 1850s-1930s’, paper prepared for the Fifth Iberian Cliometrics Workshop -
Iberometrics V, University of Barcelona.
Ramon-Muñoz, R. (2011b). ‘Foreign Markets for Mediterranean Agricultural Products. An
Annual Series of World Olive Oil Production, 1850-1938’, paper prepared for First Quantitative
Agricultural and Natural Resources History Workshop - Agricliometrics, University of Zaragoza.
Rützou, P. (1887). ‘Smørmarkederne i Cork og Kjøbenhavn.’ Tidsskrift for Landøkonomie 5:6, pp.
273-300.
Schrover, M. (1990). ‘Labour Relations in the Dutch Margarine Industry, 1870-1954,’ History
Workshop 30 (Autumn 1990), pp. 55-62.
Sheldon, J.P. (1886). Dairy Farming: Being the Theory, Practice and Methods of Dairying.
London/Paris/New York: Cassell, Petter, Galpin & Co.
Solar, P.M. (1990). ‘The Irish Butter Trade in the Nineteenth Century: New Estimates and their
Implications.’ Studia Hibernica 25, pp. 134-161.
Snodgrass, K. (1930). Margarine as a Substitute of Butter. Stanford: Stanford University Food
Research Institute (Fats and Oils Studies, 4).
Sonne, C. (1885). ‘Mejeribruget 1884.’ Tidsskrift for Landøkonomi 5:4, pp. 37-72.
Strandskov, J., P. Sørensen and K. Pedersen (1998). Pioneren Otto Mønsted – Sig navnet…
Aarhus: Forlaget Systime A/S.

37
Tesdorpf, E. (1882). ‘Udsigterne for Mælkeriprodukternes Værdi.’ Ugeskrift for Landmænd
1882, 6:3, pp. 191-195 and 202-205.
Thomsen, B.N., B. Thomas and J.W. Oldam (1966). ‘Dansk-Engelsk Samhandel: Et Historisk Rids
1661-1963’. In Erhvervshistorisk Årbog: Meddelelser fra Erhvervsarkivet XVI, 1965, pp. 7-438.
Aarhus: Universitetsforlaget i Aarhus.
Uebele, M. (2011). ‘National and international market integration in the 19th century: Evidence
from comovement’. Explorations in Economic History 48:2, pp. 226-242.
Van Stuyvenberg, J.H. (1969), ‘Aspects of government intervention’ in J.H. Van Stuyvenberg
(ed.), Margarine: An economic, social, and scientific history, 1869-1969. Liverpool University
Press.
Ward, M.B., J.P. Shimshack, J.M. Perloff, J.M. Harris (2002). ‘Effects of the Private-Label Invasion
in Food Industries.’ American Journal of Agricultural Economics 84:4, pp. 961-973.
Wiest, E. (1916), The butter industry in the United States: an economic study of butter and
oleomargarine. New York: Columbia University Press.

38
Appendix: Misspecification tests for the regressions in Table 3
The following reports the results of the misspecification tests reported by PcGive 13. They are
reported both at the level of the individual equations and the system as a whole. The
Portmanteau statistic provides a test for (no) residual autocorrelation. The other statistics are
tests for (no) ARCH, normality and (no) heteroskedasticity. See Doornik and Hendry 2009, pp.
235-7 for more on this. P-values are in square parentheses. Most importantly, autocorrelation
is never a major concern. (8) has strong indications of both non-normality and
heteroskedasticity, so the results for these prices should be viewed with this in mind.
(1) Vector Portmanteau(12): Chi^2(40) = 55.414 [0.0533] Single-equation diagnostics using reduced-form residuals: 𝑝𝑡𝐵 : Portmanteau(12): Chi^2(10) = 12.667 [0.2429] 𝑝𝑡𝑀: Portmanteau(12): Chi^2(10) = 6.6043 [0.7622] Single-equation diagnostics using reduced-form residuals: 𝑝𝑡𝐵 : ARCH 1-5 test: F(5,66) = 0.44708 [0.8139] 𝑝𝑡𝐵 : Normality test: Chi^2(2) = 0.020293 [0.9899] 𝑝𝑡𝐵 : Hetero test: F(21,54) = 2.2086 [0.0101]* 𝑝𝑡𝑀: ARCH 1-5 test: F(5,66) = 0.28256 [0.9211] 𝑝𝑡𝑀: Normality test: Chi^2(2) = 9.1804 [0.0102]* 𝑝𝑡𝑀: Hetero test: F(21,54) = 1.6258 [0.0774] Vector Normality test: Chi^2(4) = 12.018 [0.0172]* Vector Hetero test: F(63,156) = 1.7222 [0.0036]** (2) Vector Portmanteau(12): Chi^2(40) = 55.158 [0.0558] Single-equation diagnostics using reduced-form residuals: 𝑝𝑡𝐵: Portmanteau(12): Chi^2(10) = 19.219 [0.0376]* 𝑝𝑡𝑀: Portmanteau(12): Chi^2(10) = 6.1505 [0.8025] Single-equation diagnostics using reduced-form residuals: 𝑝𝑡𝐵: ARCH 1-5 test: F(5,66) = 2.2523 [0.0593] 𝑝𝑡𝐵: Normality test: Chi^2(2) = 0.13700 [0.9338] 𝑝𝑡𝐵: Hetero test: F(21,54) = 1.6695 [0.0668] 𝑝𝑡𝑀: ARCH 1-5 test: F(5,66) = 0.32471 [0.8964] 𝑝𝑡𝑀: Normality test: Chi^2(2) = 9.6294 [0.0081]** 𝑝𝑡𝑀: Hetero test: F(21,54) = 1.2831 [0.2279] Vector Normality test: Chi^2(4) = 10.811 [0.0288]* Vector Hetero test: F(63,156) = 1.2347 [0.1491] (3) Vector Portmanteau(12): Chi^2(40) = 55.435 [0.0531] Single-equation diagnostics using reduced-form residuals: 𝑝𝑡𝐵: Portmanteau(12): Chi^2(10) = 15.512 [0.1145] 𝑝𝑡𝑀: Portmanteau(12): Chi^2(10) = 5.5677 [0.8502] Single-equation diagnostics using reduced-form residuals: 𝑝𝑡𝐵: ARCH 1-5 test: F(5,66) = 1.0278 [0.4087] 𝑝𝑡𝐵: Normality test: Chi^2(2) = 0.12446 [0.9397] 𝑝𝑡𝐵: Hetero test: F(21,54) = 1.4022 [0.1592]
39
𝑝𝑡𝑀: ARCH 1-5 test: F(5,66) = 0.34122 [0.8861] 𝑝𝑡𝑀: Normality test: Chi^2(2) = 9.4100 [0.0090]** 𝑝𝑡𝑀: Hetero test: F(21,54) = 1.7967 [0.0433]* Vector Normality test: Chi^2(4) = 12.023 [0.0172]* Vector Hetero test: F(63,156) = 1.4755 [0.0278]* (4) Vector Portmanteau(12): Chi^2(40) = 58.296 [0.0308]* Single-equation diagnostics using reduced-form residuals: 𝑝𝑡𝐵: Portmanteau(12): Chi^2(10) = 17.236 [0.0693] 𝑝𝑡𝑀: Portmanteau(12): Chi^2(10) = 8.5805 [0.5723] Single-equation diagnostics using reduced-form residuals: 𝑝𝑡𝐵: ARCH 1-5 test: F(5,66) = 0.40340 [0.8448] 𝑝𝑡𝐵: Normality test: Chi^2(2) = 0.83741 [0.6579] 𝑝𝑡𝐵: Hetero test: F(21,54) = 1.5562 [0.0974] 𝑝𝑡𝑀: ARCH 1-5 test: F(5,66) = 0.29499 [0.9140] 𝑝𝑡𝑀: Normality test: Chi^2(2) = 8.3443 [0.0154]* 𝑝𝑡𝑀: Hetero test: F(21,54) = 1.1653 [0.3171] Vector Normality test: Chi^2(4) = 8.9073 [0.0635] Vector Hetero test: F(63,156) = 1.1810 [0.2047] (5) Vector Portmanteau(12): Chi^2(40) = 56.783 [0.0413]* Single-equation diagnostics using reduced-form residuals: 𝑝𝑡𝐵: Portmanteau(12): Chi^2(10) = 11.843 [0.2957] 𝑝𝑡𝑀: Portmanteau(12): Chi^2(10) = 9.5210 [0.4835] Single-equation diagnostics using reduced-form residuals: 𝑝𝑡𝐵: ARCH 1-5 test: F(5,66) = 2.6612 [0.0298]* 𝑝𝑡𝐵: Normality test: Chi^2(2) = 3.0707 [0.2154] 𝑝𝑡𝐵: Hetero test: F(21,54) = 2.1069 [0.0146]* 𝑝𝑡𝑀: ARCH 1-5 test: F(5,66) = 0.25776 [0.9344] 𝑝𝑡𝑀: Normality test: Chi^2(2) = 10.496 [0.0053]** 𝑝𝑡𝑀: Hetero test: F(21,54) = 1.1740 [0.3098] Vector Normality test: Chi^2(4) = 11.637 [0.0203]* Vector Hetero test: F(63,156) = 1.3413 [0.0743] (6) Vector Portmanteau(12): Chi^2(40) = 39.218 [0.5053] Single-equation diagnostics using reduced-form residuals: 𝑝𝑡𝐵: Portmanteau(12): Chi^2(10) = 11.543 [0.3168] 𝑝𝑡𝑀: Portmanteau(12): Chi^2(10) = 6.9739 [0.7279] Single-equation diagnostics using reduced-form residuals: 𝑝𝑡𝐵: ARCH 1-5 test: F(5,66) = 0.38224 [0.8592] 𝑝𝑡𝐵: Normality test: Chi^2(2) = 0.63411 [0.7283] 𝑝𝑡𝐵: Hetero test: F(21,54) = 1.5969 [0.0852] 𝑝𝑡𝑀: ARCH 1-5 test: F(5,66) = 0.55539 [0.7337] 𝑝𝑡𝑀: Normality test: Chi^2(2) = 5.4521 [0.0655] 𝑝𝑡𝑀: Hetero test: F(21,54) = 1.3397 [0.1927] Vector Normality test: Chi^2(4) = 6.1393 [0.1890] Vector Hetero test: F(63,156) = 1.3333 [0.0785] (7) Vector Portmanteau(12): Chi^2(40) = 30.501 [0.8608] Single-equation diagnostics using reduced-form residuals: 𝑝𝑡𝐵: Portmanteau(12): Chi^2(10) = 8.4176 [0.5881] 𝑝𝑡𝑀: Portmanteau(12): Chi^2(10) = 8.5852 [0.5719]

40
Single-equation diagnostics using reduced-form residuals: 𝑝𝑡𝐵: ARCH 1-5 test: F(5,66) = 2.6385 [0.0310]* 𝑝𝑡𝐵: Normality test: Chi^2(2) = 0.058375 [0.9712] 𝑝𝑡𝐵: Hetero test: F(21,54) = 1.4223 [0.1496] 𝑝𝑡𝑀: ARCH 1-5 test: F(5,66) = 1.0342 [0.4050] 𝑝𝑡𝑀: Normality test: Chi^2(2) = 3.0409 [0.2186] 𝑝𝑡𝑀: Hetero test: F(21,54) = 2.0116 [0.0204]* Vector Normality test: Chi^2(4) = 3.6121 [0.4610] Vector Hetero test: F(63,156) = 1.4360 [0.0375]* (8) Vector Portmanteau(12): Chi^2(40) = 34.080 [0.7331] Single-equation diagnostics using reduced-form residuals: 𝑝𝑡𝐵: Portmanteau(12): Chi^2(10) = 13.573 [0.1934] 𝑝𝑡𝑀: Portmanteau(12): Chi^2(10) = 9.0684 [0.5256] Single-equation diagnostics using reduced-form residuals: 𝑝𝑡𝐵: ARCH 1-5 test: F(5,66) = 0.76053 [0.5815] 𝑝𝑡𝐵: Normality test: Chi^2(2) = 0.63537 [0.7278] 𝑝𝑡𝐵: Hetero test: F(21,54) = 1.0932 [0.3827] 𝑝𝑡𝑀: ARCH 1-5 test: F(5,66) = 0.12491 [0.9863] 𝑝𝑡𝑀: Normality test: Chi^2(2) = 11.505 [0.0032]** 𝑝𝑡𝑀: Hetero test: F(21,54) = 2.3863 [0.0054]** Vector Normality test: Chi^2(4) = 14.288 [0.0064]** Vector Hetero test: F(63,156) = 1.6497 [0.0067]**

41
Figures
Figure 1: Butter imports to Great Britain, 1860 and 1890
Source: Butter imports: Annual Statement 1866-1891; Ireland from Solar (1990). Margarine imports before 1885:
BPP (1887, p. 142) for 1884 then interpolated from Dutch margarine production index based on ‘Margarineboter-
Industrie’ in: Bijdragen van het Statistisch Instituut 5 (1889), pp. 135-137. Margarine imports before 1885 have
been deducted from butter imports totals and different countries according to their average participation in
imports of ‘butterine’ in 1885-1889 according to British trade statistics (92.1% Netherlands, 2.5% France, 2.0%
Belgium, 1.1% Germany, 0.03% Denmark, Other Foreign countries 2.2%, mainly Norway (1.5%)).

42
Figure 2: Production of Margarine in the Netherlands, 1875-1888 (log scale)
Source: ‘Margarineboter-Industrie’ in: Bijdragen van het Statistisch Instituut 5 (1889), pp. 135-137.

43
Figure 3: Prices of Margarine/Butterine, 1879-1890
Sources: ‘Manchester Average’ calculated from monthly data (January 1881-June 1887) handed in by Thomas
Pearson of the Co-operative Wholesale Society of Manchester to the Select Committee on the Butter Substitutes
Bill, BPP 1887 (208), pp. 144-146; ‘Dutch Average’ as mean of ‘high’ and ‘low’ annual prices (1879-1887) reported
in ‘Margarineboter-Industrie’ (as in Figure 2); ‘Average UK Import Price Butterine’ (1885-1890) from Annual
Statement [1885-1890]. Feinstein UK GDP deflator obtained by dividing the Current by the Constant 1900 price
GDP estimates in Mitchell (2003, p. 907), the Feinstein (1991) consumer price index is from Feinstein (1991, p.
170).

44
Figure 4: Average quality of Danish butter in the United Kingdom (imports from Denmark)
and in Denmark (production), 1861-1890.
Sources: ‘Average quality in Denmark’ is the ratio of the ‘Kapitaltakster’ valuation (taken from Christensen 1985) to
the top quality price, which until 1880 is ‘Herregadssmør Prima’ (from Drejer 1925-33, p. 326) and then the
average of the first weekly quotation for June, August, October and December of prima/highest export butter
(Finest/Prima Manor) in the Copenhagen Brokers' Current (data kindly provided by Ingrid Henriksen, see Henriksen
and O’Rourke 2005). ‘Average quality with British import prices’ is the ratio of the average unit value of imports of
Danish butter into the United Kingdom (sources as for Figure 1) to the same top quality price series in Copenhagen.
Values for this series can exceed ‘1’ since between the Copenhagen and the port of entry in the United Kingdom
transport and other trade costs occur. Unfortunately price quotes for Danish butter in London are incomplete even
for the late 1870s and lacking for earlier periods.
0.6
0.7
0.8
0.9
1
1.1
1.2
1861
1863
1865
1867
1869
1871
1873
1875
1877
1879
1881
1883
1885
1887
1889
Average quality in Denmark Average quality with British import prices
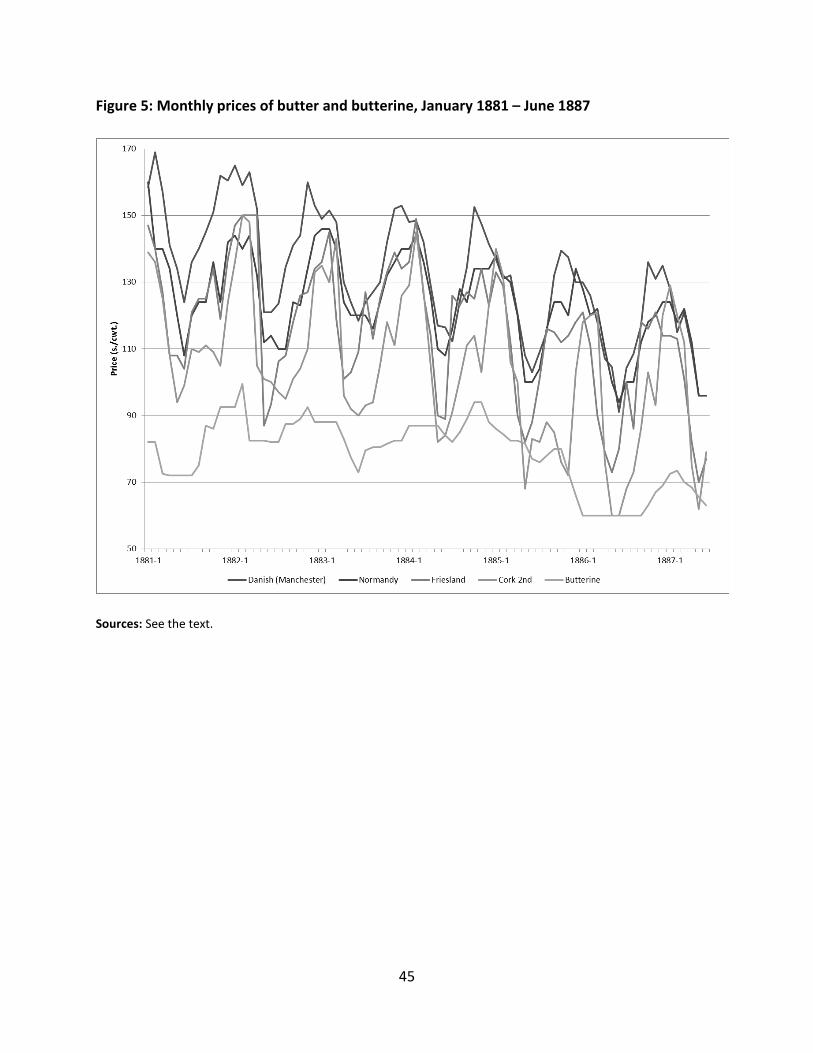
45
Figure 5: Monthly prices of butter and butterine, January 1881 – June 1887
Sources: See the text.
European
Historical
Economics
Society
EHES Working Paper Series
Recent EHES Working Papers
2013
EHES.42
Locomotives of Local Growth: The Short- and
Long-Term Impact of Railroads in Sweden
Thor Berger and Kerstin Enflo
EHES.41
Waterloo: a Godsend for French Public Finances?
Kim Oosterlinck, Loredana Ureche-Rangau and Jacques-Marie Vaslin
EHES.40
Siting the New Economic Science:
The Cowles Commission’s Activity Analysis Conference of June 1949
Till Düppe and E. Roy Weintraub
EHES.39
EHES.38
EHES.37
EHES.36
EHES.35
Agricultural development during early industrialization in a low-wage economy:
Saxony, c. 1790-1830
Michael Kopsidis and Ulrich Pfister
The Persistence of de Facto Power: Elites and Economic
Development in the US South, 1840-1960
Philipp Ager
North and South: Social Mobility and Welfare Spending in
Preindustrial England
Nina Boberg‐Fazlic and Paul Sharp
Household Debt and Economic Recovery Evidence from the U.S. Great
Depression
Katharina Gärtner
Predicting the Past: Understanding the Causes of Bank Distress in the
Netherlands in the 1920s
Christopher L. Colvin, Abe de Jong and Philip T. Fliers
All papers may be downloaded free of charge from: www.ehes.org The European Historical Economics Society is concerned with advancing education in European economic
history through study of European economies and economic history. The society is registered with the
Charity Commissioners of England and Wales number: 1052680