great east lake - unh extension · great east lake water quality monitoring: 2013 summary and...
TRANSCRIPT

GREAT EAST LAKE Water Quality Monitoring: 2013 Summary and Recommendations NH LAKES LAY MONITORING PROGRAM
By: Robert Craycraft & Jeffrey Schloss
To obtain additional information on the NH Lakes Lay Monitoring Program (NH LLMP) contact the Coordinator (Jeff Schloss) at 603-862-3848 or Assistant Coordinator (Bob Craycraft) at 603-862-3696.
Center for Freshwater Biology University of New Hampshire

This page intentionally left blank

i
PREFACE
This report contains the findings of a water quality survey of Great East Lake, Wakefield, New Hampshire and Acton, Maine conducted in the summer of 2013 by the University of New Hampshire Center for Freshwater Biology (CFB) in conjunction with the Great East Lake Improvement Association. The report is written with the concerned lake resident in mind and contains an executive summary that discusses the 2013 and historical water quality data. Graphic display of data is included, in addition to listings of data in appendices, to aid visual perspective. A simplified and stand alone, three page, “Great East Lake Sampling Highlight” document was also produced for distribution among interested residents and officials.
ii
ACKNOWLEDGMENTS
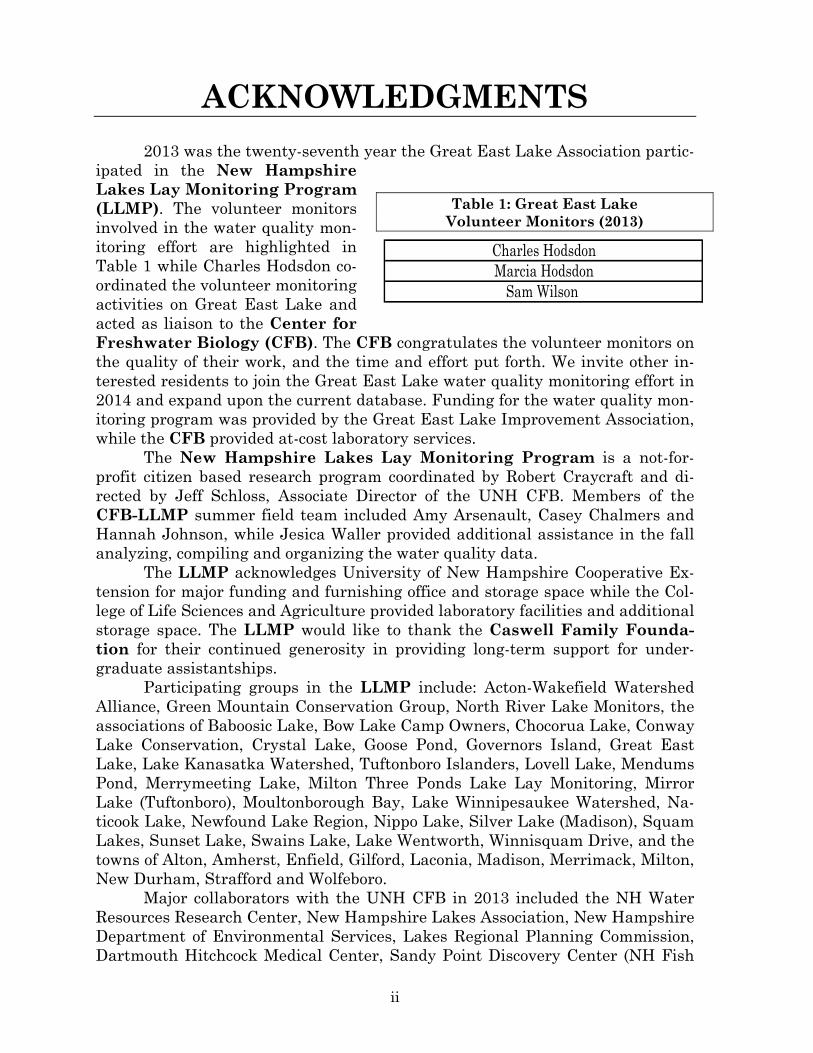
2013 was the twenty-seventh year the Great East Lake Association partic-ipated in the New Hampshire Lakes Lay Monitoring Program (LLMP). The volunteer monitors involved in the water quality mon-itoring effort are highlighted in Table 1 while Charles Hodsdon co-ordinated the volunteer monitoring activities on Great East Lake and acted as liaison to the Center for Freshwater Biology (CFB). The CFB congratulates the volunteer monitors on the quality of their work, and the time and effort put forth. We invite other in-terested residents to join the Great East Lake water quality monitoring effort in 2014 and expand upon the current database. Funding for the water quality mon-itoring program was provided by the Great East Lake Improvement Association, while the CFB provided at-cost laboratory services.
The New Hampshire Lakes Lay Monitoring Program is a not-for-profit citizen based research program coordinated by Robert Craycraft and di-rected by Jeff Schloss, Associate Director of the UNH CFB. Members of the CFB-LLMP summer field team included Amy Arsenault, Casey Chalmers and Hannah Johnson, while Jesica Waller provided additional assistance in the fall analyzing, compiling and organizing the water quality data. The LLMP acknowledges University of New Hampshire Cooperative Ex-tension for major funding and furnishing office and storage space while the Col-lege of Life Sciences and Agriculture provided laboratory facilities and additional storage space. The LLMP would like to thank the Caswell Family Founda-tion for their continued generosity in providing long-term support for under-graduate assistantships. Participating groups in the LLMP include: Acton-Wakefield Watershed Alliance, Green Mountain Conservation Group, North River Lake Monitors, the associations of Baboosic Lake, Bow Lake Camp Owners, Chocorua Lake, Conway Lake Conservation, Crystal Lake, Goose Pond, Governors Island, Great East Lake, Lake Kanasatka Watershed, Tuftonboro Islanders, Lovell Lake, Mendums Pond, Merrymeeting Lake, Milton Three Ponds Lake Lay Monitoring, Mirror Lake (Tuftonboro), Moultonborough Bay, Lake Winnipesaukee Watershed, Na-ticook Lake, Newfound Lake Region, Nippo Lake, Silver Lake (Madison), Squam Lakes, Sunset Lake, Swains Lake, Lake Wentworth, Winnisquam Drive, and the towns of Alton, Amherst, Enfield, Gilford, Laconia, Madison, Merrimack, Milton, New Durham, Strafford and Wolfeboro.
Major collaborators with the UNH CFB in 2013 included the NH Water Resources Research Center, New Hampshire Lakes Association, New Hampshire Department of Environmental Services, Lakes Regional Planning Commission, Dartmouth Hitchcock Medical Center, Sandy Point Discovery Center (NH Fish
Table 1: Great East Lake Volunteer Monitors (2013)
Charles HodsdonMarcia Hodsdon
Sam Wilson

iii
and Game and Great Bay National Estuary Research Reserve), EPA New Eng-land, the Volunteer Monitoring National Facilitation Project (USDA) and the Northeastern States and Caribbean Islands Regional Water Center (USDA Na-tional Institute of Food and Agriculture).

iv
GREAT EAST LAKE 2013 Executive Summary
Water quality data were collected by the Great East Lake volunteer moni-tors between June 10 and September 27, 2013 while a more in depth water qual-ity survey of the Great East Lake deep sampling stations (Sites 1 Center, 2 Ca-nal, 2nd Basin, 3 Maine Mann) was conducted by the Center for Freshwater Biology (CFB) on September 9, 2013 to augment the volunteer monitoring da-ta. Generally speaking, the 2013 Great East Lake water quality remained high at the deep, centrally located, sampling locations as reflected by the clear water, the low levels of microscopic plant “algal” growth and the low phosphorus, nutri-ent, concentrations (Table 2). The following section discusses the 2013 and historical Great East Lake water quality data. Refer to Appendix D for a complete listing of the 2013 Great East Lake water quality data.
1) Water Clarity (measured as Secchi Disk transparency) – The 2013 Great East Lake water clarity values were high and were visibly deeper than 4 meters (13.2 feet) that is considered the boundary between an unproductive "pristine" and a more nutrient enriched "transitional" New Hampshire lake (Ta-ble 3 and Appendix A). In 2013, Sites 1 Center and 2 Canal displayed a decrease in median Secchi Disk transparency (i.e. less clear water), whereas 2nd Basin and 3 Maine Mann exhibited an increase in median Secchi Disk transparency values (i.e. clearer water) relative to 2012 median
Table 2: 2013 Great East Lake Seasonal Average Water Quality Readings and Water Qual-ity Classification Criteria used by the New Hampshire Lakes Lay Monitoring Program.
Parameter Oligo “Excellent”
Meso “Fair”
Eutrophic “Poor”
Great East Lake Average (range)
Great East Lake Classification
Water Clarity (meters) 4.0 – 7.0 2.5 - 4.0 < 2.5 9.6 meters (range: 8.2 – 10.9) Oligotrophic
Chlorophyll a (ppb) 2.0 - 3.0 3.0 - 7.0 > 7.0 0.9 ppb (range: 0.3 – 1.5) Oligotrophic
Total Phosphorus (ppb) 15.0 – 7.0 15.0 - 25.0 > 25.0 4.5 ppb (range: 2.5 – 6.7) Oligotrophic
Dissolved Oxygen (mg/L) 5.0 – 7.0 2.0 – 5.0 <2.0 11.1 mg/L (range: 8.9 – 12.7) Oligotrophic
* Total phosphorus and chlorophyll a data were collected in the surface waters (epilimnion).
Table 3: 2013 Water Clarity data summary for the Great East Lake deep sampling
stations.
Site Seasonal Average Water Transparency (meters)
1 Center 9.6 meters (range: 8.2 – 10.9) 2 Canal 7.9 meters (range: 7.9– 10.8) 2nd Basin 5.4 meters (range: 4.2 – 4.9) 3 Maine Mann 9.5 meters (range: 8.5 – 10.5)
v
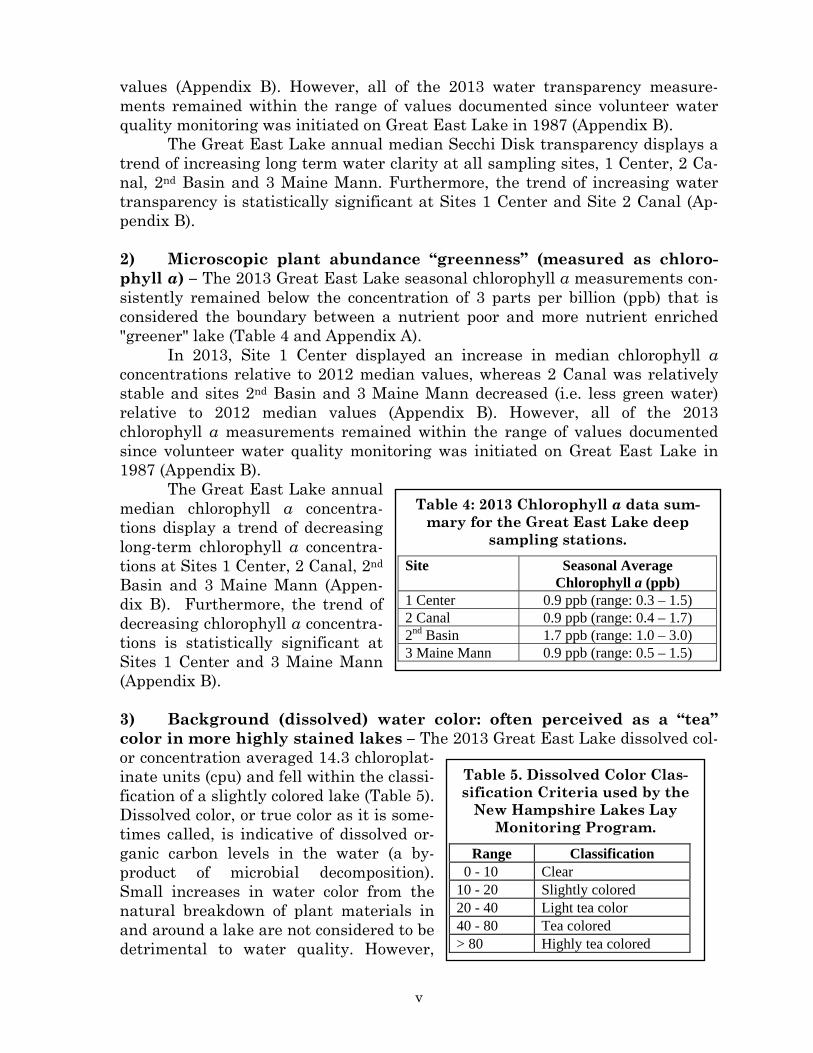
values (Appendix B). However, all of the 2013 water transparency measure-ments remained within the range of values documented since volunteer water quality monitoring was initiated on Great East Lake in 1987 (Appendix B). The Great East Lake annual median Secchi Disk transparency displays a trend of increasing long term water clarity at all sampling sites, 1 Center, 2 Ca-nal, 2nd Basin and 3 Maine Mann. Furthermore, the trend of increasing water transparency is statistically significant at Sites 1 Center and Site 2 Canal (Ap-pendix B). 2) Microscopic plant abundance “greenness” (measured as chloro-phyll a) – The 2013 Great East Lake seasonal chlorophyll a measurements con-sistently remained below the concentration of 3 parts per billion (ppb) that is considered the boundary between a nutrient poor and more nutrient enriched "greener" lake (Table 4 and Appendix A). In 2013, Site 1 Center displayed an increase in median chlorophyll a concentrations relative to 2012 median values, whereas 2 Canal was relatively stable and sites 2nd Basin and 3 Maine Mann decreased (i.e. less green water) relative to 2012 median values (Appendix B). However, all of the 2013 chlorophyll a measurements remained within the range of values documented since volunteer water quality monitoring was initiated on Great East Lake in 1987 (Appendix B).
The Great East Lake annual median chlorophyll a concentra-tions display a trend of decreasing long-term chlorophyll a concentra-tions at Sites 1 Center, 2 Canal, 2nd Basin and 3 Maine Mann (Appen-dix B). Furthermore, the trend of decreasing chlorophyll a concentra-tions is statistically significant at Sites 1 Center and 3 Maine Mann (Appendix B).
3) Background (dissolved) water color: often perceived as a “tea” color in more highly stained lakes – The 2013 Great East Lake dissolved col-or concentration averaged 14.3 chloroplat-inate units (cpu) and fell within the classi-fication of a slightly colored lake (Table 5). Dissolved color, or true color as it is some-times called, is indicative of dissolved or-ganic carbon levels in the water (a by-product of microbial decomposition). Small increases in water color from the natural breakdown of plant materials in and around a lake are not considered to be detrimental to water quality. However,
Table 5. Dissolved Color Clas-sification Criteria used by the
New Hampshire Lakes Lay Monitoring Program.
Range Classification 0 - 10 Clear 10 - 20 Slightly colored 20 - 40 Light tea color 40 - 80 Tea colored > 80 Highly tea colored
Table 4: 2013 Chlorophyll a data sum-mary for the Great East Lake deep
sampling stations.
Site Seasonal Average Chlorophyll a (ppb)
1 Center 0.9 ppb (range: 0.3 – 1.5) 2 Canal 0.9 ppb (range: 0.4 – 1.7) 2nd Basin 1.7 ppb (range: 1.0 – 3.0) 3 Maine Mann 0.9 ppb (range: 0.5 – 1.5)

vi
increased color can lower water transparency, and hence, change the public per-ception of water quality.
The low dissolved color concentrations that are typical of Great East Lake and suggest the water transparency variations generally reflect changes in the amount of microscopic plant growth and the amount of suspended sediments (e.g. silt) within the water column. 4) Total Phosphorus: the nutrient considered most responsible for elevated microscopic plant growth in our New Hampshire Lakes. - Total phosphorus concentrations, measured in the surface waters (epilimnion), were low when collected by the volunteer monitors during the 2013 sampling season. The Great East Lake total phosphorus values ranged from 2.5 to 14.0 parts per billion (ppb) at the four deep sampling locations (Figure 9) and generally re-mained well below the concentration of 10 ppb that is considered sufficient to cause an algal bloom.
Long-Term annual median total phosphorus concentrations documented at Site 1 Center and Site 3 Maine Mann display a trend of increasing median to-tal phosphorus concentrations, whereas Site 2 Canal and Site 2nd Basin display a trend of decreasing total phosphorus concentrations. Site 1 Center was the on-ly sampling site that exhibits a statistically significant trend (Appendix B). 5) Resistance against acid precipitation (measured as total alkalini-ty) – The 2013 Great East Lake alkalinity of 8.1 milligrams per liter (mg/l) is characteristic of a lake with a moderate vulnerability to acid precipitation ac-cording to the standards developed by the New Hampshire Department of Environ-mental Services (Table 6). Generally speak-ing, the geology of the region does not con-tain the mineral content (e.g. limestone) that increases the buffering capacity in our sur-face waters. Thus, lakes in the vicinity (i.e. Lake Winnipesaukee and Lake Wentworth) have naturally low alkalinities. Lake acidity (measured as pH) - The 2013 Great East Lake pH data ranged from 6.8 to 7.5 units in the surface waters and remained within the tolerable range for most aquatic organisms. 6) Dissolved salts: measured as specific conductivity – Specific Con-ductivity levels were moderate and ranged from 62.0 to 65.0 micro-Siemans (uS) when measured at the deep, open water, sampling stations on September 9, 2013. High specific conductivity values can be an indication of problem areas around a lake where failing septic systems, heavy fertilizer applications and sed-imentation contribute “excessive” nutrients that make their way into Great East Lake. High specific conductivity values can also be associated with road salt runoff that is flushed into our New Hampshire Lakes. The 2013 Great East Lake
Table 6. Alkalinity Classification Criteria used by the New Hamp-
shire Department of Environmental Services
Range Classification
< 0 Acidified 0 -2 Extremely Vulnerable 2.1 - 10.0 Moderately Vulnerable 10.1 - 25.0 Low Vulnerability > 25.0 Not Vulnerable
vii
runoff that is flushed into our New Hampshire Lakes. The 2013 Great East Lake specific conductivity measurements did not suggest any serious water quality problems at the deep and centrally located sampling locations.
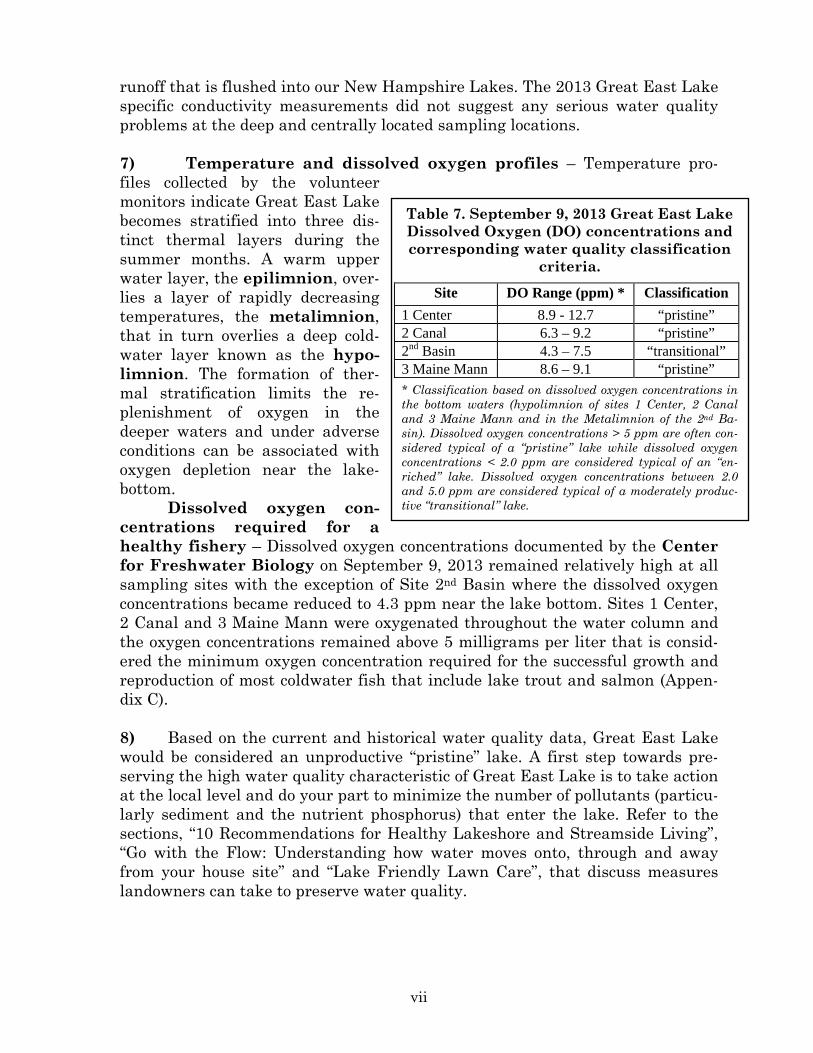
7) Temperature and dissolved oxygen profiles – Temperature pro-files collected by the volunteer monitors indicate Great East Lake becomes stratified into three dis-tinct thermal layers during the summer months. A warm upper water layer, the epilimnion, over-lies a layer of rapidly decreasing temperatures, the metalimnion, that in turn overlies a deep cold-water layer known as the hypo-limnion. The formation of ther-mal stratification limits the re-plenishment of oxygen in the deeper waters and under adverse conditions can be associated with oxygen depletion near the lake-bottom.
Dissolved oxygen con-centrations required for a healthy fishery – Dissolved oxygen concentrations documented by the Center for Freshwater Biology on September 9, 2013 remained relatively high at all sampling sites with the exception of Site 2nd Basin where the dissolved oxygen concentrations became reduced to 4.3 ppm near the lake bottom. Sites 1 Center, 2 Canal and 3 Maine Mann were oxygenated throughout the water column and the oxygen concentrations remained above 5 milligrams per liter that is consid-ered the minimum oxygen concentration required for the successful growth and reproduction of most coldwater fish that include lake trout and salmon (Appen-dix C).
8) Based on the current and historical water quality data, Great East Lake would be considered an unproductive “pristine” lake. A first step towards pre-serving the high water quality characteristic of Great East Lake is to take action at the local level and do your part to minimize the number of pollutants (particu-larly sediment and the nutrient phosphorus) that enter the lake. Refer to the sections, “10 Recommendations for Healthy Lakeshore and Streamside Living”, “Go with the Flow: Understanding how water moves onto, through and away from your house site” and “Lake Friendly Lawn Care”, that discuss measures landowners can take to preserve water quality.
Table 7. September 9, 2013 Great East Lake Dissolved Oxygen (DO) concentrations and corresponding water quality classification
criteria.
Site DO Range (ppm) * Classification
1 Center 8.9 - 12.7 “pristine” 2 Canal 6.3 – 9.2 “pristine” 2nd Basin 4.3 – 7.5 “transitional” 3 Maine Mann 8.6 – 9.1 “pristine” * Classification based on dissolved oxygen concentrations in the bottom waters (hypolimnion of sites 1 Center, 2 Canal and 3 Maine Mann and in the Metalimnion of the 2nd Ba-sin). Dissolved oxygen concentrations > 5 ppm are often con-sidered typical of a “pristine” lake while dissolved oxygen concentrations < 2.0 ppm are considered typical of an “en-riched” lake. Dissolved oxygen concentrations between 2.0 and 5.0 ppm are considered typical of a moderately produc-tive “transitional” lake.
viii
COMMENTS AND RECOMMENDATIONS
1. We recommend that each participating water quality monitoring organiza-tion, including the Great East Lake Improvement Association, continue to collect data in 2014 and add to the long-term database. The database currently provides information on the short-term and long-term cyclic variability that occurs in Great East Lake. Continued monitoring would enable more reliable predictions of both short-term and long-term water quality trends. 2. We suggest interested residents and public officials review the Salmon Falls Headwater Lakes Watershed Management Plan. The document includes a summary of the Great East Lake water quality, identifies threats to Great East Lake and pro-vides suggestions that, if implemented, will reduce future water quality degradation through a watershed management approach. http://www.awwatersheds.org/images/stories/SFHeadwaterLakesWMP_April2010.pdf 3. We recommend continued early season sampling (April/May) to document Great East Lake’s reaction to the nutrient and acid loadings that typically occur during and after spring thaw. Sampling should include alkalinity, chlorophyll a, dis-solved color, Secchi Disk transparency and total phosphorus measurements. 4. Frequent “weekly” water quality samples, necessary to assess the current condition of Great East Lake, should be collected whenever possible. Continued sampling of chlorophyll a, Secchi Disk transparency, dissolved color, alkalinity and total phosphorus samples will be useful to track variations in nutrient loading dur-ing the summer months. 5. Some program participants have expanded their monitoring programs to in-clude supplemental near-shore sampling locations that would help screen for prob-lem areas and, when problems are identified, would help target resources (i.e. mon-ey and volunteer hours) to the most critical areas within the watershed where fu-ture monitoring and corrective efforts should be directed. Expanded water quality monitoring could be as simple as collecting additional near-shore/tributary total phosphorus or chlorophyll a samples or expanded water quality monitoring could involve the collection of additional water quality parameters such as dissolved oxy-gen and specific conductivity measurements. If you are interested in discussing ad-ditional water quality monitoring options that would meet your needs please contact Bob Craycraft @ 862-3696 or via email, [email protected]. 6. We recommend the Great East Lake Improvement Association add a simple cyanobacteria monitoring component to the routine water quality sampling regiment. Cyanobacteria sample collections between the spring and fall months can give insight as to how these populations are distributed throughout the season and when they are most likely to reach harmful levels. If you are interested in

ix
discussing additional water quality monitoring options that would meet your needs please contact Bob Craycraft @ 862-3696 or [email protected].
x
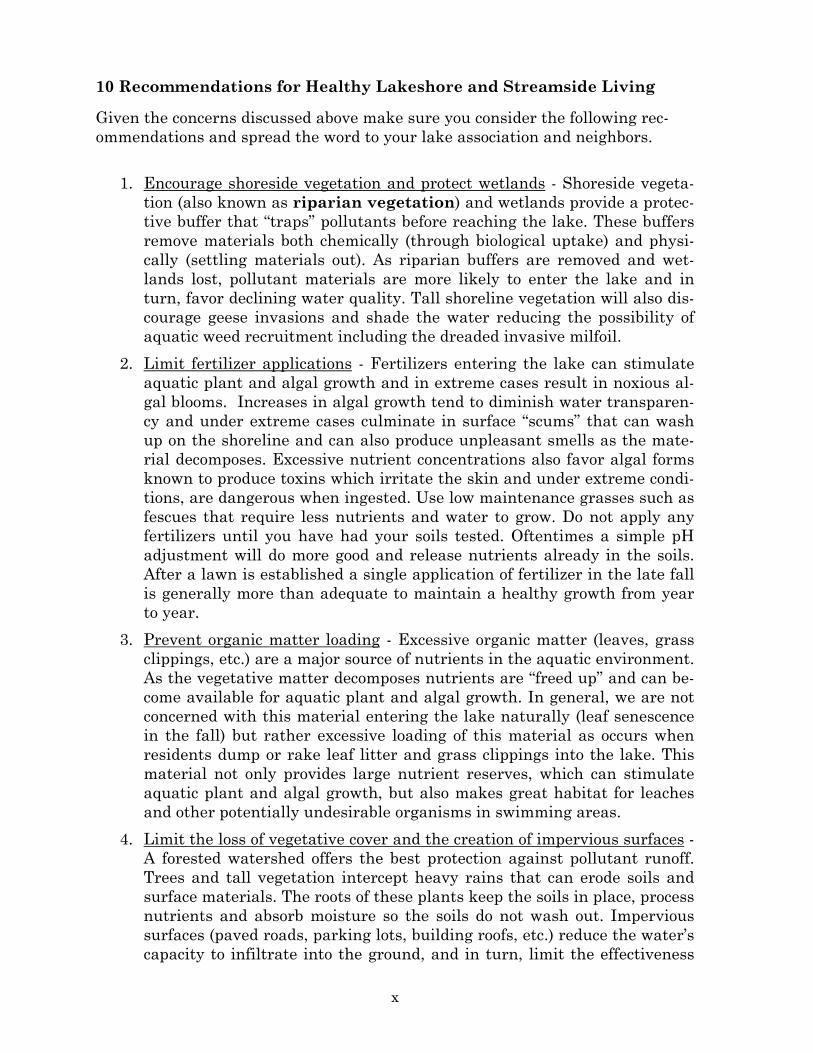
10 Recommendations for Healthy Lakeshore and Streamside Living
Given the concerns discussed above make sure you consider the following rec-ommendations and spread the word to your lake association and neighbors.
1. Encourage shoreside vegetation and protect wetlands - Shoreside vegeta-tion (also known as riparian vegetation) and wetlands provide a protec-tive buffer that “traps” pollutants before reaching the lake. These buffers remove materials both chemically (through biological uptake) and physi-cally (settling materials out). As riparian buffers are removed and wet-lands lost, pollutant materials are more likely to enter the lake and in turn, favor declining water quality. Tall shoreline vegetation will also dis-courage geese invasions and shade the water reducing the possibility of aquatic weed recruitment including the dreaded invasive milfoil.
2. Limit fertilizer applications - Fertilizers entering the lake can stimulate aquatic plant and algal growth and in extreme cases result in noxious al-gal blooms. Increases in algal growth tend to diminish water transparen-cy and under extreme cases culminate in surface “scums” that can wash up on the shoreline and can also produce unpleasant smells as the mate-rial decomposes. Excessive nutrient concentrations also favor algal forms known to produce toxins which irritate the skin and under extreme condi-tions, are dangerous when ingested. Use low maintenance grasses such as fescues that require less nutrients and water to grow. Do not apply any fertilizers until you have had your soils tested. Oftentimes a simple pH adjustment will do more good and release nutrients already in the soils. After a lawn is established a single application of fertilizer in the late fall is generally more than adequate to maintain a healthy growth from year to year.
3. Prevent organic matter loading - Excessive organic matter (leaves, grass clippings, etc.) are a major source of nutrients in the aquatic environment. As the vegetative matter decomposes nutrients are “freed up” and can be-come available for aquatic plant and algal growth. In general, we are not concerned with this material entering the lake naturally (leaf senescence in the fall) but rather excessive loading of this material as occurs when residents dump or rake leaf litter and grass clippings into the lake. This material not only provides large nutrient reserves, which can stimulate aquatic plant and algal growth, but also makes great habitat for leaches and other potentially undesirable organisms in swimming areas.
4. Limit the loss of vegetative cover and the creation of impervious surfaces - A forested watershed offers the best protection against pollutant runoff. Trees and tall vegetation intercept heavy rains that can erode soils and surface materials. The roots of these plants keep the soils in place, process nutrients and absorb moisture so the soils do not wash out. Impervious surfaces (paved roads, parking lots, building roofs, etc.) reduce the water’s capacity to infiltrate into the ground, and in turn, limit the effectiveness

xi
of nature’s water purification system, our soils. As water seeps into the soil, pollutants are removed from the runoff through absorption onto soil particles. Biological processes of soil organisms and plants detoxify sub-stances and/or immobilize substances. Surface water runoff over impervi-ous surfaces also increases water velocities which favor the transport of a greater load of suspended and dissolved pollutants into your lake.
5. Follow the Flow - Try to landscape and re-develop with consideration of how water flows on and off your property. Divert runoff from driveways, roofs and gutters to a level vegetated area or a rain garden so the water can be slowed, filtered and hopefully absorbed as recharge for your well.
6. Discourage the feeding of ducks and geese - Ducks and geese that are lo-cally fed tend to concentrate in higher densities around the known food source and can result in localized water quality problems. Waterfowl quickly process food into nutrients that are capable of stimulate micro-scopic plant (“algal”) growth. Ducks and geese are also host to the parasite responsible for swimmers itch. While not a serious health threat, swim-mers itch is very uncomfortable especially for young children.
7. Maintain septic systems - Faulty septic systems are a big concern as they can be a primary source of water pollution around our lakes in the sum-mer. Septic systems are loaded with nutrients and can also be a health threat when not functioning properly. Inspect your system on a timely ba-sis and pump out the septic tank every three to five years depending on tank capacity and household water use. Since the septic system is such an expensive investment often costing a minimum of $10,000 for a complete overhaul, it is advantageous to assure proper care is taken to prolong the system’s life. Additionally, following proper maintenance practices will reduce lake and ground water quality degradation.
8. Take care when using and storing pesticides, toxic substances and fuels as it only takes a small amount to pollute lake, stream and ground water. Store, handle and use with attention paid to the label instructions.
9. Stabilize access areas and beaches - Perched beaches (cribbed areas) that keep sand and rocks in-place are preferred if you have to have that type of access. Do not create or enhance beach areas with sand (contains phos-phorus, smothers aquatic habitat, fills in the lake as it gets transported away by currents and wind and encourages invasive plants and algal blooms), particularly if the sand disappears with time.
10. Review the Shoreland Water Quality Protection Act (SWQPA) if you have shoreland property, http://des.nh.gov/organization/divisions/water/wetlands/cspa/. The SWQPA sets legal regulations aimed at protecting water quality. If you have any questions regarding the Act you can contact the New Hampshire Department of Environmental Services Shoreland Program at 271-2147 or [email protected]

xii
Note: The materials listed below offer more detailed guidance on as-sessing and implementing corrective actions that can maintain or im-prove the quality of surface and subsurface (septic) runoff that may otherwise impact water quality.
Pipeline: Summer 2008. Vol. 19, No. 1. Septic Systems and Source Water Protection: Homeowners can help improved community water quality. http://www.nesc.wvu.edu/pdf/WW/publications/pipline/PL_SU08.pdf
Landscaping at the Water’s Edge: an Ecological Approach. $20.00/ea University of New Hampshire Cooperative Extension Publications Cen-ter, Nesmith Hall, 131 Main Street, Durham NH 03824. http://extension.unh.edu/resources/ to order a bound copy. http://extension.unh.edu/resources/files/Resource001799_Rep2518.pdf - to view a PDF copy of the document online.
Integrated Landscaping: Following Nature’s Lead. $20.00/ea University of New Hampshire Cooperative Extension Publications Center, Nesmith Hall, 131 Main Street, Durham NH 03824. http://extension.unh.edu/resources/
The Best Plants for New Hampshire Gardens and Landscapes - How to Choose Annuals, Perennials, Small Trees & Shrubs to Thrive in Your Garden. University of New Hampshire Cooperative Extension Publica-tions Center, Nesmith Hall, 131 Main Street, Durham NH 03824. http://extension.unh.edu/resources/
New Hampshire Homeowner’s Guide to Stormwater Management: Do-It-Yourself Stormwater Solutions for Your Home. March 2011. New Hampshire Department of Environmental Services. 29 Hazen Drive. Concord NH 03301. http://des.nh.gov/organization/commissioner/pip/publications/wd/documents/wd-11-11.pdf
xiii
TABLE OF CONTENTS
PREFACE ............................................................................................................................. I
ACKNOWLEDGMENTS .................................................................................................... II
GREAT EAST LAKE - 2013 EXECUTIVE SUMMARY ............................................... IV
COMMENTS AND RECOMMENDATIONS ............................................................. VIII 10 Recommendations for Healthy Lakeshore and Streamside Living ............... x
TABLE OF CONTENTS ................................................................................................ XIII
REPORT FIGURES ......................................................................................................... XV
INTRODUCTION ................................................................................................................ 1 The New Hampshire Lakes Lay Monitoring Program ........................................... 1 Importance of Long-term Monitoring ....................................................................... 2 Purpose and Scope of This Effort ............................................................................... 4
CLIMATIC SUMMARY - 2013 ........................................................................................... 5 Water Quality and the Weather .................................................................................. 5
Precipitation (2013) ........................................................................................................ 6 Temperature (2013) ........................................................................................................ 7
Water Quality Impacts .................................................................................................. 8 Water Transparency and Dissolved “tea” Colored Water ............................................ 8 Sediment Loading ........................................................................................................... 9 Nutrient Loading .......................................................................................................... 10 Microscopic “Algal” and Macroscopic “Weed” Plant Growth ...................................... 10
DISCUSSION OF LAKE AND STREAM MONITORING MEASUREMENTS ....... 12 Thermal Stratification in the Deep Water Sites .................................................... 12 Water Transparency .................................................................................................... 12 Chlorophyll a ................................................................................................................. 12 Turbidity * ...................................................................................................................... 13 Dissolved Color ............................................................................................................. 13 Total Phosphorus ......................................................................................................... 14 Soluble Reactive Phosphorus * ................................................................................. 14 Streamflow ..................................................................................................................... 15 pH * .................................................................................................................................. 15 Alkalinity ........................................................................................................................ 15 Specific Conductivity * ............................................................................................... 16 Sodium and Chloride * ................................................................................................ 16 Dissolved Oxygen and Free Carbon Dioxide * ...................................................... 16 Underwater Light * ...................................................................................................... 17 Indicator Bacteria * ..................................................................................................... 17 Phytoplankton * ............................................................................................................ 18 Zooplankton * ................................................................................................................ 18 Macroinvertebrates * ................................................................................................... 19 Cyanobacteria (optional program) ........................................................................... 19
UNDERSTANDING LAKE AGING (EUTROPHICATION) ....................................... 21 How can you minimize your water quality impacts? ........................................... 23
xiv
LAKE FRIENDLY LAWN CARE .................................................................................... 25
GO WITH THE FLOW: UNDERSTANDING HOW WATER MOVES ONTO, THROUGH AND AWAY FROM YOUR HOUSE SITE ......................................... 28
Common Runoff Control Strategies ......................................................................... 29 Typical Techniques used to control runoff ............................................................ 29 Following the flow ........................................................................................................ 30 Investigate the drainageways ................................................................................... 30 Investigate onsite runoff generation ....................................................................... 30 Minimize and divert runoff ........................................................................................ 31 Structural approaches ................................................................................................ 33 Making a Difference .................................................................................................... 34
TOXIC CYANOBACTERIA - WHAT’S THE STORY? ................................................. 35 Beneficial algae differ from toxin-producing cyanobacteria ............................ 35 Potential human health effects from exposure to cyanotoxins ........................ 35 Stay vigilant ................................................................................................................... 35 Learn more ..................................................................................................................... 36
REFERENCES .................................................................................................................. 37
REPORT FIGURES .......................................................................................................... 42
APPENDIX A: 2013 GREAT EAST LAKE SEASONAL GRAPHS .......................... A-1
APPENDIX B: GREAT EAST LAKE TREND GRAPHS ........................................... B-1
APPENDIX C: GREAT EAST LAKE WATER QUALITY PROFILES (2013) ....... C-1
APPENDIX D: 2013 GREAT EAST LAKE DATA LISTING .................................... D-1
APPENDIX E: GLOSSARY OF LIMNOLOGICAL TERMS ..................................... E-1

xv
REPORT FIGURES
Figure 1. LLMP Objectives .................................................................................................. 1
Figure 2. National LLMP Support to Volunteer Monitoring Programs ............................ 2
Figure 3. Algal Standing Crop: 1988-1992 ......................................................................... 3
Figure 4. Algal Standing Crop: 1986-1995 ......................................................................... 4
Figure 5. Monthly Precipitation (1979-2013) ..................................................................... 6
Figure 6. Monthly Temperature (1984-2013) ..................................................................... 7
Figure 7. Monthly Snowfall (1982-2013) ............................................................................ 8
Figure 8. Typical Temperature Conditions: Summer ...................................................... 12 Figure 9. Location of the 2013 Great East Lake deep sampling stations, 1 Center, 2
Canal, 2nd Basin, and 3 Maine Mann, Wakefield, New Hampshire and Acton, Maine. ......................................................................................................................................... 42

1
Table 8. Awards & Recognition
1983- NH Environmental Law Council Award 1984- Governor’s Volunteer Award 1985- CNN Science & Technology Today 1988- Governor’s “Gift” award funded 1990- NH Journal TV coverage NHPTV 1991- Renew America Award Environmental Success Index White House Reception / Briefing 1992- EPA Administrators Award 1993- NH Lakes Association Award 1994- EPA Office of Watersheds Award 1995- Winnipesaukee Watershed Project 1998- Governor’s Proclamation for 20th Anniversary 1999- EPA Watershed Academy Host 2001- Lake Chocorua Project highlighted at national
conferences (invited presentations) 2002- Chocorua Project receives Technical Excellence Award from the
North American Lake Management Society 2003- UNH CE Maynard and Audrey Heckel Extension Fellowship
awarded to LLMP 2004- Participatory Research Model of NH LLMP highlighted at Na-
tional Water Quality Monitoring Conference 2005- LLMP Coordinator J. Schloss receives the prestigious Secchi
Disk Award from the North American Lakes Management Socie-ty
2007- Lake friendly landscaping manual introduced receives praise from New Hampshire agencies and waterfront landowners.
2008- NH LLMP’s 30th year of sampling NH lakes! 2009- EPA Equipment support grant to the NH LLMP. 2010- NH LLMP becomes first citizen program to monitor cyanotoxins 2013 NH LLMP pilots a new volunteer monitor cyanobacteria monitor-
ing option.
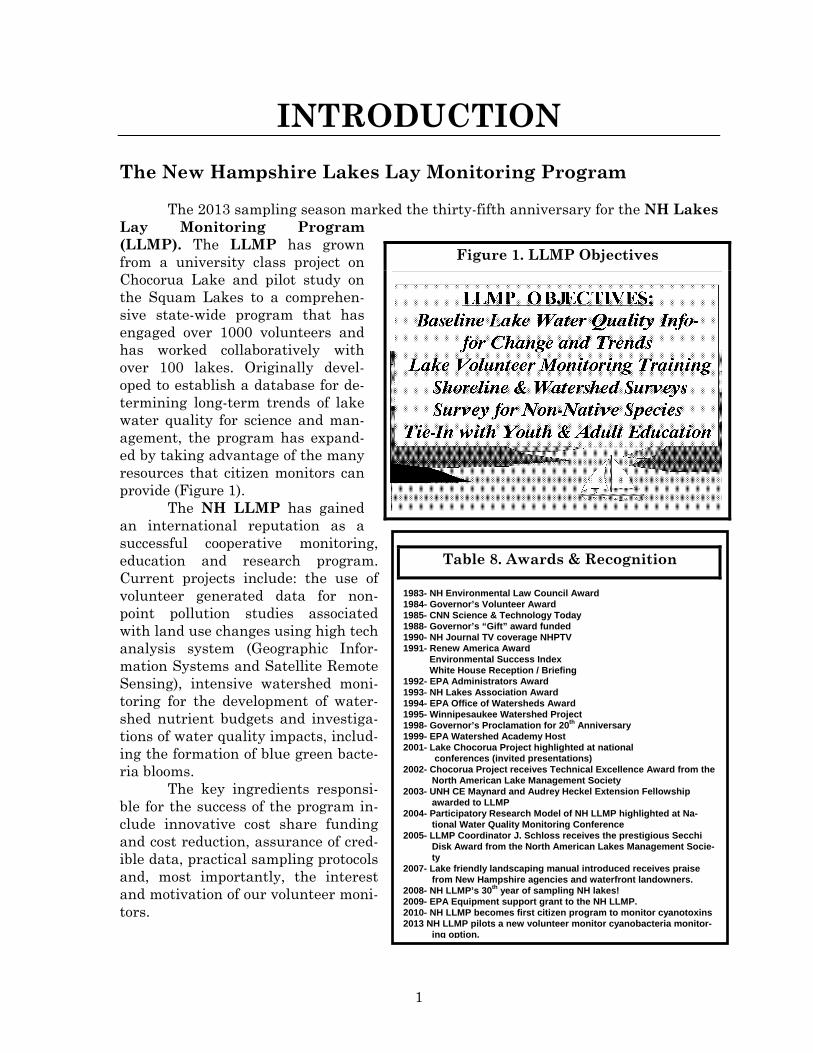
INTRODUCTION
The New Hampshire Lakes Lay Monitoring Program The 2013 sampling season marked the thirty-fifth anniversary for the NH Lakes Lay Monitoring Program (LLMP). The LLMP has grown from a university class project on Chocorua Lake and pilot study on the Squam Lakes to a comprehen-sive state-wide program that has engaged over 1000 volunteers and has worked collaboratively with over 100 lakes. Originally devel-oped to establish a database for de-termining long-term trends of lake water quality for science and man-agement, the program has expand-ed by taking advantage of the many resources that citizen monitors can provide (Figure 1). The NH LLMP has gained an international reputation as a successful cooperative monitoring, education and research program. Current projects include: the use of volunteer generated data for non-point pollution studies associated with land use changes using high tech analysis system (Geographic Infor-mation Systems and Satellite Remote Sensing), intensive watershed moni-toring for the development of water-shed nutrient budgets and investiga-tions of water quality impacts, includ-ing the formation of blue green bacte-ria blooms.
The key ingredients responsi-ble for the success of the program in-clude innovative cost share funding and cost reduction, assurance of cred-ible data, practical sampling protocols and, most importantly, the interest and motivation of our volunteer moni-tors.
Figure 1. LLMP Objectives

2
The 2013 sampling season was another exciting year for the New Hampshire Lakes Lay Monitoring Program. National recognition for the high quality of work by you, the volunteer monitors, cul-minated with program awards, requests for pro-gram information and in-vitations to speak at na-tional conferences (Table 8).
Our active collabo-ration with the UNH Cen-ter for Freshwater Biology continues to drive rele-vant applied research: The CFB continues to be involved in supporting the zooplankton analysis for regional and national lake surveys conducted by the Environmental Protection Agency.
We continue the research initiated by collaborators Dr. John Sasner and Dr. Jim Haney focusing on how watershed development and our activities on the landscape play a role in creating potentially toxic plankton blooms. Analogous to the ‘red tide” of estu-aries, certain blue-green bacteria (microscopic bacteria that are very much like algae) can produce toxins that are health risks to animals and humans.
Additional ongoing research is focusing on the use of satellite and aerial imagery as well as on-lake optical devices as a means of determining the water transparency and amount of microscopic plant “algal” growth in our New Hampshire Lakes, particularly blue green algae. Water quality data, collected by the volunteer monitors, have served as ground truthed data to assess whether or not the satellite imagery shows promise. Data generated through this project have been presented at national conferences and are testament to the high quality data generated by our volunteer monitors.
Interest in the success of our NH LLMP participatory science research model has resulted in invited presentations at national conferences and provided the basis of a se-ries of articles in the “Volunteer Monitor”, the national newsletter with a distribution of over 10,000. To date, the approach and methods of the NH LLMP have been adopted by new or existing programs in twenty-four states and eleven countries (Figure 2)!
Importance of Long-term Monitoring
A major goal of our monitoring program is to identify any short or long-term changes in the water quality of the lake. Of major concern is the detection of cultural eutrophication: increases in the productivity of the lake, the amount of algae and plant growth, due to the addition of nutrients from human activities. Changes in the natural buffering capacity of the lakes in the program is also a topic of great concern, as New
Figure 2. National LLMP Support to Volunteer Monitoring Programs
3
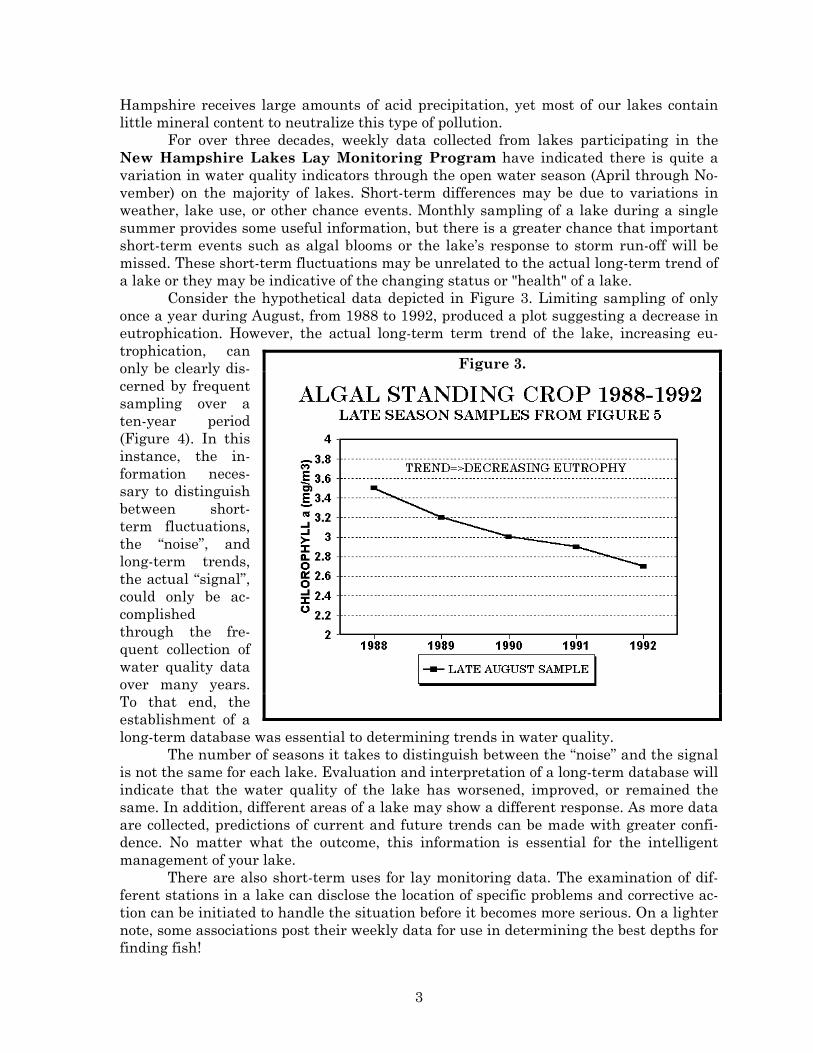
Hampshire receives large amounts of acid precipitation, yet most of our lakes contain little mineral content to neutralize this type of pollution. For over three decades, weekly data collected from lakes participating in the New Hampshire Lakes Lay Monitoring Program have indicated there is quite a variation in water quality indicators through the open water season (April through No-vember) on the majority of lakes. Short-term differences may be due to variations in weather, lake use, or other chance events. Monthly sampling of a lake during a single summer provides some useful information, but there is a greater chance that important short-term events such as algal blooms or the lake’s response to storm run-off will be missed. These short-term fluctuations may be unrelated to the actual long-term trend of a lake or they may be indicative of the changing status or "health" of a lake. Consider the hypothetical data depicted in Figure 3. Limiting sampling of only once a year during August, from 1988 to 1992, produced a plot suggesting a decrease in eutrophication. However, the actual long-term term trend of the lake, increasing eu-trophication, can only be clearly dis-cerned by frequent sampling over a ten-year period (Figure 4). In this instance, the in-formation neces-sary to distinguish between short-term fluctuations, the “noise”, and long-term trends, the actual “signal”, could only be ac-complished through the fre-quent collection of water quality data over many years. To that end, the establishment of a long-term database was essential to determining trends in water quality. The number of seasons it takes to distinguish between the “noise” and the signal is not the same for each lake. Evaluation and interpretation of a long-term database will indicate that the water quality of the lake has worsened, improved, or remained the same. In addition, different areas of a lake may show a different response. As more data are collected, predictions of current and future trends can be made with greater confi-dence. No matter what the outcome, this information is essential for the intelligent management of your lake. There are also short-term uses for lay monitoring data. The examination of dif-ferent stations in a lake can disclose the location of specific problems and corrective ac-tion can be initiated to handle the situation before it becomes more serious. On a lighter note, some associations post their weekly data for use in determining the best depths for finding fish!
Figure 3.

4
Often times it seems that one week's data is not dif-ferent from the next week’s data, but eve-ry sampling provides important infor-mation on the varia-bility of the lake. It takes a considera-ble amount of effort as well as a deep con-cern for one's lake to be a volunteer in the NH Lakes Lay Mon-itoring Program. Many times a moni-tor has to brave in-clement weather or heavy boat traffic to collect samples. We are pleased with the interest and commitment of our Lay Monitors and are proud that their work is what makes the NH LLMP the most extensive, and we believe, the best volunteer program of its kind.
Purpose and Scope of This Effort
The primary purpose of annual lake reporting is to discuss results of the current monitoring season with emphasis on current conditions of New Hampshire lakes, in-cluding the extent of eutrophication and the lakes’ susceptibility to increasing acid pre-cipitation. If you have additional water quality concerns, we advise the lake association to contact our program staff to discuss additional monitoring options. When applicable we also strive to place the recent results into a historical context using past NH LLMP data as well as historical data from other sources. This information is part of a large da-ta base of historical and more recent data compiled and entered onto our computer files for New Hampshire lakes that include New Hampshire Fish and Game surveys of the 1930’s through the 1950’s, the surveys conducted by the New Hampshire Water Supply and Pollution Control Commission and the UNH CFB/FBG surveys. However, care must be taken when comparing current results with early studies. Many complications arise due to methodological differences of the various analytical facilities and technolog-ical improvements in testing.
Figure 4
5
Climatic Summary - 2013
Water Quality and the Weather
Water quality variations are commonly observed over the course of the year and among years in our New Hampshire lakes, ponds, wetlands and streams. The most commonly noticed changes are those associated with decreasing water clarities, increasing algal growth (greenness), and increasing plant growth around the lake’s periphery. Over the long haul, changes such as these are attributed to a lake’s natural aging process that is referred to as eutrophication. However, short-term water quality changes such as those mentioned above are often encountered even in our most pristine lakes and ponds. These water quality changes often coincide with variations in weather patterns such as precipitation and temperature fluctuations as well as variations, in sunlight intensity which can accelerate or suppress the photosynthetic process.
Climatic “swings” can have a profound effect on water quality, both posi-tive and negative. For instance, 2008 was a wet year relative to other years of LLMP water quality monitoring. The wet conditions translated into reduced water clarities, elevated microscopic plant “algal” growth and increased total phosphorus concentrations for most participating LLMP lakes. “Excessive” runoff associated with wet periods often facilitates the transport of pollutants such as nutrients (including phosphorus), sediment, dissolved colored compounds, as well as toxic materials such as herbicides, automotive oils, etc. into water bodies. As a result, lakes often respond with shallower water clarities and elevated algal abundance (greenness) during these periods that is supported by historical monitoring through the NH LLMP. Similarly, short-term storm events can have a substantial effect on the water quality. Take, for instance, Tropical Strom Irene (August 30, 2011) that moved through New Hampshire and included intense periods of rainfall in excess of one inch per hour. The water quality monitoring that followed Irene consistently documented significantly reduced water transparency measurements, relative to measurements recorded prior to Irene. While events such as these are short lived, they can affect our water quality in the weeks to months that follow, particularly when nutrients that stimulate plant growth are retained in the lake. These intense rainfall events emphasize the importance of adequate stormwater management practices that minimize the erosion, sediment and nutrient runoff that are commonly associated with intense storm events.
NH LLMP data collected during dry years such as 1985 and 2001, on the other hand, have coincided with improved water quality for many New Hamp-shire lakes. Dry years, characterized by reduced pollutant transport into the lakes, oftentimes correspond to higher water quality measured as deeper water

6
transparencies, lower microscopic plant “algae” concentrations and lower nutri-ent concentrations.
Do all lakes experience poorer water quality as a result of heavy precipita-tion events? Simply stated, the answer is no. While most New Hampshire lakes are characterized by reduced water clarities, increased nutrients and elevated plant “algal” concentrations following periods, or years of heavy precipitation, a handful of lakes actually benefit from these types of events. The water bodies that improve during wet periods are generally lakes characterized by high nutri-ent concentrations and high “algal” concentrations that are diluted by watershed runoff and thus benefit during periods, or years of heavy rainfall. However, these nutrient enriched lakes remain more susceptible to nutrients entering the lake from seepage sources such as poorly functioning septic systems. The few NH lakes and ponds that do not have significant surface inflows and outflows may also show water quality improvement in wet years due to greater flushing by groundwater seepage.
Precipitation (2013)
The 2013 annual precipitation (reported as “rainfall” water equivalent) measured 42.90 inches and was approximately one inch below the 35th year, (1979-2013) average of 43.69 inches (note: precipitation data are reported for the Lakeport 2 Climatological sampling station located in Laconia New Hampshire: 43o33’N and 71o28’W). Generally speaking, precipitation was below average over the span of January through April, 2013 (Figure 5). On the other hand, the rain-fall was significantly above average during the months of May, June and July followed by a return to below average precipitation in August, September and October. November and December precipitation levels closed out the calendar
7
year at near normal levels (Figure 5).
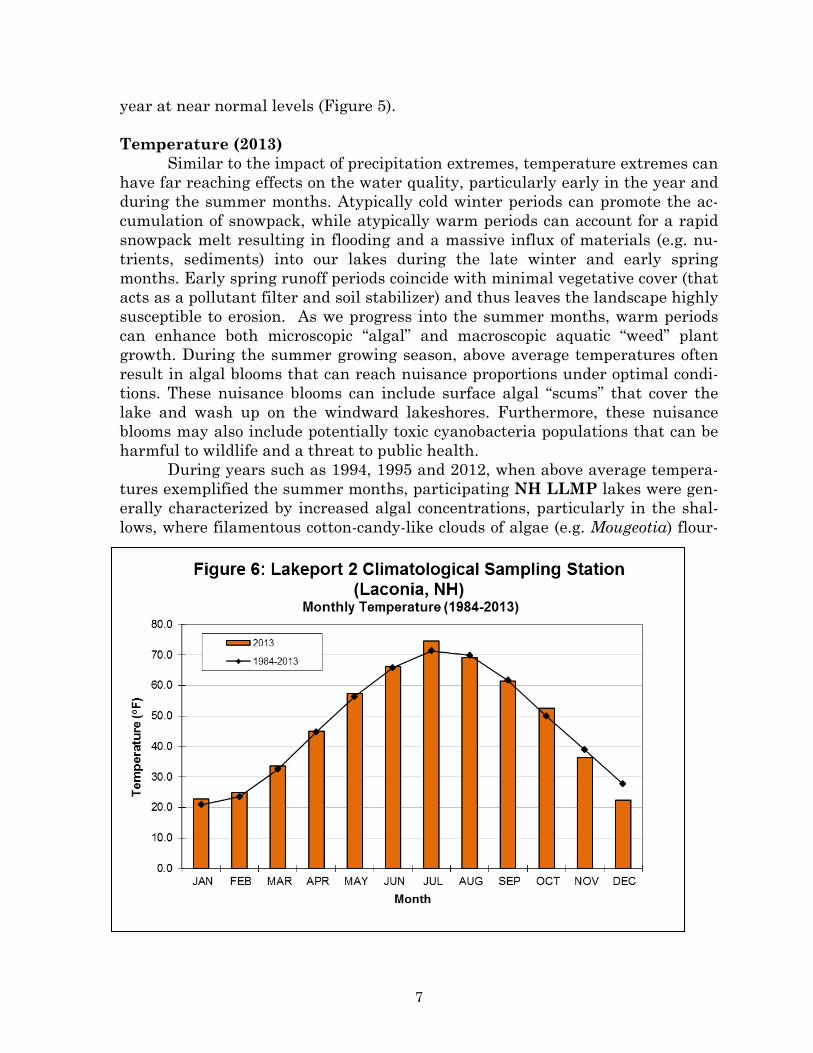
Temperature (2013) Similar to the impact of precipitation extremes, temperature extremes can
have far reaching effects on the water quality, particularly early in the year and during the summer months. Atypically cold winter periods can promote the ac-cumulation of snowpack, while atypically warm periods can account for a rapid snowpack melt resulting in flooding and a massive influx of materials (e.g. nu-trients, sediments) into our lakes during the late winter and early spring months. Early spring runoff periods coincide with minimal vegetative cover (that acts as a pollutant filter and soil stabilizer) and thus leaves the landscape highly susceptible to erosion. As we progress into the summer months, warm periods can enhance both microscopic “algal” and macroscopic aquatic “weed” plant growth. During the summer growing season, above average temperatures often result in algal blooms that can reach nuisance proportions under optimal condi-tions. These nuisance blooms can include surface algal “scums” that cover the lake and wash up on the windward lakeshores. Furthermore, these nuisance blooms may also include potentially toxic cyanobacteria populations that can be harmful to wildlife and a threat to public health.
During years such as 1994, 1995 and 2012, when above average tempera-tures exemplified the summer months, participating NH LLMP lakes were gen-erally characterized by increased algal concentrations, particularly in the shal-lows, where filamentous cotton-candy-like clouds of algae (e.g. Mougeotia) flour-

8
ished. Other NH LLMP lakes had increased algal growth (greenness) and shal-lower water transparencies during these “hot” periods.
The 2013 monthly average temperatures documented at the Lakeport 2 Climatological sampling station (Figure 6) were within 2 degrees Fahrenheit of the thirty year (1984-2013) monthly averages between January and June. The seasonal February and March temperatures, coupled with several passing storm fronts, culminated in above average February and March snowfall (Figures 6 and 7). The heavy snowfall periods were followed by rising March and April temperatures that coincided with the annual snowpack melt and elevated March and April streamflows. Near-normal monthly temperatures were characteristic of May and June, the monthly July temperature was above normal, while the August and September temperatures returned to near-normal levels (Figure 6). The final three months were characterized by oscillating above to below average temperatures with significantly above average temperatures documented during the month of December (Figure 7).
Water Quality Impacts
Water Transparency and Dissolved “tea” Colored Water As previously mentioned, shallower water transparency readings are
characteristic of most New Hampshire lakes during wet years and following short-term precipitation events. Wet periods often coincide with greater concen-trations of dissolved “tea” colored compounds (dissolved organic matter resulting from the breakdown of vegetation and soils) washed in from surrounding forests and wetlands. Dissolved water color is not indicative of water quality problems (although large increases in dissolved color sometimes follow large land clearing

9
operations), however, in some of our more pristine program lakes, it neverthe-less has a large effect on water clarity changes. Data collected by the Center for Freshwater Biology (CFB) since 1985 indicate most lakes are characterized by higher dissolved “tea” colored water during wet years relative to years more typical in terms of annual precipitation levels. In some of our more highly “tea” colored lakes the early spring months are also characterized by higher dissolved color concentrations, relative to mid-summer levels, due to the heavy runoff pe-riods that flush highly colored water into our lakes during the period of spring snowmelt and following heavy spring rains. Sediment Loading
As sediments settle out of the water column they can smother bottom dwelling aquatic organisms and fish spawning habitat. As the dead materials begin to decay, the result can be noxious odors as well as stimulation of nuisance plant growth (i.e. scums along the lake-bottom; new macroscopic plant growth). Note: one should keep in mind that nuisance plants such as variable water mil-foil (Myriophyllum heterophyllum) will generally regenerate more rapidly than more favorable plant forms. This can result in more problematic weed beds than those present before the disturbance. Habitat changes associated with the accu-mulation of fine sediments and associated “muck” might also favor increased nuisance plant growth in the future. Another unfavorable attribute of sediment loading is that the sediments tend to carry with them other forms of contami-nants such as pathogens, nutrients and toxic chemicals (i.e. herbicides and pes-ticides). Early symptoms of excessive sediment runoff include deposits of fine ma-terial along the lake-bottom, particularly in close proximity to tributary inlets and disturbed regions previously discussed (i.e. construction sites, logging sites,
Sediments are continuously flushed into our lakes and ponds during periods of heavy watershed runoff, particularly during snowmelt and againduring and following sporadic storm events that occur in the summer and fallmonths. Many New Hampshire lakes experience water clarity decreasesfollowing storm events, such as those described above. Lakes, ponds and riversare particularly susceptible to sediment loadings in the early spring monthswhen vegetated shoreline buffers, often referred to as riparian buffers, arereduced. With limited vegetation to trap sediments and suspended materials, a high percentage of the particulate debris and dissolved materials are flushedinto the lake. Human activities such as logging, agriculture, construction andother land clearing can also increase sediment displacement during and following heavy storm events throughout the year. As sediment is transportedinto surface waters it can degrade water quality in a number of ways. When finesediments (silt) enter a lake they tend to remain in the water column forrelatively long periods of time. These suspended sediments can be abrasive tofish gills, ultimately leading to fish kills. Suspended sediments also reduce theavailable light necessary for plant growth that can result in plant die-offs and the subsequent oxygen depletion under extreme conditions.
10
etc.). Silt may be visible covering rocks or aquatic vegetation along the lake-bottom. During periods of heavy overland runoff the water might appear brown and turbid which reflects the sediment load. As material collects along the lake-bottom one might notice a change in the weed composition reflecting a change in the substrate type (note: aquatic plants will display natural changes in abun-dance and distribution, so be careful not to jump to hasty conclusions). If exces-sive sediment loading is suspected, take a closer look in these areas and assess whether or not the change is associated with sediment loading (look for the warning signs discussed above) or whether the changes might be attributable to other factors. Nutrient Loading
Microscopic “Algal” and Macroscopic “Weed” Plant Growth Historical Lakes Lay Monitoring Program data indicate most lakes experience "algal blooms" during years with above average summer tempera-tures (June, July and August), while years with heavy precipitation are also as-sociated with an increased frequency and occurrence of “algal blooms.” Algal blooms are often green water events associated with decreases in water clarity due to their ability to absorb and scatter light within the water column, but can also accumulate near the lake bottom in shallow areas as "mats" or on the water surface as "scums" and "clouds." During some years, such as 1996, the “algal blooms” are predominantly green water events composed of algae distributed within the water column. New Hampshire lakes were particularly susceptible to algal blooms in 1996 as a function of the heavy runoff associated with an atypi-cally wet year. Wet years such as 1996 can be particularly hard on lakes where excessive fertilizer applications, agricultural practices and construction activi-ties favor the displacement of nutrients into surface waters. The occasional for-mation of certain algal blooms is a naturally occurring phenomenon and is not necessarily associated with changes in lake productivity. However, increases in the occurrence of bloom conditions can be a sign of eutrophication (the "green-ing" of a lake). Shifts from benign (clean water) forms to nuisance (polluted wa-ter) cyanobacterial forms such as Anabaena, Aphanizomenon and Oscillatoria, can be a warning sign that improper land use practices are contributing exces-sive nutrients into the lake.
Nutrient loading is often greatest during heavy precipitation events,particularly during the periods of heavy watershed runoff. Phosphorus is generally considered the limiting nutrient for excessive plant and algal growthin New Hampshire lakes. Elevated phosphorus concentrations are typically most evident in tributary inlets where nutrients are concentrated in a relatively small volume of water. Much of the phosphorus entering our lakes is attached toparticulate matter (i.e. sediments, vegetative debris), but may also includedissolved phosphorus associated with fertilizer applications and septic systemdischarge.

11
Filamentous cotton-candy-like "clouds" of the nuisance green algae, Mougeotia and related species have been well documented in 1994, 1995 and 2012 when the temperatures during the months of June and July were well above normal. These algal “clouds” often develop within nearshore weed beds where they can be seen along the lake-bottom and tend to flourish during warm periods. During cooler years, this type of algal growth is kept “in check” and generally does not reach nuisance proportions. In other lakes, metalimnetic al-gae, algae which tend to grow in a thin layer along the thermocline gradient in a lake's middle depths, sometimes migrate up towards the lake surface causing a "bloom" event. If these algae are predominantly "nuisance" forms, like certain green or blue-green algae, they can be an early indication of nutrient loading.

12
DISCUSSION OF LAKE AND STREAM MONITORING
MEASUREMENTS
The section below details the important concepts involved for the various testing proce-dures used in the New Hampshire Lakes Lay Monitoring Program. Certain tests or sampling performed at the time of the optional Center for Freshwater Biology field trip are indicated by an asterisk (*).
Thermal Stratification in the Deep Water Sites Lakes in New Hampshire display distinct patterns of temperature stratifi-cation, that develop as the summer months progress, where a layer of warm-er water (the epilimnion) overlies a deeper layer of cold water (hypolimni-on). The layer that separates the two re-gions characterized by a sharp drop in temperature with depth is called the thermocline or metalimnion (Figure 8). Some shallow lakes may be continual-ly mixed by wind action and will never stratify. Other lakes may only contain a developed epilimnion and metalimnion before reaching the lakebottom.
Water Transparency
Secchi Disk depth is a measure of the water transparency. The deeper the depth of Secchi Disk disappearance to the observer, the more transparent the lake water; light penetrates deeper if there is little dissolved and/or particulate matter (which includes both living and non-living particles) to absorb and scatter it. In the shallow areas of many lakes, the Secchi Disk will hit bottom before it is able to disappear from view (what is referred to as a "Bottom Out" condition). Thus, Secchi Disk measurements are generally taken over the deepest sites of a lake. Trans-parency values greater than 4 meters are typical of clear, unproductive lakes while transparency values less than 2.5 meters are generally an indication of highly produc-tive lakes. Water transparency values between 2.5 meters and 4 meters are generally considered indicative of moderately productive lakes.
Chlorophyll a
The chlorophyll a concentration is a measurement of the standing crop of phyto-plankton and is often used to classify lakes into categories of productivity called trophic
Figure 8.

13
states. Eutrophic lakes are highly productive with large concentrations of algae and aquatic plants due to nutrient enrichment. Characteristics include accumulated organic matter in the lake basin and lower dissolved oxygen in the bottom waters. Summer chlorophyll a concentrations average above 7 milligrams chlorophyll per cubic meter of water (mg m3), equivalent to 7 parts chlorophyll a per billion parts water (ppb) or 7 mi-crograms chlorophyll per liter of water (µg/L). Oligotrophic lakes have low productivity and low nutrient levels and average summer chlorophyll a concentrations that are gen-erally less than 3 mg m3. These lakes generally have cleaner bottoms and high dissolved oxygen levels throughout. Mesotrophic lakes are intermediate in productivity with concentrations of chlorophyll a generally between 3 mg m3 and 7 mg m3. Testing is sometimes done to check for metalimnetic algal populations, algae that layer out at the thermocline (metalimnion) and generally go undetected if only epilimnetic (point or integrated) sampling is undertaken. Chlorophyll concentrations of a water sample col-lected in the thermocline by volunteers or CFB staff is often compared to the integrated epilimnetic sample. Greater chlorophyll levels of that point sample, in conjunction with microscopic examination of the samples (see Phytoplankton section below), can confirm the presence of such a population of algae and if they are a nuisance species. These pop-ulations should be carefully monitored as they may be an early indication of increased nutrient loading into the lake.
Turbidity *
Turbidity is a measure of suspended material in the water column such as sedi-ments and planktonic organisms. The greater the turbidity of a given water body the lower the Secchi Disk transparency and the greater the amount of particulate matter present. Turbidity is measured as nephelometric turbidity units (NTU), a standardized method among researchers. Turbidity levels are generally low in New Hampshire re-flecting the pristine condition of the majority of our lakes and ponds. Increasing turbidi-ty values can be an indication of increasing lake productivity or can reflect improper land use practices within the watershed which destabilize the surrounding landscape and allow sediment runoff into the lake. While Secchi Disk measurements will integrate the clarity of the water column from the surface waters down to the depth of disappearance, turbidity measurements are collected at discrete depths from the surface down to the lake bottom. Such discrete sampling can identify layering algal populations (previously discussed) that are general-ly undetectable when measuring Secchi Disk transparency alone.
Dissolved Color
The dissolved color of lakes is generally due to dissolved organic matter from humic substances, which are naturally-occurring polyphenolic compounds leached from decayed vegetation. Highly colored or "stained" lakes have a "tea" color. Such sub-stances generally do not threaten water quality except as they diminish sunlight pene-tration into deep waters. Increases in a lake’s typical level of dissolved watercolor can be an indication of increased development within the watershed as many land clearing ac-tivities (construction, deforestation, and the resulting increased run-off) add additional organic material to lakes. Natural fluctuations of dissolved color occur when storm events increase drainage from wetlands areas within the watershed. As suspended sed-

14
iment is a difficult and expensive test to undertake, both dissolved color and chlorophyll information are important when interpreting the Secchi Disk transparency to infer whether or not significan suspended sediment may be present. Dissolved color is measured on a comparative scale that uses standard chloro-platinate dyes and is designated as a color unit or ptu. Lakes with color below 10 ptu are very clear, 10 to 20 ptu are slightly colored, 20 to 40 ptu are lightly tea colored, 40 to 80 ptu are tea colored and greater than 80 ptu indicates highly colored waters. General-ly the majority of New Hampshire lakes have color between 20 to 30 ptu.
Total Phosphorus
Of the two "nutrients" most important to the growth of aquatic plants, nitrogen and phosphorus, it is generally observed that phosphorus is the more limiting to plant growth in lakes, and therefore the more important to monitor and control. Phosphorus is generally present in lower concentrations, and its sources arise primarily through human related activity in a watershed. Nitrogen can be fixed from the atmosphere by many bloom-forming blue-green bacteria, and thus it is difficult to control. The total phosphorus includes all dissolved phosphorus as well as phosphorus contained in or ad-hered to suspended particulates such as sediment and plankton. As little as 10 parts per billion (ppb) or 10 micrograms per liter (µg/L) of phosphorus in a lake can cause an algal bloom. Generally, in the more pristine lakes, phosphorus values are higher after spring melt when the lake receives the majority of runoff from its surrounding watershed. The nutrient is used by the algae and plants which in turn die and sink to the lake bottom causing surface water phosphorus concentrations to decrease as the summer progresses. Lakes with nutrient loading from human activities and sources (agriculture, logging, sediment erosion, septic systems, etc.) will show greater concentrations of nutrients as the summer progresses or after major storm events.
Soluble Reactive Phosphorus *
Soluble reactive phosphorus is a fraction of the (total) phosphorus that consists largely of orthophosphate, the form of phosphorus that is directly taken up by algae and that stimulates growth. Soluble reactive phosphorus is obtained by filtering a water sample through a fine mesh filter, generally a 0.45 micron membrane filter, which effec-tively removes the particulate matter from the sample. Soluble reactive phosphorus concentrations are thus less than, or equal to, the measured total phosphorus concen-trations for a water sample. Soluble reactive phosphorus typically occurs in trace concentrations while appli-cations of fertilizers as well as septic system effluent can be associated with elevated concentrations. Knowledge of both the total phosphorus and the soluble reactive phos-phorus is important to understanding the sources of phosphorus into a lake and to un-derstanding the lake’s response to the phosphorus loading. For instance, a lake experi-encing soluble reactive phosphorus runoff from a fertilized field may exhibit immediate water quality decline (i.e. increased algal growth) while lakes experiencing elevated to-tal phosphorus concentrations associated with sediment washout may not exhibit clear symptoms of increased nutrient loading for months to years.
15
Streamflow
Streamflow, when collected in conjunction with stream channel information, is a measure of the volume of water traversing a given stream stretch over a period of time and is often expressed as cubic meters per second. Knowledge of the streamflow is im-portant when determining the amount of nutrients and other pollutants that enter a lake. Knowledge of the streamflow in conjunction with nutrient concentrations, for in-stance, will provide the information necessary to calculate phosphorus loading values and will in turn be useful in discerning the more impacted areas within a watershed.
pH *
The pH is a way of expressing the acidic level of lake water, and is generally measured with an electrical probe sensitive to hydrogen ion activity. The pH scale has a range of 1 (very acidic) to 14 (very "basic" or alkaline) and is logarithmic (i.e.: changes in 1 pH unit reflect a ten times difference in hydrogen ion concentration). Most aquatic or-ganisms tolerate a limited range of pH and most fish species require a pH of 5.5 or higher for successful growth and reproduction.
Alkalinity
Alkalinity is a measure of the buffering capacity of the lake water. The higher the alkalinity value, the more acid that can be neutralized. Typically lakes in New Hampshire have low alkalinities due to the absence of carbonates and other natural buffering minerals in the bedrock and soils of lake watersheds. Decreasing alkalinity over a period of a few years can have serious effects on the lake ecosystem. In a study on an experimental acidified lake in Canada, performed by Schindler and his colleagues in 1985, gradual lowering of the pH from 6.8 to 5.0 in an 8-year period resulted in the disappearance of some aquatic species, an increase in nui-sance species of algae and a decline in the condition and reproduction rate of fish. Dur-ing the first year of Schindler's study the pH remained unchanged while the alkalinity declined to 20 percent of the pre-treatment value. The decline in alkalinity was suffi-cient to trigger the disappearance of zooplankton species, which in turn caused a decline in the "condition" of fish species that fed on the zooplankton. The analysis of alkalinity employed by the Center for Freshwater Biology includes use of a dilute titrant allowing an order of magnitude greater sensitivity and precision than the standard method. Two endpoints are recorded during each analysis. The first endpoint (gray color of dye; pH endpoint of 5.1 ) approximates low level alka-linity values that are comparable to the currently preferred Acid Neutralizing Capacity (ANC) test results, while the second endpoint (pink dye color; pH endpoint of 4.6) ap-proximates alkalinity values that are similar to those recorded historically, such as NH Fish and Game data, with the methyl-orange endpoint method. The average alkalinity of lakes throughout New Hampshire is low, approximate-ly 6.5 mg per liter (calcium carbonate alkalinity). When alkalinity falls below 2 mg per liter the pH of waters can greatly fluctuate. Alkalinity levels are most critical in the spring when acid loadings from snowmelt and run-off are high, and many aquatic spe-cies are in their early, and most susceptible, stages of their life cycle.

16
Specific Conductivity *
The specific conductance of a water sample indicates concentrations of dissolved salts. Leaking septic systems and deicing salt runoff from highways can cause high con-ductivity values. Fertilizers and other pollutants can also increase the conductivity of the water. Conductivity is measured in micromhos (the opposite of the measurement of resistance ohms) per centimeter, more commonly referred to as micro-Siemans (S). Specific conductivity implies the measurements are standardizes to the equivalent room temperature reading as conductivity will increase with increasing temperature.
Sodium and Chloride *
Low levels of sodium and chloride are found naturally in some freshwater and groundwater systems while high sodium and chloride concentrations are characteristic of the open ocean and are elevated in estuarine systems as well. Elevated sodium and chloride concentrations in freshwater or groundwater systems, that exceed the natural baseline concentrations, are commonly associated with the application of road salt. So-dium and particularly chloride are highly mobile and move into the surface and groundwater relatively unimpeded. Sodium and chloride concentrations can become ele-vated during periods of heavy snow pack melt when the salts are flushed into surface waters and have also been observed in elevated concentrations during the summer months when low flow conditions concentrate the sodium and chloride. Road salt runoff is known to adversely impact roadside vegetation as is often-times evidenced by bleached (discolored) leaves and needles and in more extreme in-stances dead trees and shrubs. The United States Environmental Protection Agency (EPA) has set the standard for protection of aquatic life, both plants and animals, at 230 milligrams per liter (mg/l). The EPA has also established a secondary maximum con-taminant level of 250 mg/l for both sodium and chloride, predominantly for taste, while the sodium advisory limit for persons with hypertention is 20 mg/l
Dissolved Oxygen and Free Carbon Dioxide *
Oxygen is an essential component for the survival of aquatic life. Submergent plants and algae take in carbon dioxide and create oxygen through photosynthesis by day. Respiration by both animals and plants uses up oxygen continually and creates carbon dioxide. Dissolved oxygen profiles determine the extent of declining oxygen concentrations in the lower waters. High carbon dioxide values are indicative of low ox-ygen conditions and accumulating organic matter. For both gases, as the temperature of the water decreases, more gas can be dissolved in the water. The typical pattern of clear, unproductive lakes is a slight decline in hypolim-netic oxygen as the summer progresses. Oxygen in the lower waters is important for maintaining a fit, reproducing, cold water fishery. Trout and salmon generally require oxygen concentrations above 5 mg per liter (parts per million) in the cool deep waters. On the other hand, carp and catfish can survive very low oxygen conditions. Oxygen above the lake bottom is important in limiting the release of nutrients from the sedi-ments and minimizing the collection of undecomposed organic matter. Bacteria, fungi and other decomposers in the bottom waters break down organ-ic matter originating from the watershed or generated by the lake. This process uses up
17
oxygen and produces carbon dioxide. In lakes where organic matter accumulation is high, oxygen depletion can occur. In highly stratified eutrophic lakes the entire hypo-limnion can remain unoxygenated or anaerobic until fall mixing occurs. The oxygen peaks occurring at surface and mid-lake depths during the day are quite common in many lakes. These characteristic heterograde oxygen curves are the result of the large amounts of oxygen, the by-product of photosynthesis, collecting in regions of high algal concentrations. If the peak occurs in the thermocline of the lake, metalimnetic algal populations (discussed above) may be present.
Underwater Light *
Underwater light available to photosynthetic organisms is measured with an underwater photometer which is much like the light meter of a camera (only water-proofed!). The photic zone of a lake is the volume of water capable of supporting photo-synthesis. It is generally considered to be delineated by the water's surface and the depth that light is reduced to one percent surface irradiance by the absorption and scat-tering properties of the lake water. The one percent depth is sometimes termed the compensation depth. Knowledge of light penetration is important when considering lake productivity and in studies of submerged vegetation. Discontinuity (abrupt changes in the slope) of the profiles could be due to metalimnetic layering of algae or other par-ticulates (discussed above). The underwater photometer allows the investigator to measure light at depths below the Secchi Disk depth to supplement the water clarity information.
Indicator Bacteria *
Certain disease causing organisms, pathogenic bacteria, viruses and parasites, can be spread through contact with polluted waters. Faulty septic systems, sewer leaks, combined sewer overflows and the illegal dumping of wastes from boats can contribute fecal material containing these pathogens. Typical water testing for pathogens involves the use of detecting coliform bacteria. These bacteria are not usually considered harmful themselves but they are relatively easy to detect and can be screened for quickly. Thus, they make good surrogates for the more difficult to detect pathogens. Total coliform includes all coliform bacteria that arise from the gut of animals or from vegetative materials. Fecal coliform are those specific organisms that inhabit the gut of warm blooded animals. Another indicator organism Fecal streptococcus (sometimes referred to as enterococcus) also can be monitored. The ratio of fecal coli-form to fecal strep may be useful in suggesting the type of animal source responsible for the contamination. In 1991, the State of New Hampshire changed the indicator organ-ism of preference to E. coli which is a specific type of fecal coliform bacteria thought to be a better indicator of human contamination. The new state standard requires Class A “bathing waters” to be under 88 organisms (referred to as colony forming units; cfu) per 100 milliliters of lakewater. Ducks and geese are often a common cause of high coliform concentrations at specific lake sites. While waterfowl are important components to the natural and aes-thetic qualities of lakes that we all enjoy, it is poor management practice to encourage these birds by feeding them. The lake and surrounding area provides enough healthy and natural food for the birds and feeding them stale bread or crackers does nothing

18
more than import additional nutrients into the lake and allows for increased plant growth. As birds also are a host to the parasite that causes "swimmers itch", waterfowl roosting areas offer a greater chance for infestation to occur. Thus while leaving offer-ings for our feathered friends is enticing, the results can prove to be detrimental to the lake system and to human health.
Phytoplankton *
The planktonic community includes microbial organisms that represent diverse life forms, containing photosynthetic as well as non-photosynthetic types, and including bacteria, algae, crustaceans and insect larvae (the insect larvae and zooplankton are discussed below in separate sections). Because planktonic algae or "phytoplankton" tend to undergo rapid seasonal cycles on a time scale of days and weeks, the levels of popula-tions found should be considered to be most representative of the time of collection and not necessarily of other times during the ice-free season, especially the early spring and late fall periods. The composition and concentration of phytoplankton can be indicative of the trophic status of a lake. Seasonal patterns do occur and must be considered. For exam-ple diatoms, tend to be most abundant in April-June and October-November, in the surface or epilimnetic layers of New Hampshire lakes. As the summer progresses, the dominant types might shift to green algae or golden algae. By late season Blue-green bacteria generally dominate. In nutrient rich lakes, nuisance green algae and/or bluegreen bacteria might dominate continually. After fall mixing diatoms might again be found to bloom.
Zooplankton *
There are three groups of zooplankton that are generally prevalent in lakes: the protozoa, rotifers and crustaceans. Most research has been devoted to the last two groups although protozoa may be found in substantial amounts. Of the rotifers and the crustaceans, time and budgetary constraints usually make it necessary to sample only the larger zooplankton (macrozooplankton; larger than 80 or 150 microns; 1 million mi-crons make up a meter). Thus, zooplankton analysis is generally restricted only to the larger crustaceans. Crustacean zooplankton can be very sensitive to pollutants and are commonly used to indicate the presence of toxic substances in water. The crustaceans can be divided into two groups, the cladocerans (which include the "water fleas") and the copepods.
Macrozooplankton are an important component in the lake system. The filter feeding of the herbivorous ("grazing") species may control the population size of selected species of phytoplankton. The larger zooplankton can be an important food source for juvenile and adult planktivorous fish. All zooplankton play a part in the recycling of nu-trients within the lake. Like the phytoplankton, zooplankton, tend to undergo rapid sea-sonal cycles. Thus, the zooplankton population density and diversity should be consid-ered to be most representative of the time of collection and not necessarily of other times during the ice-free season, especially the early spring and late fall periods.
19
Macroinvertebrates *
Macroinvertebrates generally refer to the aquatic insect community living near the bottom substrate (i.e. sediments) while other invertebrate groups such as the cray-fish, leeches and the aquatic worms are also included. Like the phytoplankton and zoo-plankton, previously discussed, the macroinvertebrates undergo seasonal cycles and are most representative of conditions for particular periods of the year. The mayflies are probably the most well known example of a seasonal aquatic macroinvertebrate as may-fly populations metamorphosize into adults as the water temperatures increase in the spring and thus giving rise to the name “mayflies”. Macroinvertebrates are also sensi-tive to environmental conditions such as streamflow, temperature and food availability and are most representative of particular habitats along the stream continuum (i.e. some organisms prefer slower moving stream reaches while others prefer rapidly flow-ing waters). Macroinvertebrates are an essential component to a healthy aquatic habitat. Macroinvertebrates help decompose organic matter entering the system such as leaves and twigs and also serve as a food source for many fish species. While some macroinvertebrates are capable of breathing air as we do, others have gills and utilize oxygen dissolved in the water much as fish do. Macroinvertebrates also vary in their tolerance to depleting dissolved oxygen concentrations making them a good indicator of pollutants coming into the water body. The caddis flies (Trichop-tera), the mayflies (Ephemeroptera) and the stoneflies (Plecoptera) are often considered high-ly sensitive to pollution while the “true” flies (Diptera) are often considered highly toler-ant to pollution. However, exceptions to the above categorizations are often encoun-tered. A variety of indices have been proposed to characterize water bodies over a gra-dient of pollution levels ranging from least polluted to most polluted scenarios and often designated by assigning a numerical delineator (i.e. 1 is least polluted while 10 is most polluted). Such an index, the Hilsenhoff Biotic Index (HBI), or a modification thereof, is commonly used by stream monitoring programs around the country. Macroinvertebrate data are useful in discerning the more impacted areas within the watershed where cor-rective efforts should be directed. Unlike chemical measurements that represent ambi-ent conditions in the water body, the macroinvertebrate community composition inte-grates the water quality conditions over a longer period (months to years) and can iden-tify “hot” spots missed by chemical sampling. If you are interested in more information regarding macroinvertebrate monitoring, particularly for stream sampling, contact the LLMP coordinator.
Cyanobacteria (optional program)
Cyanobacteria, formerly known, as “blue-green algae” are a potentially toxic bac-terium found in all lakes, which become prominent in the summer and fall months when algal “blooms” are present. Cyanobacteria have the ability to dominate over other algae in the water column due to adaptations, such as nitrogen-fixing heterocysts and buoyancy adjustment. The presence of cyanbacteria blooms can decrease overall water quality and produce foul smelling scums when they rise to the surface of the water. Fur-thermore, many species have the potentiality to produce hepatotoxins and neurotoxins such as microcystins and anatoxins, making these organisms a concern for public

20
health. The N.H. Department of Environmental Services posts annual advisories for lakes when levels rise above the threshold that is considered “harmful”. Collecting cyanobacteria water samples throughout the summer and fall months can give insight to how these populations are distributed throughout the seasons and when they are most likely to reach harmful levels. In order to better understand the eco-logical functions of cyanobacteria, qualitative and quantitative analysis, coupled with long-term cyanobacteria data collection, is imperative to identify patterns and changes in populations and the lake’s overall water quality. Short-term results can be used to alert officials and the public when levels are at most risk in terms of public safety.
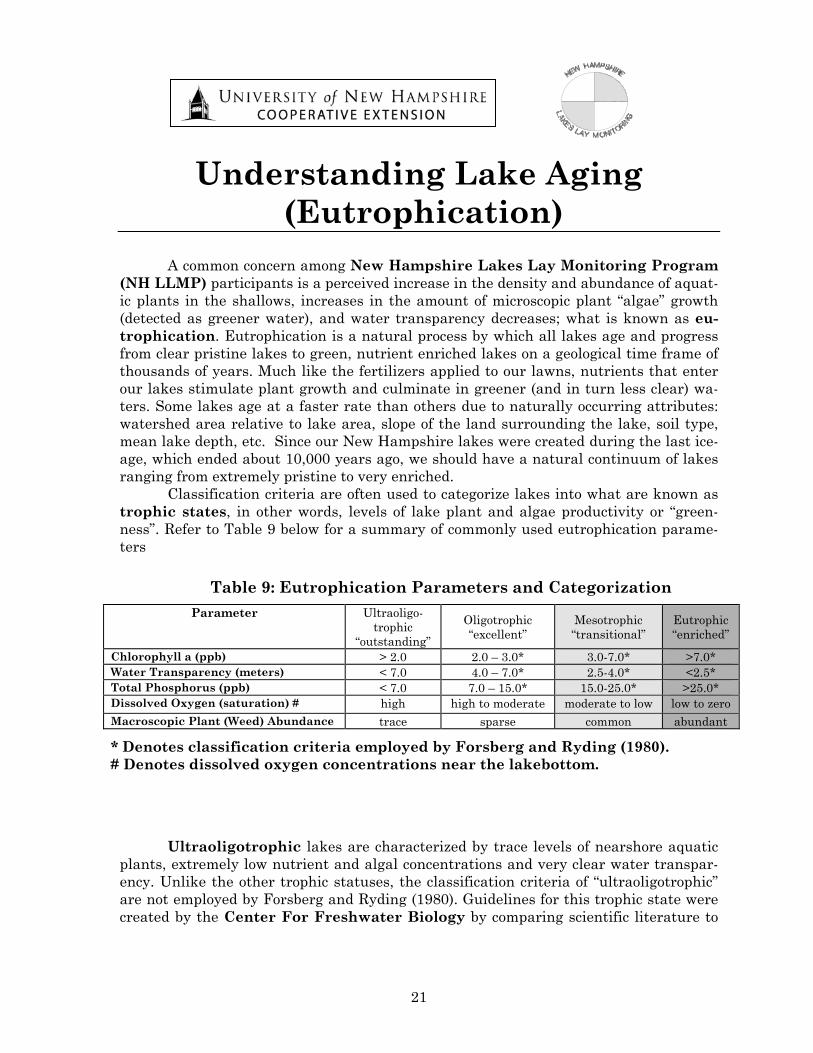
21
Understanding Lake Aging (Eutrophication)
A common concern among New Hampshire Lakes Lay Monitoring Program (NH LLMP) participants is a perceived increase in the density and abundance of aquat-ic plants in the shallows, increases in the amount of microscopic plant “algae” growth (detected as greener water), and water transparency decreases; what is known as eu-trophication. Eutrophication is a natural process by which all lakes age and progress from clear pristine lakes to green, nutrient enriched lakes on a geological time frame of thousands of years. Much like the fertilizers applied to our lawns, nutrients that enter our lakes stimulate plant growth and culminate in greener (and in turn less clear) wa-ters. Some lakes age at a faster rate than others due to naturally occurring attributes: watershed area relative to lake area, slope of the land surrounding the lake, soil type, mean lake depth, etc. Since our New Hampshire lakes were created during the last ice-age, which ended about 10,000 years ago, we should have a natural continuum of lakes ranging from extremely pristine to very enriched. Classification criteria are often used to categorize lakes into what are known as trophic states, in other words, levels of lake plant and algae productivity or “green-ness”. Refer to Table 9 below for a summary of commonly used eutrophication parame-ters
Ultraoligotrophic lakes are characterized by trace levels of nearshore aquatic plants, extremely low nutrient and algal concentrations and very clear water transpar-ency. Unlike the other trophic statuses, the classification criteria of “ultraoligotrophic” are not employed by Forsberg and Ryding (1980). Guidelines for this trophic state were created by the Center For Freshwater Biology by comparing scientific literature to
Table 9: Eutrophication Parameters and Categorization
Parameter Ultraoligo-trophic
“outstanding”
Oligotrophic “excellent”
Mesotrophic “transitional”
Eutrophic “enriched”
Chlorophyll a (ppb) > 2.0 2.0 – 3.0* 3.0-7.0* >7.0* Water Transparency (meters) < 7.0 4.0 – 7.0* 2.5-4.0* <2.5* Total Phosphorus (ppb) < 7.0 7.0 – 15.0* 15.0-25.0* >25.0* Dissolved Oxygen (saturation) # high high to moderate moderate to low low to zero Macroscopic Plant (Weed) Abundance trace sparse common abundant
* Denotes classification criteria employed by Forsberg and Ryding (1980). # Denotes dissolved oxygen concentrations near the lakebottom.
22
create a threshold for outstanding lake conditions. Oligotrophic lakes are considered “unproductive” pristine systems and are characterized by high water clarities, low nu-trient concentrations, low algae concentrations, minimal levels of aquatic plant “weed” growth, and high dissolved oxygen concentrations near the lake bottom. Eutrophic lakes are considered “highly productive” enriched systems characterized by low water transparencies, high nutrient concentrations, high algae concentrations, large stands of aquatic plants and very low dissolved oxygen concentrations near the lake bottom. Mesotrophic lakes have qualities between those of oligotrophic and eutrophic lakes and are characterized by moderate water transparencies, moderate nutrient concentra-tions, moderate algae growth, moderate aquatic plant “weed” growth and decreasing dissolved oxygen concentrations near the lake bottom. Is a pristine, oligotrophic, lake “better than” an enriched, eutrophic, lake? Not necessarily! As indicated above, lakes will naturally exhibit varying degrees of productivity. Some lakes will naturally be more susceptible to eutrophication than others due to their natural attributes and in turn have aged more rapidly. This is not necessarily a bad thing as our best bass fishing lakes tend to be more mesotrophic to eutrophic than oligotrophic; an ultra-oligotrophic lake (extremely pristine) will not support a very healthy cold water fishery. However, human related activities can augment the aging process (what is known as cultural eutrophication) and result in a transition from a pristine system to an enriched system in tens of years rather than the natural transitional period that should take hundreds to thousands of years. Cultural eutrophication is particularly a concern for northern New England lakes where large tracts of once forested or agricultural lands are being developed, with the potential for increased sediment and nutrient loadings into our lakes, which augment the eutrophication process.
Additionally, other pollutants such as heavy metals, herbicides, insecticides and petroleum products might also affect your lake’s “health”. A “healthy” lake, as far as eutrophication is concerned, is one in which the various aquatic plants and animals are minimally impacted so that nutrients and other materials are processed efficiently. We can liken this process to a well-managed pasture: nutrients stimulate the growth of grasses and other plants that are eaten by grazers like cows and sheep. As long as pro-ducers and grazers are balanced, a good amount of nutrients can be processed through the system. Impact the grazers and the grass will overgrow and nuisance weeds will ap-pear, even if nutrients remain the same. In a lake, the producers are the algae and aquatic weeds while the grazers are the microscopic animals (zooplankton) and aquat-ic insects. These organisms can be very susceptible to a wide range of pollutants at very low concentrations. If impacted, the lake can become much more productive and the fishery will be impacted as well since these same organisms are an important food source for most fish at some stage of their life.
Development upon the landscape can negatively affect water quality in a number of ways:
Removal of shore side vegetation and loss of wetlands - Shore side vegetation (what is known as riparian vegetation) and wetlands provide a protective buff-er that “traps” pollutants before reaching the lake. These buffers remove materi-als both chemically (through biological uptake) and physically (settling materials out). As riparian buffers are removed and wetlands lost, pollutant materials are more likely to enter the lake and in turn, favor declining water quality.

23
Excessive fertilizer applications - Fertilizers entering the lake can stimulate aquatic plant and algal growth and in extreme cases result in noxious algal blooms. Increases in algal growth tend to diminish water transparency and un-der extreme cases culminate in surface “scums” that can wash up on the shore-line producing unpleasant smells as the material decomposes. Excessive nutrient concentrations also favor algal forms known to produce toxins, which irritate the skin and under extreme conditions, are dangerous when ingested. Increased organic matter loading - Organic matter (leaves, grass clippings, etc.) is a major source of nutrients in the aquatic environment. As the vegetative matter decomposes nutrients are “freed up” and can become available for aquatic plant and algal growth. In general, we are not concerned with this material en-tering the lake naturally (leaf senescence in the fall) but rather excessive loading of this material as occurs when residents dump or rake leaf litter and grass clip-pings into the lake. This material not only provides large nutrient reserves which can stimulate aquatic plant and algal growth but also makes great habitat for leaches and other potentially undesirable organisms in swimming areas. Septic problems - Faulty septic systems are a big concern as they can be a primary source of water pollution around our lakes. Septic systems are loaded with nutrients and can also be a health threat when not functioning properly. Loss of vegetative cover and the creation of impervious surfaces - A forested watershed offers the best protection against pollutant runoff. Trees and tall veg-etation intercept heavy rains that can erode soils and surface materials. The roots of these plants keep the soils in place, process nutrients and absorb mois-ture so the soils do not wash out. Impervious surfaces (paved roads, parking lots, building roofs, etc.) reduce the water’s capacity to infiltrate into the ground, and in turn, go through nature’s water purification system. As water seeps into the soil, pollutants are removed from the runoff through absorption onto soil parti-cles. Biological processes detoxify pollutants and/or immobilize substances. Sur-face water runoff over impervious surfaces also increases water velocities that favor the transport of a greater load of suspended and dissolved pollutants into your lake.
How can you minimize your water quality impacts? Minimize fertilizer applications whenever possible. Most people apply far more
fertilizers than necessary, with the excess eventually draining into your lake. This not only applies to those immediately adjacent to the lake but to everybody within the watershed. Pollutants in all areas of the watershed will ultimately make their way into your lake. Have your soil tested for a nominal fee (contact your county UNH Cooperative Extension Office for further information) to find out how much fertilizer and soil amendments are really needed. Sometimes just an application of crushed limestone will release enough nutrients to fit the bill. If you do use fertilizer try to use low phosphorus, slow release nitrogen varieties. And remember that under the current NH Comprehensive Shoreline Protection Act (CSPA) you cannot apply any fertilizers or amendments within 25 feet of the shore unless you are starting new vegetation in an area that is bare.
24
Don’t dump leaf litter or leaves into the lake. Compost the material or take it to a proper waste disposal center. Do not fill in wetland areas. Do not create or en-hance beach areas with sand (contains phosphorus, smothers aquatic habitat, fills in lake as it gets transported away by currents and wind).
Septic systems will not function efficiently without the proper precautionary maintenance. Have your septic system inspected every two to four years and pumped out when necessary. Since the septic system is such an expensive in-vestment often costing around $10,000 for a complete overhaul, it is advanta-geous to assure proper care is taken to prolong the system’s life. Additionally, fol-lowing proper maintenance practices will reduce water quality degradation. Re-fer to:
Pipeline: Summer 2008 Vol. 19, No. 1. Septic Systems and Source Water Pro-tection: Homeowners can help improved community water quality.
http://www.nesc.wvu.edu/pdf/WW/publications/pipline/PL_SU08.pdf Try to landscape and re-develop with consideration of how water flows on and off
your property. Divert runoff from driveways, roofs and gutters to a level vegetat-ed area or a rain garden so the water can be slowed, filtered and hopefully ab-sorbed as recharge. Refer to:
Landscaping at the Water’s Edge: an Ecological Approach 2nd Edition. $20.00/ea University of New Hampshire Cooperative Extension Publications Center, Nesmith Hall, 131 Main Street, Durham NH 03824. http://extension.unh.edu/resources/files/Resource001799_Rep2518.pdf Integrated Landscaping: Following Nature’s Lead. 2nd Edition $20.00/ea Uni-versity of New Hampshire Cooperative Extension Publications Center, Nesmith Hall, 131 Main Street, Durham NH 03824.
Maintain shore side (riparian) vegetative cover when new construction is under-taken. For those who have pre-existing houses but lack vegetative buffers, con-sider shoreline plantings aimed at diminishing the pollution load into your lake. Refer to:
Landscaping at the Water’s Edge: an Ecological Approach 2nd Edition. $20.00/ea University of New Hampshire Cooperative Extension Publications Center, Nesmith Hall, 131 Main Street, Durham NH 03824.

25
Lake Friendly Lawn Care
By: Jeff Schloss Extension Professor and Water Resources Specialist University of New Hampshire 38 Academic Way Spaulding Hall Room 133 Durham NH 03824 voice: (603) 862-3696 email: [email protected] Below is an expanded version of an article written by the author and published in the Spring 2009 “Lakeside”, the newsletter of the NH Lakes Association.
The recent publication, “Landscaping at the Water’s Edge: An ecological approach, 2nd edition” from UNH Cooperative Extension covers the importance of considering how you may landscape your shoreline property for both the improvement of water quality as well as the enhancement of your property. Lawns and lawn care, spe-cifically for shoreline properties, are among the most popular requests for information. While the publication goes into much greater and more specific detail, the information below is a good start when considering lawns and their potential impacts to water quali-ty.
There is often controversy and confusion regarding lawns on shoreland proper-ties. Some consider lawns inconsistent with the natural shoreland ecology while others want to bring to their shoreland home the same look and feel as the neighborhoods in the suburbs that they have grown up with. As all vegetation provides at least some wa-ter quality functions, a lawn managed in the proper sustainable way can still allow for stabilized soils, filtered water infiltration into the ground and some nutrient and pollu-tant capture. And as with all vegetation, lawns sequester carbon dioxide, produce oxy-gen and, by doing so, cool the planet. Thus, lawns still make a better alternative to pavement or patios which create greater runoff conditions and impede groundwater re-charge. Of course, if managed improperly and located too close to the water, lawns and their excessive care can add to pollutant and nutrient loading to our surface and ground waters, attract nuisance weeds and insect pests (and even big pests like Canadian Geese!), impact important plant and wildlife species, as well as greatly reduce the avail-able potable water supply with their potential need for irrigation. So how might you maintain a lawn area to enjoy on your shoreland property (or any property for that mat-ter) while minimizing your impacts to the water quality and natural ecology?
Everything in moderation - We often hear from our health providers that moderation is the key to healthy living and the same holds true for natural sys-tems. Questions to ask yourself here include: How much lawn or open space do we really need for our intended use? Do we need to have all of our open space as a monoculture of a single type of grass or can we live with a combination of grasses and groundcovers that match our use? There are many varieties of grasses depending on the type and frequency of use (ie: occasionally picnicking to kids playing ball everyday) and site conditions (soils, sun exposure and slope).
26
Recently developed fescues, for example, require less maintenance (water, mow-ing and fertilizing) and can even be obtained with symbiotic fungi in their roots that make the grass better resistant to pests and diseases. The best approach is a mix of grass species with even some other groundcovers and white clover (or another low growing legume to naturally supply nitrogen to the soil). Talk to your county Extension educator, landscaper, or garden center expert about your options.
Location, location, location - Yes, the mantra of real estate agents also works well for lawns. Additional maintenance of a lawn, even when not excessive, can still threaten water quality. To make up for this, residents might consider locat-ing the lawn as away from the shore as possible and maintaining a significant buffer area downslope from the lawn with a mix of shrubs and woody plants. A lawn right down to the water is the worst thing for the water and it will serve to attract nuisance geese. It’s a known fact that keeping the vegetation high at the water’s edge will discourage geese from coming onto a property. It also provides many water quality and wildlife (aquatic and near shore) related benefits.
Test first, apply later - It is most important to test your soil before even think-ing about applying fertilizers. Once a lawn is established, fertilizing more than once a year (unless the yearly dosage is applied in fractions) is generally exces-sive and can lead to excess nitrogen loading to surface and groundwater. Lawns tend to need more basic soils so sometimes even applying crushed limestone to raise the pH can release enough nutrients that were bound to the soil to main-tain the lawn. A soil test will let you know exactly what you need to maintain a healthy lawn. If the test informs you that only nitrogen is needed, look for low to no phosphorus fertilizer blends (middle number of the N-P-K rating on the bag is zero) as phosphorous causes algae blooms in lakes and ponds. Generally, a well-established lawn can survive adequately with no more than 1 to 2 pounds of ni-trogen per 1000 square feet. The best time to apply fertilizer on an established lawn is around mid-September when the grass is still active enough to incorpo-rate the fertilizer into the plants, the summer draught is over and the surround-ing vegetation is well established to capture any runoff from your lawn. Choose slow release fertilizers only, to insure less polluted runoff. Many residents apply crushed limestone in the spring and fertilize in the fall. Some residents have never felt the need to fertilize and others have had their best results just using lake water (which usually contains small amounts of N and low P) for irrigation. It is really up to you to balance the results you are looking for with the minimum applications needed. Remember the NH Comprehensive Shoreline Protection Act prohibits applying anything except limestone in areas within 25 feet of the high water line except in some circumstances like initially establishing a ground cov-er.
Read the fine print! - A recent survey in Maine indicated that many consumers did not realize that “Weed & Feed” products contain both fertilizers and pesti-cides. Why pay for and put down something that can potentially threaten the health of pets, children and water quality when you may not need it in the first place? If you do have weed or insect problems consult with your county Exten-sion educator, landscaper or garden center expert to learn of safer alternative

27
controls. No matter what you choose always read the application directions and never over apply. Many of the plants and animals that form the foundation of the aquatic food web are extremely sensitive to pesticides so your impacts can have serious repercussions. Also be sure to apply only what you need - just because you bought a whole bag does not mean you have to apply all of it. Over-fertilization will cause more pest problems and will threaten surface and ground water supplies.
Conserve every drop - If you are on a public water supply it is best to choose grass species with low watering requirements or use alternative irrigation sup-plies like rain barrels, cisterns or even the water directly from the shore. Sum-mer water demand for lawns can be very significant in many communities. De-pending on the species and soil conditions you should water, only when needed, no more than a half inch to an inch total weekly. You can use a rain gauge or a can to measure rainfall and irrigation amounts. Early morning watering is pref-erable to minimize evaporation loss but give the water enough time to infiltrate and to allow the leaf blades to completely dry before night so as not to encourage disease problems. Keeping the lawn height at least 3 inches or higher will also encourage deeper roots which require less water (and a mulching mower blade will allow for those grass clippings to recycle nutrients back into the soil). Re-member that in times of draught and hot summer lawns are supposed to go dormant. Letting this happen is the most environmentally friendly thing you can do.
So, the choices are yours, you can have a lawn on your property with minimum
impact to our waters if you can restrict its size, locate it properly, provide adequate veg-etative buffer areas down-slope and use low input design and maintenance methods. To learn more about how informed landscaping can actually improve the water coming off of your property refer to “Landscaping at the Water’s Edge: An ecological ap-proach, 2nd edition” and/or request a presentation from your Cooperative Extension county Master Gardeners. Jeff Schloss can also be contacted to schedule a talk or work-shop for your lake association.

28
Go with the Flow: Understanding How Water Moves Onto,
Through and Away from Your House Site
Water travels through a watershed (the catchment area) in two ways, across the land surface and down through the ground. As water traveling on the land surface moves along, following the path of least resistance, it passes across various types of land and land uses. In a state as geographically diverse as New Hampshire, a drop of water from irrigation, rain or snowmelt might travel across neighborhood roads and your driveway, through a wooded area or an open field. Unless it infiltrates down into the ground, gets intercepted by a plant or evaporates into the atmosphere, the drop will end up in a lake, pond, stream, wetland or estuary. As water travels downhill on the landscape it picks up small particles and soluble materials and carries them along to the waterbody at the end of its journey. It might pick up pesticides or fertilizers from a backyard garden or salts and oils from a driveway or patio. In times of heavy rain, fast moving waters can pick up large particles of soils and sediments and deliver large pollutant loads to our surface waters. This flow of water and materials from a given location across the land surface and into our water is called “runoff”. Controlling water runoff should be a major objective of any shoreland landscape design. As water collects and flows through channels, it gathers energy and increases its erosive force. The faster water flows, the greater the particle size and quantity of pollutants it can carry along to the receiving water body (pond, lake, stream, river, wetland or coastal water). Modifying the landscape with any type of development has the potential to de-grade soil and water, resulting in changes in water flow, nutrient- and pollutant-loading, and groundwater recharge. However, if you start with a plan that takes into consideration the specific water runoff situation on your house site, your new landscape design could even improve the quality of water coming off it. This overview will guide you through the process of assessing your current runoff situa-tion and offer various strategies you can use to minimize the runoff from your house site. Combining these approaches with appropriate choices of plants and horticultural products is key to ensuring a healthy shoreland environment. More detail and instruc-tions on how to map out your site assessment and design an integrated landscaping plan can be found in the UNH Cooperative Extension publication: Landscaping at the Water’s Edge: An ecological approach (2nd edition) which can be ordered from the publications office : www.extension.unh.edu/publications.

29
Common Runoff Control Strategies Infiltration - allowing water to percolate into the ground where it can be filtered by soils rather than running across the land surface where it can cause erosion and collect pollutants. Detention - holding back or “ponding” a volume of water to slow the speed of its out-flow. In some cases water detention may also allow for infiltration and evaporation to reduce the resulting outflow volume. Diversion - preventing water from traveling over the area of concern, thereby reducing surface runoff damage and minimizing the potential for erosion and the transport of nonpoint source pollutants. Flow Spreading - allowing a concentrated flow to spread out over a wide, gently slop-ing area to reduce the water velocity and encourage infiltration. Plant absorption and transpiration - the movement of water from the shallow soil into the plant roots, up through the stems and leaves and the release of water vapor through the leaf stomates (under-leaf openings) to the atmosphere.
Typical Techniques used to control runoff Berm – A stabilized mound of dirt or stone to create a diversion and/or redirect water flow Check dam – A small mound of stabilized dirt or stone that breaks up the flow of water in a drainage ditch or trench to slow down velocity and allow for the settling of heavier materials. Cut-in (or Cut-out) – A small trench that diverts water flow away from the direction of the major flow stream to prevent a significant volume of water from collecting as it runs down a driveway, walkway, or path. Multiple cut-ins may be required for long distances or high slopes. Infiltration trench – A dug-in trench commonly used for roof runoff that allows for storage of runoff and encourages infiltration into the ground. Plunge Pool – A dug-in hole stabilized by stone, typically placed adjacent to a drainage ditch or trench. This allows water to fall below the level of the surface to slow the runoff velocity and capture heavy particle. These are often constructed in a series along a sloped route. Rain Garden – A shallow infiltration basin planted with water tolerant plant species, designed to capture concentrated runoff. Rain gardens are designed to pond water for just a few hours at a time, allowing it to be taken up and transpired by plants or infil-trate into the ground. Swale – A stabilized trench that can act to store water (detention), sometimes also en-gineered to enhance infiltration. Vegetated buffer – A relatively flat area stabilized with vegetation that allows water flow to spread out, slow down, infiltrate and be filtered by the soil, and/or be intercepted and transpired by plants.
30
Waterbar – A diversion device that diagonally crosses a sloped trail, path or road to capture and divert runoff to the side. Commonly made of a log, a stone, a small rein-forced drainage channel, or a partially buried flexible material, a waterbar is most use-ful for small contributing areas (watersheds less than one acre) that receive light foot and vehicle traffic. Waterbars are spaced according to the slop of the land.
Following the flow Paying attention to how water flows (or will flow) into, over and through your home site before, during and after development or landscaping, is critical in determining current and potential negative impacts. Some questions you’ll want to answer before proceed-ing:
What is the extent of lands and roads above the site that contribute runoff water, and where does the runoff enter your property?
Where does the water run off impervious surfaces (paved driveways and walkways, roofs, patios, compacted soils, etc) and piped sources (sumps, gutters, etc.) go?
Where does that water, along with the additional runoff generated in your new design, run over the site? Is it treated by vegetation and infiltrated or does it accumulate?
Where will that water flow off your site? Does it enter the water body di-rectly?
Most importantly, how might you modify your design to take advantage of these factors in creating diversions, detention and infiltration areas?
Investigate the drainageways Since water moves downhill, you need to walk your property boundary and note where the major water flows occur after a heavy rainstorm. Does the runoff from abutting roads or a neighbor’s driveway flow onto your property? Are there any adjacent steeply sloped lands that rise above the level of your property? Are they extensive enough to contribute water flows during rains and snow melts? Make note of all of these off-site contributors to flow. Also note any occasional or perennial wet areas or streams at your property boundary that encroach on your site.
Investigate onsite runoff generation Note any wet areas or seeps on your property. Now consider how your house and current landscaping features generate runoff. It is always easy to point uphill and blame runoff on other properties, but many people are surprised at how much runoff their own site creates, even in low-density development. Also note whether areas on your land divert runoff onto neighboring properties. Take inventory of all paved and compacted areas, such as driveways, patios and walkways. Can you find evidence of water flow moving off these areas and heading downhill? You may see just a small area of sheet erosion, indicated by the appearance of worn-down gravelly areas with small stones and roots showing because finer soil parti-

31
cles have been washed away. Or you may see rill, visible channels where water has eroded away materials a fraction of an inch to a few inches deep. In the worst cases, you’ll find gullies where water flows through channels deep enough for you to step into them. The potential for erosion and runoff increases with site steepness, area of impervious surfaces, and size of contributing watershed area (land above your site). Investigate the point sources of flows on your property from culverts, drain pipes, and hoses, as well as rain gutters, sump pumps, and tile drainage outlets. Cul-verts, drain pipes, etc. concentrate diffuse flows that need treatment and diversion to ensure they don’t contribute to runoff. If the house doesn't have gutters, look for areas where the roof design intercepts and dumps rainwater onto the property. As you develop your landscape plan, consider ways you might reduce the impacts of those flows. Account for any paths, trails and cleared areas that lead to the water. Shoreland properties almost always have pathways and cleared areas which runoff fol-lows directly into the water body. In the worst cases, a driveway at the top of the proper-ty allows water from the road above and the gutter runoff to collect and concentrate. Runoff flowing down a pathway directly into a cleared beach area and into the water of-ten takes a lot of sand with it. Note how the paths follow the slope of the land. Meandering paths may function to break up runoff before it concentrates, but straight downhill paths encourage flow di-rectly to the water. Also, note the flow-contributing areas that lie above the access area or beach. Do swaths of vegetation above help break up the flow, or does the water pretty much flow straight down and onto the area below? Finally, look for areas where water tends to pond after it rains. Even flat areas may pond water if the soils don't drain well or if there is a lot or shallow ledge or hard-pan present. Be sure to keep track of these areas and prevent additional water from reaching these locations.
Minimize and divert runoff Significant flows coming onto your site may create runoff and erosion problems. Your design should take into account all flows that will come in contact with your newly landscaped area, as well as those flows that may cause runoff concerns in other areas on your property (or your neighbor's). Of all the methods that can help deal with these situations, diversion and flow-spreading are the most reliable. If you can treat all of the incoming runoff by diverting it and spreading it out over a stable vegetated area before it leaves the properly, then by all means do so. However, in situations of high runoff flow coming from off-property sites such as roads, diverting some of the flow may be warranted to keep it from enter-ing your property. The sources of offsite runoff can be diverse and you may not be able to take action without involving neighbors, road associations and municipalities, since road-drainage diversions and treatment systems require professional design and instal-lation.
32
Use what you have (or can design) to break up, slow down and spread out the flow over or into a vegetated area. The goal is to prevent offsite and onsite flows from accumulat-ing and divert them from impervious areas. You may be able to break up the flow by us-ing shallow channels, stone check dams, small vegetated berms, or alternating areas of low and high vegetation. Simple drainage cut-ins can break the flow and move the water from long driveways and pathways. In more challenging situations, for example, when sites are very steep or narrow you may need to hire a professional to install a waterbar or similar diversion. If you can't divert the flows coming onto your site and can't find ways to prevent the flow from concentrating to a significant volume, then consider diverting the water into your existing vegetated areas. Or, create additional vegetated areas to allow the water to slow down, spread out and infiltrate the ground, thus losing most of its destructive force and most of its pollutant load. For this to work, you need an adequately sized vege-tated area with minimal slope. The denser the root systems of the plants in vegetated areas, the greater the volume of water the area can process. Mixed types of vegetation with different root depths will have the greatest impact, as contrasted with lawn like monocultures, which grow a sin-gle type of plant. However any type of vegetation is better than a bare, cleared, com-pacted, or impervious area. The same holds true for dealing with runoff from pavement, roots, tile drainage, sump flows, and existing drainageways: capture the water and/or divert it by any means pos-sible (plunge pools, waterbars, berms, swales and drainage trenches) to prevent it from running directly down to the shore. Conditions such as lack or space, steep slopes, and/or proximity to the shore create special challenges to diverting the water from a rain gutter or other concentrated flow. In these situations, consider alternative controls such as rain barrels, storage cisterns and infiltration trenches. You may be able to cut down runoff generation at the source by replacing impervious areas with porous alternatives. For problematic and excessive stormwater volumes you may need to have something engineered to capture water and pump it into other areas for treatment. If you have enough space, consider installing a rain garden, a shallow, dug-in area planted with water-tolerant plant species. Rain gardens can collect a significant volume of water during a storm, allowing the water that doesn't get used by plants to infiltrate the ground quickly and prevents it from becoming runoff. When designed and construct-ed correctly, the surface of a well-designed rain garden will not flood, eliminating con-cerns about standing water. The publication, Landscaping at the Water’s Edge, in-cludes resources for more information on rain garden design and appropriate plants. Or call your county Cooperative Extension office for more information. Properly designed pathways and trails should meander across the slope and allow each segment to throw water off the trail, rather than letting it flow in a straight path, accu-mulating velocity and pollutants as it moves downhill. The best trails are those that fol-

33
low the ridges and contours of the property. Some low vegetation planted at the corners of the meanders or staggered alternately on the sides of steeper pathways will help break up, capture, and slow down the flow of water as it moves downhill. To maximize water quality protection as you consider the ways you want to use and en-joy your waterfront property, the key is to remove as little vegetation as possible. For all lake shores and large rivers, the state’s Shoreland Water Quality Protection Act re-quires that in the “waterfront buffer” (0-50 feet from shore) natural ground cover shall remain intact. No cutting or removal of vegetation under 3 feet in height (excluding lawns) is allowed. Stumps, roots and rocks must remain intact in and on the ground. In addition, within the waterfront buffer, tree coverage is managed with a 50 foot by 50 foot grid and point system that ensures adequate forest cover and prevents new clear cutting. Within the “natural woodland buffer” (50-150 feet from shore) there are addi-tional protections. Refer to the New Hampshire Department of Environmental Services Shoreland Program web site for more detailed information (http://des.nh.gov/organization/divisions/water/wetlands/cspa/index.htm). Plan to stabilize a major portion of the shoreline area with a good mix of plants. The more protective vegetation you remove from near the shore, the more you increase the area’s potential for transporting pollutants to the lake or stream. Removing taller plants also opens the shore area to receive more sunlight. Exposure to more sun heats up the water, making it less desirable for aquatic organisms and more conducive to submerged and emergent weed growth including exotic invasive species. Where you locate your water access area is also important. Areas that don't receive sig-nificant runoff from the land above make the best locations for minimizing potential impacts. Water access areas that lie directly below a runoff flow may allow the runoff to reach the water without any reduction in impact. If you have no choice of access loca-tion, try to create a diversion of the flow away from the shoreline opening and into a more vegetated area using one or more or the approaches discussed above. Note: State wetland laws forbid dumping sand or other materials on the shoreline to make a beach. Wetland permits are required for any beach construction. Sand beaches not naturally present are discouraged as they tend to get washed away. In locations where a small opening, with stable groundcover and perhaps a few flat stones or steps will not do, you can apply for a permit for a small perched beach located just above the shoreline. Contact the Department of Environmental Services Wetlands Bureau for more information, (http://des.nh.gov/organization/divisions/water/wetlands/index.htm).
Structural approaches Most structural modifications for dealing with flow and runoff require professional de-sign and installation. However, homeowners might try one or more of these simpler ap-proaches before calling in the pros:
Clear existing drainage-ways of accumulated materials, including loose sedi-ments and litter, before the snow melts and the spring rains arrive. Encourage vegetative growth in these drainageways however, as the vegetation removes sediments and pollutants from the water as it passes through.

34
If possible, divert other flows into your existing drainageways (as long as they themselves don't directly flow into the water body) by some shallow channeling, the use of check dams of stone or gravel, or by using small berms.
Break up the water flow by alternating small berms down a sloped area, divert-ing water off into vegetated areas before it can accumulate in significant volume.
In general, anything you can do by hand or using hand tools doesn’t require a permit, as long as you stay at least 25 feet away from the shoreline. Any time you have to use a power tool, vehicle or power equipment, or your project requires significant earth-moving within the 250 foot Shoreland Protection Zone, you will probably need a state permit, and possibly one or more local permits as well.
Making a Difference A typical small shorefront lot on a moderate slope with conventional development (house, paved driveway, vegetation cleared for lawn) can increase water runoff, phos-phorus pollution and sediment erosion about 5, 7, and 18 times, respectively, compared to an undisturbed, forested lot. By re-growing out a shoreland buffer of 50 feet and infil-trating the roof runoff through trenching or a rain garden, the impacts can be reduced significantly: to only 1.5 times the runoff, 2 times the phosphorus loading and less than 3 times the sediment erosion compared to the undisturbed lot. With the knowledge of how water flows over and currently runs off your site, you now may want to consider adding water diversions, as well as vegetated buffers and infiltra-tion areas into your landscape design to take advantage of the water-treatment proper-ties of vegetation. The full publication: Landscaping at the Water’s Edge contains further information on how to maintain and establish shoreline buffers, choose the ap-propriate plant systems for low impact and low maintenance, and how to plant and maintain lawn areas in an environmentally-friendly way. Adapted by Jeff Schloss, UNH Extension Professor of Biological Sciences and Coopera-tive Extension Water Resources Specialist from his contributed chapter in: Landscap-ing at the Water’s Edge: An ecological approach, 2nd edition www.extension.unh.edu/resources to order a bound copy of the manual. http://extension.unh.edu/resources/files/Resource001799_Rep2518.pdf to download an electronic copy of the manual.
35
Toxic Cyanobacteria - what’s the story?
Spring and summer "blooms" (rapid increase in concentrations) of a primitive group of organisms, the cyanobacteria (sometimes mistakenly referred to as "blue-green algae"), have been documented in New Hampshire lakes these past years, focusing attention on the potential health threats from the toxins they produce. The N.H. Department of En-vironmental Services (NHDES) posted beach advisories warning of cyanobacterial con-tamination in at least eight lakes in 2013.
Beneficial algae differ from toxin-producing cyanobacteria
Algae occur in all New Hampshire waters, providing oxygen and serving as an im-portant food source that forms the base of the aquatic food chain. Occasional spring, summer and fall "blooms" (rapid increase in concentrations) of algae have been known to occur but are historically rare on all but a small percentage of New Hampshire lakes. It is also common during sunny, quiet summers to see cotton-candy-like green to almost white "clouds" of green filamentous algae floating in the shallows of the many lakes with aquatic plant beds. But cyanobacteria, which used to be called "blue-green algae," produce a range of compounds toxic to humans, pets and wildlife. When present in large-enough concentrations, as are found typically during bloom events and when the surface populations are concentrated due to wind and water currents, toxin concentra-tions can reach levels of concern.
Potential human health effects from exposure to cyanotoxins
Long-term exposure to these toxins is suspected to cause chronic symptoms and inges-tion of the toxins over long periods may possibly damage the liver, kidney and nervous system. Short-term exposure to cyanotoxins through activities such as swimming and boating in cyanobacteria-contaminated water or showering in water drawn directly from contaminated lakes, may produce symptoms such as skin rashes, muscle pain, eye and ear inflammation or infection, nausea, disorientation, diarrhea and flu-like symptoms. Cyanobacteria don't always produce significant quantities of toxin capable of producing symptoms like those described above. Only five of the common cyanobacteria in New Hampshire waters have been shown to produce at least one toxin.
Stay vigilant
While there have been no documented cases of negative human health effects from cy-anotoxin exposure in New Hampshire, it is best to be vigilant and cautious. Keep pets and children (who are at greatest risk) away from any surface scums, "blooms" or un-derwater "mats" that are green, yellow-green or bluish green. Other states have report-ed dog illnesses and deaths from cyanotoxins when dogs drank small volumes of heavi-ly-contaminated water or licked contaminated water from their coats. Everyone should heed the posted warning signs and keep aware of cyanobacteria beach advisories by checking the NHDES beach program Web site. Current advisories are posted based on
36
the amount of potentially toxin-producing cyanobacteria, rather than on any measured amount of toxins. Researchers are currently investigating additional methods to predict toxin concentrations, but sense any cyanobacteria bloom may produce more than one toxin and not all toxins are easily and quickly identified, the microscopic analysis, as is done for the advisories, is still the best option.
Learn more
NHDES Beach Program Lots of information on cyanobacteria, current beach advisories, and presentations from recent informational workshops. http://des.nh.gov/organization/divisions/water/wmb/beaches/index.htm UNH biotoxins lab Ongoing research to understand the role of biotoxins in aquatic sys-tems and their importance as a threat to public health and water quality. http://www.cfb.unh.edu/programs/Biotoxins/biotoxins.htm Cyanobacteria under the microscope Click on fourth picture down in the far right col-umn. http://cfb.unh.edu/phycokey/phycokey.htm Cyanotoxins and the health of domestic animals and humans presentation (Microsoft Powerpoint) by Dr. Jim Haney of the UNH Center for Freshwater Biology. http://des.nh.gov/organization/divisions/water/wmb/beaches/documents/20090515wkshp_haney.pdf

37
REFERENCES American Public Health Association.(APHA) 1998. Standard Methods for the Examination
of Water and Wastewater 20th edition. APHA, American Water Works Association and the Water Environment Federation.
Baker, A.L. 1973. Microstratification of phytoplankton in selected Minnesota lakes. Ph. D.
thesis, University of Minnesota. Carlson, R.E. 1977. A trophic state index for lakes. Limnol. Oceanogr. 22:361-379. Chase, V.P., L.S. Deming and F. Latawiec. 1995. Buffers for Wetlands and Surface Waters:
A Guidebook for New Hampshire Municipalities. Audubon Society of New Hamp-shire.
Craycraft, Robert and Jeffrey Schloss. Reports of the NH Lakes Lay Monitoring Program
1990-2012. UNH Center for Freshwater Biology and Cooperative Extension. Dates, Geoff and Jeffrey Schloss. 1998. DATA to INFORMATION: Data Management and
Analysis for Coastal Monitoring Groups in New Hampshire and Maine-. Maine-NH Sea Grant and Gulf of Maine Council. September 1998. 90 pages. MSG-E-98-8. Manual.
Edmondson, W.T. 1937. Food conditions in some New Hampshire lakes. In: Biological sur-
vey of the Androscoggin, Saco and coastal watersheds. (Report of E.E. Hoover.) New Hampshire Fish and Game Commission. Concord, New Hampshire.
Estabrook, R.H., J.N. Connor, K.D. Warren, and M.R. Martin. 1987. New Hampshire Lakes
and Ponds Inventory. Vol. III. Staff Report No. 153. New Hampshire Department of Environmental Services. Concord, New Hampshire.
Estabrook, R.H., M.R. Martin and W.M. Henderson. 1988. New Hampshire Lakes and
Ponds Inventory. Vol. IV. Staff Report No. 156. New Hampshire Department of Envi-ronmental Services. Concord, New Hampshire.
Estabrook, R.H., M.R. Martin, P.M. McCarthy, D.J. Dubis, and W.M. Henderson. 1989. New
Hampshire Lakes and Ponds Inventory. Vol. V. Staff Report No. 166. New Hamp-shire Department of Environmental Services. Concord, New Hampshire.
Estabrook, R.H., P.M. McCarthy, M. O'Loan, W.M. Henderson, and D.J. Dubis. 1990. New
Hampshire Lakes and Ponds Inventory. Vol. VI. NHDES-WSPCD-90-3. New Hamp-shire Department of Environmental Services. Concord, New Hampshire.
Estabrook, R.H., M. O'Loan and W.M. Henderson. 1991. New Hampshire Lakes and Ponds
Inventory. Vol. VII. NHDES-WSPCD-91-3. New Hampshire Department of Environ-mental Services. Concord, New Hampshire.
Estabrook, R.H., M. O'Loan, W.M. Henderson and K.L. Perkins. 1992. New Hampshire
Lakes and Ponds Inventory. Vol. VIII. NHDES-WSPCD-92-6. New Hampshire De-partment of Environmental Services. Concord, New Hampshire.

38
Estabrook, R.H., K. Faul and W.M. Henderson. 1993. New Hampshire Lakes and Ponds In-ventory. Vol. IX. NHDES-WSPCD-93-3. New Hampshire Department of Environmen-tal Services. Concord, New Hampshire.
Estabrook, R.H., K. Faul and W.M. Henderson. 1994. New Hampshire Lakes and Ponds In-
ventory. Vol. X. NHDES-WSPCD-94-4. New Hampshire Department of Environmen-tal Services. Concord, New Hampshire.
Estabrook, R.H., W.M. Henderson and S. Ashley. 1996. New Hampshire Lakes and Ponds
Inventory. Vol. XII. NHDES-WSPCD-96-6. New Hampshire Department of Environ-mental Services. Concord, New Hampshire.
Forsberg, C. and S.O. Ryding. 1980. Eutrophication parameters and trophic state indices in
30 Swedish waste-water receiving lakes. Arch. Hydrobiol. 89:189-207 Gallup, D.N. 1969. Zooplankton distributions and zooplankton-phytoplankton relationships
in a mesotrophic lake. Ph.D. Thesis, University of New Hampshire. Haney, J.F. and D.J. Hall. 1973. Sugar-coated Daphnia: a preservation technique for Cla-
docera. Limnol. Oceanogr. 18:331-333. Hoover, E.E. 1936. Preliminary biological survey of some New Hampshire lakes. Survey
report no. 1. New Hampshire Fish and Game Department. Concord, New Hampshire. Hoover, E.E. 1937. Biological survey of the Androscoggin, Saco, and coastal watersheds.
Survey report no. 2. New Hampshire Fish and Game Department. Concord, New Hampshire.
Hoover, E.E. 1938. Biological Survey of the Merrimack watershed. Survey report no. 3.
New Hampshire Fish and Game Department. Concord, New Hampshire. Hutchinson, G.E. 1967. A treatise on limnology, Vol. 2. John Wiley and Sons, New York. Lind, O.T. 1979. Handbook of common methods in limnology. C.V. Mosby, St. Louis. Lorenzen, M.W. 1980. Use of chlorophyll-Secchi Disk relationships. Limnol. Oceanogr.
25:371-372. McCafferty, W.P. 1983. Aquatic Entomology: The Fishermen’s and Ecologists’ Illustrated
Guide to Insects and their relatives. Jones and Bartlett Publishers. Boston MA. Merritt, R.W. and K.W. Cummins. 1995. An Introduction to the Aquatic Insects of North
America. Kendall/Hunt Publishing Company. Dubuque, Iowa New Hampshire Water Supply and Pollution Control Commission. 1981. Classification and
priority listing of New Hampshire lakes. Vol. II (Parts 1-6). Staff report no. 121. Con-cord, New Hampshire.
New Hampshire Water Supply and Pollution Control Commission. 1982. Classification and
priority listing of New Hampshire lakes. Vol. III. Staff report no. 121. Concord, New Hampshire.
New Hampshire Water Supply and Pollution Control Commission. 1983. New Hampshire
Lakes and Ponds Inventory. Vol. I. Staff report no. 133. Concord, New Hampshire.

39
New Hampshire Water Supply and Pollution Control Commission. 1985. New Hampshire
Lakes and Ponds Inventory. Vol. II. Staff report no. 133. Concord, New Hampshire. Newell, A.E. 1960. Biological survey of the lakes and ponds in Coos, Grafton and Carroll
Counties. Survey report no. 8a. New Hampshire Fish and Game Department. Con-cord, New Hampshire.
Newell, A.E. 1970. Biological survey of the lakes and ponds in Cheshire, Hillsborough and
Rockingham Counties. Survey report no. 8c. New Hampshire Fish and Game De-partment. Concord, New Hampshire.
Newell, A.E. 1977. Biological survey of the lakes and ponds in Sullivan, Merrimack, Belk-
nap and Strafford Counties. Survey report no. 8b. New Hampshire Fish and Game Department. Concord, New Hampshire.
Schindler, D.W., et al. 1985. Long-term ecosystem stress: Effects of years of experimental
acidification on a small lake. Science. 228:1395-1400. Schloss, Jeffrey A. 2002. GIS Watershed Mapping: Developing and Implementing a Water-
shed Natural Resources Inventory. In: Handbook of Water Sensitive Ecological Plan-ning & Design- Proceedings of an International Symposium. February 25 - 26, 2000 Harvard University Graduate School of Design. CRC Press, Boca Raton, FL, Chapter II.12.
Schloss, J. and J. Connor. 2001. Development of Statewide Nutrient (P) Loading Coefficients
Through Geographic Information System Aided Analysis. Final Project Report. UNH Water Resources Research Center. Durham, NH.
Schloss, Jeffrey A. 2000. An Early Success of the Clean Water Action Plan: The Lake
Chocorua Project. Proceedings of the 2nd National Water Quality Monitoring Council National Monitoring Conference: Monitoring for the Millennium. April 25-27, 2000 Austin Texas. Environmental Protection Agency, US Geological Survey, Ground Wa-ter Protection Council.
Schloss, Jeffrey A. 1999. Squam Lakes Watershed Natural Resources Inventory: A Case
Study for GIS Analysis in a Multijurisdictional Watershed. 1999. Proceedings of the Tijuana River Watershed Workshop. May 5-8, 1999. Tijuana Mexico. NOAA Coastal Services Center publication.
Schloss, J.A., A.L. Baker and J.F. Haney. 1989. Over a decade of citizen volunteer monitor-
ing in New Hampshire: The New Hampshire Lakes Lay Monitoring Program. Lake and Reservoir Management.
Sprules, W.G. 1980. Zoogeographic patterns in size structure of zooplankton communities
with possible applications to lake ecosystem modeling and management. in W.C. Ker-foot ed. Evolution and Ecology of Zooplankton Communities. University Press of New England. Dartmouth. pp. 642-656.
Uttermohl, H. 1958. Improvements in the quantitative methods of phytoplankton study.
Mitt. int. Ver. Limnol. 9:1-25. U.S. Environmental Protection Agency. 1979. A manual of methods for chemical analysis of
water and wastes. Office of Technology Transfer, Cincinnati. PA-600/4-79-020.

40
Vollenweider, R.A. 1969. A manual on methods for measuring primary productivity in
aquatic environments. International Biological Programme. Blackwell Scientific Pub-lications, Oxford.
Warfel, H.E. 1939. Biological survey of the Connecticut Watershed. Survey Report 4. N.H.
Fish and Game. Concord, New Hampshire. Wetzel, R.G. 1983. Limnology. Saunders College Publishing, Philadelphia.

41

42
REPORT FIGURES
Figure 9. Location of the 2013 Great East Lake deep sampling stations, 1 Center, 2 Canal, 2nd Basin, and 3 Maine Mann, Wakefield, New Hampshire and Acton, Maine.
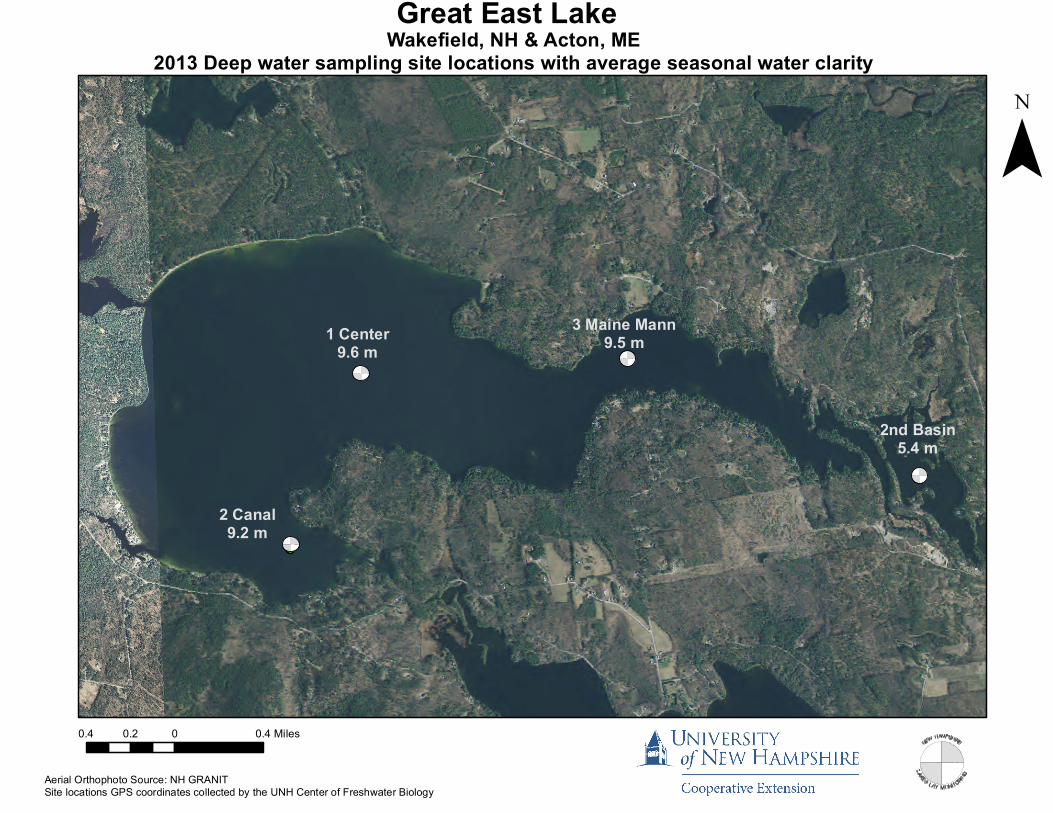
Great East Lake
Aerial Orthophoto Source: NH GRANIT Site locations GPS coordinates collected by the UNH Center of Freshwater Biology
Wakefield, NH & Acton, ME2013 Deep water sampling site locations with average seasonal water clarity
¯
2 Canal9.2 m
1 Center9.6 m
3 Maine Mann9.5 m
2nd Basin5.4 m
0.4 0 0.40.2 Miles

44

A - 1
APPENDIX A Great East Lake, 2013. Seasonal Secchi Disk (water transparency) and chloro-
phyll a measurements for Sites 1 Center, 2 Canal, 2nd Basin and 3 Maine Mann. The Secchi Disk transparency data are reported to the nearest 0.1 meters while the chlorophyll a data are reported to the nearest 0.1 parts per billion (ppb).
Great East Lake, 2013. Seasonal Secchi Disk (water transparency) and dis-
solved color measurements for Sites 1 Center, 2 Canal, 2nd Basin and 3 Maine Mann. The Secchi Disk transparency data are reported to the nearest 0.1 meters while the dissolved color data are reported to the nearest 0.1 chloroplatinate unit (CPU).
Note: the overlay of the Secchi Disk data with chlorophyll a and dissolved color data is intended to provide a visual depiction of the impacts of chlorophyll a and dissolved color on water transparency measurements (e.g. higher chlorophyll a and dissolved color concentrations often correspond to shallower water transparencies).

0
1
2
3
4
50
2
4
6
8
10
12
14
16
18
20
Date
Chlorophyll a (ppb)
Secchi D
isk Transparency (m
eters)
Great East Lake ‐ Site 1 Center(2013 Seasonal Data)
SD CHL
0
5
10
15
20
25
30
35
40
45
500
2
4
6
8
10
12
14
16
18
20
Date
Dissolved
Color (CPU)
Secchi D
isk Trasnparency (m
eters)
Great East Lake ‐ Site 1 Center(2013 Seasonal Data)
SD Color
0
1
2
3
4
50
2
4
6
8
10
12
14
16
18
20
Date
Chlorophyll a (ppb)
Secchi D
isk Transparency (m
eters)
Great East Lake ‐ Site 2 Canal(2013 Seasonal Data)
SD CHL
0
5
10
15
20
25
30
35
40
45
500
2
4
6
8
10
12
14
16
18
20
Date
Dissolved
Color (CPU)
Secchi D
isk Trasnparency (m
eters)
Great East Lake ‐ Site 2 Canal(2013 Seasonal Data)
SD Color
0
1
2
3
4
50
2
4
6
8
10
12
14
16
18
20
Date
Chlorophyll a (ppb)
Secchi D
isk Transparency (m
eters)
Great East Lake ‐ Site 3 Maine Mann(2013 Seasonal Data)
SD CHL
0
5
10
15
20
25
30
35
40
45
500
2
4
6
8
10
12
14
16
18
20
Date
Dissolved
Color (CPU)
Secchi D
isk Trasnparency (m
eters)
Great East Lake ‐ Site 3 Maine Mann(2013 Seasonal Data)
SD Color

0
1
2
3
4
50
2
4
6
8
10
12
14
16
18
20
Date
Chlorophyll a (ppb)
Secchi D
isk Transparency (m
eters)
Great East Lake ‐ Site 2nd Basin(2013 Seasonal Data)
SD CHL
0
5
10
15
20
25
30
35
40
45
500
2
4
6
8
10
12
14
16
18
20
Date
Dissolved
Color (CPU)
Secchi D
isk Trasnparency (m
eters)
Great East Lake ‐ Site 2nd Basin(2013 Seasonal Data)
SD Color


B - 1
APPENDIX B
Great East Lake line graphs that display the median Secchi Disk Transparency, chlorophyll a, total phopshorus concentrations. Regression lines are included in the graphs to display the long term trend for each parameter; the steeper the slope, the more rapid water quality changes are occuring. Solid regression lines indicate statistically significant (P-value ≤ 0.05) trendlines, whereas dashed lines indicate trendlines that are not considered statistically significant (P-value ≥ 0.05).
Long-term trend analysis using linear Regressions
A linear, bivariate regression allows us to identify the relation of two or more variables by producing a single line that best represents the distribution of points in a data set. The linear regression is calculated by a simple mathemati-cal equation, y = mx + b, that creates a line that best describes the overall trend in the data; where x = the independent variable, y = the dependent variable, b = y-intercept (the value of y when x is zero) and m = the slope of the line. Ulti-mately, the slope of the line exemplifies the relationship between the two varia-bles being studied. The distance between the line and the points (“standard er-ror”) describes the strength of the relationship. The closer the line is to the data points, the stronger the relationship is; whereas the farther away the points are, the weaker the relationship.
While linear regressions help distinguish patterns in data sets, the relationships or correlations identified do not necessarily mean that one variable is the cause of another, even when the line indicates a strong fit with the data points. In oth-er words, there may be a strong relationship between water clarity (Secchi disk depth) and chlorophyll a. However, this does not necessarily mean that the clari-ty of the water is driven by the algal growth associated with high chlorophyll a concentrations. Water clarity can fluctuate due to land use changes, storm events, shoreline erosion, etc. causing changes in not only chlorophyll a, but in turbidity and color, which can also drive a decrease in clarity. In order to truly understand a trend, such as a change in water clarity, it is crucial to think about all the factors that play into the change in water quality conditions. Linear re-gression analysis is the first step to identify the areas that need a closer look by
B - 2
providing connections between variables. However, more vigilant observation and analysis is required to determine a true cause-and-effect relationship.
Understanding P-values
A P-value is a number between 0 and 1 used in statistics to decide whether or not to take the null hypothesis while making a prediction based on collected da-ta. The null hypothesis (HO) is the prediction that there is no difference in the data and that there is virtually no change in the parameter, or the question be-ing studied. For example, the null hypothesis of this study is that there has been no change in water quality over a specified amount of time. If the null hypothe-sis is not taken and is proven to be untrue, then you take the alternative hy-pothesis (HA), which is there has been a change in the data and the change in water quality is significant. A P-value identifies the confidence one has to reject the null hypothesis. Numbers closer to 0 indicate strong evidence to reject the null hypothesis and accept the alternative hypothesis; while numbers closer to 1 infer weaker evidence that the null hypothesis should be rejected. Generally, significant P-values are identified as 0.05, 0.01, and 0.001.
For our purposes, a P-value ≤ 0.05 indicates strong evidence to reject the null hypothesis and accept the alternative hypothesis, which is there has been a change in water quality conditions. A P-value ≥ 0.05 indicates weaker evidence and therefore the null hypothesis of no change or difference is accepted, while the alternative hypothesis is rejected.
It is important to understand that while a relationship with P-values ≥ 0.05, do not dis-play “statistical significance”, it does not mean that there is no importance in what the data is suggesting, just not enough to reject the null hypothesis. The same goes for a P-value ≤ 0.05. Although the trend is considered “significant” it does not mean it is the on-ly important, suggestive changes in water quality conditions. Again, it is important to consider all factors that play into water quality changes and decide which influences play the largest role.

0.0
2.0
4.0
6.0
8.0
10.0
12.0
0.0
2.0
4.0
6.0
8.0
10.0
12.0
1986 1988 1990 1992 1994 1996 1998 2000 2002 2004 2006 2008 2010 2012 2014
Chlorophyll a
(ppb)
Secchi D
isk Tran
psarency (meters)
Year
Great East Lake ‐ Site 1 Center (1987‐2013)
Median Secchi Disk Median Chlorophyll a
0.0
4.0
8.0
12.0
16.0
20.0
24.0
0.0
3.0
6.0
9.0
12.0
15.0
18.0
1986 1988 1990 1992 1994 1996 1998 2000 2002 2004 2006 2008 2010 2012 2014
Dissolved Color (CPU)
Total Phosphorus (ppb)
Year
Great East Lake ‐ Site 1 Center (1987‐2013)
Median Total Phosphorus Median Dissolved Color
P = 0.70
P = 0.05
P = 0.04
P = 0.02

0.0
2.0
4.0
6.0
8.0
10.0
12.0
0.0
2.0
4.0
6.0
8.0
10.0
12.0
1993 1995 1997 1999 2001 2003 2005 2007 2009 2011 2013
Chlorophyll a
(ppb)
Secchi D
isk Tran
psarency (meters)
Year
Great East Lake ‐ Site 2 Canal Basin (1994‐2013)
Median Secchi Disk Median Chlorophyll a
0.0
4.0
8.0
12.0
16.0
20.0
24.0
0.0
5.0
10.0
15.0
20.0
25.0
30.0
1993 1995 1997 1999 2001 2003 2005 2007 2009 2011 2013
Dissolved Color (CPU)
Total Phosphorus (ppb)
Year
Great East Lake ‐ Site 2 Canal Basin (1994‐2013)
Median Total Phosphorus Median Dissolved Color
P = 0.05
P = 0.10
P = 0.20
P = 0.23

0.0
2.0
4.0
6.0
8.0
10.0
12.0
0.0
2.0
4.0
6.0
8.0
10.0
12.0
2001 2003 2005 2007 2009 2011 2013
Chlorophyll a
(ppb)
Secchi D
isk Tran
psarency (meters)
Year
Great East Lake ‐ Site 2nd Basin (2002‐2013)
Median Secchi Disk Median Chlorophyll a
0.0
5.0
10.0
15.0
20.0
25.0
30.0
0.0
5.0
10.0
15.0
20.0
25.0
30.0
2001 2003 2005 2007 2009 2011 2013
Dissolved Color (CPU)
Total Phosphorus (ppb)
Year
Great East Lake ‐ Site 2nd Basin (2002‐2013)
Median Total Phosphorus Median Dissolved Color
P = 0.40
P = 0.30
P = 0.62
P = 0.96

0.0
2.0
4.0
6.0
8.0
10.0
12.0
0.0
2.0
4.0
6.0
8.0
10.0
12.0
1993 1995 1997 1999 2001 2003 2005 2007 2009 2011 2013
Chlorophyll a
(ppb)
Secchi D
isk Tran
psarency (meters)
Year
Great East Lake ‐ Site 3 Maine Mann (1994‐2013)
Median Secchi Disk Median Chlorophyll a
0.0
3.0
6.0
9.0
12.0
15.0
18.0
0.0
4.0
8.0
12.0
16.0
20.0
24.0
1992 1994 1996 1998 2000 2002 2004 2006 2008 2010 2012 2014
Dissolved Color (CPU)
Total P
hosphorus (ppb)
Year
Great East Lake ‐ Site 3 Maine Mann (1994‐2013)
Median Total Phosphorus Median Dissolved Color
P = 0.42
P = 0.002
P = 0.34
P = 0.10


C - 1
APPENDIX C Physical, chemical and biological water quality data were collected in Great East Lake, Sites 1 Center, 2 Canal, 2nd Basin and 3 Maine Mann, by the University of New Hampshire Center for Freshwater Biology on September 9, 2013. The water quality data are plotted against depth and include a shaded region on the graphs that partitions the three thermal zones: the epilimnion, the metalimnion and the hypolimnion. Notice the difference in water quality measurements among the thermal zones. The water quality profile data were collected in-situ with a Yellow Springs Instruments model 6600 V2-4 Sonde equipped with a pressure (depth) sensor, phycocyanin fluores-cence probe, chlorophyll fluorescence probe, temperature/conductivity probe, optical ox-ygen sensor, and a combination low ionic strength pH/redox probe. The chlorophyll a and phycocyanin flourescence data are based on factory calibrated conversion of fluores-cence data to chlorophyll a values. All profiling data were digitally logged onto a YSI 650 data logger and subsequently downloaded onto a personal computer for further data analysis. The YSI profile data were recorded at five second intervals by slowly lowering the Sonde into the water column at an approximate rate of two centimeters per second.
0 3 6 9 12 15
02468
10121416182022242628
0 5 10 15 20 25
Dissolved Oxygen (mg/l) pH (standard units)
Depth (meters)
Temperature (oC)
GREAT EAST LAKE ‐ SITE 1 CENTERYSI 6600 In‐Situ water quality measurements (09/09/13)
Temperature Dissolved Oxygen pH
Epilimnion
Metalimnion
Hypolimnion
0 4 8 12 16 20
02468
10121416182022242628
0 5 10 15 20 25
Chlorophyll a (ug/l) Phycocyanin (102 cells/milliliter)
Depth (meters)
Temperature (oC)
GREAT EAST LAKE ‐ SITE 1 CENTERYSI 6600 In‐Situ water quality measurements (09/09/13)
Temperature Chlorophyll a Phycocyanin
Epilimnion
Metalimnion
Hypolimnion
0 80 160 240 320 400
02468
10121416182022242628
0 5 10 15 20 25
Oxidation‐Reduction Potential (mv)
Depth (meters)
Temperature (oC)
GREAT EAST LAKE ‐ SITE 1 CENTERYSI 6600 In‐Situ water quality measurements (09/09/13)
Temperature Oxidation‐Reduction Potential
0 20 40 60 80 100
02468
10121416182022242628
0 5 10 15 20 25
Specific Conductivity (uS/cm)
Depth (meters)
Temperature (oC)
GREAT EAST LAKE ‐ SITE 1 CENTERYSI 6600 In‐Situ water quality measurements (09/09/13)
Temperature Specific Conductivity
Epilimnion
Metalimnion
Hypolimnion
Epilimnion
Metalimnion
Hypolimnion

0 3 6 9 12 15
0
2
4
6
8
10
12
14
16
0 5 10 15 20 25
Dissolved Oxygen (mg/l) pH (standard units)
Dep
th (meters)
Temperature (oC)
GREAT EAST LAKE ‐ SITE 2 CANAL BASINYSI 6600 In‐Situ water quality measurements (09/09/13)
Temperature Dissolved Oxygen pH
Epilimnion
Metalimnion
Hypolimnion
0 4 8 12 16 20
0
2
4
6
8
10
12
14
16
0 5 10 15 20 25
Chlorophyll a (ug/l) Phycocyanin (102 cells/milliliter)
Dep
th (meters)
Temperature (oC)
GREAT EAST LAKE ‐ SITE 2 CANAL BASINYSI 6600 In‐Situ water quality measurements (09/09/13)
Temperature Chlorophyll a Phycocyanin
Epilimnion
Metalimnion
Hypolimnion
0 80 160 240 320 400
0
2
4
6
8
10
12
14
16
0 5 10 15 20 25
Oxidation‐Reduction Potential (mv)
Dep
th (meters)
Temperature (oC)
GREAT EAST LAKE ‐ SITE 2 CANAL BASINYSI 6600 In‐Situ water quality measurements (09/09/13)
Temperature Oxidation‐Reduction Potential
0 20 40 60 80 100
0
2
4
6
8
10
12
14
16
0 5 10 15 20 25
Specific Conductivity (uS/cm)
Dep
th (meters)
Temperature (oC)
GREAT EAST LAKE ‐ SITE 2 CANAL BASINYSI 6600 In‐Situ water quality measurements (09/09/13)
Temperature Specific Conductivity
Epilimnion
Metalimnion
Hypolimnion
Epilimnion
Metalimnion
Hypolimnion
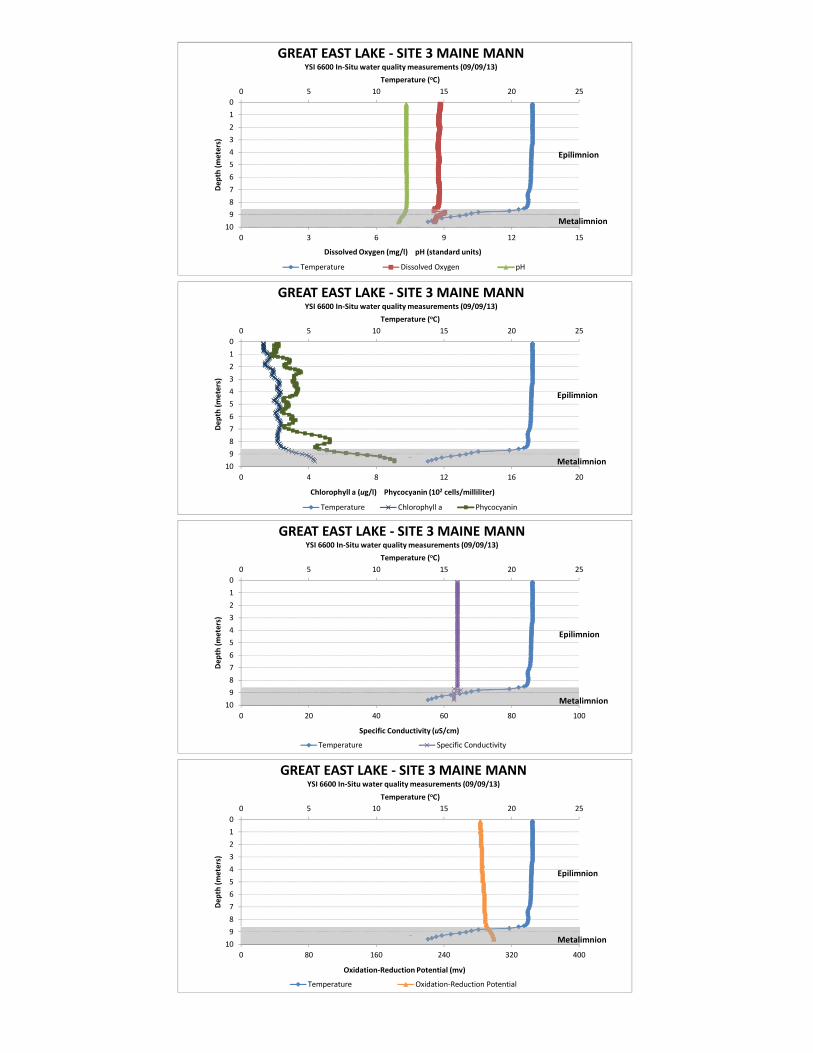
0 3 6 9 12 15
0
1
2
3
4
5
6
7
8
9
10
0 5 10 15 20 25
Dissolved Oxygen (mg/l) pH (standard units)
Dep
th (meters)
Temperature (oC)
GREAT EAST LAKE ‐ SITE 3 MAINE MANNYSI 6600 In‐Situ water quality measurements (09/09/13)
Temperature Dissolved Oxygen pH
Epilimnion
Metalimnion
0 4 8 12 16 20
0
1
2
3
4
5
6
7
8
9
10
0 5 10 15 20 25
Chlorophyll a (ug/l) Phycocyanin (102 cells/milliliter)
Dep
th (meters)
Temperature (oC)
GREAT EAST LAKE ‐ SITE 3 MAINE MANNYSI 6600 In‐Situ water quality measurements (09/09/13)
Temperature Chlorophyll a Phycocyanin
Epilimnion
Metalimnion
0 80 160 240 320 400
0
1
2
3
4
5
6
7
8
9
10
0 5 10 15 20 25
Oxidation‐Reduction Potential (mv)
Dep
th (meters)
Temperature (oC)
GREAT EAST LAKE ‐ SITE 3 MAINE MANNYSI 6600 In‐Situ water quality measurements (09/09/13)
Temperature Oxidation‐Reduction Potential
0 20 40 60 80 100
0
1
2
3
4
5
6
7
8
9
10
0 5 10 15 20 25
Specific Conductivity (uS/cm)
Dep
th (meters)
Temperature (oC)
GREAT EAST LAKE ‐ SITE 3 MAINE MANNYSI 6600 In‐Situ water quality measurements (09/09/13)
Temperature Specific Conductivity
Epilimnion
Metalimnion
Epilimnion
Metalimnion
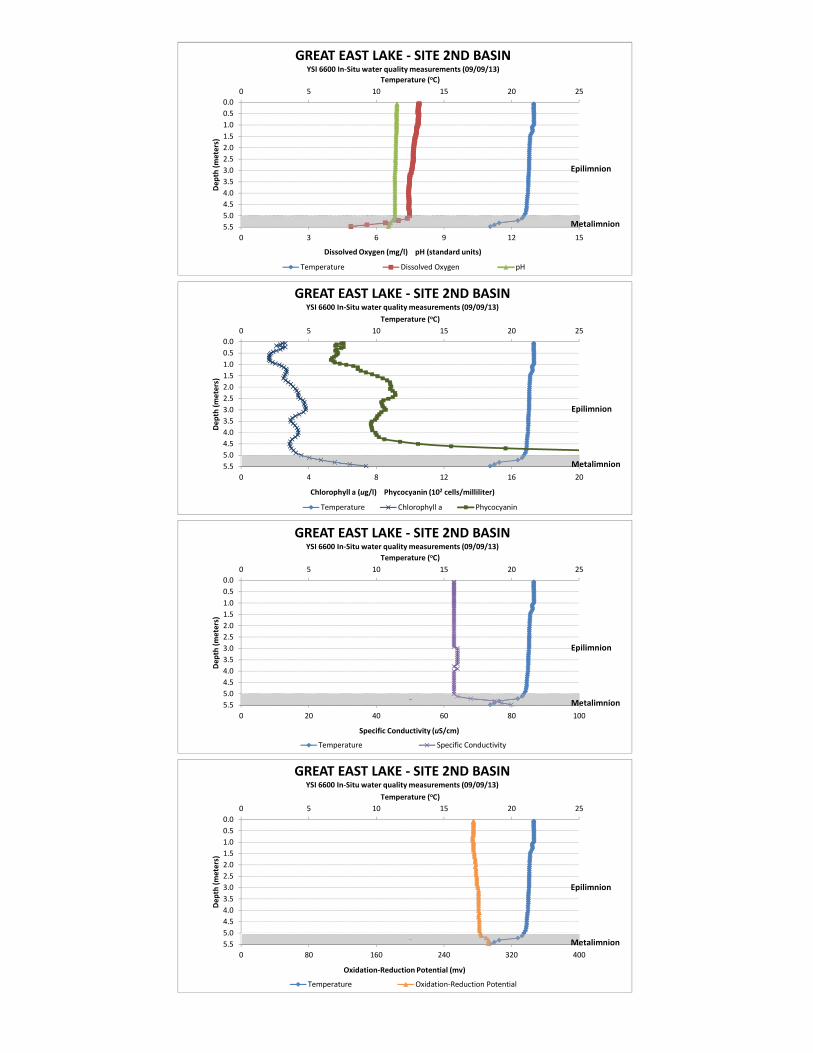
0 3 6 9 12 15
0.0
0.5
1.0
1.5
2.0
2.5
3.0
3.5
4.0
4.5
5.0
5.5
0 5 10 15 20 25
Dissolved Oxygen (mg/l) pH (standard units)
Dep
th (meters)
Temperature (oC)
GREAT EAST LAKE ‐ SITE 2ND BASINYSI 6600 In‐Situ water quality measurements (09/09/13)
Temperature Dissolved Oxygen pH
Epilimnion
Metalimnion
0 4 8 12 16 20
0.0
0.5
1.0
1.5
2.0
2.5
3.0
3.5
4.0
4.5
5.0
5.5
0 5 10 15 20 25
Chlorophyll a (ug/l) Phycocyanin (102 cells/milliliter)
Dep
th (meters)
Temperature (oC)
GREAT EAST LAKE ‐ SITE 2ND BASIN YSI 6600 In‐Situ water quality measurements (09/09/13)
Temperature Chlorophyll a Phycocyanin
Epilimnion
Metalimnion
0 80 160 240 320 400
0.0
0.5
1.0
1.5
2.0
2.5
3.0
3.5
4.0
4.5
5.0
5.5
0 5 10 15 20 25
Oxidation‐Reduction Potential (mv)
Dep
th (meters)
Temperature (oC)
GREAT EAST LAKE ‐ SITE 2ND BASINYSI 6600 In‐Situ water quality measurements (09/09/13)
Temperature Oxidation‐Reduction Potential
0 20 40 60 80 100
0.0
0.5
1.0
1.5
2.0
2.5
3.0
3.5
4.0
4.5
5.0
5.5
0 5 10 15 20 25
Specific Conductivity (uS/cm)
Dep
th (meters)
Temperature (oC)
GREAT EAST LAKE ‐ SITE 2ND BASINYSI 6600 In‐Situ water quality measurements (09/09/13)
Temperature Specific Conductivity
Epilimnion
Metalimnion
Epilimnion
Metalimnion


D - 1
APPENDIX D Lakes Lay Monitoring Program, U.N.H.
[Lay Monitor Data] Great East Lake, Wakefield, New Hampshire & Acton, Maine -- subset of trophic indicators, 2013 Average transparency: 8.7 (2013: 19 values; 4.2 - 10.9 range) Average chlorophyll: 0.9 (2013: 19 values; 0.3 - 1.9 range) Average color: 14.1 (2013: 19 values; 7.5 - 26.4 range) Average alkalinity (gray): 8.0 (2013: 16 values; 6.1 - 9.0 range) Average alkalinity (pink): 9.3 (2013: 16 values; 7.5 - 11.8 range) Average total phosphorus: 4.8 (2013: 17 values; 2.5 - 14.0 range)
* Indicates the Secchi Disk was visible on the lake bottom.
Site Date Secchi Chlorophyll a Dissolved Alkalinity Alkalinity Total
Disk Color gray end pt. pink end pt. Phosphorus
@ pH 5.1 @ pH 4.6 (meters) (ppb) (cpu) (mg/L) (mg/L) (ppb)
1 Center 6/10/2013 10.9 0.6 12.8 8.3 9.0 6.7
1 Center 7/9/2013 8.2 0.6 11.8 7.1 9.5 3.8
1 Center 8/7/2013 9.1 0.3 10.9 8.9 9.9 2.5
1 Center 8/24/2013 10.7 0.8 10.9 8.9 9.8 ----- 1 Center 9/9/2013 10.3 1.0 10.4 ----- ----- 3.6
1 Center 9/27/2013 8.6 1.4 8.5 8.9 9.8 6.0
2 Canal 6/10/2013 10.6 0.7 18.2 6.9 7.5 6.0
2 Canal 7/12/2013 8.3 0.6 14.6 7.9 8.9 3.1
2 Canal 8/7/2013 7.9* 0.4 10.0 8.7 9.8 2.9
2 Canal 8/24/2013 10.8 0.9 11.8 7.7 8.9 ----- 2 Canal 9/9/2013 10.1 1.1 12.3 ----- ----- 3.8
2 Canal 9/27/2013 9.5* 1.0 7.5 8.8 9.7 6.3
2nd Basin 5/28/2013 6.0* 1.0 20.9 9.0 11.8 5.1
2nd Basin 7/12/2013 6.0* 1.3 25.5 6.7 7.9 4.2
2nd Basin 8/3/2013 5.5 1.6 20.0 8.7 10.0 3.5
2nd Basin 9/9/2013 4.2 1.9 26.4 ----- ----- 4.4
3 MMann 5/28/2013 10.5* 0.5 12.8 7.7 8.3 2.5
3 MMann 7/12/2013 8.5 0.9 12.8 6.1 7.6 14.0
3 MMann 9/9/2013 9.6 0.9 10.4 8.7 10.7 3.9
<< End of 2013 data listing; 19 records >>

D - 2
Lakes Lay Monitoring Program , UNH [CFB Data Listing – September 9, 2013]
Site Depth Chl a Dissolved Total Carbon Alkalinity Alkalinity Turbidity
Color Phosphorus Dioxide gray end pt. pink end pt.
@ pH 5.1 @ pH 4.6
(meters) (ug/l) (CPU) (ug/l) (mg/l) (mg/l) (mg/l) (NTU)
1 Center 0.5 2.6 8.2 ----- 0.9 8.1 9.0 0.2
1 Center 4.0 ----- ----- ----- 0.9 8.1 8.9 < 0.2
1 Center 10.0 4.7 10.0 5.2 2.4 8.4 9.2 0.2
1 Center 27.0 ----- ----- 5.6 8.0 8.2 9.0 0.4
1 Center 0-7.5 1.9 8.2 3.3 ----- 8.2 9.0 < 0.2
2 Canal Basin 0.5 2.3 9.1 ----- 1.0 8.1 8.8 < 0.2
2 Canal Basin 4.0 ----- ----- ----- 0.9 8.0 8.8 0.3
2 Canal Basin 11.0 14.6 12.8 7.3 3.0 8.1 8.8 < 0.2
2 Canal Basin 15.0 ----- ----- 6.9 7.3 8.2 9.1 0.3
2 Canal Basin 0-7.5 2.4 8.2 4.0 ----- 8.2 8.8 < 0.2
2nd Basin 0.5 2.5 22.8 ----- 2.5 9.7 10.6 < 0.2
2nd Basin 2.5 ----- ----- ----- 2.6 9.7 10.5 0.2
2nd Basin 5.3 5.3 22.8 16.3 7.3 12.8 13.8 < 0.2
2nd Basin 0-5.0 4.1 20.9 7.9 ----- 9.6 10.2 < 0.2
3 Maine Mann 0.5 2.1 7.3 ----- 1.0 8.1 8.9 0.8
3 Maine Mann 4.0 ----- ----- ----- 1 8.1 8.9 0.8
3 Maine Mann 9.0 2.6 9.1 3.2 1.4 8.2 8.9 1.0
3 Maine Mann 0-7.5 2.1 8.2 3.3 ----- 8.3 9.1 4.2
Site Secchi Disk Transparency (meters) 1 Center 9.8 meters 2 Canal 6.5 meters 2nd Basin 4.2 meters 3 Maine Mann 9.2 meters

E - 1
APPENDIX E GLOSSARY OF LIMNOLOGICAL TERMS Aerobe- Organisms requiring oxygen for life. All animals, most algae and some bacteria require oxygen for respiration. Algae- See phytoplankton. Alkalinity- Total concentration of bicarbonate and hydroxide ions (in most lakes). Anaerobe- Organisms not requiring oxygen for life. Some algae and many bac-teria are able to respire or ferment without using oxygen. Anoxic- A system lacking oxygen, therefore incapable of supporting the most common kind of biological respiration, or of supporting oxygen-demanding chem-ical reactions. The deeper waters of a lake may become anoxic if there are many organisms depleting oxygen via respiration, and there is little or no replenish-ment of oxygen from photosynthesis or from the atmosphere. Benthic- Referring to the bottom sediments. Bacterioplankton- Bacteria adapted to the "open water" or "planktonic" zone of lakes, adapted for many specialized habitats and include groups that can use the sun's energy (phytoplankton), some that can use the energy locked in sulfur or iron, and others that gain energy by decomposing dead material. Bicarbonate- The most important ion (chemical) involved in the buffering sys-tem of New Hampshire lakes. Buffering- The capacity of lakewater to absorb acid with a minimal change in the pH. In New Hampshire the chemical responsible for buffering is the bicar-bonate ion. (See pH.) Chloride- One of the components of salts dissolved in lakewater. Generally the most abundant ion in New Hampshire lakewater, it may be used as an indicator of raw sewage or of road salt. Chlorophyll a- The main green pigment in plants. The concentration of chlo-rophyll a in lakewater is often used as an indicator of algal abundance. Circulation- The period during spring and fall when the combination of low water temperature and wind cause the water column to mix freely over its entire depth. Density- The weight per volume of a substance. The more dense an object, the heavier it feels. Low-density liquids will float on higher-density liquids.

E - 2
Dimictic- The thermal pattern of lakes where the lake circulates, or mixes, twice a year. Other patterns such as polymictic (many periods of circulation per year) are uncommon in New Hampshire. (See also meromictic and holomictic). Dystrophy- The lake trophic state in which the lakewater is highly stained with humic acids (reddish brown or yellow stain) and has low productivity. Chlorophyll a concentration may be low or high. Epilimnion- The uppermost layer of water during periods of thermal stratifica-tion. (See lake diagram). Eutrophy- The lake trophic state in which algal production is high. Associated with eutrophy is low Secchi Disk depth, high chlorophyll a, and high total phos-phorus. From an esthetic viewpoint these lakes are "bad" because water clarity is low, aquatic plants are often found in abundance, and cold-water fish such as trout and salmon are usually not present. A good aspect of eutrophic lakes is their high productivity in terms of warm-water fish such as bass, pickerel, and perch. Free CO2- Carbon dioxide that is not combined chemically with lake water or any other substances. It is produced by respiration, and is used by plants and bacteria for photosynthesis. Holomixis- The condition where the entire lake is free to circulate during peri-ods of overturn. (See meromixis.) Humic Acids- Dissolved organic compounds released from decomposition of plant leaves and stems. Humic acids are red, brown, or yellow in color and are present in nearly all lakes in New Hampshire. Humic acids are consumed only by fungi, and thus are relatively resistant to biological decomposition. Hydrogen Ion- The "acid" ion, present in small amounts even in distilled wa-ter, but contributed to rain-water by atmospheric processes, to ground-water by soils, and to lakewater by biological organisms and sediments. The active com-ponent of "acid rain". See also "pH" the symbolic value inversely and exponen-tially related to the hydrogen ion. Hypolimnion- The deepest layer of lakewater during periods of thermal strati-fication. (See lake diagram) Lake- Any "inland" body of relatively "standing" water. Includes many syno-nyms such as ponds, tarns, loches, billabongs, bogs, marshes, etc. Lake Morphology- The shape and size of a lake and its basin. Littoral- The area of a lake shallow enough for submerged aquatic plants to grow. Meromixis- The condition where the entire lake fails to circulate to its deepest points; caused by a high concentration of salt in the deeper waters, and by pecu-liar landscapes (small deep lakes surrounded by hills and/or forests. (Contrast holomixis.)

E - 3
Mesotrophy- The lake trophic state intermediate between oligotrophy and eu-trophy. Algal production is moderate, and chlorophyll a, Secchi Disk depth, and total phosphorus are also moderate. These lakes are esthetically "fair" but not as good as oligotrophic lakes. Metalimnion- The "middle" layer of the lake during periods of summer thermal stratification. Usually defined as the region where the water temperature changes at least one degree per meter depth. Also called the thermocline. Mixis- Periods of lakewater mixing or circulation. Mixotrophy- The lake condition where the water is highly stained with humic acids, but algal production and chlorophyll a values are also high. Oligotrophy- The lake trophic state where algal production is low, Secchi Disk depth is deep, and chlorophyll a and total phosphorus are low. Esthetically these lakes are the "best" because they are clear and have a minimum of algae and aquatic plants. Deep oligotrophic lakes can usually support cold-water fish such as lake trout and land-locked salmon. Overturn- See circulation or mixis pH- A measure of the hydrogen ion concentration of a liquid. For every de-crease of 1 pH unit, the hydrogen ion concentration increases 10 times. Symbol-ically, the pH value is the "negative logarithm" of the hydrogen ion concentra-tion. For example, a pH of 5 represents a hydrogen ion concentration of 10-5 mo-lar. [Please thank the chemists for this lovely symbolism -- and ask them to ex-plain it in lay terms!] In any event, the higher the pH value, the lower the hy-drogen ion concentration. The range is 0 to 14, with 7 being neutral 1 denoting high acid condition and 14 denoting very basic condition. Photosynthesis- The process by which plants convert the inorganic substances carbon dioxide and water into organic glucose (sugar) and oxygen using sunlight as the energy source. Glucose is an energy source for growth, reproduction, and maintenance of almost all life forms. Phytoplankton- Microscopic algae which are suspended in the "open water" zone of lakes and ponds. A major source of food for zooplankton. Common ex-amples include: diatoms, euglenoids, dinoflagellates, and many others. Usually included are the blue-green bacteria. Parts per million- Also known as "ppm". This is a method of expressing the amount of one substance (solute) dissolved in another (solvent). For example, a solution with 10 ppm of oxygen has 10 pounds of oxygen for every 999,990 pounds (500 tons) of water. Domestic sewage usually contains from 2 to 10 ppm phosphorus. Parts per billion- Also known as "ppb". This is only 1/1000 of ppm, therefore much less concentrated. As little as 1 ppb of phosphorus will sustain growth of algae. As little as 10 ppb phosphorus will cause algal blooms! Think of the ratio as 1 milligram (1/28000 of an ounce) of phosphorus in 25 barrels of water (55 gal-lon drums)! Or, 1 gallon of septic waste diluted into 10,000 gallons of lakewater. It adds up fast!
E - 4
Plankton- Community of microorganisms that live suspended in the water col-umn, not attached to the bottom sediments or aquatic plants. See also "bacteri-oplankton" (bacteria), "phytoplankton" (algae) and "zooplankton" (microcrusta-ceans and rotifers). Saturated- When a solute (such as water) has dissolved all of a substance that it can. For example, if you add table salt to water, a point is reached where any additional salt fails to dissolve. The water is then said to be saturated with ta-ble salt. In lakewater, gaseous oxygen can dissolve, but eventually the water be-comes saturated with oxygen if exposed sufficiently long to the atmosphere or another source of oxygen. Specific Conductivity- A measure of the amount of salt present in lakewater. As the salt concentration increases, so does the specific conductivity (electrical conductivity). Stratum- A layer or "blanket". Can be used to refer to one of the major layers of lakewater such as the epilimnion, or to any layers of organisms or chemicals that may be present in a lake. Thermal Stratification- The process by which layers are built up in the lake due to heating by the sun and partial mixing by wind. Thermocline- Region of temperature change. (See metalimnion.) Total Phosphorus- A measure of the concentration of phosphorus in lake-water. Includes both free forms (dissolved), and chemically combined form (as in living tissue, or in dead but suspended organisms). Trophic Status- A classification system placing lakes into similar groups ac-cording to their amount of algal production. (See Oligotrophy, Mesotrophy, Eu-trophy, Mixotrophy, and Dystrophy for definitions of the major categories) Z- A symbol used by limnologists as an abbreviation for depth. Zooplankton- Microscopic animals in the planktonic community. Some are called "water fleas", but most are known by their scientific names. Scientific names include: Daphnia, Cyclops, Bosmina, and Kellicottia.