greater colombo traffic management - · pdf filegreater colombo traffic management research...
TRANSCRIPT

GREATER COLOMBO TRAFFIC MANAGEMENT
Research Report 0902 Research Grant provided by Hon. Dullas Alahapperuma, Minister of Transport, Sri Lanka
Amal S. Kumarage, Professor & Head, Department of Transport & Logistics Management
Janaka Weerawardana,
Researcher
Transport Research & Study Centre
University of Moratuwa Moratuwa Sri Lanka
20th April 2009
i
Contents 1 Scope of the Research ................................................................................................ 1 1.1 Overview on the Problems at Present ........................................................................... 1 1.2 Solutions and their Viabilities ...................................................................................... 2
1.2.1 Road Capacity Development ............................................................................ 2 1.2.2 Travel Demand Management ........................................................................... 3
1.3 The New Policy on Traffic Management ..................................................................... 5 1.4 Scope of the Study ....................................................................................................... 7
1.4.1 Data Sources Used ........................................................................................... 7 1.4.2 Summary of Executions ................................................................................... 8
2 Characteristics of Travel Demand in Colombo ...................................................... 10 2.1 Introduction ............................................................................................................... 10 2.2 Growth of Road Traffic in Colombo .......................................................................... 10 2.3 Present Road Traffic Condition in Colombo .............................................................. 12 2.4 Timely Variation of Demand ..................................................................................... 17 2.5 Purpose of Traveling to Colombo City....................................................................... 17
3 Assessment of Premium Service .............................................................................. 19 3.1 Introduction: ............................................................................................................ 19 3.2 Necessity of a premium service ................................................................................. 20 3.3 Potential users of premium service ............................................................................ 22 3.4 Route Planning Criteria ............................................................................................. 22
3.4.1 Trip generating and attracting areas of potential users .................................... 23 3.4.2 Destinations for the services ........................................................................... 24 3.4.3 Intermediate Pick & Drop Points for the Service ............................................ 27
3.5 Operational Aspects of the Services ........................................................................... 29 3.6 Public Opinions on the Premium Service ................................................................... 29
4 Assessment of Variable Work Hour Program ........................................................ 32 4.1 Introduction ............................................................................................................... 32 4.2 Flex-Hours ................................................................................................................ 32 4.3 Compressed Work Week ........................................................................................... 33 4.4 Staggered Work Hours .............................................................................................. 34 4.5 Variable Work Hour Programs’ impact on Transportation ......................................... 35 4.6 Administrative Considerations ................................................................................... 36
4.6.1 Flex-Hour Considerations .............................................................................. 36 4.6.2 Compressed Work Week Considerations ........................................................ 37 4.6.3 Staggered Work Hour Considerations ............................................................ 37
4.7 Execution of Program ................................................................................................ 38 4.8 Public Opinions on Variable Work Hours .................................................................. 41
4.8.1 National Transport Commission ..................................................................... 41 4.8.2 Ceylon Electricity Board & Department of Inland Revenue ........................... 47 4.8.3 National Chamber of Commerce, Sri Lanka ................................................... 50
Responders who are experiencing Variable Work Hours at present.................................. 51 Responders who are experiencing Normal Work Hours at present ................................... 52
ii
5 Assessment of Present Route Network & Re- routing ............................................ 54 5.1 Introduction ............................................................................................................... 54 5.2 Present Bus Route Network in CMC.......................................................................... 55
5.2.1 Orientation of the Network............................................................................. 55 5.2.2 Bus Routes and Frequencies ........................................................................... 56 5.2.3 Bus Stopping and Terminals .......................................................................... 57
5.3 Behavior of Bus & Rail Passengers ........................................................................... 59 5.4 Considerations for Re-Routing .................................................................................. 60
6 Assessment of BRT-Battaramulla-Dematagoda ..................................................... 62 6.1 Introduction ............................................................................................................... 62 6.2 Present Accessibility Options to Battaramulla Area ................................................... 62
6.2.1 Zones for Passenger Flow Analysis ................................................................ 62 6.2.2 Approach from Colombo West to Battaramulla .............................................. 62 6.2.3 Approach from Colombo North to Battaramulla ............................................. 62 6.2.4 Approach from Colombo South to Battaramulla ............................................. 64
6.3 Potential Passenger Trips between Battaramulla and Rest of Greater Colombo Area . 64 6.3.1 Passenger Trips in Public Bus Transport Modes (Route Buses) ...................... 65 6.3.2 Rail Transport ................................................................................................ 71 6.3.3 Private Transport Modes ................................................................................ 72
6.4 Estimation of Passenger Demand for Proposed MRT Trace ....................................... 73 6.4.1 Estimated diversion of Bus Passengers ........................................................... 73 6.4.2 Estimated passenger diversion of Private vehicles .......................................... 75 6.4.3 Total Passenger Demand for Proposed Corridor of MRT................................ 76
7 Fuel Conservation Capacity of New Introductions ................................................. 77 7.1 Contribution of New Services in brief ........................................................................ 77 7.2 Introduction of Premium Service ............................................................................... 77
7.2.1 Program Impact to Vehicular Flow ................................................................ 77 7.2.2 Estimated reduction of private vehicle kms and Fuel Consumption ................ 80
7.3 Introduction of Car/Van Pooling ................................................................................ 81 7.3.1 Program Impact to Vehicular Flow ................................................................ 81 7.3.2 Forecasted reduction of private vehicles and Fuel Consumption ..................... 82
7.4 Bus Rapid Transit (Battaramulla-Dematagoda) .......................................................... 82 7.4.1 Program Impact to Vehicular Flow ................................................................ 82 7.4.2 Forecasted reduction of private vehicles and Fuel Consumption ..................... 82
7.5 Introduction of Variable Working Hours ................................................................... 83 7.5.1 Program Impact to Vehicular Flow ................................................................ 83 7.5.2 Forecasted reduction of private vehicles and Fuel Consumption ..................... 83
7.6 Contribution of new services for the improvement of flow speed ............................... 84 7.6.1 Program Impact to Improve Flow Speed ........................................................ 84 7.6.2 Forecasted reduction of Fuel Consumption..................................................... 84

iii
List of Figures Figure 1-1: Analytical Representation on Present Transport Issues in Colombo City ............. 2 Figure 2-1: Comparison of Passenger Modal Share Since 1975 to 2003............................... 11 Figure 2-2: Major Accessing Corridors for Colombo City and their Flows .......................... 12 Figure 2-3: Road Passenger- Vehicle share at CMC boundary ............................................. 15 Figure 2-4: 12 hour-two way traffic flow on Colombo-Negombo Road ............................... 16 Figure 2-5: 12 hour-two way traffic flow on Parliament Road ............................................. 16 Figure 2-6: Variation of Vehicle Composition on Colombo-Negombo Road ....................... 17 Figure 2-7: Travelling Purpose of trip makers at CMC boundary ......................................... 18 Figure 2-8: Percentage of trips by its purposes at CMC boundary towards city, 2004 .......... 18 Figure 3-1: Cumulative Private Vehicle Composition by Travelling Purpose ....................... 19 Figure 3-2: Provincial Share of Vehicle Fleet,2007 ............................................................. 20 Figure 3-3: Growth of Revenue license issued in CMR (2003-07) ....................................... 21 Figure 3-4: Trip Attracting and Generating Center in Colombo ........................................... 23 Figure 3-5: Premium Service Bus Route, Kadawatha-Nawam Mawatha .............................. 27 Figure 3-6: Premium Service Bus Route, Katubedda-Nawam Mawatha............................... 28 Figure 3-7: Passenger Willingness on Premium Service by Present Mode of Travel ............ 29 Figure 3-8: Expected cost/km for a Premium Service by Present Mode of Travel ................ 30 Figure 3-9: Additional Trip Makers’ Willingness on Premium Service ................................ 31 Figure 4-1: Flex time Work Hours Vs Standard Work Hours ............................................... 32 Figure 4-2: Compressed Work Week-4/40 Program ............................................................ 34 Figure 4-3: Compressed Work Week- 3/12 Program ........................................................... 34 Figure 4-4: Schedule of Staggered Work Hours ................................................................... 35 Figure 4-5: Private Vehicular Flow at CMC boundary, 2004 ............................................... 35 Figure 4-6: Stake holder Responsibilities in executing Variable Work Hour Program.......... 38 Figure 4-7 Traveling modes of NTC staff ............................................................................ 41 Figure 4-8 Analysis of arrival & return trip convenience level- NTC, 2008 ......................... 42 Figure 4-9 Analysis of work trip convenience level- NTC,2008 .......................................... 43 Figure 4-10 Analyses of reasons for travel convenience-NTC,2008 ..................................... 44 Figure 4-11 Analysis of FWH impact in personal affairs- NTC,2008 ................................... 45 Figure 4-12 Primary reasons for the convenience of personal affairs-NTC, 2008 ................. 45 Figure 4-13: Analysis of FWH impact in official affairs- NTC,2008 ................................... 46 Figure 4-14 Analysis of overall view about present FWH program- NTC, 2008 .................. 47 Figure 4-15: Traveling modes of CEB & IRD staff ............................................................. 48 Figure 4-16: Comparison of Traveling Ease by Mode of Travel in Arrival Trip ................... 48 Figure 4-17: Comparison of Traveling Ease by Mode of Travel in Return Trip ................... 49 Figure 4-18: Percentage of Passengers Experiencing Convenience ...................................... 49 Figure 4-19: Reasons for Travel Comfort under FWH scheme ............................................ 50 Figure 4-20: Level of Convenience in Personal and Official Affairs .................................... 50 Figure 4-21: Interest on variable work hours by mode of travel ........................................... 51 Figure 4-22: Interest on variable work hours by trip length .................................................. 52 Figure 4-23: Interest on normal work hours by mode of transport ........................................ 52 Figure 4-24: Interest on normal work hours by trip length ................................................... 53 Figure 5-1: Variation of Load Factor at Rajagiriya, Parliament Road ................................... 54 Figure 5-2: Distribution of Present Route Network .............................................................. 55 Figure 5-3: Bus Stops and Terminal in Fort and Pettah Area ............................................... 58 Figure 5-4: Routing of Buses coming in Galle Road and DR Wijewardana ......................... 60 Figure 5-5: Probable arrangement of bus routings with Link provided ................................. 61 Figure 6-1: Zones for Passenger Flow Analysis ................................................................... 63

iv
Figure 6-2 Relationship of AAPF, MPPF, EPPF and Total Flow at Borella ......................... 64 Figure 6-3 Bus Passenger Trips at Battaramulla .................................................................. 65 Figure 6-4 Route share of Bus Passengers entering to CMC at Rajagiriya .......................... 66 Figure 6-5 Route share of Bus Passengers leaving CMC at Rajagiriya . Error! Bookmark not defined. Figure 6-6: Bus Passenger Flow between Battaramulla and Colombo west/north................. 71 Figure 6-7: Private vehicular passenger flow Between Battaramulla and Colombo North .... 73 Figure 6-8 Estimated passenger demand for the proposed transit option .............................. 76 Figure 7-1: Contribution of New Services for Reducing Fuel Usage .................................... 77 Figure 7-2: Traffic Flow at CMC boundary, 2004 ............................................................... 78 Figure 7-3: Fuel efficiency survey for typical vehicles ........................................................ 85

v
List of Tables Table 1-1: Important Buildings in Colombo City ................................................................... 1 Table 1-2: Road density comparison...................................................................................... 3 Table 1-3: Summary of executions in Research Components ................................................. 8 Table 2-1: Daily Passenger Flow at the CMC Boundary-Both Directions (1965-2005) ........ 10 Table 2-2: Growth of Traffic Entering to Colombo City ...................................................... 11 Table 2-3: Average Daily Traffic at CMC boundary, 2004 .................................................. 13 Table 2-4: Daily Passenger Flow at CMC Boundary- Both directions, 2004 ........................ 14 Table 3-1: Travel Pattern in CMC Area, 1996 (24-hours, weekday) .................................... 20 Table 3-2: Consumer Expenditure Shares, %, 2003/04 ........................................................ 21 Table 3-3: Origin- Destination Flows of Greater Colombo Intra Regional Trips, 2006 ........ 25 Table 3-4: Origin- Destination Flows of CMC-CMR Inter Regional Trips, 2004 ................. 26 Table 4-1: Percentages of different types of trip experiences-NTC,2008.............................. 43 Table 4-2 Percentages of different types of scenarios experiences-NTC,2008 ...................... 46 Table 5-1: Pettah/Fort Originated Bus Routes and Their Frequencies .................................. 56 Table 5-2: Bus Stops and Terminals in Pettah and Fort Area ............................................... 58 Table 5-3: Daily Bus Parkings in Pettah and Fort Bus Stands .............................................. 59 Table 5-4: Origin- Destinations of Pettah/Fort Bus Travelers .............................................. 59 Table 5-5: Origin- Destinations of Pettah/Fort Rail Travelers .............................................. 59 Table 6-1: Route Share of Passengers Traveling from Battaramulla to Colombo City .......... 67 Table 6-2 Summary of bus passenger flow from Battaramulla to Colombo North/West ...... 68 Table 6-3: Route Share of Passengers attracted to Battaramulla from Colombo City ........... 69 Table 6-4: Bus passenger flow from Colombo North/West to Battaramulla ......................... 70 Table 6-5: Bus passenger Flow between Battaramulla and Colombo west/north .................. 70 Table 6-6: Private Vehicle Flow between Battarmulla and Colombo North ......................... 72 Table 6-7: Private Vehicular Passenger Flow between Battaramulla and Colombo North .... 72 Table 6-8: Bus Passenger Flow Estimation from Battaramulla to Dematagoda .................... 74 Table 6-9: Estimated Bus Passenger diversion to the proposed BRT from Battaramulla ...... 75 Table 6-10: Estimated Bus Passenger diversion to the proposed BRT from Dematagoda ..... 75 Table 6-11: Estimated passenger diversion of private vehicles to proposed rapid transit ...... 75 Table 6-12: Estimated passenger demand for the proposed transit option............................. 76 Table 7-1: Home based Work Trips by Private Vehicles...................................................... 81 Table 7-2: Reductions in Private Modes Due to Car and Van Pooling ................................. 82

1
1 Scope of the Research
1.1 Overview on the Problems at Present Colombo city is the centre of the economy in Sri Lanka. Government offices, private offices, factories, hospitals, hotels, schools and harbor located within the city induces higher daily regular travel demand towards the city core. It also drives large amount of ad-hoc travelers since it binds all parts of the country by keeping country’s major road and rail passenger transport node within the centre of the city. Therefore most of passengers traveling between the western part and the rest of the country have to at least touch the Colombo city in their journey.
Table 1-1: Important Buildings in Colombo City Feature Nos.
Police Stations 19 Primary and Secondary Schools 132 Government and Private Banks 97 Government offices 161 Government and private Hospitals 40 Embassies 31 Hotels 13 Theatres & Cinemas 27 Places of Worships 53 Bus Stoppings and Terminals (Fort and Pettah only) 10 Railway stations 6
Attracting higher amount of vehicles and passengers leads to the traffic congestion on the roads as well as the inter-modal congestion in public transport modes. These congestion issues can be considered as the outputs produced by attracting people and vehicles for the activities in the city. These outputs interact with the prevailing socio-economic-environmental aspects and produces negative outcomes. For an example, output such as traffic congestion consumes higher amount of fuel and also emits higher amount SO2 to the environment polluting air in surrounding. Therefore it can be concluded that the traffic congestion leads to two negative impacts of fuel waistage and air pollution in economic and environmental sectors respectively. Additionally, the inefficiency of agencies and the higher cost for maintaining road assets are also can be considered as negative impacts of road traffic and inter-modal congestions. Afore-mentioned ideology can be represented in graphically as illustrated in Figure 1-1.

2
Figure 1-1: Analytical Representation on Present Transport Issues in Colombo City
1.2 Solutions and their Viabilities In fast few decades it was noticeable that the rapid growth of vehicle coming to the city was predominantly increased and hence the problems attached to the transportation were also severe. But so-far, the government has not made an effective intervention for catering or managing the travel demand as a response to the problems governing at present. But there are two basic interventions are in discussion to get rid of the situation prevailing. They are,
1. Road Capacity Development for catering increasing demand or 2. Managing inputs as it reduce the impacts of outputs and hence the outcomes
But the viability of such kind of interventions should be assessed with respect to the present geographic and demographic profile of the city.
1.2.1 Road Capacity Development The road infrastructure in Colombo city and its suburb cannot be further widened or new roads built keeping with the rate of demand created by people who are shifting from public transport to private transport. The inability to obtain the required land for road space, parking spaces etc are fast becoming constraints that are severely restricting the flow of vehicles which far exceed the capacity of the road system to efficiently discharge the demand. As a result, around 70% of the length of the national roads within the 10-km radius from the city

3
centre is congested throughout the day. The average speed on these roads falls below 15 kms per hour. At such speeds, fuel consumption doubles, consequently increasing air pollution as well. On the other hand, widening or building new roads cannot be accepted as a solution of managing travel demand since Colombo and its suburb already contains lengthy road network providing several accessing options for single specific location. This issue is further confirmed by the statistics appeared in Table 1-2. It indicates that Sri Lanka is having the highest road density in terms of length per area in South Asia and more interestingly CMC and its suburb exceeds overall value of Sri Lanka equalling to a value of 3.48 km/sqkm. Besides that, the higher population density of 17.40 pop/sqkm is also clearly indicates the difficulty of land acquisitions for further road development activities. Projects such as the extension of the Duplication Road, widening and extension of Baseline Road and Marine Drive have clearly illustrated the difficulties in land acquisition in a city which is both historic and densely built up.
Table 1-2: Road density comparison Country Road Density Population Density (1000
Population/sqkm) km/sq km km/1000 population
Nepal 0.13 0.71 0.18 Pakistan 0.33 1.73 0.19 Bangladesh 0.95 1.01 0.94 Bhutan 0.20 5.71 0.04 India 1.01 2.78 0.36 Sri Lanka 1.61 5.53 0.29 Colombo Metropolitan Region 3.64 2.80 1.30 Colombo District 5.40 1.80 3.00 CMC 3.48 0.20 17.40
1.2.2 Travel Demand Management Limitations of highway development evidently tell to find a solution for prevailing problems through managing present travel demand for the Colombo city. In recent past, there are debatable proposals has been forwarded in this regard such as
• By shifting passenger attracting functions to outskirt of the City such as Maharagma, Nugegoda, Panadura, Kiribathgoda etc Last ten years it was noticeable that some of the private sector businesses and offices were started to shift to the outskirt of the Colombo city areas such as Maharagma, Nugegoda, Panadura, Kiribathgoda etc. Though these unplanned developments of above cities are contributed to decrease the passenger flow towards the city centre, it has not been caused to decrease the traffic congestion in the city. Furthermore these in

4
turn are causing congestion along the major arteries thus throttling the city even further. Therefore this cannot be accepted as a right move in terms of road traffic management of Colombo city.
• Controlling or de-motivating vehicular and passenger entries to the City by introducing policy interventions Road pricing, vehicle usage restriction, park and rides, ride sharing and variable work hours are some of possible solutions in this respect. By introducing road pricing schemes for the congested areas, the car users have to pay in terms of value of time for the additional delay added by him. This scheme helps to minimize the private vehicular entries to the city by shifting these users to public transport modes, alternative routes or cancelling the journey. Similarly vehicle usage restrictions based on certain criteria also can be introduced for reducing road congestion in some of the areas in the city. Allowing odd and even numbered vehicles on alternative days is a best option can be followed under this kind of restriction process. Advanced equipments developed for automatic vehicle identification has to be used for regulating both road pricing and vehicle usage restriction schemes effectively. Park and ride and ride sharing options are also effective in terms of congestion reduction especially once they coupled with road pricing and vehicle restriction schemes. Well planed park and ride must provide security for parked vehicles, efficient transfers, reliability of services and comfort for the potential users. Similarly arranging well organized shared transport by matching trip ends of commuters is also accepted as a good practise in managing traffic. Variable work hours facilitate to choose different work schedules for the office based workers’ interest. Thereby these regular travellers tend to use public or private transport modes in different times to approach and leave the city by reducing peak period congestion on the road as well as in the public modes.
• Upgrading public transport The present system of sub optimal bus transport operations and railway services of poor reliability have to be improved to a status wherein they form a realistic choice to those who own or can own a private vehicle. In this context management restructuring of the bus sector as well as introduction of premium level valued added rail and bus services will be a priority. It will also include the provision of priority for public transport which is a wide spread policy adopted by many cities in their attempt to reduce traffic congestion and environmental pollution. It also requires reducing the number of excessive vehicles, re-rerouting and terminating some bus routes away from city centres. Additionally it is a pre-requisition of maintaining a good information system coupled with upgraded public transport system. This would help passengers to plan their journey with minimum distance, time and cost and consequently it would also help to reduce the congestion. Modernized computer based information technology can be used effectively for this purpose.

5
• Managing Freight Transport There are an estimated 15,000 good vehicles movements made to and from the city everyday. Beside this, there are perhaps twice as many freight vehicle trips circulating within the city everyday. Around 2,500 of such movements are to and from the Port. This includes containers, tankers and trucks. Thus around 10% of all goods movements within the city are related to trip ends in the Port. Surveys do however show that around 50% of such movements are empty underlying the lack of coordination in securing return hauls for freight vehicles. The other significant freight vehicle generators are the Vegetable (Manning) market in Pettah as well as the dry goods and hardware markets in 4th Cross Street and Armour Street areas. The movement of goods vehicles in such dense areas by road, results in road congestion. It is thus timely to think of moving such traffic by railways. Therefore encouraging the movements of port related cargo by rail should be considered as an urgent measure. Moreover encouraging the use of excess road capacity at night and during weekends should also be considered as a policy objective. Improving the utilization of cargo carriage by reducing empty truck movements would also be a valuable exercise.
1.3 The New Policy on Traffic Management1 The Ministry of Transport is presently formulating wider transport policy for the country as a whole. Its strategic approach as relevant to Traffic Management to be achieved by the year 2010 is given below: Policy Level Interventions:
o To reduce the number of vehicle arrivals within the city particularly, the daily number of private vehicles from 175,000 to 125,000 by end of 2010. This is estimated to improve traffic speeds by 50% and pollution loads by at least and equal amount.
o To increase railway passenger arrivals to Colombo to increase to at least 120,000 (a 50% increase) by end of 2010 by improving services and new connections where feasible.
o To ensure that at least 1/3rd of existing road space on major highways within a 10 km radius from Colombo Fort as well as within the city be reserved for high occupancy vehicles. Such areas to be utilized for high priority bus lanes, light transit systems (trams) or bus rapid transit (BRT) systems in order to reduce buses and other vehicles.
o To ensure that at least 1/10th of space of all roads within the city are provided exclusively for non-motorized transport such as for sidewalks for walking and bicycle lanes.
o To undertake a complete city rerouting of bus routes in the city and suburbs in order to reduce overlapping routes, promote bus priority roads and reduce excess buses and bus trips.
o To reduce the number of goods vehicles arriving in the city by 50% by the year 2010 by relocating or decentralizing logistics and distribution activities outside the city.
1 Source: Strategic Plan for Traffic Management in Greater Colombo Area, Dec. 2007

6
o To plan to introduce Road Pricing as a measure of managing traffic levels on a long term basis to be implemented after satisfactory public transport alternatives are provided to private vehicle users.
o To plan the priority land use for Colombo and to determine which activities should be gradually moved out to other areas.
o To integrate land use development especially of high density commercial and residential areas in close proximity to public transport corridors.
o To identify & preserve railway land in the city and its suburbs for future development of transport based facilities and appropriate high density urban development activities that are consistent and part of such transport developments.
o To revise vehicle tax structures to encourage vehicle imports that are less polluting and the electrification of suburban railways.
Administrative Level Interventions
o Changes to the National Transport Commission Act to streamline the planning functions and to provide for conversion of the existing single operator bus industry to a professionally managed bus industry.
o Improve the services of the Sri Lanka Transport Board by management restructuring along the lines of the SLTB Act of 2005.
o Improve the services of the Sri Lanka Railways by investing in rolling stock and infrastructure development for both passenger and freight transport especially in the Colombo Urban area.
o Implement a Coordinating Mechanism (by expanding the Presidential Committee on Urban Transport (P-CUT) or similar arrangement) to coordinate activities of traffic demand management in the Colombo Urban Area.
Project Level Interventions (for completion by 2010)
o Ensure the reduction of empty truck movements to and from the city and to encourage the movements of heavy goods vehicles during night times and outside of peak traffic times.
o In particular to ensure the minimum impact of port related traffic on limited road space within the city and to facilitate greater movement of goods movements during night time and off peak hours.
o Commencement of Inland Logistics Hubs at Ratmalana and another location to the east and also to the north of Colombo to reduce the number of heavy vehicles coming in to the city for which Cabinet approval has been obtained.
o Implement a system of well designed bus priority lanes in Colombo city especially in the areas under the One-Way traffic system.
o Implement a modern Bus Rapid Transit (BRT) from Battaramulla to Dematagoda for which Cabinet approval is obtained.
o To develop and modernize the Bastian Mawatha Bus terminal in Pettah

7
o To plan and construct New Multi-modal Terminals in locations such as Dematagoda, Kelaniya, Ratmalana, Battaramulla and other suitable sites to commence park and ride systems so that long distance buses can terminate at these centres in the periphery.
o To operate Value Added Premium Railway Services to attract present private vehicle users
o Feasibility Study to be undertaken to provide inter-modal connectivity between railway stations, bus terminals and points of heavy traffic generation within CMC area with a Light Rail (tram) Transit system.
o To introduce a premium service air conditioned minibus service to attract regular private vehicle users from suburbs to city.
o To implement an Advanced Traffic Control System with priority for high occupancy vehicles within city and suburbs.
o To study and introduce flexible work hours and staggered hours for schools and offices in an attempt to smoothen traffic peaks.
o To study measures to reduce the use of government vehicles especially those assigned for personal use.
Financial Level Interventions
o A budget line of approximately Rs 10 billion per year to be ear-marked for years 2009 and 2010 for Colombo Area Traffic Management Strategy to be implemented by the Ministry of Transport in association with relevant agencies coming under other ministries.
o In this context, it should be mentioned that estimates indicates that the cost of fuel, vehicle wear and tear and travel time lost in Colombo urban area alone is a staggering Rs 35 million a year. The reduction of 25,000 vehicles arriving in the city will be worth around Rs 6 billion per year.
o Moreover it is to be pointed out that urban road construction such as the Colombo-Katunayake Expressway is estimated at Rs 1.2 billion per km, which is much more than most of the other measures suggested in this strategic plan.
1.4 Scope of the Study
1.4.1 Data Sources Used • Manual Classified Counts (MCC), Passenger Origin-Destination surveys (Pax ODs)
conducted by University of Moratuwa, 2004(Canal Transit Project) • Bus Passenger Occupancy Surveys conducted by University of Moratuwa, 2001
(CUTS 2) • Manual Classified Counts (MCC), Passenger Origin-Destination surveys (Pax ODs)
conducted by University of Moratuwa,2006(JICA Urban Transport Development Project)
• Route Lists of National Transport Commission and Western Province Road Passenger Transport Authority, 2008
• Sketches and Verbal explanations provided by WPRPTA on existing bus routings in Greater Colombo Area
8
• Transplan (for 2007) Software of University of Moratuwa • Surveys conducted by National Transport Commission for Testing interest on Flexible
Work Hours in the organizations of CEB, NTC and Inland Revenue • Chaminda Basnayaka’s Program for estimating fuel Consumption • Central Bank data on Vehicle Fleet for 2007 • Bus Occupancy and Routing Surveys in Pettah & Fort area conducted by University
of Moratuwa, 2008
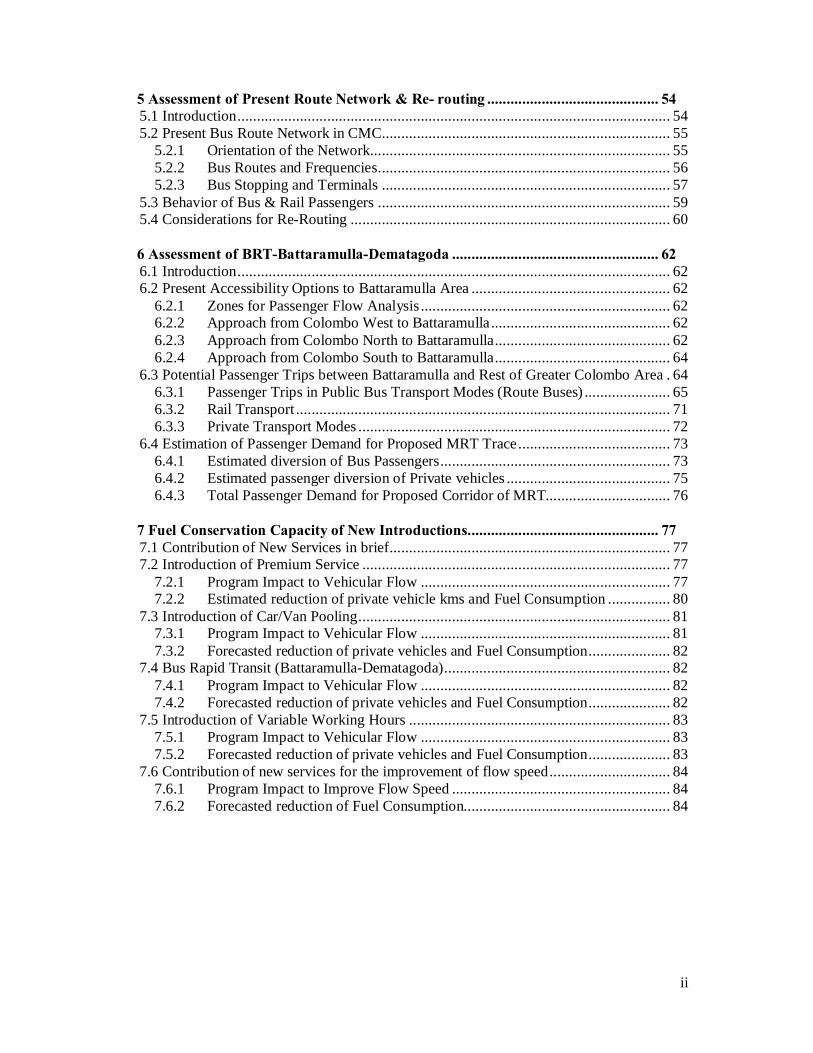
1.4.2 Summary of Executions Following table summarize the work executed with respect to the each above research components.
Table 1-3: Summary of executions in Research Components Project Activities
General Vehicle and passenger flow estimates Identification of vehicle and passenger flow characteristics (VoR, peak periods etc.)
Premium Service Identification of private vehicle user trip purposes Identification of origin & destinations of HBW trips in Colombo area and hence routes for the service Quantifying the probable attraction to the service & the fuel saving Analyzing interest of car users on premium service in several selected agencies
Bus Route Re-organizing
Preparation of Bus Route Map for the Greater Colombo Area
Identification of movements and Frequencies of buses within Fort and Pettah area Identification of overlapping of bus routes
Passenger bus flow estimates in each link in Pettah and Fort Area
Survey data analysis for 141 and 255 for enhancing their service efficiency Analyzing responses of surveys conducted for testing interest on Variable Work Hour Programs (Staffs of NTC,CEB and Inland Revenue Dept were surveyed )
Variable Work Hour Programs
Preparation of implementation guide for Variable Work Hour Program in Sri Lanka Simulation of impact of variable work programs Estimating Fuel saving due to introduction of variable Work Hour Program Estimation of passenger demand for the proposed Bus Rapid Transit option between Battaramulla and Dematagoda

9
Bus Rapid Transit (Battaramulla- Dematagoda)
Estimation of fuel saving due to the proposed BRT
Estimation of vehicle fleet and transport sector fuel consumption for the year of 2007
Other Preparation of drawings for Traffic improvement in Kollupitiya & Bambalapitiya (one-way system)

10
2 Characteristics of Travel Demand in Colombo
2.1 Introduction For managing travel demand of Colombo city, it is necessarily needed to identify and quantify the flow characteristics of both passengers and vehicles at present and past. These types of assessment would help to forecast future trends and take rational proactive decisions based upon them. In general following areas should studied in this regard
• Growth of passenger and vehicular flow, • Passenger and vehicular flow at present, • Travelling purposes of passengers and • Causes of trip attractions and areas of trip attracted and generated
2.2 Growth of Road Traffic in Colombo Since country’s major administrative, business, commercial and educational activities were centralized to the Colombo city centre, it has experienced a steady traffic growth for several decades. But in last few years it is observed that the outskirt areas of Colombo city such as Nugegoda, Maharagama, Panadura and Kiribathgoda were also rapidly developed and used for administrative and economic functions by reducing certain amount of passenger trips driven towards the centre of city. This scenario is affirmed by that though CMC is experienced an annual increase of 5% in the number of persons arriving to the city on a daily basis from 1965 to 1995, it is started decrease since 1995 due to the development of afore-mentioned city suburbs.
Table 2-1: Daily Passenger Flow at the CMC Boundary-Both Directions (1965-2005)2 Corridor Pax
1965 (000s)
AAGR (65-85)
Pax 1985 (000s)
AAGR (85-95)
Pax 1995 (000s)
AAGR (95-05)
Pax 2005 (000s)
Galle Road 91 5.8 279 1.7 331 1.0 365 Negombo & Kandy Rds 118 6.2 400 3.6 607 -1.0 553 Ratnapura Rd 62 4.2 141 3.9 206 -0.5 196 Cotta &n SJ Rd 45 3.5 89 10.8 249 1.3 278 Horana Road 21 5.2 58 8.1 126 -1.3 111 Weelampitiya Road 38 2.0 56 0.1 59 -0.3 57 Narahenpita Road 12 6.2 40 0.1 35 2.8 46 Ambatale Road n/a n/a 32 n/a 63 -0.8 58 Total 387 5.3 1095 4.4% 1676 -0.6 1572 Interestingly however, during the last decade, even though the number of people coming has reduced, the number of vehicles coming to the city has continued to increase. This means that more and more people have shifted from public transport to private vehicles which take more
2 Source: Final Report on JICA funded Colombo Urban Transport Study, Prof. Amal S. Kumarage, 2006
11
space on the road per person, thus allowing fewer people to enter the city especially during peak periods.
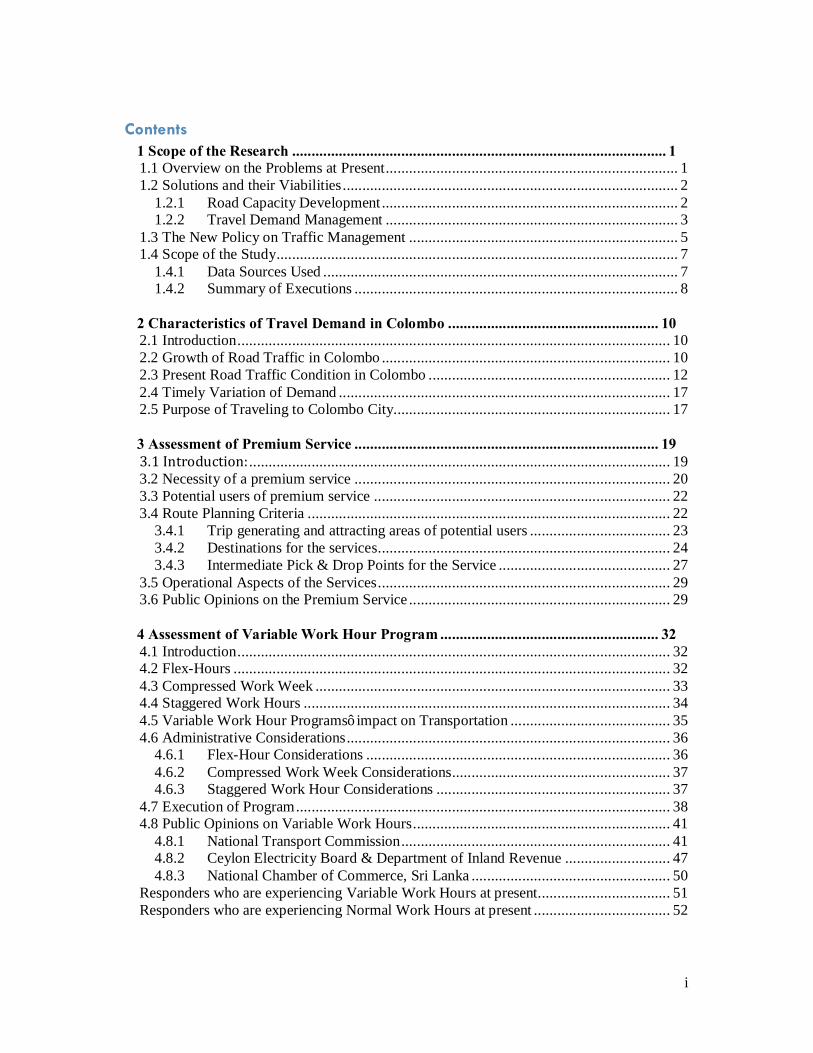
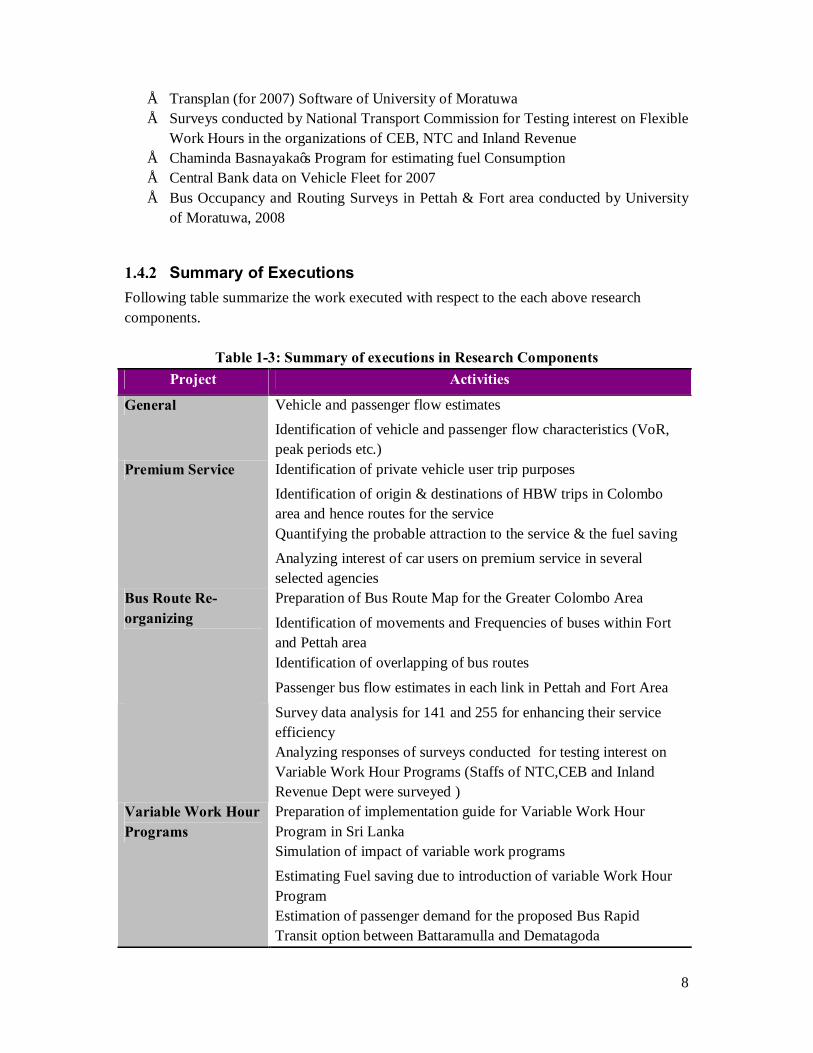
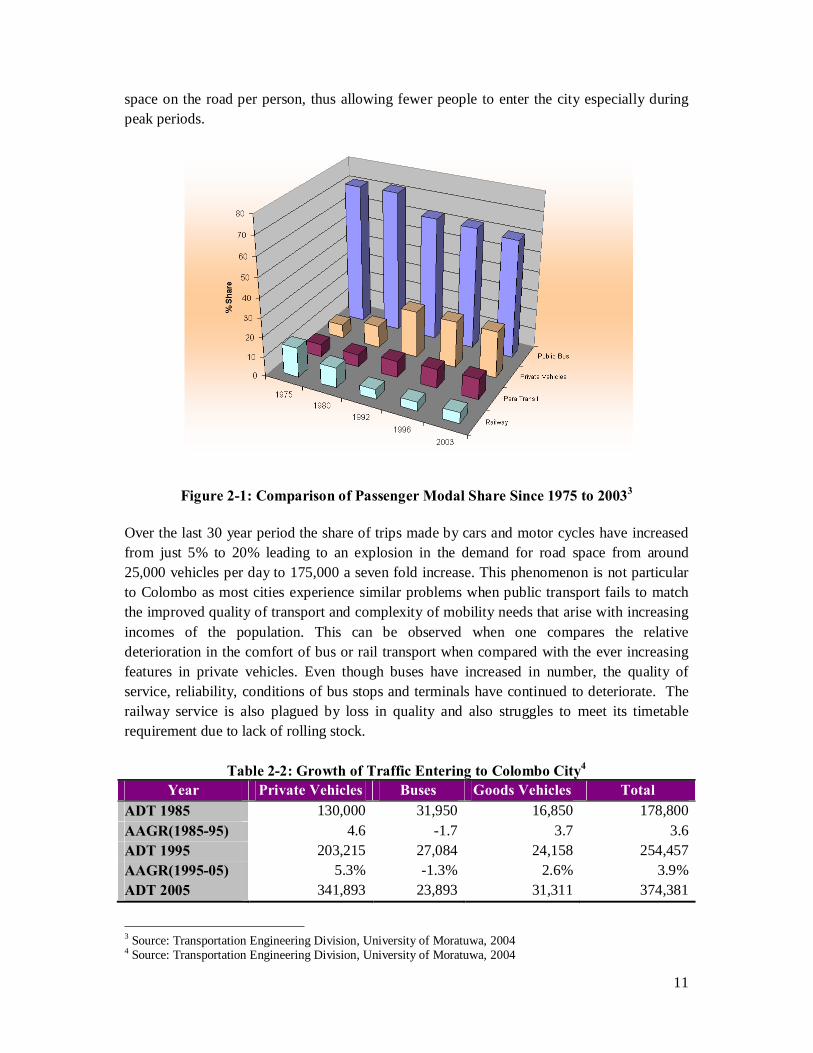
Figure 2-1: Comparison of Passenger Modal Share Since 1975 to 20033 Over the last 30 year period the share of trips made by cars and motor cycles have increased from just 5% to 20% leading to an explosion in the demand for road space from around 25,000 vehicles per day to 175,000 a seven fold increase. This phenomenon is not particular to Colombo as most cities experience similar problems when public transport fails to match the improved quality of transport and complexity of mobility needs that arise with increasing incomes of the population. This can be observed when one compares the relative deterioration in the comfort of bus or rail transport when compared with the ever increasing features in private vehicles. Even though buses have increased in number, the quality of service, reliability, conditions of bus stops and terminals have continued to deteriorate. The railway service is also plagued by loss in quality and also struggles to meet its timetable requirement due to lack of rolling stock.
Table 2-2: Growth of Traffic Entering to Colombo City4 Year Private Vehicles Buses Goods Vehicles Total
ADT 1985 130,000 31,950 16,850 178,800 AAGR(1985-95) 4.6 -1.7 3.7 3.6 ADT 1995 203,215 27,084 24,158 254,457 AAGR(1995-05) 5.3% -1.3% 2.6% 3.9% ADT 2005 341,893 23,893 31,311 374,381
3 Source: Transportation Engineering Division, University of Moratuwa, 2004 4 Source: Transportation Engineering Division, University of Moratuwa, 2004

12
2.3 Present Road Traffic Condition in Colombo There are 10 major accessing corridors for Colombo city and an estimated amount of 750,000 people who arrive to the city by road come in 200,000 vehicles. Of these, 11,000 are buses and 15,000 goods vehicles. The balance of around 175,000 private vehicles carries 1 or 2 passenger each. Presently around 15% of the road space is utilized for bus transport even though it transports 62% of road passengers. On the other hand, 65% of the road space is used by private and hired vehicles which in sum total carry only 38% of the passengers.
Figure 2-2: Major Accessing Corridors for Colombo City and their Flows
0 10,000
20,000
30,000
40,000
50,000
60,000
70,000
Parliament Rd
Kandy Rd
Galle Rd.
Negombo Rd.
Ratnapura Rd.
Horana Rd.
Wellampitiya Rd.
Ambatale Rd.
Narahenpita Rd.
Cotta Rd.
ADT, 2004

13
Table 2-3: Average Daily Traffic at CMC boundary, 20045
No. Corridor
ADT
Mot
or C
ycle
3whe
eler
Car
/salo
on
Util
ity
(Pic
kup/
Jeep
/Van
)
Min
i Bus
Larg
e Bu
s
Serv
ice
Veh
icle
Bicy
cle
Car
t
Ligh
t Goo
ds V
eh
Med
ium
Goo
ds
Veh
Hea
vy G
oods
Veh
Mul
ti A
xle
Goo
ds
Veh
Trac
tors
Tota
l
A000 A1sp,Parliament Road Total 10,372 10,061 21,824 13,071 212 206 353 1,347 0 744 2,361 26 82 79 60,737 Rajagiriya % 17 17 36 22 0 0 1 2 0 1 4 0 0 0 100 A001 Colombo-Kandy Road Total 12,762 8,594 11,967 19,413 2,582 3,246 207 828 5 1,722 5,635 367 494 198 69,290 Kelaniya % 18 12 17 28 4 5 0 1 0 2 8 1 1 0 100 A002 Colombo- Galle Road Total 7,072 10,298 15,671 14,198 1,419 4,258 178 1,322 0 415 477 0 8 70 55,385 Wellawatta % 13 19 28 26 3 8 0 2 0 1 1 0 0 0 100 A003 Colombo-Negombo Road Total 8,100 7,625 9,238 14,115 1,100 1,513 13 343 21 982 4,250 86 1,175 16 48,578 Peliyagoda % 17 16 19 29 2 3 0 1 0 2 9 0 2 0 100 A004 Colombo-Ratnapura Road Total 4,660 4,272 9,706 8,733 530 3,037 141 363 0 321 788 19 27 13 32,609 Sweet House % 14 13 30 27 2 9 0 1 0 1 2 0 0 0 100 B084 Colombo - Horana Road Total 5,058 4,719 9,176 9,376 635 779 127 253 0 572 1,694 17 95 44 32,544 Kohuwala % 16 15 28 29 2 2 0 1 0 2 5 0 0 0 100 B096 Dematagoda-Wellampitiya Total 3,486 5,998 1,927 2,814 432 603 48 1,068 0 197 987 14 158 25 17,757 Kolonnawa % 20 34 11 16 2 3 0 6 0 1 6 0 1 0 100 B435 Urugodawatte-Ambatale Total 3,410 5,743 1,643 2,588 280 660 11 1,350 0 382 2,038 421 218 56 18,801 Meetotamulla % 18 31 9 14 1 4 0 7 0 2 11 2 1 0 100 M013 Nawala-Narahenpita Total 2,811 3,271 10,062 6,558 142 114 104 478 0 382 1,010 37 45 43 25,058 Narahenpita % 11 13 40 26 1 0 0 2 0 2 4 0 0 0 100 B062 Cotta Road Total 5,013 4,326 8,806 8,710 508 867 30 165 0 774 0 319 922 1 30,441 Ayurveda % 16 14 29 29 2 3 0 1 0 3 0 1 3 0 100 Total 62,743 64,909 100,019 99,576 7,841 15,283 1,211 7,518 26 6,489 19,240 1,305 3,224 545 391,200 % 16 17 26 26 2 4 0 2 0 2 5 0 1 0 100
5 Source: University of Moratuwa, 2004
14
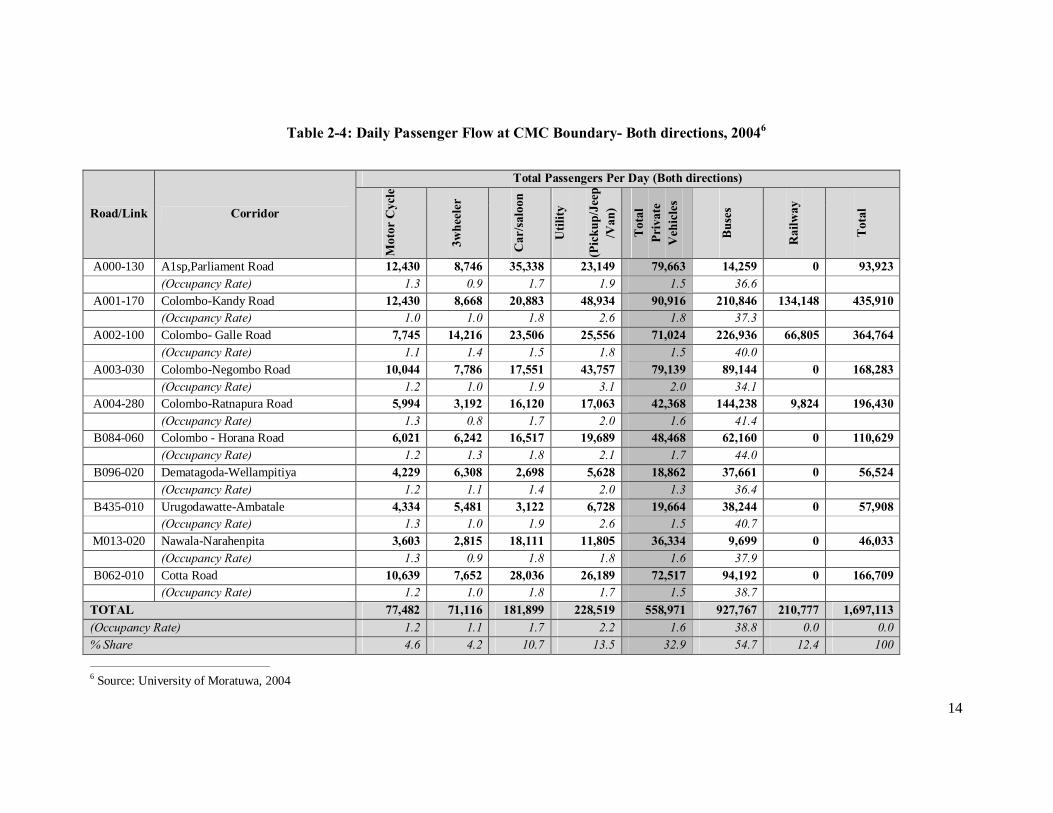
Table 2-4: Daily Passenger Flow at CMC Boundary- Both directions, 20046
6 Source: University of Moratuwa, 2004
Road/Link Corridor
Total Passengers Per Day (Both directions)
Mot
or C
ycle
3whe
eler
Car
/salo
on
Util
ity
(P
icku
p/Je
ep/V
an)
Tota
l Pr
ivat
e V
ehic
les
Buse
s
Rai
lway
Tota
l
A000-130 A1sp,Parliament Road 12,430 8,746 35,338 23,149 79,663 14,259 0 93,923 (Occupancy Rate) 1.3 0.9 1.7 1.9 1.5 36.6
A001-170 Colombo-Kandy Road 12,430 8,668 20,883 48,934 90,916 210,846 134,148 435,910 (Occupancy Rate) 1.0 1.0 1.8 2.6 1.8 37.3
A002-100 Colombo- Galle Road 7,745 14,216 23,506 25,556 71,024 226,936 66,805 364,764 (Occupancy Rate) 1.1 1.4 1.5 1.8 1.5 40.0
A003-030 Colombo-Negombo Road 10,044 7,786 17,551 43,757 79,139 89,144 0 168,283 (Occupancy Rate) 1.2 1.0 1.9 3.1 2.0 34.1
A004-280 Colombo-Ratnapura Road 5,994 3,192 16,120 17,063 42,368 144,238 9,824 196,430 (Occupancy Rate) 1.3 0.8 1.7 2.0 1.6 41.4
B084-060 Colombo - Horana Road 6,021 6,242 16,517 19,689 48,468 62,160 0 110,629 (Occupancy Rate) 1.2 1.3 1.8 2.1 1.7 44.0
B096-020 Dematagoda-Wellampitiya 4,229 6,308 2,698 5,628 18,862 37,661 0 56,524 (Occupancy Rate) 1.2 1.1 1.4 2.0 1.3 36.4
B435-010 Urugodawatte-Ambatale 4,334 5,481 3,122 6,728 19,664 38,244 0 57,908 (Occupancy Rate) 1.3 1.0 1.9 2.6 1.5 40.7
M013-020 Nawala-Narahenpita 3,603 2,815 18,111 11,805 36,334 9,699 0 46,033 (Occupancy Rate) 1.3 0.9 1.8 1.8 1.6 37.9
B062-010 Cotta Road 10,639 7,652 28,036 26,189 72,517 94,192 0 166,709 (Occupancy Rate) 1.2 1.0 1.8 1.7 1.5 38.7
TOTAL 77,482 71,116 181,899 228,519 558,971 927,767 210,777 1,697,113 (Occupancy Rate) 1.2 1.1 1.7 2.2 1.6 38.8 0.0 0.0 % Share 4.6 4.2 10.7 13.5 32.9 54.7 12.4 100

15
Figure 2-3: Road Passenger- Vehicle share at CMC boundary
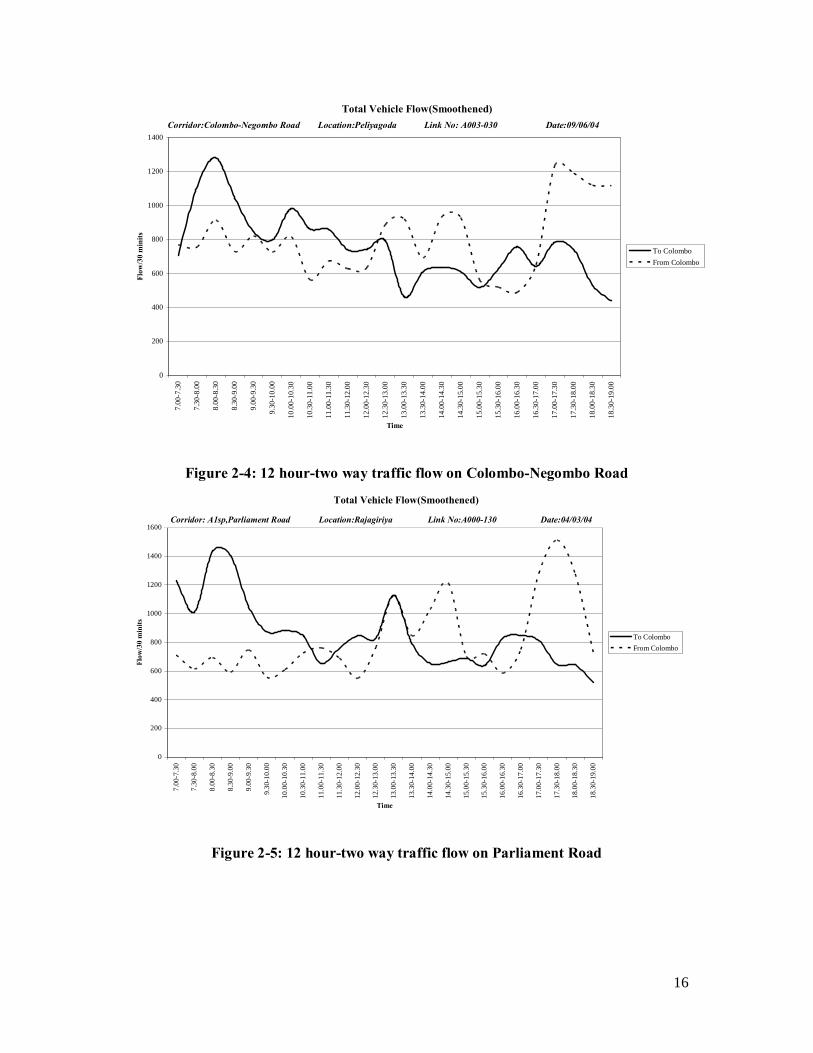
As accordance to the surveys conducted by the University of Moratuwa in 2004, it reveals that an approximately 1.6 million passengers enter to the CMC area from outside of CMC by all modes of passenger transports. Among them, about 33% are traveled by private vehicles and others are used public modes of rail and bus services in 13% and 54% proportions respectively. Addition to the vehicle coming from outside of CMC, there are about 250,000 registered vehicles in the CMC which also contribute to raise the traffic on the roads. In every day all the corridors in the city experience two major traffic peaks in the evening and the morning and several local peaks especially in the after-noon. Obviously the work trips and the school trips cause to raise the traffic level in these corridors at afore-mentioned time durations and further study on peak period traffic flow is elaborated in late chapters. Typical representation of traffic flow on Colombo-Negombo and Parliament Roads are shown in Figure 2-4 and Figure 2-5 in below.
Motor Cycle18%
(6% of pax)
3wheeler19%
(5% of Pax)
Car/Saloon29%
(12% of Pax)
Utility 28%
(15% of Pax)
Mini Bus2%
Large Bus4%
(62% Pax incl.mini bus)
16
Figure 2-4: 12 hour-two way traffic flow on Colombo-Negombo Road
Figure 2-5: 12 hour-two way traffic flow on Parliament Road
Total Vehicle Flow(Smoothened)
0
200
400
600
800
1000
1200
1400
7.00
-7.3
0
7.30
-8.0
0
8.00
-8.3
0
8.30
-9.0
0
9.00
-9.3
0
9.30
-10.
00
10.0
0-10
.30
10.3
0-11
.00
11.0
0-11
.30
11.3
0-12
.00
12.0
0-12
.30
12.3
0-13
.00
13.0
0-13
.30
13.3
0-14
.00
14.0
0-14
.30
14.3
0-15
.00
15.0
0-15
.30
15.3
0-16
.00
16.0
0-16
.30
16.3
0-17
.00
17.0
0-17
.30
17.3
0-18
.00
18.0
0-18
.30
18.3
0-19
.00
Time
Flow
/30
min
its
To Colombo From Colombo
Corridor:Colombo-Negombo Road Location:Peliyagoda Link No: A003-030 Date:09/06/04
Total Vehicle Flow(Smoothened)
0
200
400
600
800
1000
1200
1400
1600
7.00
-7.3
0
7.30
-8.0
0
8.00
-8.3
0
8.30
-9.0
0
9.00
-9.3
0
9.30
-10.
00
10.0
0-10
.30
10.3
0-11
.00
11.0
0-11
.30
11.3
0-12
.00
12.0
0-12
.30
12.3
0-13
.00
13.0
0-13
.30
13.3
0-14
.00
14.0
0-14
.30
14.3
0-15
.00
15.0
0-15
.30
15.3
0-16
.00
16.0
0-16
.30
16.3
0-17
.00
17.0
0-17
.30
17.3
0-18
.00
18.0
0-18
.30
18.3
0-19
.00
Time
Flow
/30
min
its
To Colombo From Colombo
Corridor: A1sp,Parliament Road Location:Rajagiriya Link No:A000-130 Date:04/03/04

17
2.4 Timely Variation of Demand
Figure 2-6: Variation of Vehicle Composition on Colombo-Negombo Road
According to the Figure 2-6 it is clearly illustrated that the peak period congestion is purely created by the private vehicles. Therefore it is an important issue to study of characteristics of private vehicular flow in managing traffic in Colombo.
2.5 Purpose of Traveling to Colombo City One end of the most of trips coming to the city is a home. 41% of home based trips at the CMC boundary are coming to the city with the purpose of working. The majority of 17% home based other trips are produced for schooling purposes. Non-home based trips such as business and official trips are in 41% equaling to the home based work trips.
Total Vehicle Flow Towards CMC
0
200
400
600
800
1000
1200
14007.
00-7
.30
7.30
-8.0
0
8.00
-8.3
0
8.30
-9.0
0
9.00
-9.3
0
9.30
-10.
00
10.0
0-10
.30
10.3
0-11
.00
11.0
0-11
.30
11.3
0-12
.00
12.0
0-12
.30
12.3
0-13
.00
13.0
0-13
.30
13.3
0-14
.00
14.0
0-14
.30
14.3
0-15
.00
15.0
0-15
.30
15.3
0-16
.00
16.0
0-16
.30
16.3
0-17
.00
17.0
0-17
.30
17.3
0-18
.00
18.0
0-18
.30
18.3
0-19
.00
Time
Flow
/30 m
inits All
PrivateFrieghtBuses
Corridor:Colombo-Negombo Road Location:Peliyagoda Link No: A003-030 Date:09/06/04

18
Figure 2-7: Travelling Purpose of trip makers at CMC boundary
According to the Figure 2-8, higher percentage of morning and evening peak period traffic is comprised with home based work trips. Home based other trips such as school trips are raised in the morning and the afternoon creating several local peaks. Non-home based trips are gradually increased once the day progress and start to diminish at about afternoon after reaching its maximum.
Figure 2-8: Percentage of trips by its purposes at CMC boundary towards city, 2004
0
10
20
30
40
50
60
70
80
90
100
7.00
-7.3
0
7.30
-8.0
0
8.00
-8.3
0
8.30
-9.0
0
9.00
-9.3
0
9.30
-10.
00
10.0
0-10
.30
10.3
0-11
.00
11.0
0-11
.30
11.3
0-12
.00
12.0
0-12
.30
12.3
0-13
.00
13.0
0-13
.30
13.3
0-14
.00
14.0
0-14
.30
14.3
0-15
.00
15.0
0-15
.30
15.3
0-16
.00
16.0
0-16
.30
16.3
0-17
.00
17.0
0-17
.30
17.3
0-18
.00
18.0
0-18
.30
% o
f Trip
Cat
egor
y
Time
HBW TripsHBO TripsNHB Trips
19
3 Assessment of Premium Service
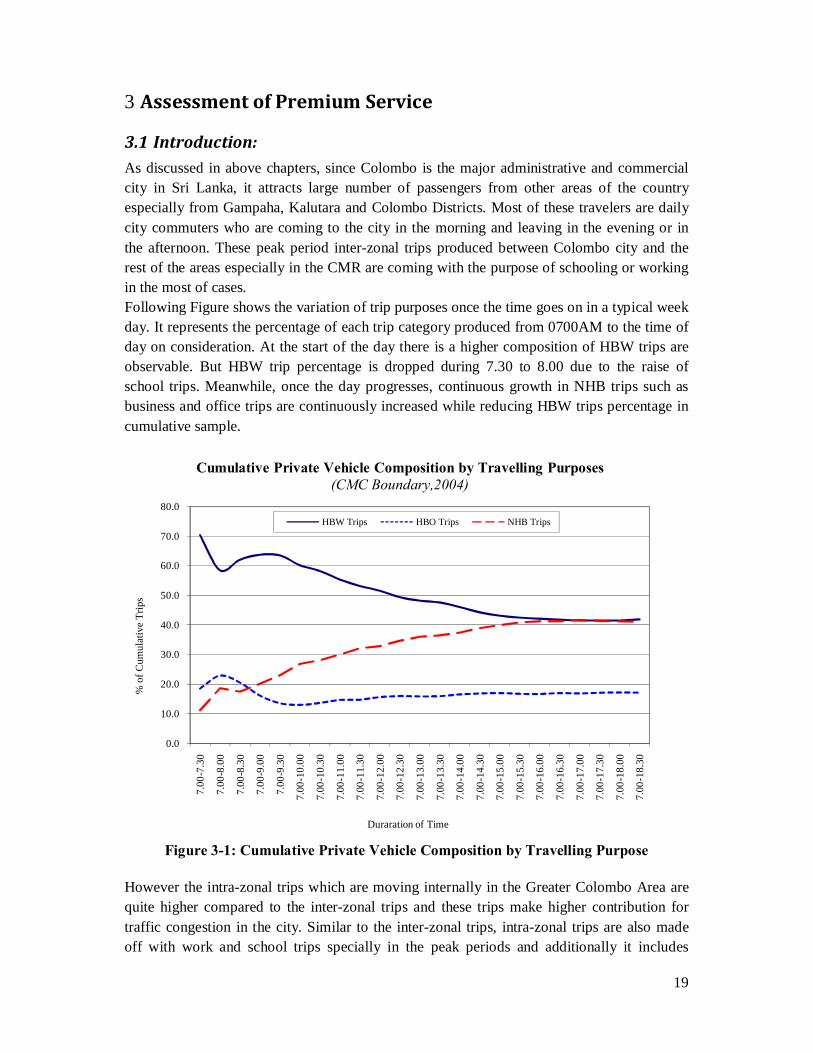
3.1 Introduction: As discussed in above chapters, since Colombo is the major administrative and commercial city in Sri Lanka, it attracts large number of passengers from other areas of the country especially from Gampaha, Kalutara and Colombo Districts. Most of these travelers are daily city commuters who are coming to the city in the morning and leaving in the evening or in the afternoon. These peak period inter-zonal trips produced between Colombo city and the rest of the areas especially in the CMR are coming with the purpose of schooling or working in the most of cases. Following Figure shows the variation of trip purposes once the time goes on in a typical week day. It represents the percentage of each trip category produced from 0700AM to the time of day on consideration. At the start of the day there is a higher composition of HBW trips are observable. But HBW trip percentage is dropped during 7.30 to 8.00 due to the raise of school trips. Meanwhile, once the day progresses, continuous growth in NHB trips such as business and office trips are continuously increased while reducing HBW trips percentage in cumulative sample.
Figure 3-1: Cumulative Private Vehicle Composition by Travelling Purpose
However the intra-zonal trips which are moving internally in the Greater Colombo Area are quite higher compared to the inter-zonal trips and these trips make higher contribution for traffic congestion in the city. Similar to the inter-zonal trips, intra-zonal trips are also made off with work and school trips specially in the peak periods and additionally it includes
0.0
10.0
20.0
30.0
40.0
50.0
60.0
70.0
80.0
7.00
-7.3
0
7.00
-8.0
0
7.00
-8.3
0
7.00
-9.0
0
7.00
-9.3
0
7.00
-10.
00
7.00
-10.
30
7.00
-11.
00
7.00
-11.
30
7.00
-12.
00
7.00
-12.
30
7.00
-13.
00
7.00
-13.
30
7.00
-14.
00
7.00
-14.
30
7.00
-15.
00
7.00
-15.
30
7.00
-16.
00
7.00
-16.
30
7.00
-17.
00
7.00
-17.
30
7.00
-18.
00
7.00
-18.
30
% o
f Cum
ulat
ive
Trip
s
Duraration of Time
Cumulative Private Vehicle Composition by Travelling Purposes(CMC Boundary,2004)
HBW Trips HBO Trips NHB Trips

20
business and official trips which are mainly circulating during off-peak period of the day. Following Figure shows the zonal distribution of trips produced to CMC in 1996
Table 3-1: Travel Pattern in CMC Area, 1996 (24-hours, weekday) (000s)
Movement Type Person Journey Goods Vehicle Journeys
Private Vehicle
Bus Rail
Outside CMC to outside CMC (via CMC) 25 200 4 2 Outside CMC to inside CMC 190 315 81 12.5 Inside CMC to outside CMC 190 315 81 12.5 Inside CMC to inside CMC 680 200 3 36 Total Journeys 1085 1030 169 63.5
3.2 Necessity of a premium service Due to the continuous deterioration of quality of public transport in last three decades it was noticeable that more and more passengers were diverted from public modes to private modes and also some of them were migrated to the city proximity for minimizing use of public transport modes for their travelling purposes. This was caused to increase the private vehicle fleet and the cost of living of people residing in CMR. The vehicle fleet in CMR was rapidly increased in last three decades and at present it is estimated as 967,097 and about 45% of country’s vehicle fleet. In last 5 years it was increased at a rapid growth rate of 12% while it was about 15% island wide. Even it is comparatively lower compared to the country’s growth still CMR maintains a higher growth in vehicle fleet. Since this is cause to produce higher vehicular trips between the Central Business District of CMR and rest of areas, higher traffic congestion has to be expected especially in major arteries.
Figure 3-2: Provincial Share of Vehicle Fleet,2007
Western43.5%
Southern14.9%
Sabaragamuwa5.9%
North-Western13.7%
Central6.7%
Uva3.3%
North Central4.7%
Eastern4.1%
Northern3.2%
Estimated Total Vehicle Fleet,2007 = 2,222,803

21
Figure 3-3: Growth of Revenue license issued in CMR (2003-07)
For the purposes of avoiding public transport usage, people tends to use more and more private modes for their transportation purposes and also try to live close to their work places and children’s schools is an increasing trend among CMR inhabitants. It has been revealed that the population in CMR is spent higher amount of their earnings for the Housing, Education, Transportation and telecommunication compared to the other provinces of the country. Therefore it is concluded as the life style which is adjusted to minimize traveling in public transport modes has been caused to increase the living cost of CMR inhabitants.
Table 3-2: Consumer Expenditure Shares, %, 2003/04
Item Consumer Expenditure Shares, % Western Province All Island
Food 30.6 36.7 Clothing and Apparel 7.5 8.8 Housing 14.7 11.1 Medical 4.1 3.2 Education 3.4 3.0 Transport and Communication 10.5 8.6 Fuel and Light 4.5 4.4 Consumer Durables 8.4 9.7 Interest on Debt 1.9 1.4 Other 14.4 13.0
2003 2004 2005 2006 2007WP 614,374 682,940 794,832 886,243 967,097
400,000
500,000
600,000
700,000
800,000
900,000
1,000,000N
o. o
f Veh
icle
s
Growth of Vehicle Fleet in WP (2003-07)

22
In accordance to the above issues it is revealed that the people are presently spent higher proportion of their earnings for the comfort of traveling by means of using their own vehicles or residing close to their offices/schools. Therefore it is understandable that if comfortable passenger transport service can be provided, some proportion of them can be attracted for such services even at a higher rate since they already spent higher amount of their earning on this issue.
3.3 Potential users of premium service With respect to the land transport modes, as shown in the Figure 2-6, compared to the public buses, private vehicles are in higher proportion in the traffic stream in any time of the day inducing traffic congestion especially in the peak periods. But Figure 2-3 is revealed that even though private vehicle are in 94% of total road traffic it only carries about 38% of road passengers. Intention of introducing premium services is to reduce private vehicle users which are higher impact on traffic congestion especially in peak period. Composition of private vehicle trips based on their travelling purpose shows peak time travelers are home based travelers. Among them home based work trips are significant in amount .But same buses can be used for city shuttle service during the day time encountering official and business trips which are also make local peaks. Feature of higher reliability and comfort of these services will be able to capture the targeted group of private vehicle users. Due to above qualitative aspects, operator has to charge higher fare compared to other public transport modes. As a result of higher fares, these services would not be able to capture the working population who are using public transport mode at present. Survey conducted covering several institute in Colombo city reveals, though present public transport users are more interested on premium service, their “willing to pay” fare for such service is low compared to the private and hired vehicle users (Appendix xx, Figure xx and zz). It also discloses that the trip length of passengers doesn’t have an influence on selecting premium service (Figurexx in appendix). As a conclusion, these services are limited for work and businesses trip producers who are presently using private and hired vehicles for travelling purposes. Therefore planning routes targeting these potential users will secure the service in long-run.
3.4 Route Planning Criteria Route planning for premium service should be carried out under two categories of Greater Colombo intra regional and CMC -CMR inter regional based on the demand prevailing. For both type of route planning criteria should be followed a sequential step wise process including;
• Identification of trip generating and attracting areas of potential users • Identify the destinations for the services • Identify Pick and Drop points for inter-mediate commuters to reach the service • Trace the route between two destinations along those accessible points

23
3.4.1 Trip generating and attracting areas of potential users As discussed in section 3.3, potential users for these services are the private vehicle users in their work trips which are generated during the peak period of the day. Same services can be adopted to use as city shuttle service during off-peak period encountering business and office trips. But this section is not intended to discuss the route planning process of city shuttle service of premium buses. Greater Colombo intra regional service is needed to be planned considering the work trip generation and attraction in between the zones of CMC and its suburb. Origin-Destination Matrix appeared in Figure xx shows the number of private vehicles used for home based work trips in-between several zones in CMC and its suburb. Estimated 27,000 private vehicular home based work trips equaling 60% of total trips produced in-between these zones. Inter regional premium service between CMC and CMR region should also be designed based on the origins and destinations of private vehicular home based trips. Areas of such trip generation and attraction are illustrated in Figure 3-6. There are about 41% of home based work trips in total private vehicle trips produced between CMC and CMR region.
Figure 3-4: Trip Attracting and Generating Center in Colombo

24
3.4.2 Destinations for the services Identification of starting and end points for these services should be determined as it maximizes the demand for the service. For attracting more private vehicular users, it is important to select a location with easy access and parking space for a starting point. End points of the services should be decided considering the potential passenger’s trip ends in central business district. Starting points can be arranged in park & ride system which facilitate higher safety for parking vehicles and also comfortable transfer for the premium service for the private vehicular users. But finding a land space for such kind of park & ride system even in outskirt of Colombo city has been difficult to the transport planners due to these areas are almost occupied. However there are some land spaces are identified in Battaramulla, Ratmalana, and Kiribathgoda areas for developing as park & rides. Since the road congestion towards the city is started beyond these areas, it is anticipated to have a higher demand for such park & ride arrangement since these locations becomes the end of easy drive of their own vehicles. End points should be basically set in the middle of the city providing adequate parking facility for the buses. For the effective utilization of the service, end point should be in closed to the area of higher commuter travel demand exist. In this perspective, Slave Island, Kollupitiya and Townhall are more suitable destinations for a premium service. Once the service reaches to these destinations it has to cover the entire intermediate pick and drop points which are having service user travel demand.

25
Table 3-3: Origin- Destination Flows of Greater Colombo Intra Regional Trips, 2006 (12 hours, Towards Centre of City) Trip Category: Inter Zonal Trip Type: Home based Work Trips Vehicle Type: All Private Vehicles Cordon: Trips crossing CMC and CBD are only considered
From To
1,10
5,00
0
1,10
6,00
0
1,10
7,00
0
1,10
8,00
0
1,10
9,00
0
1,40
1,00
0
1,40
2,00
0
1,40
3,00
0
1,40
4,00
0
1,40
5,00
0
1,40
6,00
0
1,40
7,00
0
1,40
8,00
0
1,40
9,00
0
1,41
0,00
0
1,41
1,00
0
1,41
2,00
0
1,50
1,00
0
1,50
2,00
0
1,50
3,00
0
1,50
4,00
0
1,50
5,00
0
1,50
6,00
0
1,50
7,00
0
1,50
8,00
0
1,50
9,00
0
1,51
0,00
0
1,51
1,00
0
1,51
2,00
0
1,51
3,00
0
Tota
l
%
Mah
arag
ama
Kes
bew
a
Nug
egod
a
Deh
iwal
a- M
ount
La
vini
ya
Mor
atuw
a
Alu
th K
ade
Bloe
men
dhal
Fort
Gal
le F
ace
Gra
ndpa
ss
Kot
ahen
a
Mal
igaw
atta
Mar
adan
a
Mat
takk
uliy
a
Petta
h
Slav
e Is
land
Tow
n H
all/W
ekan
da
Bam
bala
pitiy
a
Bore
lla
Cin
nam
en G
arde
n
Dem
atag
oda
Hav
eloc
k To
wn
Kir
ulap
onne
Kol
lupi
tiya
Kup
piya
wat
ta
Mila
giri
ya
Nar
ahen
pita
Pam
anka
da
Thim
biri
gasy
aya
Wel
law
atta
Maharagama 1,105,000 0 0 0 0 0 0 0 230 13 0 0 0 27 0 91 38 1,043 186 0 0 0 39 0 82 0 0 109 0 103 56 2,016 7
Kesbewa 1,106,000 0 0 32 0 14 0 0 204 14 0 0 13 76 26 182 70 133 39 63 19 13 87 14 104 0 0 128 0 19 58 1,307 5
Nugegoda 1,107,000 24 0 25 47 11 0 0 472 26 0 0 0 39 0 269 33 2,909 73 79 0 0 0 44 107 0 0 107 0 78 65 4,406 16
Dehiwala- Mount Laviniya 1,108,000 30 0 129 0 0 0 0 606 29 52 38 0 53 32 356 53 123 408 348 29 32 30 108 321 0 0 204 0 61 427 3,470 12
Moratuwa 1,109,000 0 0 13 0 30 0 0 150 0 12 0 0 54 34 301 0 0 110 38 0 0 0 24 69 0 0 64 0 12 181 1,092 4
Aluth Kade 1,401,000 0 0 0 0 0 0 0 26 0 0 0 0 0 0 0 0 0 0 0 0 0 0 0 0 0 0 0 0 0 0 26 0
Bloemendhal 1,402,000 0 0 0 0 0 0 0 0 0 0 0 0 0 0 20 0 0 0 0 0 0 0 0 0 0 0 0 0 0 0 20 0
Fort 1,403,000 0 0 166 28 6 0 0 479 0 238 0 0 267 11 583 34 48 42 177 37 0 24 22 84 0 0 27 0 52 80 2,404 9
Galle Face 1,404,000 0 0 0 0 0 0 0 13 0 0 0 0 0 0 0 0 0 0 0 0 0 0 0 0 0 0 0 0 0 0 13 0
Grandpass 1,405,000 0 0 0 0 0 0 0 38 0 21 0 0 30 0 149 13 24 22 0 0 20 0 0 0 0 0 0 0 0 0 316 1
Kotahena 1,406,000 0 0 0 0 0 0 0 52 0 0 13 0 27 0 134 0 0 0 41 0 0 0 0 0 0 0 0 0 0 0 267 1
Maligawatta 1,407,000 0 0 0 0 0 0 0 102 0 0 0 0 0 0 330 0 0 7 0 0 0 0 0 11 0 0 0 0 0 24 474 2
Maradana 1,408,000 0 0 0 23 0 0 0 466 0 0 0 0 0 0 564 0 0 20 0 0 0 0 0 48 0 0 19 0 0 23 1,164 4
Mattakkuliya 1,409,000 0 0 0 9 12 9 0 379 0 13 57 0 18 43 188 59 13 77 83 0 20 0 0 198 0 0 13 0 13 29 1,234 4
Pettah 1,410,000 0 0 0 0 0 0 0 77 0 0 0 0 0 0 179 0 13 0 0 0 0 0 0 0 0 0 0 0 0 0 268 1
Slave Island 1,411,000 0 0 0 0 0 0 0 202 12 0 0 0 0 0 365 0 0 0 0 0 0 0 0 0 0 0 0 0 0 0 579 2
Town Hall/Wekanda 1,412,000 62 0 0 0 0 0 0 152 0 0 0 0 0 0 415 0 0 0 0 0 0 0 0 0 0 0 0 0 0 0 629 2
Bambalapitiya 1,501,000 0 0 21 0 0 0 0 390 19 0 0 0 0 34 388 0 0 0 0 0 0 0 0 26 0 0 0 0 0 0 877 3
Borella 1,502,000 0 0 64 20 25 0 0 292 0 0 0 0 20 0 974 11 48 11 41 0 20 0 63 56 0 0 19 0 0 36 1,699 6
Cinnamen Garden 1,503,000 0 0 0 0 0 0 0 143 0 0 0 0 0 0 277 0 0 0 0 0 0 0 0 0 0 0 0 0 0 0 419 2
Dematagoda 1,504,000 0 0 0 0 0 0 0 141 0 0 0 0 0 0 202 9 0 10 0 0 0 0 0 6 0 0 0 0 0 0 368 1
Havelock Town 1,505,000 0 0 39 0 0 0 0 39 0 0 0 0 0 0 22 39 0 116 0 0 0 32 0 0 0 0 0 0 0 0 287 1
Kirulaponne 1,506,000 0 12 107 0 0 0 0 167 0 13 13 12 70 0 369 0 29 39 89 0 0 155 38 57 0 0 177 0 57 12 1,416 5
Kollupitiya 1,507,000 0 0 0 0 0 0 0 301 0 13 0 0 18 19 483 0 13 0 0 0 0 0 19 63 0 0 0 0 0 0 929 3
Kuppiyawatta 1,508,000 0 0 0 0 0 0 0 0 0 0 0 0 0 0 0 0 0 0 0 0 0 0 0 0 0 0 0 0 0 0 0 0
Milagiriya 1,509,000 0 0 41 0 0 0 0 0 0 0 0 0 0 0 0 0 0 0 0 0 0 0 0 0 0 0 0 0 0 0 41 0
Narahenpita 1,510,000 13 0 0 48 0 0 0 146 0 0 0 0 13 0 362 0 0 0 19 0 0 0 36 0 0 0 38 0 0 0 675 2
Pamankada 1,511,000 0 0 0 0 0 0 0 100 0 0 0 0 0 0 0 0 39 0 0 29 0 39 0 32 0 0 0 0 0 25 264 1
Thimbirigasyaya 1,512,000 0 0 0 0 0 0 0 72 0 0 0 0 0 0 0 0 0 0 0 0 0 0 0 0 0 0 0 0 0 0 72 0
Wellawatta 1,513,000 0 0 39 0 0 0 0 183 34 0 0 0 36 12 447 0 39 32 52 0 0 39 0 39 0 0 77 0 0 46 1,075 4
Total 128 12 674 175 98 9 0 5,619 147 362 121 25 746 210 7,650 358 4,472 1,193 1,029 114 105 445 369 1,302 0 0 983 0 395 1,063 27,804 100
% 0 0 2 1 0 0 0 20 1 1 0 0 3 1 28 1 16 4 4 0 0 2 1 5 0 0 4 0 1 4 100

26
Table 3-4: Origin- Destination Flows of CMC-CMR Inter Regional Trips, 2004 (12 hours, Towards Centre of City)
Origin- Destination CMC-CMR Inter Regional Trips,2004 (12 hours,Towards Centre of City)Trip Category: Inter Zonal Trip Type: Home based Work Trips Vehicle Type:All Private Vehicles
1,10
2,00
0
1,10
3,00
0
1,10
4,00
0
1,10
5,00
0
1,10
6,00
0
1,10
7,00
0
1,10
8,00
0
1,10
9,00
0
1,11
0,00
0
1,11
2,00
0
1,20
1,00
0
1,20
2,00
0
1,20
3,00
0
1,20
4,00
0
1,20
5,00
0
1,20
6,00
0
1,20
7,00
0
1,20
8,00
0
1,20
9,00
0
1,21
0,00
0
1,21
1,00
0
1,21
2,00
0
1,21
3,00
0
1,30
1,00
0
1,30
2,00
0
1,30
3,00
0
1,30
4,00
0
1,30
5,00
0
1,30
6,00
0
1,30
7,00
0
1,30
8,00
0
1,30
9,00
0
1,31
0,00
0
1,31
1,00
0
1,31
2,00
0
1,31
3,00
0
1,31
4,00
0
1,40
1,00
0
1,40
2,00
0
1,40
3,00
0
1,40
4,00
0
1,40
5,00
0
1,40
6,00
0
1,40
7,00
0
1,40
8,00
0
1,40
9,00
0
1,41
0,00
0
1,41
1,00
0
1,41
2,00
0
1,50
1,00
0
1,50
2,00
0
1,50
3,00
0
1,50
4,00
0
1,50
5,00
0
1,50
6,00
0
1,50
7,00
0
1,50
8,00
0
1,50
9,00
0
1,51
0,00
0
1,51
1,00
0
1,51
2,00
0
1,51
3,00
0
Out
er P
B
Han
wel
la
Hom
agam
a
Kad
uwel
a
Mah
arag
ama
Kes
bew
a
Nug
egod
a
Deh
iwal
a- M
ount
Lav
iniy
a
Mor
atuw
a
Kol
onna
wa
Padu
kka
Gam
paha
Div
ulap
itiya
Kat
ana
Neg
ambo
Wat
tala
Ja-E
la
Kel
aniy
a
Biya
gam
a
Dom
pe
Atta
naga
lla
Min
uwan
goda
Mee
riga
ma
Mah
ara
Beru
wal
a
Mat
huga
ma
Wal
alla
wita
Aga
law
atta
Dod
ango
da
Bula
thsin
hala
Hor
ana
Band
arag
ama
Kal
utar
a
Pana
dura
Mad
uraw
ela
Mill
aniy
a
Ingi
riya
Palin
da N
uwar
a
Alu
th K
ade
Bloe
men
dhal
Fort
Gal
le F
ace
Gra
ndpa
ss
Kot
ahen
a
Mal
igaw
atta
Mar
adan
a
Mat
takk
uliy
a
Petta
h
Slav
e Is
land
Tow
n H
all/W
ekan
da
Bam
bala
pitiy
a
Bore
lla
Cin
nam
en G
arde
n
Dem
atag
oda
Hav
eloc
k To
wn
Kir
ulap
onne
Kol
lupi
tiya
Kup
piya
wat
ta
Mila
giri
ya
Nar
ahen
pita
Pam
anka
da
Thim
biri
gasy
aya
Wel
law
atta
Hanwella 1,102,000 0 0 0 0 48 0 0 0 0 0 0 0 0 0 0 0 0 0 0 0 0 0 0 0 0 0 0 0 0 0 0 0 0 0 0 0 0 0 36 140 0 0 0 36 18 0 18 0 0 0 19 0 0 0 0 45 0 0 0 0 19 0 0 379 1Homagama 1,103,000 0 0 0 0 0 189 32 0 0 0 0 0 0 36 0 45 0 0 0 0 0 0 0 0 0 0 0 0 0 0 0 0 0 0 0 0 0 36 0 200 0 0 0 0 138 72 108 84 36 19 45 0 0 0 19 0 0 0 39 0 0 0 36 1,134 2Kaduwela 1,104,000 0 0 18 0 0 954 32 0 45 0 134 0 0 45 48 14 192 0 0 0 0 0 14 0 0 0 0 0 0 0 0 0 0 0 0 0 0 96 0 727 0 80 0 48 465 113 544 835 366 45 447 14 103 0 19 193 0 45 122 0 93 48 0 5,897 11Maharagama 1,105,000 0 0 32 0 0 305 95 0 48 0 45 0 0 0 0 0 0 0 0 64 0 0 45 0 0 0 0 0 0 0 0 0 0 0 0 0 0 72 0 632 0 129 0 14 373 356 535 517 192 45 198 39 115 0 32 64 0 0 135 0 75 64 0 4,220 8Kesbewa 1,106,000 0 0 63 0 0 333 761 0 32 0 63 0 0 0 63 0 32 0 0 0 0 0 0 0 0 0 0 0 0 0 0 0 0 0 0 0 0 32 0 114 0 68 0 0 120 0 233 118 32 159 32 127 32 0 63 95 0 0 121 0 51 128 32 2,905 5Nugegoda 1,107,000 18 0 83 19 67 1,240 319 0 233 0 704 0 0 19 105 182 66 14 0 19 0 0 19 19 0 0 0 0 0 0 0 0 0 0 0 0 0 338 72 1,235 153 131 96 14 357 1,011 785 802 265 192 1,214 211 153 19 58 339 0 0 1,013 32 598 434 111 12,760 24Dehiwala- Mount Laviniya 1,108,000 0 0 63 0 0 270 507 0 32 0 32 0 64 64 18 0 95 0 0 64 0 0 96 0 0 0 0 0 0 0 0 0 0 0 0 0 0 645 0 325 129 101 0 0 821 137 1,064 200 55 95 32 127 0 0 32 32 0 0 32 0 63 1,366 0 6,561 12Moratuwa 1,109,000 0 0 0 0 0 36 0 0 0 0 0 0 0 19 0 0 0 0 0 0 0 0 0 0 0 0 0 0 0 0 0 0 0 0 0 0 0 64 0 0 0 0 0 0 129 55 129 64 64 32 96 32 0 0 0 0 0 0 0 0 0 322 64 1,108 2Kolonnawa 1,110,000 18 0 0 0 0 89 36 0 316 0 0 0 14 0 0 0 207 0 0 0 0 0 54 0 0 0 0 0 0 0 0 0 0 0 0 0 0 177 54 59 0 103 0 159 602 18 737 114 232 41 423 96 512 0 0 245 0 0 113 0 0 0 0 4,418 8Padukka 1,112,000 0 0 0 0 0 0 0 0 0 0 0 0 0 0 0 0 0 0 0 0 0 0 0 0 0 0 0 0 0 0 0 0 0 0 0 0 0 0 0 0 0 0 0 0 0 0 0 0 0 0 0 0 0 0 0 0 0 0 19 0 0 0 0 19 0Gampaha 1,201,000 0 0 23 0 0 41 23 23 47 0 0 0 0 0 0 0 93 0 0 0 0 0 0 0 0 0 0 0 0 0 0 23 0 0 0 0 0 0 0 61 0 0 0 0 23 0 18 96 14 23 0 0 0 0 0 0 0 0 0 0 0 0 0 509 1Divulapitiya 1,202,000 0 0 0 0 0 0 0 0 0 0 0 0 0 0 0 0 23 0 0 0 0 0 0 0 0 0 0 0 0 0 0 0 0 0 0 0 0 0 0 0 0 0 0 0 0 0 0 0 0 0 0 0 0 0 0 0 0 0 0 0 0 0 0 23 0Katana 1,203,000 0 0 0 0 0 0 37 0 0 0 0 0 0 0 0 0 0 0 0 0 0 0 0 0 0 0 0 0 0 37 0 0 0 0 0 0 0 0 0 98 0 0 0 0 0 0 0 37 0 0 0 0 0 0 0 37 0 0 0 0 0 0 37 285 1Negambo 1,204,000 0 0 0 0 0 0 0 0 37 0 0 0 0 0 0 0 23 0 0 0 0 0 0 0 0 0 0 0 0 0 0 0 0 0 0 0 0 0 0 61 0 0 48 0 37 0 0 0 0 0 37 0 0 0 0 0 0 0 0 0 0 0 0 244 0Wattala 1,205,000 75 0 112 37 0 0 0 0 112 0 0 0 0 0 0 0 449 0 0 0 0 0 0 0 0 0 0 0 0 37 0 0 37 0 0 0 0 37 0 585 0 75 0 0 85 75 225 85 37 55 75 0 37 0 0 75 0 0 37 0 37 75 0 2,459 5Ja-Ela 1,206,000 0 0 0 0 0 61 126 112 37 0 0 0 0 0 0 0 332 0 0 0 0 0 0 0 0 0 0 0 0 0 0 0 0 0 0 0 0 0 0 434 0 37 0 0 0 0 37 0 37 0 0 0 0 0 0 75 0 0 0 0 0 0 0 1,290 2Kelaniya 1,207,000 0 0 0 23 47 23 0 0 117 0 0 0 0 0 0 0 1,222 0 0 0 0 0 0 0 0 0 0 0 0 0 0 0 23 0 0 0 0 0 0 374 0 0 0 18 23 23 23 0 0 0 23 0 0 0 0 23 0 0 23 0 0 0 0 1,987 4Biyagama 1,208,000 0 0 23 0 0 71 0 23 47 0 0 0 0 0 0 0 210 0 0 0 0 0 0 0 0 0 0 0 0 0 0 0 0 0 0 0 0 23 0 351 0 47 0 47 48 0 93 71 14 0 14 0 0 0 0 0 0 0 23 0 0 64 0 1,170 2Dompe 1,209,000 0 0 0 0 0 0 0 0 0 0 0 0 0 0 0 0 0 0 0 0 0 0 0 0 0 0 0 0 0 0 0 0 0 0 0 0 0 0 0 0 0 0 0 0 66 0 18 0 14 0 72 0 14 0 0 0 0 0 0 0 0 0 0 183 0Attanagalla 1,210,000 0 23 0 0 0 0 0 37 0 0 0 0 0 0 0 0 121 0 0 0 0 0 0 0 0 0 0 0 0 0 0 0 0 0 0 0 0 0 0 131 0 0 0 61 71 0 0 19 0 0 0 0 0 0 0 0 0 0 0 0 0 0 14 478 1Minuwangoda 1,211,000 0 0 0 0 0 0 0 0 0 0 0 0 0 0 0 0 0 0 0 0 0 0 0 0 0 0 0 0 0 0 0 0 0 0 0 0 0 0 0 0 0 0 0 0 0 0 0 0 0 0 0 0 0 0 0 0 0 0 0 0 0 0 0 0 0Meerigama 1,212,000 0 0 0 0 0 0 0 0 0 0 0 0 0 0 23 0 0 0 0 0 0 0 0 0 0 0 0 0 0 0 0 0 0 0 0 0 0 0 0 37 0 0 0 0 0 0 0 0 0 0 0 0 0 0 0 0 0 0 0 0 0 0 0 61 0Mahara 1,213,000 0 0 37 0 0 84 0 0 70 0 0 0 0 0 48 0 364 0 0 0 0 0 0 0 0 0 0 0 0 0 23 0 0 0 0 0 0 37 0 396 0 0 0 61 23 75 47 37 0 84 47 0 0 0 0 47 0 0 47 0 23 0 23 1,574 3Beruwala 1,301,000 0 0 0 0 0 32 0 0 0 0 0 0 64 0 0 0 0 0 0 0 0 0 0 0 0 0 0 0 0 0 0 0 0 0 0 0 0 0 36 0 64 0 0 0 0 0 64 0 36 0 0 32 0 0 0 32 0 0 0 0 0 0 0 361 1Mathugama 1,302,000 0 0 0 0 0 0 0 0 0 0 0 0 0 0 0 0 0 0 0 0 0 0 0 0 0 0 0 0 0 0 0 0 0 0 0 0 0 0 0 0 0 0 0 0 0 0 0 0 0 0 0 0 0 0 0 0 0 0 0 0 0 0 0 0 0Walallawita 1,303,000 0 0 0 0 0 0 0 0 0 0 0 0 0 0 0 0 0 0 0 0 0 0 0 0 0 0 0 0 0 0 0 0 0 0 0 0 0 0 0 0 0 0 0 0 0 0 0 0 0 0 0 0 0 0 0 0 0 0 0 0 0 0 0 0 0Agalawatta 1,304,000 0 0 0 0 0 0 0 0 0 0 0 0 0 0 0 0 0 0 0 0 0 0 0 0 0 0 0 0 0 0 0 0 0 0 0 0 0 0 0 0 0 0 0 0 0 0 0 0 0 0 0 0 0 0 0 0 0 0 0 0 0 0 0 0 0Dodangoda 1,305,000 0 0 0 0 0 0 0 0 0 0 0 0 0 0 0 0 0 0 0 0 0 0 0 0 0 0 0 0 0 0 0 0 0 0 0 0 0 0 0 0 0 0 0 0 0 0 0 0 0 0 0 0 0 0 0 0 0 0 0 0 0 0 0 0 0Bulathsinhala 1,306,000 0 0 0 0 0 0 0 0 0 0 0 0 0 0 0 0 0 0 0 0 0 0 0 0 0 0 0 0 0 0 0 0 0 0 0 0 0 0 0 0 0 0 0 0 0 0 0 0 0 0 0 0 0 0 0 32 0 0 0 0 0 0 0 32 0Horana 1,307,000 0 0 0 0 0 0 0 0 48 0 32 0 0 0 0 0 0 0 0 0 0 0 0 0 0 0 0 0 0 0 0 0 0 0 0 0 0 0 0 0 0 0 0 0 0 0 0 0 0 0 19 32 0 0 0 0 0 0 19 0 0 0 19 169 0Bandaragama 1,308,000 0 0 0 0 0 0 36 0 0 0 0 0 0 0 0 0 23 0 0 0 0 0 0 0 0 0 0 0 0 0 0 0 0 0 0 0 0 36 0 0 0 0 0 0 36 0 0 0 0 0 0 32 0 0 0 32 0 0 0 0 0 0 0 195 0Kalutara 1,309,000 0 0 0 0 0 0 0 0 0 0 64 0 0 0 0 0 0 0 0 0 0 0 0 0 0 0 0 0 0 0 0 0 0 0 0 0 0 0 0 0 0 0 0 0 0 0 0 0 0 0 0 19 0 0 0 14 0 0 32 0 19 0 0 149 0Panadura 1,310,000 0 0 64 0 0 0 0 0 0 0 0 0 64 0 0 0 0 0 0 0 0 0 0 0 0 0 0 0 0 0 0 0 0 0 0 0 0 64 0 84 0 0 0 0 64 36 64 64 0 0 0 0 0 0 0 0 0 0 0 0 0 0 32 539 1Madurawela 1,311,000 0 0 0 0 0 0 0 0 0 0 0 0 0 0 0 0 0 0 0 0 0 0 0 0 0 0 0 0 0 0 0 0 0 0 0 0 0 0 0 0 0 0 0 0 18 0 0 0 0 0 0 32 0 0 0 0 0 0 0 0 0 0 0 50 0Millaniya 1,312,000 0 0 0 0 0 0 0 0 0 0 0 0 0 0 0 0 0 0 0 0 0 0 0 0 0 0 0 0 0 0 0 0 0 0 0 0 0 0 0 0 0 0 0 0 0 0 0 0 0 0 0 0 0 0 0 0 0 0 0 0 0 0 0 0 0Ingiriya 1,313,000 0 0 0 0 0 0 0 0 0 0 0 0 0 0 0 0 0 0 0 0 0 0 0 0 0 0 0 0 0 0 0 0 0 0 0 0 0 0 0 0 0 0 0 0 0 0 0 0 0 0 0 0 0 0 0 0 0 0 0 0 0 0 0 0 0Palinda Nuwara 1,314,000 0 0 0 0 0 0 0 0 0 0 0 0 0 0 0 0 0 0 0 0 0 0 0 0 0 0 0 0 0 0 0 0 0 0 0 0 0 0 0 0 0 0 0 0 0 0 0 0 0 0 0 0 0 0 0 0 0 0 0 0 0 0 0 0 0Aluth Kade 1,401,000 0 0 0 0 0 0 0 0 0 0 0 0 0 0 0 0 0 0 0 0 0 0 0 0 0 0 0 0 0 0 0 0 0 0 0 0 0 0 0 0 0 0 0 0 0 0 0 0 0 0 0 0 0 0 0 0 0 0 0 0 0 0 0 0 0Bloemendhal 1,402,000 0 0 0 0 0 0 0 0 0 0 0 0 0 0 0 0 0 0 0 0 0 0 0 0 0 0 0 0 0 0 0 0 0 0 0 0 0 0 0 0 0 0 0 0 0 0 0 0 0 0 0 0 0 0 0 0 0 0 0 0 0 0 0 0 0Fort 1,403,000 0 0 0 0 0 0 0 0 0 0 0 0 0 0 0 0 0 0 0 0 0 0 0 0 0 0 0 0 0 0 0 0 0 0 0 0 0 0 0 0 0 0 0 0 0 19 0 0 0 0 0 0 0 0 0 0 0 0 0 0 0 0 0 19 0Galle Face 1,404,000 0 0 0 0 0 0 0 0 0 0 0 0 0 0 0 0 0 0 0 0 0 0 0 0 0 0 0 0 0 0 0 0 0 0 0 0 0 0 0 0 0 0 0 0 0 0 0 0 0 0 0 0 0 0 0 0 0 0 0 0 0 0 0 0 0Grandpass 1,405,000 0 0 0 0 0 0 0 0 0 0 0 0 0 0 0 0 0 0 0 0 0 0 0 0 0 0 0 0 0 0 0 0 0 0 0 0 0 0 0 0 0 0 0 0 0 0 0 0 0 0 0 0 0 0 0 0 0 0 0 0 0 0 0 0 0Kotahena 1,406,000 0 0 0 0 0 0 0 0 0 0 0 0 0 0 0 0 0 0 0 0 0 0 0 0 0 0 0 0 0 0 0 0 0 0 0 0 0 0 0 0 0 0 0 0 0 0 0 0 0 0 0 0 0 0 0 0 0 0 0 0 0 0 0 0 0Maligawatta 1,407,000 0 0 0 0 0 0 0 0 0 0 0 0 0 0 0 0 0 0 0 0 0 0 0 0 0 0 0 0 0 0 0 0 0 0 0 0 0 0 0 0 0 0 0 0 0 0 0 0 0 0 0 0 0 0 0 0 0 0 0 0 0 0 0 0 0Maradana 1,408,000 0 0 0 0 0 0 0 0 0 0 0 0 0 0 0 0 0 0 0 0 0 0 0 0 0 0 0 0 0 0 0 0 0 0 0 0 0 0 0 0 0 0 0 0 36 0 0 0 0 0 0 0 0 0 0 0 0 0 0 0 0 0 0 36 0Mattakkuliya 1,409,000 0 0 0 0 0 0 18 0 0 0 0 0 0 0 0 0 0 0 0 0 0 0 0 0 0 0 0 0 0 0 0 0 0 0 0 0 0 0 0 0 0 0 0 0 64 0 0 0 0 0 0 0 0 0 0 0 0 0 0 0 0 0 0 82 0Pettah 1,410,000 0 0 0 0 0 0 0 0 0 0 0 0 0 0 0 0 0 0 0 0 0 0 0 0 0 0 0 0 0 0 0 0 0 0 0 0 0 0 0 0 0 0 0 0 0 0 0 0 0 0 0 0 0 0 0 0 0 0 0 0 0 0 0 0 0Slave Island 1,411,000 0 0 0 0 0 0 0 0 0 0 0 0 0 0 0 0 0 0 0 0 0 0 0 0 0 0 0 0 0 0 0 0 0 0 0 0 0 0 0 0 0 0 0 0 18 0 18 0 0 0 0 0 0 0 0 0 0 0 0 0 0 0 0 36 0Town Hall/Wekanda 1,412,000 0 0 0 0 0 0 0 0 0 0 0 0 0 0 0 0 0 0 0 0 0 0 0 0 0 0 0 0 0 0 0 0 0 0 0 0 0 0 0 0 0 0 0 0 0 0 0 0 0 0 0 0 0 0 0 0 0 0 0 0 0 0 0 0 0Bambalapitiya 1,501,000 0 0 0 0 0 0 0 0 0 0 0 0 0 0 0 0 0 0 0 0 0 0 0 0 0 0 0 0 0 0 0 0 0 0 0 0 0 0 0 0 0 0 0 0 0 0 0 0 0 0 0 0 0 0 0 0 0 0 0 0 0 0 0 0 0Borella 1,502,000 0 0 0 0 0 0 0 0 0 0 0 0 0 0 0 0 0 0 0 0 0 0 0 0 0 0 0 0 0 0 0 0 0 0 0 0 0 0 0 0 0 0 0 0 0 0 18 0 32 0 0 0 0 32 0 0 0 0 19 0 32 0 0 132 0Cinnamen Garden 1,503,000 0 0 0 0 0 0 0 0 0 0 0 0 0 0 0 0 0 0 0 0 0 0 0 0 0 0 0 0 0 0 0 0 0 0 0 0 0 0 0 0 0 0 0 0 0 0 0 0 0 0 0 0 0 0 0 0 0 0 0 0 0 0 0 0 0Dematagoda 1,504,000 0 0 0 0 0 0 0 0 0 0 0 0 0 0 0 0 0 0 0 0 0 0 0 0 0 0 0 0 0 0 0 0 0 0 0 0 0 0 0 0 0 0 0 0 0 0 0 0 0 0 0 0 0 0 0 0 0 0 0 0 0 0 0 0 0Havelock Town 1,505,000 0 0 0 0 0 0 0 0 0 0 0 0 0 0 0 0 0 0 0 0 0 0 0 0 0 0 0 0 0 0 0 0 0 0 0 0 0 0 0 0 0 0 0 0 0 0 0 0 0 0 0 0 0 0 0 0 0 0 0 0 0 0 0 0 0Kirulaponne 1,506,000 0 0 0 0 0 0 0 0 0 0 0 0 0 0 0 0 0 0 0 0 0 0 0 0 0 0 0 0 0 0 0 0 0 0 0 0 0 0 0 0 0 0 0 0 0 0 0 0 0 0 0 0 0 0 0 0 0 0 19 0 0 0 0 19 0Kollupitiya 1,507,000 0 0 0 0 0 0 0 0 0 0 0 0 0 0 0 0 0 0 0 0 0 0 0 0 0 0 0 0 0 0 0 0 0 0 0 0 0 0 0 37 0 0 0 0 0 0 0 0 0 0 0 0 0 0 0 0 0 0 0 0 0 0 0 37 0Kuppiyawatta 1,508,000 0 0 0 0 0 0 0 0 0 0 0 0 0 0 0 0 0 0 0 0 0 0 0 0 0 0 0 0 0 0 0 0 0 0 0 0 0 0 0 0 0 0 0 0 0 0 0 0 0 0 0 0 0 0 0 0 0 0 0 0 0 0 0 0 0Milagiriya 1,509,000 0 0 0 0 0 0 0 0 0 0 0 0 0 0 0 0 0 0 0 0 0 0 0 0 0 0 0 0 0 0 0 0 0 0 0 0 0 0 0 0 0 0 0 0 0 36 0 36 0 0 0 0 0 0 0 0 0 0 0 0 0 0 0 72 0Narahenpita 1,510,000 0 0 0 0 0 0 0 0 0 0 0 0 0 0 0 0 0 0 0 0 0 0 0 0 0 0 0 0 0 0 0 0 0 0 0 0 0 0 0 0 0 0 0 0 0 0 0 0 18 0 0 0 0 0 0 0 0 0 19 0 0 0 0 37 0Pamankada 1,511,000 0 0 0 0 0 0 0 0 0 0 0 0 0 0 0 0 0 0 0 0 0 0 0 0 0 0 0 0 0 0 0 0 0 0 0 0 0 0 0 0 0 0 0 0 0 0 0 0 0 0 0 0 0 0 0 0 0 0 0 0 0 0 0 0 0Thimbirigasyaya 1,512,000 0 0 0 0 0 0 0 0 0 0 0 0 0 0 0 0 0 0 0 0 0 0 0 0 0 0 0 0 0 0 0 0 0 0 0 0 0 0 0 0 0 0 0 0 0 0 0 0 0 0 45 0 0 0 0 0 0 0 0 0 0 0 0 45 0Wellawatta 1,513,000 0 0 0 0 0 0 0 0 0 0 0 0 0 0 0 0 36 0 0 0 0 0 0 0 0 0 0 0 0 0 0 0 0 0 0 0 0 0 0 0 0 0 0 0 0 0 0 0 0 0 0 0 0 0 0 0 0 0 19 0 0 64 0 120 0
Outer PB 0 0 102 0 0 85 110 0 0 0 45 0 0 0 0 0 153 0 0 0 0 0 0 0 0 0 0 0 0 0 0 0 0 0 0 0 0 101 0 182 0 18 0 0 108 84 0 102 48 45 0 0 45 0 23 0 0 0 39 0 0 74 0 1,363 3111 23 623 80 162 3,814 2,133 196 1,221 0 1,119 0 207 184 305 241 3,643 14 0 148 0 0 227 19 0 0 0 0 0 75 23 23 61 0 0 0 0 1,759 198 6,263 347 787 144 457 3,746 2,110 4,778 3,284 1,492 835 2,837 792 1,012 51 247 1,379 0 45 1,891 32 1,011 2,640 369 53,157 100
0 0 1 0 0 7 4 0 2 0 2 0 0 0 1 0 7 0 0 0 0 0 0 0 0 0 0 0 0 0 0 0 0 0 0 0 0 3 0 12 1 1 0 1 7 4 9 6 3 2 5 1 2 0 0 3 0 0 4 0 2 5 1 100
From To
Total%
Tota
l
%

27
3.4.3 Intermediate Pick & Drop Points for the Service Once the bus traveling towards city centre these locations are the passengers picking points and in-turn trip they become dropping points. These locations must be identified considering the potential attractions of private vehicular work trip attached to each area. For an example according to the OD matrix in Table 3-3, premium service from Ratmalana to Slave Island has to touch Dehiwala-Mt. Lavinia, Bambalapitiya, Kollupitiya, Wellawatta, Townhall, Thimbirigasyaya and Pamankada in priority of travel demand towards Slave Island, Fort and Pettah. Therefore the route between two selected destinations has to be traced as it touches the areas having higher travel demand of private vehicular work trip makers. Following Figures shows two planned premium service routes which cover certain areas of Colombo and its suburb.
Figure 3-5: Premium Service Bus Route, Kadawatha-Nawam Mawatha

28
Figure 3-6: Premium Service Bus Route, Katubedda-Nawam Mawatha

29
3.5 Operational Aspects of the Services After planning the routes for the premium service, it is needed to plan the operational aspects of the service such as time schedules and fares. Timely variation of travel demand of private vehicular work trip makers has to be closely inspected in preparing time table for the services. Similarly proper economic analysis also has to be carried out for deciding the fares for the each service. All above aspects including route planning has to be performed separately for the proposed city shuttle service which is intended to implement using same buses in off-peak period of the day
3.6 Public Opinions on the Premium Service Survey form appeared in Appendix 1 is generally tested the interest on premium service among the organizations attached to the Chamber of Commerce in Sri Lanka. According to the responses given by the employees, it is reveal that public transport users are highly interest on the premium service compared to the private and office vehicle users since they can enjoy higher comfort compared to the present by using such service. Also the staff van users are interested on the service in inter-mediate to both of above categories. Since premium service doesn’t expect to provide door to door service as staff vans, those users are comparatively reluctant to give up such facility though they are paying higher charge at present.
Figure 3-7: Passenger Willingness on Premium Service by Present Mode of Travel
Frequency of Service Willing Passenger Distribution(According to Present Mode Used)
0%
10%
20%
30%
40%
50%
60%
70%
80%
90%
100%
Bus Train Staff Transport Office Transport Private Vehicle Office Vehicle Hired or Shared
Present Mode Used
% o
f Ser
vice
Will
ing
Pass
enge
rs

30
For experiencing the luxury of premium service, users have to pay higher charge for their travel km. Though bus and rail passengers are highly interest on the service, they are not ready to pay a higher charge for additional comfort providing. This is because their present spending capacity is not adequate to allocate higher amount for transport. Similarly the office vehicle users are not ready to spend more for such facility, since they are already enjoying equal comfort through their staff services in free of charge. But people such as hired vehicle users, private vehicle users and private staff transport service users are willing to pay comparatively higher amount for the service since they are already spending much on travel comfort at present.
Figure 3-8: Expected cost/km for a Premium Service by Present Mode of Travel
Premium Service Willingness of Additional Trip Makers It is revealed that 84% of interviewees are willing to use the premium service and only 16% are not intended to use such service in general. Many of work trip makers are having certain additional trips on their way to office and also during the work hours. Some of parents are used to carry their children to school while traveling to the office and some are having official trips during work hours. According to the Figure 3-9, 70% of service willing passengers are involved in additional trip during the work trip. It gives the sense that they are in a position to adopt for the premium service adopting alternative for their activities such as dropping child to school. But 60% of additional trip makers during office hours don’t like to use this service in the morning since they lose their vehicle for the trips during work hours. Similarly it is shown that majority (68%) of people who are not intended to use premium service are also engaging trips during work hours. Thereby it can be concluded that the office workers who are having trips during
Expected Travel Cost/km for a Premium Service
0.0
2.0
4.0
6.0
8.0
10.0
12.0
Bus Train Staff Transport Office Transport Private Vehicle Office Vehicle Hired or Shared
Present Mode Used
Ave
rage
Cos
t rea
dy p
ay p
er K
m, R
s.

31
work hours are more reluctant to use the premium service for their work trip. This issue emphasizes the importance of arranging a comfortable transport service for business and office trip makers during off-peak period for attracting those people for the premium service operated in the peak periods.
Figure 3-9: Additional Trip Makers’ Willingness on Premium Service
Yes
No
Service Willingness
During Office Hours
During Work Trip
Additional Trips During Work Trip
During Office Hours
70%
84%
16%
40%
48%
68%

32
4 Assessment of Variable Work Hour Program
4.1 Introduction At present most of the government and private sector agencies in Sri Lanka work in five day- eight hour schedule which runs from 8.30 am to 4.30 pm every day. Due to this work schedule, office arrival and leaving trips of all workers incurring at the same time producing a higher travel demand at the peak period of the day. On the other hand, present work schedules are tightened the employees by preventing their personal affairs in these specific time period. Therefore they tend to have more and more leaves to accomplish their personal affairs by decreasing the productivity of the agency. This will cause to induce an unsatisfaction for the employee as well as for the employers regarding their achievements. As a solution for these problems, introducing Variable Work Hours program is tested in this report. Basically there are three types of work hour program are practiced internationally. They are
• Flex-Hours • Compressed Work Week • Staggered Work Hours
4.2 Flex-Hours With a flex-time program, employees work five eight- hour days each week, but they are allowed to choose their work arrival and departure times, as well as the length of their lunch break. Flex-time programs generally require employees to be present during a specified “core” time when meetings or other company-wide events are scheduled. Note that a flex-time schedule allows employees to work early or late, depending on their personal preferences. Some people may come to work at 6 a.m. and leave at 3 p.m., while others will arrive at 9:30 a.m. and work until6:30 p.m. However, all employees must complete their usual number of hours by the end of each workday. Flex-time Variations The chart below shows a conventional eight-hour-day schedule, as well as a commonly used flex-time schedule.
Figure 4-1: Flex time Work Hours Vs Standard Work Hours
Flex-Departure Core time Flex Lunch Core Time Flex-Arrival Flex time Work Hours
8.00 am 4.00 pm 12.00 noon 9.00 am 2.00 pm 12.00 noon
Standard Work Hours
8.30 am 4.30 pm
5.00 pm

33
Here are some definitions to help clarify the flex-time scheduling concept, as seen in the accompanying chart: Office Hours The time span within which employees can be on the job: 8:00 a.m. to 5:00 p.m. Starting Flex-time Hours Employees must start work within this period: 8:00 a.m. to 9:00 a.m. Ending Flex-time Hours Employees must end work within this period: 4:00 p.m. to 5:00 p.m. Core Time
The time when all employees must be on the job: 9:00 a.m. to 12:00 a.m. and 2:00 p.m. to 4:00 p.m.
Lunch Period Employees can take from ½ hour to 2 hours, as long as coverage and total daily/weekly time requirements are met: 12:00 noon. to 2:00 p.m.
Following Alternatives also can be adapted to the program for the ease in monitoring purposes.
• Providing fixed lunch hour instead of flex-lunch • Dividing flex- arrival and flex-departure duration in to 10 minit intervals. Depending
on the employee arrive time interval, departure interval is decided as it covers 8 hour working day.
One flex-time variation, called “maxiflex,” is even more flexible. This option allows employees to work any number of hours within a 24-hour period. If employees choose to work more than eight hours, they can “bank” the extra hours, thereby earning “credit” that enables them to shorten a workday or work week in the future. In this scenario, some employers require that all employees be present during core time; others drop even this requirement. Of course, employers considering the maxiflex option need to determine how many hours an employee can work and still be productive; it will vary according to job responsibilities.
4.3 Compressed Work Week In a compressed work week, employees complete their required number of work hours in fewer-than-normal days per week (or per pay period). This arrangement allows employees to have one or two days off each week or one day off every other week, depending upon which type of compressed work week program you prefer. The two most popular compressed work week schedules are the 4/40 and 9/80 programs, although other variations also exist. 4/40 Program Employees work four 10-hour days each week, with the fifth day off. To ensure five-day

34
coverage, you may want to consider having half the company takes Mondays off and half take Fridays off.
Mon. Tues. Wed. Thurs. Fri. Sat. Sun. 8 hr Schedule on on on on on off off
10 hr Schedule on on on on off off off Figure 4-2: Compressed Work Week-4/40 Program
As an example, employees in a 4/40 program may be asked to select one of the following schedules for their four workdays each week:
• 7.00 a.m. - 5:30 p.m. with ½ hour lunch • 7:30 a.m. - 6:00 p.m. with ½ hour lunch • 7:00 a.m. - 6:00 p.m. with 1 hour lunch • 7:30 a.m. - 6:30 p.m. with 1 hour lunch
Compressed work week schedules typically do not vary from day to day. 9/80 Program Employees work 80 hours in nine days, with the 10th day off. This schedule usually translates to eight 9-hour days and one 8-hour day (this shorter day is often the Friday that the employee works). In a company with two major work groups, each group might take off alternating Fridays. 3/12 Program Employees work three 12-hour days each week, with two days off. (Employees often get the four additional hours to make a 40 hour work week as credit for working longer days.)
Mon. Tues. Wed. Thurs. Fri. Sat. Sun. 8 hr Schedule on on on on on off off
12 hr Schedule on on on off off off off Figure 4-3: Compressed Work Week- 3/12 Program
4.4 Staggered Work Hours This concept involves spreading out employee arrival and departure times by anywhere from 15 minutes to two hours (These durations can be altered as accordance to the requisitions). By staggering these “shifts,” you can help reduce bottlenecks in employee parking lots, in streets at the entrance to your office park or building, and even in elevators. Reducing congestion through staggered work hours, benefits air quality by reducing vehicle idling time in congested conditions or by allowing employees to avoid the peak travel period. A company that is staggering work hours may be open from 7:30 a.m. to 5:30 p.m., with the following schedule choices:

35
Figure 4-4: Schedule of Staggered Work Hours
Group A 7:30 - 4:30 with 1 hour lunch Group B 8:00 - 5:00 with 1 hour lunch Group C 8:30 - 5:30 with 1 hour lunch
Once employees have chosen (or been assigned to) a group, their schedule does not vary daily.
4.5 Variable Work Hour Programs’ impact on Transportation As described in Chapter 2, higher number of passengers coming to the city in the peak period is home based work trip makers. Since each and every employee try to enter and leave the city at same time duration of the day, both public and private transport modes are used heavily for these work trips especially during the morning and evening peak periods. This envisages indicate that present work hour schemes are caused to induce traffic congestions as well as the bus congestions in the peak period of the day. Introduction of variable work hour program is caused to reduce the traffic and bus congestion by distributing work trips during comparatively larger period of time. Following figure shows morning peak traffic flow variation of all city entering corridors if all city entering work trip are given one hour flexibility for reporting their work.
Figure 4-5: Private Vehicular Flow at CMC boundary, 2004
Gr. C Gr. B Gr. A
Core Time Lunch Core Time Arrival
4.30 pm 8.00 am 7.30 am 8.30 am 12.30 pm 1.30 pm 5.00 pm
Departure
Group C Group B Group A
5.30 pm
Private Vehicular Flow to CMC,2004
0
1000
2000
3000
4000
5000
6000
7000
8000
9000
10000
7.00
-7.3
0
7.30
-8.0
0
8.00
-8.3
0
8.30
-9.0
0
9.00
-9.3
0
9.30
-10.
00
10.0
0-10
.30
10.3
0-11
.00
11.0
0-11
.30
11.3
0-12
.00
12.0
0-12
.30
12.3
0-13
.00
13.0
0-13
.30
13.3
0-14
.00
14.0
0-14
.30
14.3
0-15
.00
15.0
0-15
.30
15.3
0-16
.00
16.0
0-16
.30
16.3
0-17
.00
17.0
0-17
.30
17.3
0-18
.00
18.0
0-18
.30
T ime
Flow
/30
min
its
Total Trips Existing HBW Trips Existing
HBW Trips with Flexible Work Hour Probable Total Trips with Flexible Work Hour
36
In addition to the distribution of private vehicle users, work trips incurring in public modes are also subjected to spread in a wider range of time period due to the introduction of variable work hour programs. Therefore congestion in the public modes also expected to be reduced during the peak period of the day. Similarly program such as compressed work week, staggered working hours are also be effective in terms of distributing peak period travel demand.
4.6 Administrative Considerations
4.6.1 Flex-Hour Considerations Even if it is chosen the “typical” flex-time schedule shown above, there are still some choices to be made within this structure.
• When setting office hours, select a time frame that is long enough to let employees avoid the worst rush-hour traffic, but short enough so that you don’t seriously increase lighting, heating and security costs. For many work places, the ideal workday 8 hours in between 8.00 a.m. to 6.00 p.m
• It is needed to decide whether employees will be allowed to change their starting and ending times each day, or whether they must select a starting time within the flexible morning hours and follow that schedule every day.
• Companies that implement the “permanent” starting time option may want to give employees a two-week trial period during which they can experiment with different schedules. At the end of this period, employees must commit to a starting and ending time. However, it is necessary to give employees the opportunity to change their starting and ending times once or twice a year, and/or allow them to alter their schedule when necessary by giving at least one day’s advance notice.
• Flex-time should fix as it becomes easy for those employees who need to accommodate a ridesharing arrangement.
A Note on Monitoring Employee Attendance and Work: Two issues inevitably come up at any company seriously considering variable work hours: How do we monitor employee attendance and supervise work flow when people are coming and going at so many different times? Introduction of electronic time-keeping systems or sign-in/sign-out ledgers is one option of accounting for employees. Another possibility is for supervisors to begin evaluating employees on their performance and productivity, rather than their attendance. The other important issue is that employees usually monitor each other quite effectively. Inducing peer pressure to great advantage by gently reminding employees that variable work hours are a privilege- a privilege that can be taken away if employees abuse the system.

37
4.6.2 Compressed Work Week Considerations • In any compressed work week program, there must be adequate coverage in the office
for employees who are taking their day off. Generally, this means that not everyone takes the same day off. Given the choice, most employees elect to take Friday as their day off, followed in order of preference by Monday, Wednesday, Thursday, and Tuesday.
• It is required to rotate days off every six months so that every employee gets a three-day weekend.
• Another option is for small departments or work groups to have everyone take the same day off and simply close down the department for the day. This is common for public agencies that want to extend customer hours during work days.
• To encourage ridesharing, you may want to give carpoolers and vanpoolers “day off” preference over non-rideshares.
• Employees who must attend important meetings may change their scheduled day off with advance notice.
• Some employees may need to be exempt from the compressed work week program because of child- care duties, medical reasons, transportation problems or conflicts with school.
• There are some employees who cannot follow a compressed work week schedule because of their job duties. These may include customer service representatives or computer operators who are required to maintain 24-hour coverage.
4.6.3 Staggered Work Hour Considerations • When implementing a staggered work hours program, it is necessary to determine
whether participation will be voluntary or mandatory. In either case, it is wise to offer as many “shift” choices as possible so that employees can select a schedule that is convenient for them.
• There are several ways to divide up employees between shifts. It is possible to assign
each individual employee a staggered starting time; you can assign different starting times to entire departments or work groups; or in some cases, staggered work hours can be organized on an area-wide basis to reduce traffic congestion around office parks, for example.
• Another option is to let employees choose their own staggered starting time, although
it is required a supervisory approval to ensure that employees are evenly distributed among the available shifts.
• Employees who commute to work using alternative transportation can be given
preference in their selection of shifts.

38
4.7 Execution of Program Considering the importance of the program for the improvement of the transport sector, Ministry of Transport initiates the project providing introduction to the program. But they are not in a position to specify the appropriate program for each individual organization (private or government sector) since the managerial structure and its functionality is too complicated for an external party to study. Therefore each individual organization can select and design the variable work hour program which is best-fitted to their structure. In this process Ministry of Transport can assist them through Chamber of Commerce and Ministry of Public Administration for the private and government sector respectively. It is must to obtain the legislative approval from the Labor Department for the designed program prior to the implementation. Following diagram illustrate the stakeholder involvement and their activities in each process of executing the program.
Figure 4-6: Stake holder Responsibilities in executing Variable Work Hour Program
Ministry of Transport
Introducing the Program concept
Providing Conceptual Assistance
Chamber of Commerce
Conceptual Assistance
Legislative Assistance
Private Sector Agency
Choosing a Program
Designing the program
Legalizing the program
Implementing the program
Labor Department
Public Admin. Ministry
Conceptual Assistance
Legislative Assistance
Gvnt. Sector Agency
Selection of a Program
Designing the program
Legalizing the program
Implementing the program
Legal approval for the program

39
Private or government sector agencies who are expecting to implement one of these programs has to choose and design the program by themselves as it suit for them. In general following steps has to be followed for the successful implementation of the program. 1. Choosing a Program 1. Discussion of top level managers (Directors, Deputy Directors) and middle level managers regarding the possible options among 3 types of variable wok hour programs. Key points for the discussion
• Is it necessary to work five days? (if the conclusion is “yes”, give up the Compressed Work Week option)
• Decide the most probable work program under each category to offer for the choice of staff.
2. Consult legal counsel and labor unions Before go to the staff member interest test regarding selected variable work hours program, ask organizational legal counsel to review the labor legislation influence. There may be certain laws and requirements that relate to alternative work schedules. Usually, non-exempt or hourly employees must be compensated at time and a half for work in excess of 40 hours in the designated work week (check with your legal counsel for details). In addition, labor unions may have concerns about variable work hours programs. Some unions do not support an end to the eight-hour workday, and instead prefer that employees get overtime pay for working beyond eight hours. Consult your local union representative about their general policy toward such programs, and be sure to keep them involved throughout the process. Above all, always promote the program as an employee benefit. 3. With above pre-defined programs, Questionnaire should be forwarded to the staff members for their responses. This questionnaire is testing the following issues which are required to choose the best-fitted program and to design the program
• What types of work employees perform? • How do employees interact with the customers? • How much internal coordination is required among employees or departments? • What is the organization management style? • Is back-up support available? • How big is the organization? • Will additional security be required?
Along with these measures, the reduction of traffic congestion should also be addressed
• What is the modal share of workers? • How many of them are using their private vehicles for work trip? • What are the origins and destination of private vehicle users? • Do they travel in peak period of the day? • Is there any ridesharing opportunities are available?

40
2. Designing a Program 1. Establish a project design mechanism. Prepare a questionnaire for staff responses 2. Address the critical program design issues Need to answer a number of important questions before developing policies and procedures for your variable work hours program, such as:
• Can employees “bank” (carry over) hours from day to day? • What is the range of hours during which employees may be at work? • What are “core” times? • Will employees be allowed to choose their own starting and ending times and/or days
off? • How will employee attendance and hours be monitored? • If a program is mandatory, a hardship petition process should be created for existing
employees. 3. Identify the job functions that may not be eligible for variable work hours. Some employees perform jobs that require they be present during “regular” business hours. These may include receptionists, mailroom staff, customer service representatives, computer support personnel, or staff members who need to match their boss’s schedule. To prevent these employees from feeling left out of the program, you may want to arrange a rotating coverage system to increase their flexibility. Employees go on and off the program based on scheduling needs. Other category of this group is supportive staff such as peons, drivers and security officers. Separate rotating work schedule scheme also has to be introduced for them. 4. Formalize policies and procedures Create a written set of policies and procedures to govern your variable work hour program. Make sure that your company’s accounting department is involved to establish policies for payroll, vacation pay, overtime, absences, and other issues. (See sample policies and procedures at the end of this handbook) 5. Inform the finalized schedule to the staff members and address the employee concerns and hardships. Make modification if necessary. 3. Legalize the program Obtain the approval for a pilot project from the Labor Department 4. Implementation of the program 1. Start the pilot project with a prior notice which is enough for adjusting new schedule 2. Monitor the program and make changes as necessary Survey employees after the pilot program have been in effect for six to 12 months. Make adjustments as needed based on employee attitudes and areas of concern, then introduce the “new, improved” version to appropriate departments and employees throughout the company

41
4.8 Public Opinions on Variable Work Hours National Transport Commission Carried out surveys in institute where the variable work hours are presently implemented and not-implemented for investigating their opinions on such program.
4.8.1 National Transport Commission National Transport Commission introduced Flexible Work Hour Scheme in year 2004 and still they are working under this scheme. Survey form no.1 appeared in Appendix 1 is distributed among staff members of NTC to check their interest on this program compared to the fixed schedules exist before 2004. In addition, survey form no.2 appeared in Appendix 2 is distributed among the Department Heads to clarify the overall impact of the Flexible Work Hours (FWH) in succeeding their operational activities. NTC staff members are having different types of mode choice for traveling to the office at Narahenpita. Sometimes they use more than one mode daily, or else they use different types of modes in different week days. Considering their responses, it is observed that NTC staff use following modes for their work trip
1. Bus (daily) 2. Train (daily) 3. Personal mode (daily) 4. Staff Van (daily) 5. Bus & Train (daily) 6. Bus and Private mode (daily or in different days) 7. Train and Private mode(daily or in different days)
Personal mode is considered to be the office vehicle or their private vehicle.
Figure 4-7 Traveling modes of NTC staff
Bus65%
Train4%
Personal Mode11%
Staff Van5%
Bus & Train8%
Bus & Personal Mode6%
Train & Personal Mode1%

42
Staff opinions were analyzed to check the program impact on Traveling Comfort, Personal Attainments and finally the overall impact combining both of above issues 1. Traveling Comfort Questionnaire is tested the level of convenience in arrival and return work trip in terms of
1. Traffic congestion 2. Congestion in buses 3. Ability to compatible with train schedules 4. Ability to compatible with bus schedules and 5. Ability to compatible with staff van schedules.
Arrival Trip: According to the responses 54% of staff members are enjoying convenience in their arrival trip. In addition, 14% are experiencing inconvenience while the rest of staff members (32%) are experiencing no change compared to the early status of non-flexibility in working hours.
Figure 4-8 Analysis of arrival & return trip convenience level- NTC, 2008 Return Trip: According to the responses 54% of staff members are enjoying convenience in their arrival trip. In addition, 4% are experiencing inconvenience while the rest of staff members (42%) are experiencing no change compared to the early status of non-flexibility in working hours. In Total Trips (Arriving & Leaving): Total trip assessment is done considering the both arrival and return trip together. Therefore 160 trips are counted (produced by 80 passengers) for the analysis
Satisfactory
54%
Unsatsfactory14%
No Change
32%
Convenient
54%
Inconvenient4%
No Change
42%

43
Figure 4-9 Analysis of work trip convenience level- NTC,2008 NTC Staff members are experiencing different types of travel comfort level in their arrival and leaving trip in accordance with the FWH program. Table 4-1 illustrates the proportion of staff members experiencing different types travel comfort during their work trips.
Table 4-1: Percentages of different types of trip experiences-NTC,2008 Trip Experience % by Total Staff Members
Both trips are convenient 44% At least single trip is convenient 64% Not experiencing inconvenience at any trip 84% Both trips are inconvenient 1% At least one trip is inconvenient 16% Not experiencing convenience at any trip 36% Both trips are not changed 21% At least one trip is not changed 53% Both trips are changed 46%
Conveneient54%
Inconvenient9%
No Change37%
10%14%
4% 0%0
20406080
100
Bus Train Personal Staff Van
% of the Inconvenients by Mode
53% 57% 50%
75%
0
20
40
60
80
100
Bus Train Personal Staff Van
% of the Convenients by Mode
38%29%
46%
25%
020
406080
100
Bus Train Personal Staff Van
% of No Change by Mode
Sample Description of Figure: Considering arrival and return trip together, 54% of trips are convenient for the travelers.53% of bus commuters are experiencing convenience and 10% of them are subjected to inconvenience in traveling. Remaining 38% of bus travelers are not experiencing any change before and after the introduction of FWH program.
Convenient % by Total of Each Mode No Change % by Total of Each Mode
Inconvenient % by Total of Each Mode
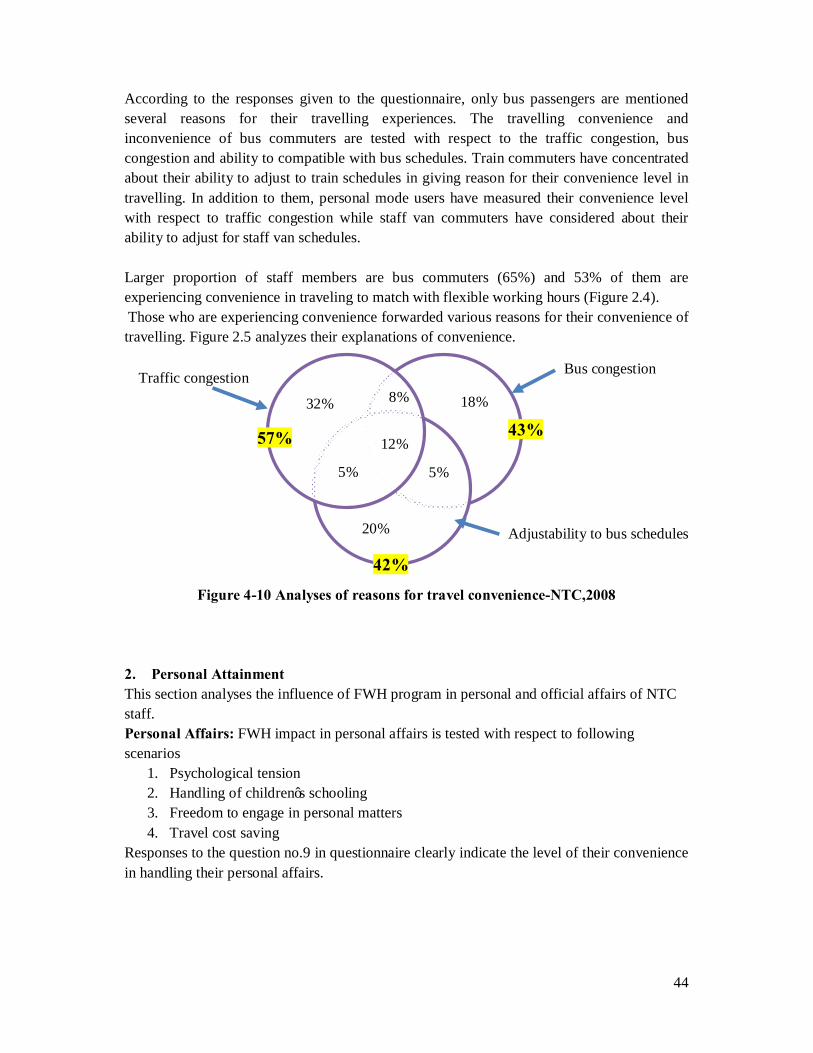
44
According to the responses given to the questionnaire, only bus passengers are mentioned several reasons for their travelling experiences. The travelling convenience and inconvenience of bus commuters are tested with respect to the traffic congestion, bus congestion and ability to compatible with bus schedules. Train commuters have concentrated about their ability to adjust to train schedules in giving reason for their convenience level in travelling. In addition to them, personal mode users have measured their convenience level with respect to traffic congestion while staff van commuters have considered about their ability to adjust for staff van schedules. Larger proportion of staff members are bus commuters (65%) and 53% of them are experiencing convenience in traveling to match with flexible working hours (Figure 2.4). Those who are experiencing convenience forwarded various reasons for their convenience of travelling. Figure 2.5 analyzes their explanations of convenience.
Figure 4-10 Analyses of reasons for travel convenience-NTC,2008 2. Personal Attainment This section analyses the influence of FWH program in personal and official affairs of NTC staff. Personal Affairs: FWH impact in personal affairs is tested with respect to following scenarios
1. Psychological tension 2. Handling of children’s schooling 3. Freedom to engage in personal matters 4. Travel cost saving
Responses to the question no.9 in questionnaire clearly indicate the level of their convenience in handling their personal affairs.
Traffic congestion
Adjustability to bus schedules
Bus congestion
32% 18%
20%
8%
12%
5% 5%
57% 43%
42%

45
Figure 4-11 Analysis of FWH impact in personal affairs- NTC,2008
According to the Figure 3.1, 62% of NTC workers are experiencing convenience in handling their day-to-day personal affairs. Question 10 is tested the primary issue which they most interested in
Figure 4-12 Primary reasons for the convenience of personal affairs-NTC, 2008 Official Affairs: Question 11 is tested the influence made by the FWH program to the NTC staff in engaging their office work.
Convenient62%
Inconvenient18%
No Change20%
Psychological tension is reduced 46%
More freedom to engage in personal matters
34%
Save the travelling cost 8%
Other 4%
Handling of children’s schooling is easy
8%

46
Figure 4-13: Analysis of FWH impact in official affairs- NTC,2008
3. Overall Impact As a whole, questionnaire assesses the FWH impact to the NTC staff members under three different scenarios
Scenario 1: Convenience/inconvenience/No change of arrival trip Scenario 2: Convenience/inconvenience/No change of return trip Scenario 3: Convenience/inconvenience/No change in personal affairs Scenario 4: Convenience/inconvenience/No change in official affairs Table 4-2 Percentages of different types of scenarios experiences-NTC,2008
Scenario Experiences % by Total Staff Members All four scenarios are convenient 34% At least three scenarios are convenient 49% At least two scenarios are convenient 62% At least one scenario is convenient 76% Not experiencing convenience in any single scenario 24% All four scenarios are inconvenient 1% At least three scenarios are inconvenient 3% At least two scenarios are inconvenient 8% At least one scenario is inconvenient 26% Not experiencing inconvenience in any single scenario 74% All four scenarios are not changed 7% At least three scenarios are not changed 25% At least two scenarios are not changed 43% At least one scenario is not changed 60% All are changed 40%
Conveneient51%
Inconvenient3%
No Change46%

47
At present, NTC has provided flexible working hours from 0815-0900Hrs. in the morning and 1600-1645Hrs. in the afternoon. The Satisfaction of the staff member regarding the length and the duration of flexible hours is also assessed (question 12). Question 14 tested the NTC staff overall view about FWH considering all the benefits and losses
Figure 4-14 Analysis of overall view about present FWH program- NTC, 2008
4.8.2 Ceylon Electricity Board & Department of Inland Revenue These two organizations have implemented the Flexible Work Hour scheme for their staff since several years as National Transport Commission. Therefore similar formats of Survey forms (Appendix 1 & 2) are used for obtaining their responses and the same criterions were applied in the analysis. Analysis is done considering the responses of both organizations in together. Majority of staff members are coming in public transport modes as 35% on buses and 43% on Trains. There are 6% of staff is using hired vehcles such as staff vans and remaining 14% are are used travel on personel and office vehicles.
Extremely Satisfactory
20%
Satisfactory51%
Acceptable20%
Unsatisfactory3%
Extremely Unsatisfactory
1%
No Idea5%

48
Figure 4-15: Traveling modes of CEB & IRD staff
The convenience of traveling is mainly depends on the mode of travel. It is observed that after introduction of the scheme public and shared transport users feel comfort, compared to the office and personal mode users. This can be expected since FWH programs facilitate to workers to find their own schedule which provide them comfort in traveling as well as in their personal affairs. There are higher percentages of travelers who do not experience any travel comfort compared to the earlier schedule of working. Obviously the most of personal and staff vehicle users do not experiences any difference in the travel comfort since there is no change in the way of traveling under present and past working schemes. However, since new working schedule allows them to adjust their journey according to personal schedule and traffic congestion, the small percent of workers feel comfort under FWH scheme.
Figure 4-16: Comparison of Traveling Ease by Mode of Travel in Arrival Trip
Bus35%
Train43%
Staff Van6%
Personal Mode8%
Office Vehicle7%
Foot1%
0
20
40
60
80
100
Bus Train Staff Van Personal Mode
Office Vehicle
46%42% 36%
15%25%
% o
f Con
veni
ence
Mode travelled

49
Figure 4-17: Comparison of Traveling Ease by Mode of Travel in Return Trip
In general, irrespective of the mode of travel, 22% experiences inconvenience in reaching to the office while only 18% experiences travelling un-comfort in their return trip under the FWH scheme. There are about 44% in arrival trip and 42% in return trip feels comfort in traveling after implementing the flexible working hour program in these two organizations.
Figure 4-18: Percentage of Passengers Experiencing Convenience The given reasons for experiencing convenience are assessed in terms of the traffic congestion, congestion in buses and adjustability ease to the schedules of their mode of transport. About 68% of them are now able to adjust to the schedule of buses, trains and staff vehicles more easily compared to the earlier working scheme. Additionally 48% and 29% of workers feel comfort in terms of traffic congestion and bus congestion respectively. Most of them have given multiple reasons in explaining their comfort as shown in Figure 4-17.
0
20
40
60
80
100
Bus Train Staff Van Personal Mode
Office Vehicle
47%36% 36%
31%
8%% o
f Con
veni
ence
Mode travelled
Convenient44%
Inconvenient
22%
No Change34%
Convenient42%
Inconvenient
18%
No Change40%
Arrival Trip Return Trip

50
Figure 4-19: Reasons for Travel Comfort under FWH scheme Level of Convenience in Personal and Official Affairs
In addition to the travel comfort, workers also experience numerous benefits in terms of their personal and official affairs under flexible working hour scheme. Breakdown of responses given with regards to the convenience of engaging personal and official affairs are given Figure 4-20.
Figure 4-20: Level of Convenience in Personal and Official Affairs
4.8.3 National Chamber of Commerce, Sri Lanka Awareness of workers about Variable Work Hours is greatly affected to their responses. Some of responders are having their own experience about variable work hours and some known about it by knowledge. Questionnaire appeared in Appendix 4 is mainly tested the experiences of workers on their present work hours and their preference of work schedules.
Traffic congestion
Adjustability to mode schedules
Bus congestion
21% 6%
45%
6%
15% 6% 2% 48% 29%
68%
Convenient42%
Inconvenient
12%
No Change46%
Convenient45%
Inconvenient
11%
No Change44%

51
There are two types of responders 1. Responders who are experiencing Variable Work Hours at present
(Aware by experience group) 2. Responders Who are not experiencing Variable Work Hours at present
(Aware by knowledge & not aware group)
28% of staff in both these agencies are experiencing variable work schedules at present. Also there are 33% of workers are aware on these schemes by knowledge though they haven’t experienced. Only 39% of both agencies are not known of such working hour schemes.
Responders who are experiencing Variable Work Hours at present 72% among 28% of responders who are currently experiencing the variable work hour schedules are enjoying their schedules. Only 28% does not interest on variable work hour schedules. Additionally there are 32% of worker who are working under variable work hour schedules are having schooling childrens.65% of them are responded in favour of variable work hour schedules since they can adopt to pick and drop their children to school. In general people like to have Variable work hour schedules to adjust their work trips during uncongested period of the day.
Figure 4-21: Interest on variable work hours by mode of travel
0102030405060708090
100
Bus Train Personal Vehicle
Office Vehicle
Staff Van
57%
76%85%
71%
100%

52
Figure 4-22: Interest on variable work hours by trip length
Responders who are experiencing Normal Work Hours at present At present, 72% of responders are not experiencing variable work hours and they work under normal working hour system. 74% of them feel comfort with these normal work hour schedules while 26% feel uncomforting. Additionally, 46% of workers who are working under normal work hour schedules are having schooling childrens.68% of them are responded in favour of normal work hour schedules.
Figure 4-23: Interest on normal work hours by mode of transport
0102030405060708090
100
x<5 5<x<15 15<x<25 25<x<35 35<x<45 45<x<55 x>55
100% 100%
72%
50%
84%
67%
50%
% o
f Int
erst
wor
kers
Distance Travelled(x)
0102030405060708090
100
Bus Train Personal Vehicle
Office Vehicle
Staff Van
72%68%
62%65%
90%

53
Figure 4-24: Interest on normal work hours by trip length
0102030405060708090
100
x<5 5<x<15 15<x<25 25<x<35 35<x<45 45<x<55 x>55
70%66%
76% 79%
64%
86%82%
% o
f Int
erst
wor
kers
Distance Travelled(x)

54
5 Assessment of Present Route Network & Re- routing
5.1 Introduction Colombo city is served by provincial and inter-provincial bus services operated by private and state sector buses. Both types of state sector buses are operated by Sri Lanka Transport Board while inter and intra provincial private sector buses are operated by individual private operators under the supervision of National Transport Commission and Western Province Passenger Transport Authority respectively. At present 166 of inter provincial bus routes and 98 of intra provincial bus routes enters to fort and Pettah area.
Figure 5-1: Variation of Load Factor at Rajagiriya, Parliament Road
Even though the Colombo serving buses and their capacities were increased in last few decades, it is clearly observed that both private and public sector operators still have not been able to handle the increasing travel demand especially in the peak periods of the day. In addition to the demand increase, being private sector operators are highly profit oriented, all the buses serving Colombo in peak periods are highly congested giving unpleasant experiences for the travelers. Furthermore road revenue conflict among operators adds higher degree of contribution for the traffic congestion as well. These issues confirmed that increasing passenger carrying capacities is not a solution for the inherited problems of the bus services at present. With the intention of mitigating higher load factor and other inherited problems in public transport sector, Strategic Plan for Greater Colombo Traffic Management has proposed to introduce code ethics for operators, re-routing and re-scheduling of bus services. This section
Variation of Load Factor, Parliament Road, Rajagiriya
0.0
0.2
0.4
0.6
0.8
1.0
1.2
1.4
1.6
1.8
2.0
7.00
7.30
8.00
8.30
9.00
9.30
10.0
0
10.3
0
11.0
0
11.3
0
12.0
0
12.3
0
13.0
0
13.3
0
14.0
0
14.3
0
15.0
0
15.3
0
16.0
0
16.3
0
17.0
0
17.3
0
18.0
0
18.3
0
Time
Load
Fac
tor
InboundOutbound

55
demonstrates the existing route network and its performance as it support to decision making process of afore-mentioned approaches of the strategic plan.
5.2 Present Bus Route Network in CMC
5.2.1 Orientation of the Network Among 98 intra-provincial bus services serving CMC, 95 are used the bus stands in Fort and Pettah area as their one end of the route. Arrangement of western provincial bus route which are serving Pettah and Fort is as illustrated in the following diagram. Inter and intra provincial bus route network within the city limits is arranged in the radial pattern concentrated towards pettah and fort area with the higher amount of overlapping of routes particularly in close to the city centre. Overlapping of routes decreases the utilization of overall network and also gives rise to the traffic congestion and higher fuel consumption especially in the peak periods. As mentioned earlier, the orientation of the bus routes in CMC is more or less a radial network with minimum distributional routes. It is confirmed by several examples appeared in following diagram. As an example it can be highlighted that 66 routes are operated between out of Colombo and Fort/Pettah while only having 2 routes between CMC and Fort / Pettah area. As a result of that, trip length and the travel time of bus passengers are higher compared to the private vehicular users since most of the time they have to travel upto city centre to catch a bus which runs to their anticipated destination. Increasing the trip length of passengers cause to increase the congestion in buses since travelers has to occupy buses in longer duration of time until reach to his destination.
Figure 5-2: Distribution of Present Route Network

56
Inter-provincial buses don’t serve the shorter distance travelers within the city. It just only carries the passengers between the Fort /Pettah bus terminals and outstations in basically. Therefore the local services are operated to facilitate such services for the travelers in CMC. Bus route map appeared in Appendix VI shows the Intra Provincial bus services of Western Province which are serving Greater Colombo Area. This map doesn’t include the inter-provincial bus routes serving Greater Colombo area.
5.2.2 Bus Routes and Frequencies Passenger buses enter to Pettah and Fort area by five major access roads namely Sangaraja Mawatha, Sir Chithampalam Gardiner Mawatha, D.R. Wijewardana Mawatha ,Maradana Road and Central Road. After entering to the city limits, the paths of these services are arranged depending on the type of operator, type of operation and the location of their main terminal. There are about 19 different such arrangements or circuits available in the Pettah and Fort area as indicated in Appendix V. Total of 8245 buses are followed these circuits during a week day. Table 5-1 summarizes the bus flow attached to each circuit.
Table 5-1: Pettah/Fort Originated Bus Routes and Their Frequencies Circuit
No. Services Buses/day
(One-way of Circuit)
Operator : SLTB Operation: Intra-Province
1 138,143,148,152,3/1,180,187,188,200,210,224,225,226,227,228,230,231,234,235, 260,261,265,275,333,332,343,356,514,738 290
2 103,171,144 21 3 120,122,125,162,170,174,190 89 4 24,100,101,137,138,400,430 72
Operator : SLTB Operation: Inter-Province 5 01,03,04,05,06,07,08,09,15,16,18,19,21,22,38,48, 49,57, 67,78,79,
87,92,98,677 150
6 99,122,122/210 23 7 02,26,32,60,401 91
Operator : Private Operation: Intra-Province 8 3/1,143,148,152,180,200,226,227,240,265 860
9 138,187,188,210,218,235,275,333,343,356,514,332,738 884
10 224,225,228,230,231,234,260,261,262 428
11 103,144,171 612

57
12 170,174,190 229
13 120(Kesbewa -Pettah),162 322
14 24,100,101,120,122,125,138,400,430 2621
15 107 54
Operator : Private Operation: Inter-Province
16 1/3,1/4,03,04,05,06,07,15,16,18,21, 48,49, 57, 67,87,92, 98,677 628
17 01,08,09,19,22,38,78,79 275
18 99,122,122/210 83
19 02,26,32,60,401 513
* Some of SLTB bus services are not currently under operation eventhough they appeared in the schedules Additionally there are about 1000-1500 idle bus trips which are traveling to and from overflow parking slots. These are not having specific parking slots and consequently follow different paths for reaching these slots.
5.2.3 Bus Stopping and Terminals Three major bus terminals in Pettah serve different types of bus services as Central bus stand for SLTB buses, Bastian Mawatha and Gunasinghapura bus stands for private buses. In addition to these terminals, identified 8 road-way bus stops are located close to the passenger generating and attracting areas for the convenience of passenger boarding and alighting functions. Terminals are mainly served by the long distance buses while the bus stops are frequently served by the short distance services. Figure 5-3 shows the distribution of all bus stops and terminals within the Fort and Pettah city limits.

58
Figure 5-3: Bus Stops and Terminal in Fort and Pettah Area Each of afore-mentioned 19 circuits uses one of these bus stops or terminals as its prime passenger boarding point. Summary of major stoppings and terminals associated with each circuit is tabulated in the following table.
Table 5-2: Bus Stops and Terminals in Pettah and Fort Area Terminals/ Stops Circuits associated as its primary stop
Terminal 1_T1 (Central Bus Stand) 1,5,6,7 Terminal 2_T2 (Gunasinghapura Bus Stand) 8 (excluding route Nos. 226,152),16,18 Terminal 3_T3 (Bastian Mawatha Bus Stand) 14(Excluding route no. 138),17,19 Stop 1_S1 12 Stop 2_S2 2,11 Stop 3_S3 9 Stop 4_S4 14 (Only route no. 138) Stop 5_S5 8 (Route nos.226,152) Stop 6_S6 3,4,13 Stop 7_S7 10 Stop 8_S8 15 67% of Fort and Pettah entering buses uses 3 major terminals while rest of 33% uses eight road way parking for their passenger boarding and alighting functions. Even though road way parkings serve only lesser amount of passengers it contributes to induce higher traffic congestion especially on the vicinity of Olcott Mw.

59
Table 5-3: Daily Bus Parkings in Pettah and Fort Bus Stands CBS Bastian MW Gunasingpura Road way Total
Daily Parking
554 4,269 711 2,711 8,245
5.3 Behavior of Bus & Rail Passengers Bus/Rail passenger interviews conducted by University of Moratuwa in 2007 reveal following issues which reflect the behavior of passengers coming to CMC.
• 53% of bus passengers and 37% of rail passengers are coming to Fort/Pettah to have a transfer to a bus going out of CMR. Greater portion of these travelers are coming to city during the day time. It reveals that there is a demand to decentralize long distance bus services.
• Majority of trips between CMC and outside CMC can be considered as HBW & Schooling trips and travelers of 43.2% by bus and 46.9% by rail are having transfers at Pettah/ Fort to local services from intra & inter provincial services.
Table 5-4: Origin- Destinations of Pettah/Fort Bus Travelers
Table 5-5: Origin- Destinations of Pettah/Fort Rail Travelers

60
5.4 Considerations for Re-Routing
• Developing bus terminals/stops in the Fort/Pettah area is a pre-requisition to establish a good route network in the Colombo city. This should be done for centralizing or interlinking all the bus stops which are presently spread all over the place of the city. New developing schemes must include appropriate arrangement for entry, exit and parking for the buses as well. This would cause to remove the unorganized pattern of passenger boarding and alighting functions and consequently reduce the traffic congestion in the city centre in considerably. On the other hand, people coming to the Colombo city by rail or bus have to walk considerable distance to have their next transfer due to the decentralization of bus terminals, stops and railway stations. Developing inter-connectivity among these transport nodes would also reduce the walking distance for the passengers providing higher comfortable transfer.
• Overflow parks should also be developed in parallel to the development of bus terminals. These areas should also be designed in close to the bus terminal and also there must be proper negotiation mechanism between the bus terminal and the overflow park. If these overflow parks are located in reasonably away from the terminal, there must be a specific traffic arrangement for the movement of buses. This will reduce the unnecessary bus circulation in the city and help to smooth the traffic flow.
• Building new road links in identified locations would also support to establish an efficient route network. Especially close to the Fort and Pettah area, buses are circulating considerably long distance in congested road sections only with the intention of reaching to their terminal. Buses coming on Galle road and DR Wijewardana Mawatha are perfect example is for this.
Figure 5-4: Routing of Buses coming in Galle Road and DR Wijewardana Following figure illustrate the possible arrangement can be adopted for the afore-mentioned routes by building a new link between Olcot Mw. and DR Wijewardana Mw. This will cause to reduce the traffic in Olcot Mawatha as well as the pedestrian crossings infront of Fort railway station.

61
Figure 5-5: Probable arrangement of bus routings with Link provided
• Re-routing must be focused in providing by-passes for long distance travellers to avoid transfers at the city centre. As discussed in early in this chapter there are larger number of passengers who are travelling between outside of CMC have to touch the city centre to transfer from one bus to another. This will cause to increase the trip length, travel time and also the congestion in the buses to a certain extend. In this context it is worthy to arrange several routes which are crossing long distance routes close to the CMC boundary.
• Re-routing scheme must be integrated with origins and destinations of the passengers. Though existing route network has been developed unsystematically, it has elements of passenger generation and attraction considerations relevant to the several years before. But in recent years the origins and destinations of passengers has been drastically changed with the development of city suburb. But prevailing route network is not subject to changes accordingly for catering this varied demand pattern. Therefore at present the passengers have to follow several routes to travel between their origin and destinations with the prevailing old network of bus routes. Therefore it is important to identify passenger origins and destinations at present for bus re-routing and adjust prevailing network accordingly. This would cause to reduce the trip length, travel time and consequently the congestion in public buses.
• For the success of bus re-routing program, it is compulsorily needed to assign required level
of passenger carrying capacity and prepare fine tuned time schedule for the new routes introduced.

62
6 Assessment of BRT-Battaramulla-Dematagoda
6.1 Introduction Urban Development Authority has proposed a trace for Mass Rapid Transit from Battaramulla to Dematagoda via Kolonnawa and Madinagoda Area. This idea has presented with the intention of developing Battaramulla as the main Administrative city and Dematagoda as the major transit point. This Chapter basically intended to forecast the passenger demand for such service based on the travel pattern exist at present.
6.2 Present Accessibility Options to Battaramulla Area
6.2.1 Zones for Passenger Flow Analysis Greater Colombo Area is divided into 4 major zones to make it easier for analyzing passenger flow between Battaramulla and rest of the Colombo city area. For this analysis “Battaramulla” includes the area within 2km radius from Battaramulla Junction .Figure 1.1 illustrte the zones used for flow analysis.
6.2.2 Approach from Colombo West to Battaramulla People coming from the areas such as Kollupitiya and Cinmon Garden use Ananda Kumaraswami Mawatha to approach Borella and there onwards they follow the Sri Jayawardanapura Mawatha to reach Battaramulla. Similarly Ward place Road, Bauddhaloka Mawatha, and Maradana Roads carry people to Borella from the west of the city areas such as Pettah, Kompannaweediya,Bambalapitiya, Thunmulla, Townhall and Maradana and then they use Sri Jayawardanapura Mawatha for accessing Battaramulla. Both public and private transport modes use these corridors to access Battaramulla.
6.2.3 Approach from Colombo North to Battaramulla People coming from Gampaha district and the northern part of CMC such as Mattakkuliya, Grandpas and Kotahena area uses Baseline Road upto Borella and then follows the Sri Jayewardenepura Route for approaching Battaramulla. Beside that especially the passengers using private transport modes can also follow the Avissawella and Kolonnawa roads along with their feeder roads to reach Battaramulla. Since this alternative access routes did not operate frequent and continuous public route bus transport mode, bus passengers do not tends to use as a major accessibility option to Battaramulla. Therefore in most of the cases, people traveling to Battaramulla by public transport modes have to travel via Borella Junction.

63
Figure 6-1: Zones for Passenger Flow Analysis
Colombo North
Colombo West
Colombo South
Battaramulla
2km
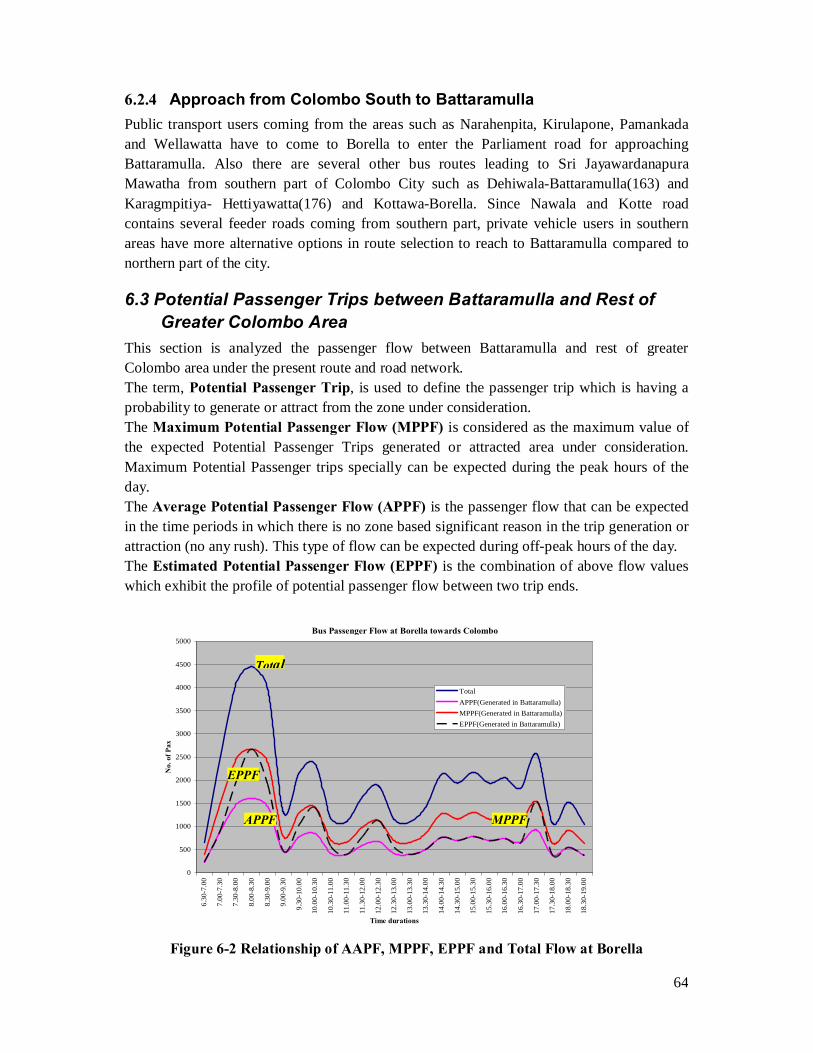
64
6.2.4 Approach from Colombo South to Battaramulla Public transport users coming from the areas such as Narahenpita, Kirulapone, Pamankada and Wellawatta have to come to Borella to enter the Parliament road for approaching Battaramulla. Also there are several other bus routes leading to Sri Jayawardanapura Mawatha from southern part of Colombo City such as Dehiwala-Battaramulla(163) and Karagmpitiya- Hettiyawatta(176) and Kottawa-Borella. Since Nawala and Kotte road contains several feeder roads coming from southern part, private vehicle users in southern areas have more alternative options in route selection to reach to Battaramulla compared to northern part of the city.
6.3 Potential Passenger Trips between Battaramulla and Rest of Greater Colombo Area
This section is analyzed the passenger flow between Battaramulla and rest of greater Colombo area under the present route and road network. The term, Potential Passenger Trip, is used to define the passenger trip which is having a probability to generate or attract from the zone under consideration. The Maximum Potential Passenger Flow (MPPF) is considered as the maximum value of the expected Potential Passenger Trips generated or attracted area under consideration. Maximum Potential Passenger trips specially can be expected during the peak hours of the day. The Average Potential Passenger Flow (APPF) is the passenger flow that can be expected in the time periods in which there is no zone based significant reason in the trip generation or attraction (no any rush). This type of flow can be expected during off-peak hours of the day. The Estimated Potential Passenger Flow (EPPF) is the combination of above flow values which exhibit the profile of potential passenger flow between two trip ends.
Figure 6-2 Relationship of AAPF, MPPF, EPPF and Total Flow at Borella
Bus Passenger Flow at Borella towards Colombo
0
500
1000
1500
2000
2500
3000
3500
4000
4500
5000
6.30
-7.0
0
7.00
-7.3
0
7.30
-8.0
0
8.00
-8.3
0
8.30
-9.0
0
9.00
-9.3
0
9.30
-10.
00
10.0
0-10
.30
10.3
0-11
.00
11.0
0-11
.30
11.3
0-12
.00
12.0
0-12
.30
12.3
0-13
.00
13.0
0-13
.30
13.3
0-14
.00
14.0
0-14
.30
14.3
0-15
.00
15.0
0-15
.30
15.3
0-16
.00
16.0
0-16
.30
16.3
0-17
.00
17.0
0-17
.30
17.3
0-18
.00
18.0
0-18
.30
18.3
0-19
.00
Time durations
No.
of P
ax
TotalAPPF(Generated in Battaramulla)MPPF(Generated in Battaramulla)EPPF(Generated in Battaramulla)
Total
APPF
EPPF
MPPF
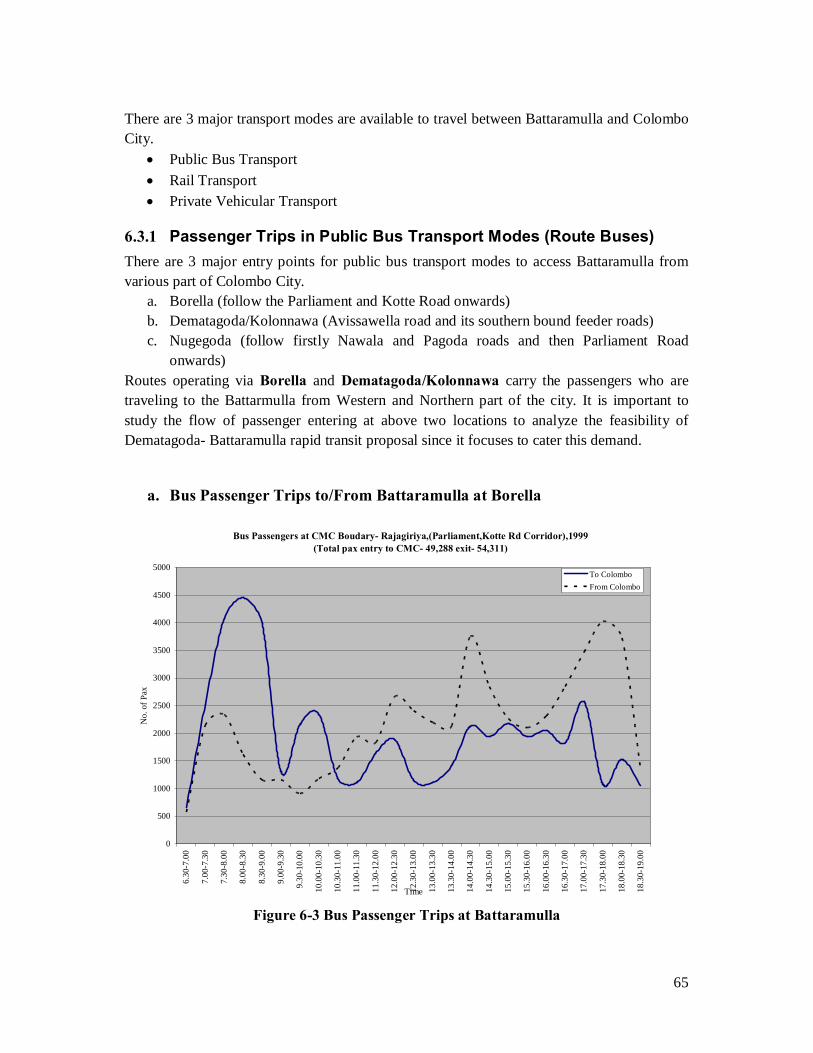
65
There are 3 major transport modes are available to travel between Battaramulla and Colombo City.
• Public Bus Transport • Rail Transport • Private Vehicular Transport
6.3.1 Passenger Trips in Public Bus Transport Modes (Route Buses) There are 3 major entry points for public bus transport modes to access Battaramulla from various part of Colombo City.
a. Borella (follow the Parliament and Kotte Road onwards) b. Dematagoda/Kolonnawa (Avissawella road and its southern bound feeder roads) c. Nugegoda (follow firstly Nawala and Pagoda roads and then Parliament Road
onwards) Routes operating via Borella and Dematagoda/Kolonnawa carry the passengers who are traveling to the Battarmulla from Western and Northern part of the city. It is important to study the flow of passenger entering at above two locations to analyze the feasibility of Dematagoda- Battaramulla rapid transit proposal since it focuses to cater this demand.
a. Bus Passenger Trips to/From Battaramulla at Borella
Figure 6-3 Bus Passenger Trips at Battaramulla
Bus Passengers at CMC Boudary- Rajagiriya,(Parliament,Kotte Rd Corridor),1999(Total pax entry to CMC- 49,288 exit- 54,311)
0
500
1000
1500
2000
2500
3000
3500
4000
4500
5000
6.30
-7.0
0
7.00
-7.3
0
7.30
-8.0
0
8.00
-8.3
0
8.30
-9.0
0
9.00
-9.3
0
9.30
-10.
00
10.0
0-10
.30
10.3
0-11
.00
11.0
0-11
.30
11.3
0-12
.00
12.0
0-12
.30
12.3
0-13
.00
13.0
0-13
.30
13.3
0-14
.00
14.0
0-14
.30
14.3
0-15
.00
15.0
0-15
.30
15.3
0-16
.00
16.0
0-16
.30
16.3
0-17
.00
17.0
0-17
.30
17.3
0-18
.00
18.0
0-18
.30
18.3
0-19
.00
Time
No.
of P
ax
To ColomboFrom Colombo
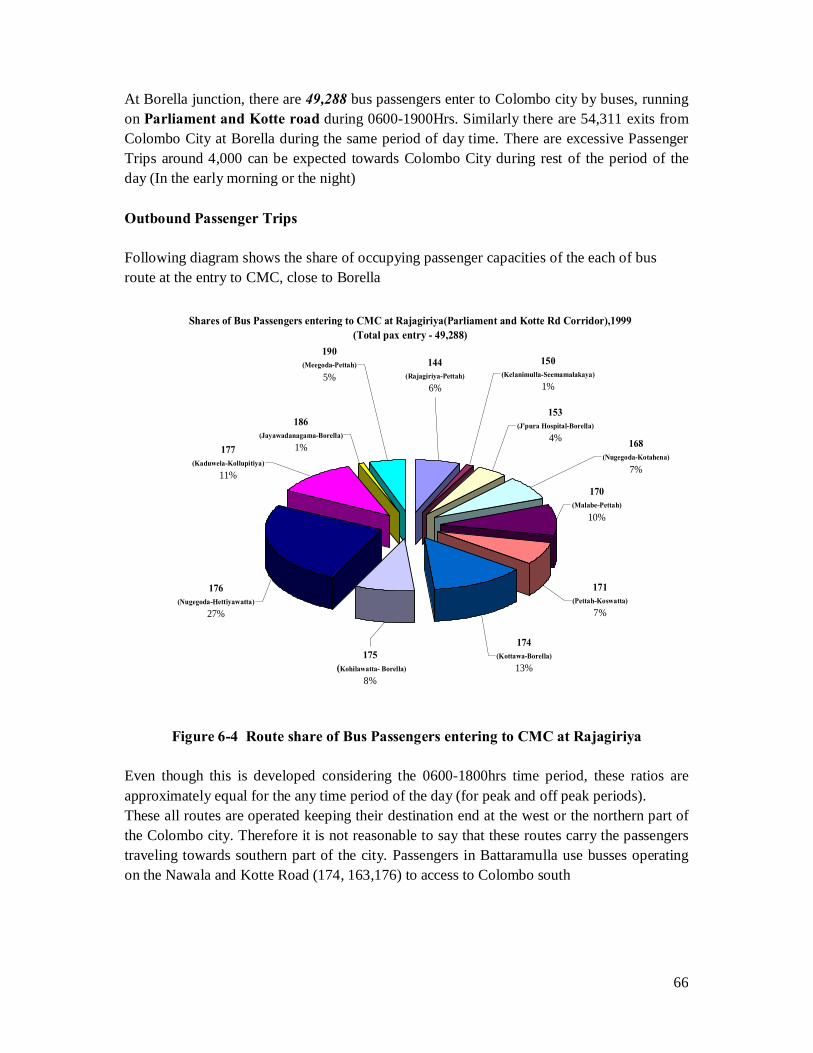
66
At Borella junction, there are 49,288 bus passengers enter to Colombo city by buses, running on Parliament and Kotte road during 0600-1900Hrs. Similarly there are 54,311 exits from Colombo City at Borella during the same period of day time. There are excessive Passenger Trips around 4,000 can be expected towards Colombo City during rest of the period of the day (In the early morning or the night) Outbound Passenger Trips Following diagram shows the share of occupying passenger capacities of the each of bus route at the entry to CMC, close to Borella
Figure 6-4 Route share of Bus Passengers entering to CMC at Rajagiriya
Even though this is developed considering the 0600-1800hrs time period, these ratios are approximately equal for the any time period of the day (for peak and off peak periods). These all routes are operated keeping their destination end at the west or the northern part of the Colombo city. Therefore it is not reasonable to say that these routes carry the passengers traveling towards southern part of the city. Passengers in Battaramulla use busses operating on the Nawala and Kotte Road (174, 163,176) to access to Colombo south
Shares of Bus Passengers entering to CMC at Rajagiriya(Parliament and Kotte Rd Corridor),1999(Total pax entry - 49,288)
176 (Nugegoda-Hettiyawatta)
27%
175 (Kohilawatta- Borella)
8%
174(Kottawa-Borella)
13%
171(Pettah-Koswatta)
7%
170(Malabe-Pettah)
10%
168(Nugegoda-Kotahena)
7%
153(J'pura Hospital-Borella)
4%
150(Kelanimulla-Seemamalakaya)
1%
144(Rajagiriya-Pettah)
6%
190(Meegoda-Pettah)
5%
186(Jayawadanagama-Borella)
1%177(Kaduwela-Kollupitiya)
11%
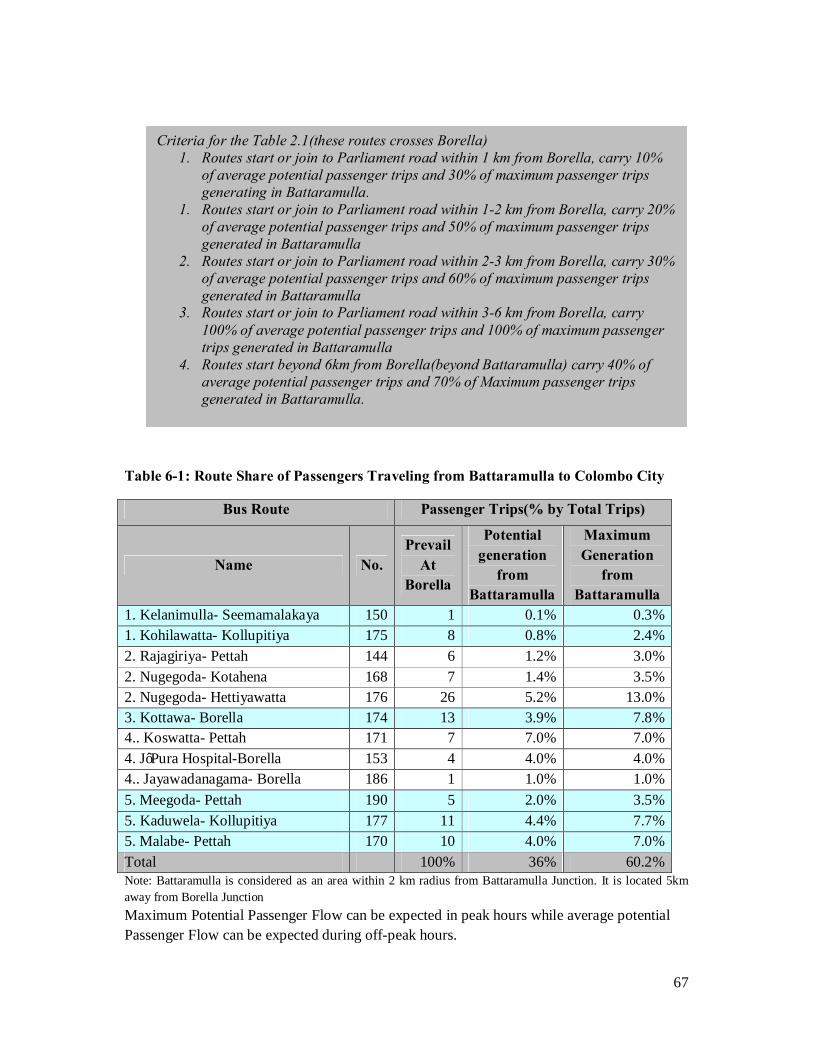
67
Table 6-1: Route Share of Passengers Traveling from Battaramulla to Colombo City
Note: Battaramulla is considered as an area within 2 km radius from Battaramulla Junction. It is located 5km away from Borella Junction Maximum Potential Passenger Flow can be expected in peak hours while average potential Passenger Flow can be expected during off-peak hours.
Bus Route Passenger Trips(% by Total Trips)
Name No. Prevail
At Borella
Potential generation
from Battaramulla
Maximum Generation
from Battaramulla
1. Kelanimulla- Seemamalakaya 150 1 0.1% 0.3% 1. Kohilawatta- Kollupitiya 175 8 0.8% 2.4% 2. Rajagiriya- Pettah 144 6 1.2% 3.0% 2. Nugegoda- Kotahena 168 7 1.4% 3.5% 2. Nugegoda- Hettiyawatta 176 26 5.2% 13.0% 3. Kottawa- Borella 174 13 3.9% 7.8% 4.. Koswatta- Pettah 171 7 7.0% 7.0% 4. J’Pura Hospital-Borella 153 4 4.0% 4.0% 4.. Jayawadanagama- Borella 186 1 1.0% 1.0% 5. Meegoda- Pettah 190 5 2.0% 3.5% 5. Kaduwela- Kollupitiya 177 11 4.4% 7.7% 5. Malabe- Pettah 170 10 4.0% 7.0% Total 100% 36% 60.2%
Criteria for the Table 2.1(these routes crosses Borella) 1. Routes start or join to Parliament road within 1 km from Borella, carry 10%
of average potential passenger trips and 30% of maximum passenger trips generating in Battaramulla.
1. Routes start or join to Parliament road within 1-2 km from Borella, carry 20% of average potential passenger trips and 50% of maximum passenger trips generated in Battaramulla
2. Routes start or join to Parliament road within 2-3 km from Borella, carry 30% of average potential passenger trips and 60% of maximum passenger trips generated in Battaramulla
3. Routes start or join to Parliament road within 3-6 km from Borella, carry 100% of average potential passenger trips and 100% of maximum passenger trips generated in Battaramulla
4. Routes start beyond 6km from Borella(beyond Battaramulla) carry 40% of average potential passenger trips and 70% of Maximum passenger trips generated in Battaramulla.

68
Since the passenger compositions in each route is not changing throughout the day, it can be estimated that
• Battaramulla generates 36% potential passenger trips to West and Northern part of the Colombo City during the off-peak hours
• Battaramulla generates 60% potential passenger trips to West and Northern part of the Colombo City during the peak hours
Table 6-2 Summary of bus passenger flow from Battaramulla to Colombo North/West
Duration
Bus Passenger Flow (Via Borella)
Outside to inside CMC
Battaramulla to Colombo North/West
Peak Period (0730-0930 Hrs) 13,828 8,324 Off-Peak Period ( Average per1 hour) 3,546 1,277 Day time (0700-1900 Hrs.) 49,288 21,090 In bound Passenger Trips Following diagram shows the share of occupying passenger capacities of the each of bus route at the exit of CMC, near to Borella
Figure 6-5 : Passenger shares of Bus routes leaving CMC at Rajagiriya
Shares of Bus Passengers at the exit of CMC Boundary
1717%
17010%
1688%
1535%
17710%
17624%
1759%
17414%
1502%
1861%
190(Meegoda-Pettah)
6%1444%

69
Table 6-3: Route Share of Passengers attracted to Battaramulla from Colombo City Bus Route Passenger Trips(% by Total Trips)
Name No. Prevail
At Borella
Potential attraction to Battaramulla
Maximum Attraction
to Battaramulla
1.2. Kelanimulla- Seemamalakaya 150 2 0.2% 0.6% 1.8. Kohilawatta- Kollupitiya 175 9 0.9% 2.7% 2.1. Rajagiriya- Pettah 144 4 0.8% 2.0% 2.4. Nugegoda- Kotahena 168 8 1.6% 4.0% 2.9. Nugegoda- Hettiyawatta 176 24 4.8% 12.0% 3.7. Kottawa- Borella 174 14 4.2% 8.4% 4.6. Koswatta- Pettah 171 7 7.0% 7.0% 4.3. J’Pura Hospital-Borella 153 5 5.0% 5.0% 4.11. Jayawadanagama- Borella 186 1 1.0% 1.0% 5.12. Meegoda- Pettah 190 6 2.4% 4.2% 5.10. Kaduwela- Kollupitiya 177 10 4.0% 7.0% 5.5. Malabe- Pettah 170 10 4.0% 7.0% Total 100% 35.9% 59.9%
• Battaramulla attracts 35.9% potential passenger trips from West and Northern part of the Colombo City during the off-peak hours
• Battaramulla attracts 59.9% potential passenger trips from West and Northern part of the Colombo City during the peak hours
Criteria for the Table 2.3(These routes crosses Borella) 2. Routes ending or divert from Parliament road within 1 km from Borella, carry
10% of average potential passenger trips and 30% of maximum passenger trips attracting to Battaramulla.
3. Routes ending or divert from Parliament road within 1-2 km from Borella, carry 20% of average potential passenger trips and 50% of maximum passenger trips attracting to Battaramulla
4. Routes ending or divert from Parliament road within 2-3 km from Borella, carry 30% of average potential passenger trips and 60% of maximum passenger trips attracting to Battaramulla
5. Routes ending or divert from Parliament road within 3-6 km from Borella, carry 100% of average potential passenger trips and 100% of maximum passenger trips attracting to Battaramulla
6. Routes going beyond 6km from Borella(beyond Battaramulla) carry 40% of average potential passenger trips and 70% of Maximum passenger trips attracting to Battaramulla.

70
Table 6-4: Bus passenger flow from Colombo North/West to Battaramulla
Duration
Bus Passenger Flow (Via Borella)
Inside to Outside CMC
Colombo North/West to Battaramulla
Day time (0700-1900 Hrs.) 54,311 22,880 Peak Period (1630-1830 Hrs) 14,073 8,430 Off-Peak Period ( Average per1 hour) 4,024 1,445
b. Bus Passenger Trips to/From Battaramulla at Kolonnawa Route no.152 (Battaramulla, Gothatuwa-Pettah) carry large amount of passengers between northern part of the city and Battaramulla via Dematagoda and Kolonnawa. Otherthan that, eventhough routes 3, 18, 98,143,134,148,164,166,714 crosses Kolonnawa, they are not carrying considerable amount of passengers who are traveling between Battaramulla and North of Colombo city. Above Route buses are carrying about 40, 000 bus passengers via Kolonnawa in bothways during 0600-1800hrs. (Excluding passenger traveling in 152 route). Since these all routes are not operated towards Battaramulla area, passengers in nothern do not tend to use these buses to access or leave Battaramulla. But 152 operate 72 trips per each direction per day. Assuming average occupancy at Kolonnawa as 30 pax per trip, about 2160 pax are carrying daily per each direction. Therefore average per hour demand for the route is around 180 pax. At the peak hour it can be raised upto around 400 pax By combining the bus passenger trips crosses via Borella and Kolonnawa, following estimation can be made for the total bus passengers moving between Battaramulla and Colombo West/North Table 6-5: Bus passenger Flow between Battaramulla and Colombo west/north
Duration
Bus Passenger Flow (Via Borella and
Kolonnawa) Battaramulla to Colombo North/West
Colombo North/West to Battaramulla
Day time (0700-1900 Hrs.) 23,250 25,040 Peak Period (1630-1830 Hrs) 8,724 8,830 Off-Peak Period ( Average per1 hour) 1,457 1,625

71
Figure 6-6: Bus Passenger Flow between Battaramulla and Colombo west/north
6.3.2 Rail Transport Four major railway stations in the study area, has to be considered in analyzing passenger flow between Battaramulla and Northern/ Western part of Colombo city. They are namely
1. Dematagoda (Main Line) 2. Maradana (Main Line) 3. Baseline Road(Kelani Valley Line) 4. Cotta Road (Kelani Valley Line)
Passengers traveling between Battaramulla and Maradana/ Dematagoda stations also includes in the counts of bus passengers at Borella and Kolonnawa since they have to use buses to travel between these trip ends. Therefore it is not required to count these potential rail passenger trips separately. Cotta Road and Baseline Road stations are rarely used by the passengers who are traveling between Battaramulla and west/ north of Colombo city. These two stations are only used by the passenger traveling from the Southern part of the Colombo city to access the rest of the city. Anyhow the passenger flow coming from the southern part of the city is not important in the flow estimation for proposed mass rapid transit option between Dematagoda and Battaramulla.
APPF (G) = 1457 PPPF (G) = 8,724
APPF (A) = 180 PPPF (A) = 800
APPF (G) = 180 PPPF (G) = 800
APPF (A) = 1625 PPPF (A) = 8,830
APPF- Average Potential Passenger Flow per hour, (G)- generated in Battaramulla PPPF- Peak Period (2hrs.) Potential Passenger Flow, (A)- attracted to Battaramulla

72
6.3.3 Private Transport Modes Private Transport modes such as Cars, Vans, Three Wheelers, and Motor Cycles cross three major transition points while traveling between Battaramulla and North part of Colombo city areas. They are,
• Kolonnawa (Colombo North Battaramulla) • Orugodawatta (Colombo North Battaramulla) • Borella (Colombo North Battaramulla)
Since the Rapid Transit option is to implement between Colombo North (Dematagoda) and Battaramulla, flow analysis is done only considering the flow between North part of the Colombo city and Battaramulla area Following vehicle flow analysis is based on the Origin-Destination tables prepared at each above entry location. It also uses the observation that peak period (0730-0930) vehicular flow is equal to 25% of 12 hr (0630-1830) day vehicular flow.
Table 6-6: Private Vehicle Flow between Battarmulla and Colombo North
Entry Points
Vehicle Flow/day towards CMC
Total From Battaramulla to Colombo North
During 06.30-18.30
During peak period(0730-0930)
Kolonnawa 7,768 700 175 Orugodawatta 8,799 2,500 625 Borella 32,367 5,275 1,319
It is also observed that the average occupancy for all above corridors is around 1.4. Therefore the expected passenger flow can be tabulated as follows. Table 6-7: Private Vehicular Passenger Flow between Battaramulla and Colombo North
Entry Points
Passenger Flow between Colombo North and Battaramulla per direction
Total Crossings (12hrs.)
Potential Passenger
Flow/day(12hrs)
During Off-Peak period (Average per
1hr duration)
During Peak Periods
(0730-0930hrs) & (1630-1830hrs)
Kolonnawa 10,875 980 74 245 Orugodawatta 12,319 3,500 263 875 Borella 45,314 7,385 554 1,846 Total 68,508 11,865 891 2,966

73
Figure 6-7: Private vehicular passenger flow Between Battaramulla and Colombo North
6.4 Estimation of Passenger Demand for Proposed MRT Trace
6.4.1 Estimated diversion of Bus Passengers Bus Passengers traveling via Borella Consider the passengers traveling in buses originated at Colombo and traveling towards Battaramulla via Borella. Pettah origin busses carry most of the the passengers generated at Pettah and Maradana Railway station during the peak hours. Many of these passengers are coming from the Gampaha District passing Dematagoda railway station on the Mainline. Only few passengers from coastal line come to Pettah railway station to take a bus to travel Battaramulla.(If they want to travel Battaramulla, they can take a bus at Kollupitiya). Therefore it is fare to say that busses originated in Pettah(traveling via Maradana) will carry approximately 70% of passengers generated in mainline railway stations during the peak period. Therefore, during peak period, 70% of Pettah originated bus passenger diversion can be expected to rapid transit mode starting at Dematagoda. At the off-peak period passengers are mostly generated within the City (official trips, commercial trips etc). Therefore only
APPF (G & A) = 554 MPPF (G&A) = 1,846
APPF (G & A) = 337 MPPF (G&A) = 1,120
APPF- Average Potential Passenger Flow per hour, (G) - generated in Battaramulla PPPF- Peak Period (2hrs.) Potential Passenger Flow, (A)- attracted to Battaramulla

74
about 40% of passengers, who are traveling in buses running to Battaramulla from Pettah, are expected to come from Colombo north and Gampaha to travel Battaramulla during the off-peak period. Consider the passengers traveling in the busses originated at Nothern of CMC (Hettiyawatta, Kotahena) and traveling towards Battaramulla via Maradana and Borella. Majority of passengers use these buses to travel Battaramulla, will divert to proposed Rapid Transit Media since it also started in the northern part of the city and running parallel to these routes. Therefore it is fair to assume that 80% of passengers traveling to Battaramulla via Borella, will divert to the Rapid Transit mode during the peak period.(since it coming from the north via Maradana railway station).Even in the off-peak period, larger number of passengers will travel from above two areas by using these buses. Therefore around 60% of passengers in these buses will tend to use proposed rapid transit mode during the off peak period. Passengers traveling in bus routes started at Borella and Colombo West; do not tend to use the proposed rapid transit modes since their trip ends are not laying on it. Since these all trips having a return trip, above percentages are not changed for the CMC inbound passenger flow in each route (except duration of peak period) Table 6-8: Bus Passenger Flow Estimation from Battaramulla to Dematagoda
Bus Route Passenger Flow(% by Total Trips)
Name No.
Potential generation
from Battaramulla
Potential Pax flow Between Battaramulla and
Dematagoda
during off peak period
during peak period
5.5. Malabe- Pettah 170 4.0%
40%
1.6%
70%
2.8% 5.12. Meegoda- Pettah 190 2.0% 0.8% 1.4% 2.1. Rajagiriya- Pettah 144 1.2% 0.5% 0.8% 4.6. Koswatta- Pettah 171 7.0% 2.8% 4.9% 1.2. Kelanimulla- Seemamalakaya 150 0.1% 0.0% 0.1% 2.9. Nugegoda- Hettiyawatta 176 5.2%
60% 3.1%
80% 4.2%
2.4. Nugegoda- Kotahena 168 1.4% 0.8% 1.1% 5.10. Kaduwela- Kollupitiya 177 4.4% NR NR NR NR 1.8. Kohilawatta- Kollupitiya 175 0.8% NR NR NR NR 4.3. J’Pura Hospital-Borella 153 4.0% NR NR NR NR 4.11. Jayawadanagama- Borella 186 1.0% NR NR NR NR 3.7. Kottawa- Borella 174 3.9% NR NR NR NR Total 36% 9.6% 15.3%

75
Table 6-9: Estimated Bus Passenger diversion to the proposed BRT from Battaramulla
Duration
Bus Passenger Flow (Via Borella)
Outside to inside CMC
Battaramulla to Dematagoda(expected
diversion) Day time (0700-1900 Hrs.) 49,288 5,516 Peak Period (1630-1830 Hrs) 13,828 2,116 Off-Peak Period ( Average per1 hour) 3,546 340 Including 152 (Battarmulla-Pettah) passengers it can be concluded that bus passenger flow for both ways as follows, Table 6-10: Estimated Bus Passenger diversion to the proposed BRT from Dematagoda
Duration
Bus Passenger Flow (Via Borella and
Kolonnawa) Battaramulla
to Dematagoda Dematgoda to Battaramulla
Day time (0700-1900 Hrs.) 7,676 8,173 Peak Period (1630-1830 Hrs) 2,516 2,553 Off-Peak Period ( Average per1 hour) 520 566
6.4.2 Estimated passenger diversion of Private vehicles Table 3.4 illustrates the number of passengers travel between Battaramulla and northern part of Colombo city (Hettiyawatta, Kotahena, Grandpass, Modara etc.). Since one end of these trips still further away from the proposed rapid transit end (ie. Dematagoda is located distant to Kotahena and Hettiyawatta area), passengers relactant to give up their private vehicles. Also higher comfort, time saving and trip flexibility engaged with private vehicles, keep people away from using public transport mode. Considering these factors, only about 60% of passenger diversion can be expected for the proposed rapid transit mode during both peak and off peak periods. Table 6-11: Estimated passenger diversion of private vehicles to proposed rapid transit
Duration
Private Vehicle Passenger Flow between
Colombo North and Battaramulla/direction Total Expected diversion
Day time (0700-1900 Hrs.) 11,865 7,119 Peak Period (1630-1830 Hrs) 2,966 1,780 Off-Peak Period ( Average per1 hour) 891 535

76
6.4.3 Total Passenger Demand for Proposed Corridor of MRT Finally the total potential passengers who are having a tendency to divert proposed rapid transit mode can be obtained by adding number of potential bus passengers and private vehicle users in table 3.3 and 3.4 in corresponding time frame cells. Following table gives the passenger demand for proposed transit media in different time frames. Table 6-12: Estimated passenger demand for the proposed transit option
Duration
Bus Passenger Flow (Via Borella and
Kolonnawa) Battaramulla
to Dematagoda Dematgoda to Battaramulla
Day time (0700-1900 Hrs.) 14,795 15,292 Peak Period (1630-1830 Hrs) 4,296 4,333 Off-Peak Period ( Average per1 hour) 1,055 1,101
Figure 6-8 Estimated passenger demand for the proposed transit option
APPF (G & A) = 1055 MPPF (G&A) = 4,296
APPF (G & A) = 1101 MPPF (G&A) = 4333
APPF- Average Potential Passenger Flow per hour, (G) - generated in Battaramulla PPPF- Peak Period (2hrs.) Potential Passenger Flow, (A)- attracted to Battaramulla

77
7 Fuel Conservation Capacity of New Introductions
7.1 Contribution of New Services in brief
Figure 7-1: Contribution of New Services for Reducing Fuel Usage
7.2 Introduction of Premium Service
7.2.1 Program Impact to Vehicular Flow This service is introduced for carrying car users to their offices as well as providing a shuttle service during office hours in the Colombo City areas especially in the business areas. These services will help to reduce the use of private modes for work and business trips and hence to
Reduce the Private modes
Smooth flow of Traffic
Attracting people who are using Private modes for work trips
Avoiding work trips during the peak period of the day
Grouping people who are having same origin and destination
Contribution factors for fuel conservation
New service/project impact
Reduce the Traffic Congestion
Reducing work trips per day (Compressed Work Week)
Introduction of Premium Service
Introduction of Car/Van Pooling
Introduction of Variable Work Hours

78
reduce the traffic congestion within the city limit. Reduction of traffic congestion induces higher average speed for the remaining traffic while conserving the fuel. As described in Chapter 2, about 42% of total trips incurred within Greater Colombo Area are home based work trips. Non-home based trips which mainly include official and business trips are about 41%. In the morning home base work trips crossing the CMC boundary cordon in the direction of city centre rises up to 7000 veh./30 minits. But these trips gradually diminish during the day progresses and home based other and non-home based trips rise up. Following figure shows the compositions of trip types at the boundary of CMC. Similar type of distribution can be expected at the boundary of Central Business District.
Figure 7-2: Traffic Flow at CMC boundary, 2004 Most of these trips are generated within the Colombo district while the other generate in the rest of Western province and outside of the province. Premium service is targeting the Car and Utility vehicle users coming to the main business areas such as Fort, Pettah, Slave Island and Town Hall etc. for the purpose of work and business. Since this service is provided between those business areas and the areas close to the boundary of CMC such as Nugegoda, Ratmalana, Kotahena and Battaramulla etc., private vehicle users travelling in between these areas are expected to attract for this service. An estimated quantity of 27,804 home based work trips per day per direction (by using motorized modes other than buses) are incurred within the region of premium service is going to introduce .Also considering the centroidal distances between origin and destination zones, the travel kilometres of these home based work trips can be computed as 167,723 vehicle-kms per day per direction. Following Table illustrate this computation. Majority of home based work trips, 61% by the total work trips, are used four wheeler vehicles such as cars, vans and jeeps etc. for travelling.
Travel Pattern according to the Purpose of Travelling(CMC Boundary,2004)
0
1,000
2,000
3,000
4,000
5,000
6,000
7,000
7.00
-7.3
0
7.30
-8.0
0
8.00
-8.3
0
8.30
-9.0
0
9.00
-9.3
0
9.30
-10.
00
10.0
0-10
.30
10.3
0-11
.00
11.0
0-11
.30
11.3
0-12
.00
12.0
0-12
.30
12.3
0-13
.00
13.0
0-13
.30
13.3
0-14
.00
14.0
0-14
.30
14.3
0-15
.00
15.0
0-15
.30
15.3
0-16
.00
16.0
0-16
.30
16.3
0-17
.00
17.0
0-17
.30
17.3
0-18
.00
18.0
0-18
.30
Time
Flow
/30m
init HBW Trips
HBO Trips
NHB Trips

79
Operated Vehicle- Killometres of Greater Colombo Intra Regional Trips,2006 (12 hours, Towards City, Centroidal Distances) Trip Category: Inter Zonal Trip Type: Home based Work Trips Vehicle Type: All Private Vehicles
From To
Mah
arag
ama
Kes
bew
a
Nug
egod
a
Deh
iwal
a- M
ount
La
vini
ya
Mor
atuw
a
Alu
th K
ade
Bloe
men
dhal
Fort
Gal
le F
ace
Gra
ndpa
ss
Kot
ahen
a
Mal
igaw
atta
Mar
adan
a
Mat
takk
uliy
a
Petta
h
Slav
e Is
land
Tow
n H
all/W
ekan
da
Bam
bala
pitiy
a
Bore
lla
Cin
nam
en
Gar
den
Dem
atag
oda
Hav
eloc
k To
wn
Kir
ulap
onne
Kol
lupi
tiya
Kup
piya
wat
ta
Mila
giri
ya
Nar
ahen
pita
Pam
anka
da
Thim
biri
gasy
aya
Wel
law
atta
Tota
l
%
1,10
5,00
0
1,10
6,00
0
1,10
7,00
0
1,10
8,00
0
1,10
9,00
0
1,40
1,00
0
1,40
2,00
0
1,40
3,00
0
1,40
4,00
0
1,40
5,00
0
1,40
6,00
0
1,40
7,00
0
1,40
8,00
0
1,40
9,00
0
1,41
0,00
0
1,41
1,00
0
1,41
2,00
0
1,50
1,00
0
1,50
2,00
0
1,50
3,00
0
1,50
4,00
0
1,50
5,00
0
1,50
6,00
0
1,50
7,00
0
1,50
8,00
0
1,50
9,00
0
1,51
0,00
0
1,51
1,00
0
1,51
2,00
0
1,51
3,00
0
Maharagama 1,105,000 0 0 0 0 0 0 0 3,149 168 0 0 0 319 0 1,202 461 12,260 2,038 0 0 0 357 0 983 0 0 881 0 952 499 23,269 14
Kesbewa 1,106,000 0 0 336 0 69 0 0 3,544 237 0 0 205 1,206 502 3,119 1,097 2,026 540 851 260 196 1,029 149 1,587 0 0 1,474 0 237 636 19,301 12 Nugegoda 1,107,000 147 0 0 289 132 0 0 3,541 178 0 0 0 222 0 1,885 190 16,166 363 244 0 0 0 107 626 0 0 231 0 249 279 24,849 15 Dehiwala- Mount Laviniya 1,108,000 222 0 793 0 0 0 0 6,743 297 601 498 0 539 454 4,000 511 1,117 3,057 2,867 233 329 163 493 2,826 0 0 1,207 0 401 1,785 29,135 17 Moratuwa 1,109,000 0 0 155 0 0 0 0 2,649 0 218 0 0 899 705 5,357 0 0 1,536 560 0 0 0 262 1,058 0 0 786 0 158 1,931 16,273 10 Aluth Kade 1,401,000 0 0 0 0 0 0 0 55 0 0 0 0 0 0 0 0 0 0 0 0 0 0 0 0 0 0 0 0 0 0 55 0 Bloemendhal 1,402,000 0 0 0 0 0 0 0 0 0 0 0 0 0 0 42 0 0 0 0 0 0 0 0 0 0 0 0 0 0 0 42 0 Fort 1,403,000 0 0 1242 309 99 0 0 0 0 761 0 0 529 56 668 59 102 155 806 130 0 138 154 197 0 0 161 0 249 539 6,352 4 Galle Face 1,404,000 0 0 0 0 0 0 0 13 0 0 0 0 0 0 0 0 0 0 0 0 0 0 0 0 0 0 0 0 0 0 13 0 Grandpass 1,405,000 0 0 0 0 0 0 0 120 0 0 0 0 56 0 305 37 83 110 0 0 32 0 0 0 0 0 0 0 0 0 743 0 Kotahena 1,406,000 0 0 0 0 0 0 0 147 0 0 0 0 75 0 263 0 0 0 209 0 0 0 0 0 0 0 0 0 0 0 695 0 Maligawatta 1,407,000 0 0 0 0 0 0 0 292 0 0 0 0 0 0 609 0 0 27 0 0 0 0 0 37 0 0 0 0 0 163 1,128 1
Maradana 1,408,000 0 0 0 238 0 0 0 924 0 0 0 0 0 0 700 0 0 65 0 0 0 0 0 112 0 0 85 0 0 145 2,268 1 Mattakkuliya 1,409,000 0 0 0 125 260 31 0 1,872 0 36 122 0 81 0 750 312 79 590 516 0 85 0 0 1,324 0 0 110 0 102 307 6,702 4 Pettah 1,410,000 0 0 0 0 0 0 0 88 0 0 0 0 0 0 0 0 28 0 0 0 0 0 0 0 0 0 0 0 0 0 116 0 Slave Island 1,411,000 0 0 0 0 0 0 0 344 16 0 0 0 0 0 577 0 0 0 0 0 0 0 0 0 0 0 0 0 0 0 936 1 Town Hall/Wekanda 1,412,000 727 0 0 0 0 0 0 324 0 0 0 0 0 0 938 0 0 0 0 0 0 0 0 0 0 0 0 0 0 0 1,989 1 Bambalapitiya 1,501,000 0 0 104 0 0 0 0 1,422 51 0 0 0 0 259 1,522 0 0 0 0 0 0 0 0 34 0 0 0 0 0 0 3,392 2 Borella 1,502,000 0 0 198 164 359 0 0 1,332 0 0 0 0 54 0 3,847 31 140 35 0 0 39 0 233 196 0 0 46 0 0 175 6,848 4 Cinnamen Garden 1,503,000 0 0 0 0 0 0 0 506 0 0 0 0 0 0 929 0 0 0 0 0 0 0 0 0 0 0 0 0 0 0 1,435 1 Dematagoda 1,504,000 0 0 0 0 0 0 0 534 0 0 0 0 0 0 570 24 0 42 0 0 0 0 0 22 0 0 0 0 0 0 1,192 1 Havelock Town 1,505,000 0 0 148 0 0 0 0 225 0 0 0 0 0 0 133 169 0 254 0 0 0 0 0 0 0 0 0 0 0 0 928 1 Kirulaponne 1,506,000 0 125 257 0 0 0 0 1,169 0 91 109 73 404 0 2,544 0 142 141 327 0 0 271 0 276 0 0 238 0 125 23 6,316 4
Kollupitiya 1,507,000 0 0 0 0 0 0 0 708 0 54 0 0 43 126 1,344 0 9 0 0 0 0 0 92 0 0 0 0 0 0 0 2,377 1 Kuppiyawatta 1,508,000 0 0 0 0 0 0 0 0 0 0 0 0 0 0 0 0 0 0 0 0 0 0 0 0 0 0 0 0 0 0 0 0 Milagiriya 1,509,000 0 0 179 0 0 0 0 0 0 0 0 0 0 0 0 0 0 0 0 0 0 0 0 0 0 0 0 0 0 0 179 0 Narahenpita 1,510,000 102 0 0 283 0 0 0 858 0 0 0 0 57 0 2,046 0 0 0 44 0 0 0 49 0 0 0 0 0 0 0 3,438 2 Pamankada 1,511,000 0 0 0 0 0 0 0 723 0 0 0 0 0 0 0 0 198 0 0 114 0 58 0 160 0 0 0 0 0 26 1,279 1
Thimbirigasyaya 1,512,000 0 0 0 0 0 0 0 345 0 0 0 0 0 0 0 0 0 0 0 0 0 0 0 0 0 0 0 0 0 0 345 0 Wellawatta 1,513,000 0 0 166 0 0 0 0 1,232 190 0 0 0 226 128 3,204 0 191 107 250 0 0 49 0 179 0 0 206 0 0 0 6,128 4
Total 1,19
7 125 3,57
9 1,40
8 917 31 0 32,85
8 1,13
6 1,761 729 278 4,710 2,229 36,556 2,890 32,541 9,059 6,674 737 681 2,064 1,539 9,616 0 0 5,425 0 2,474 6,509 167,723 100 % 1 0 2 1 1 0 0 20 1 1 0 0 3 1 22 2 19 5 4 0 0 1 1 6 0 0 3 0 1 4 100

80
7.2.2 Estimated reduction of private vehicle kms and Fuel Consumption
For the estimation, it is assumed that premium service is capable to cater only 30% of work trips done using personal modes(4-wheelers) such as utility and car/saloon group. Therefore it is capable to cater about 20% (= 30%x 61%) of total work trips. Total Travel Distance (Centroidal) of home based work trips = 167,723 kms (Annex 2) Considering actual travel distance is thrice the centroidal distance, Total actual travel distance of home based work trips = 503,170 kms Average actual travel distance of a work trip (per direction) = 503,170 kms/27,804 = 18 kms Since premium service is targeting 20% of these work trips (27,804), Estimated reduction of vehicle kms per day per direction = 20% x 27,804 x 18 kms = 100,094 kms Estimated reduction of vehicle kms per year (including return trip) = 2 x 100,094 x 250 =50,047,200 kms (Working days per year =250 days approximately considering half day work on Saturday) Assuming fuel consumption rate of these vehicles = 10 kms/litre Estimated reduction of Fuel consumption due to the introduction of Premium service (considering work trips within Greater Colombo Area) =50,047,200 /10Litres per year =5.0 million litres per year In addition to the work trips generated within this region of Colombo city limits, there are about 13,800 work trips by private vehicles coming to the aforementioned business areas (Fort, Galleface, Kollupitiya, Townhall, Pettah, Maradana and Slavei sland) from the distant areas of the western province and other part of the country. They are travelling estimated 550,000 km per day per direction. If the premium service terminals can be provided close to the boundary of Colombo city covering main city entering corridors with good parking facilities, car users who are coming from outside of the city will tend to park their vehicle at the terminal and use premium service buses headed towards Business areas. Thereby it is possible to reduce at least about 20 km per each vehicle considering the dimensions of the Colombo city. Assuming premium service is targeting 20% of these work trips (13,811), as in above case Estimated reduction of vehicle kms per day per direction = 20% x 13,811 x 20 kms = 55,244 kms Estimated reduction of vehicle kms per year (including return trip) = 2 x 55,244 x 250 =27,622,000 kms (Working days per year =250 days approximately considering half day work on Saturday)

81
Assuming fuel consumption rate of these vehicles = 10 kms/litre Estimated reduction of Fuel consumption due to the introduction of Premium service (considering work trips within Greater Colombo Area)
=27,622,000 /10Litres per year =2.7 million litres per year In addition to serving the work trips, premium service is also intended to use for non-home based private vehicle trips incurred during the day time. Trip length of these trips are shorter compared to the trips coming from the outside to the CMC. It will be around 12 kms considering the geographic dimension of the CMC. If the generation of non home based trips within the CMC is also assumed as 44,103 and also considering 20% of these trips are catered by the premium service, Estimated reduction of Fuel consumption due to the introduction of Premium service (considering non home based trips within the service provided area) = 20% x 44,103 x 12 x 2 x 250/10 = 5.3 million litres per year Estimated total Fuel saving due the introduction of Premium Service for Greater Colombo
= 12.0 million litres per year
7.3 Introduction of Car/Van Pooling
7.3.1 Program Impact to Vehicular Flow Intention of this project is to increase the occupancy rate of private vehicles entering to city centre. But this can be implemented for the trips which are having pre-defined schedules of origin-destination and time of operation. Therefore Home base work trips and home based school trips can be grouped for car/van pooling. Most of home based school trips are already grouped by school vans and remainder of these trips are using public transport modes. Existing occupancy rates and flows of home based work trips in the Colombo city is as follows.
Table 7-1: Home based Work Trips by Private Vehicles
Vehicle Category Occupancy Rate
Home based work trip Flow/per day/per direction Vehicle Pax.
Motor Cycle 1.3 7,141 9283
Three Wheelers 1.0 4,908 4,908 Car/Saloon 1.7 11,193 19,028
Utility 2.2 4,561 10,034

82
7.3.2 Forecasted reduction of private vehicles and Fuel Consumption
If it is expected double the occupancy rate for 5% of cars and utility vehicles which are using for home based work trips, following reductions can be expected.
Table 7-2: Reductions in Private Modes Due to Car and Van Pooling
Estimated reduction of vehicle kms per year (including return trip) = 2 x 751x18x 250 = 6759,000 kms Estimated reduction of Fuel consumption due to the introduction of car/van pooling (considering work trips within Greater Colombo Area) =6759, 000 /10Litres per year =0 .6 million litres per year
7.4 Bus Rapid Transit (Battaramulla-Dematagoda)
7.4.1 Program Impact to Vehicular Flow According to Private Vehicle Flow analysis presented in Section 6.3.3, it reveals that peak period (0730-0930) vehicular flow is equal to 25% of 12 hr (0630-1830) day vehicular flow. Majority of these peak period travelers expected to divert from their personal modes to the BRT.
7.4.2 Forecasted reduction of private vehicles and Fuel Consumption By considering the composition of private vehicles in the corridors of Kolonnawa, Orugodawatta and Borella , it is observed that average fuel consumption rate per vehicle as 23km/lt, 24km/lt, 18km/lt for each corridor respectively. Assuming BRT with Park & Ride facilities is capable of attracting 40% of these trips, and thereby expecting to save about 20km for each of above vehicle trip, Fuel conservation due to the introduction of BRT can be computed as follows.
Vehicle Category
Vehicle Flow of Home based work trips /per day/per direction Before
Grouping After Grouping Reduction
Car/Saloon 11,193 10,660 533
Utility 4,561 4343 218
Total 15, 754 15,003 751

83
For the vehicles coming through Kolonnawa, Vehicle kms saved due to introduction of BRT = 700 x 40% x 20 x 2 kms = 11,200 kms Therefore Fuel saving per day = 11,200/23 lt. = 487 Litres per day Similarly, Fuel Saving vehicle crossed at Orugodawatta =1667 Litres per day Fuel saving by vehicles crossed at Borella = 4689 Litres per day Therefore expected fuel saving due to introduction of BRT between Battaramulla and Dematagoda = 4689 x 250 = 1.7 million Litres
7.5 Introduction of Variable Working Hours
7.5.1 Program Impact to Vehicular Flow Introducing any type of variable work hour programs for the working places within the CMC will enhance the traffic flow during the peak hours. But only the compressed work week program is cable of reducing the vehicular entries to the city since it reduces the number of working days. Though other two types of variable work hour programs such as flexible work hours and staggered work hours doesn’t reduce the number of work trip entering to the city, both these programs promote vehicle users to use road at a convenient period of time Thereby introduction of those programs also help to improve the travel speed in the city. According to the Figure 4-5, By introducing 1 hour flexible work hour for the workers in Colombo city, average flow rate between 7.00 to 9.00 AM and 4.30 to 6.30 PM can be reduced from 8500 to 7100 veh/30 min. Assuming that drivers are adapted to the same flow density existed earlier, 17% improvement in average speed can be expected for a 2 hour peak period (according to the q=uk).
7.5.2 Forecasted reduction of private vehicles and Fuel Consumption Compressed Work Week (4/40 program) Presently estimated amount of 48,000 work trips by private motorized vehicles are entered to the city centre of Colombo daily. It is also estimated that these vehicles are travelling 24 km average distance daily. If 4/40 program is implemented; it will cause to reduce 20% of private vehicle flow. Considering that there is no any other service such as premium service which is in capable of reducing private vehicular flow,

84
Estimated reduction of vehicle kms per year (including return trip) = 2 x 48,167 x24x 250x 20% = 115,600,800kms Estimated reduction of Fuel consumption due to the introduction of car/van pooling (considering work trips within Greater Colombo Area) = 115,600,800 /10Litres per year = 11.6 million litres per year
7.6 Contribution of new services for the improvement of flow speed
7.6.1 Program Impact to Improve Flow Speed Collective impact of all above introductions (with one of variable work hour option) is capable to remove about 15,000 vehicles from the road. Since most of these vehicles are used for work trips during the congested period, removal of 15,000 vehicles will cause to smooth the traffic flow during the peak hours. If it is assumed that 10,000 vehicles are removed from the peak period of 7.00-9.00 am, there can be a 2500 vehicle reduction in 30 minute flow rate. It will cause to improve average speed by 30% compared to the existed.
7.6.2 Forecasted reduction of Fuel Consumption Estimated amount of 600,000(both direction) vehicle trips per day are incurred within the Greater Colombo area. Approximately 25% of these trips are assumed to be operated during the peak hour of the day. Approximately half of their journey within the city (half of average distance of 18 kms) is running under congested condition. Therefore the operated vehicle kilometres under congested flow condition per year
= 25% x 600,000 x (50% x 18) x 250 = 337,500,000 kms
It is assumed that all above introduction are contributed to lift average flow speed from 30km/hr to 40km/hr(30% improvement) within Colombo city in peak period. According to the Fuel efficiency survey, 2001,Ministry of Transport, improvement of speed from 30km/hr to 40 km/hr will serve 1lt for petrol vehicles, 3.4 lt for small diesel vehicles(vans) and 4.2 lts for large diesel vehicles(Buses, Truks) per each 100km operated.

85
Figure 7-3: Fuel efficiency survey for typical vehicles7
Considering the composition of vehicle on the road (Petrol -60%, Diesel small-26%, Diesel large-14%) average fuel saving per vehicle can be computed as = 2.1 per 100km Estimated reduction of fuel consumption due to the improvement of traffic flow = 337,500,000 x 2.1/100 Litres per year = 7.1 million litres per year Estimated fuel saving due to introduction of all above service = 32 million Lts/ year
7 Source: Fuel Efficiency Survey, Ministry of Transport, March 2001
10 20 30 40
1499 CC Car(Toyota Corolla) 14.3 10 8.7 7.72200 CC Diesel Van 20 16.7 12.5 9.1
Truck (Tata 2-axel, diesel) 66.7 25 16.7 12.5Bus (Tata 432, diesel) 66.7 20 16.7 12.5
0
10
20
30
40
50
60
70
80
Fuel
effi
cien
cy, l
itres
/100
km
Speed km/hr

86
Appendix I: Survey Form for Assessment of Premium Service
Survey to determine the feasibility of introducing premium Bus Service
(Please tick √ in the relevant cage) Q.1. Name of the Organization………………………………………… Q.2. Location of your office/work place………………………………. Q.3. Location of your residence………………………………. Q.4.The mode of travel you usually use to come to location of office/work place? a) Bus b) Train c) Staff Transport (Van /Bus) (Own Cost) e) Office transport (Van/Bus) (Provided by the organization) f) Private own vehicle g) Official vehicle (car, Motor bicycle, etc.) (Provided by the organization) h) Other (Please specify) …………………………………………….. 6. Time you usually leave home Q.5. How many persons usually accompany you? (If you are using modes of c,e,f,g in Q 1)
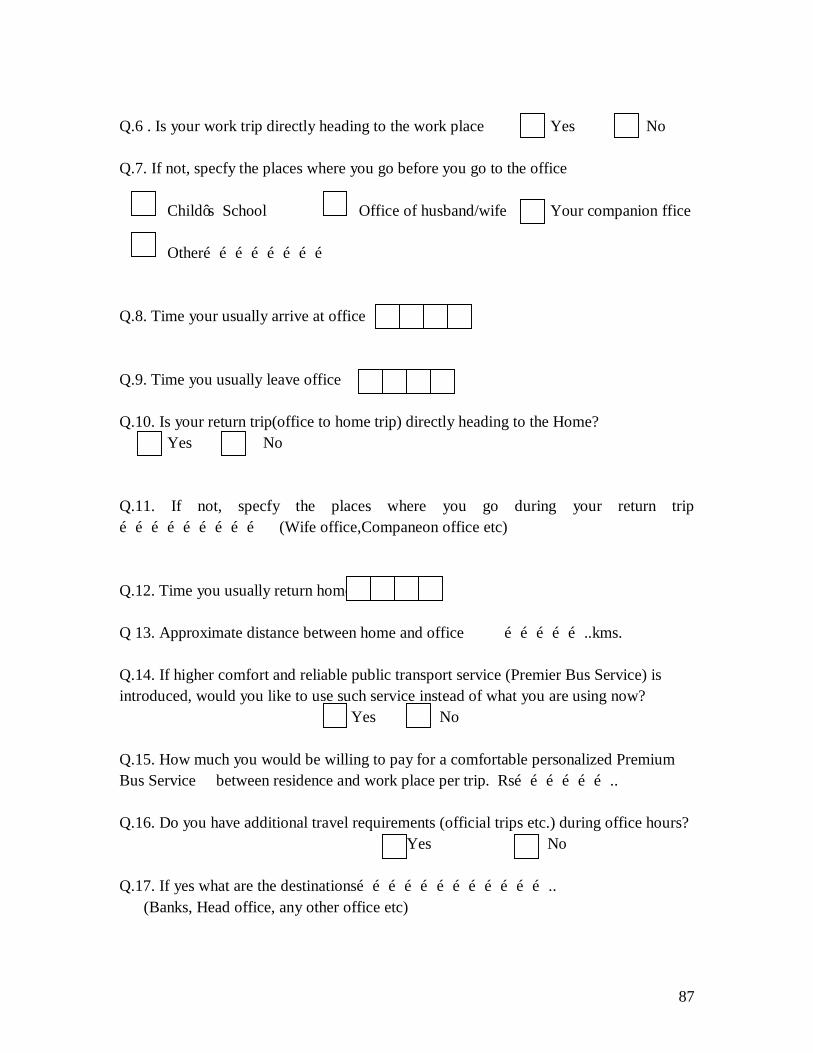
87
Q.6 . Is your work trip directly heading to the work place Yes No Q.7. If not, specfy the places where you go before you go to the office
Child’s School Office of husband/wife Your companion ffice Other…………………… Q.8. Time your usually arrive at office Q.9. Time you usually leave office Q.10. Is your return trip(office to home trip) directly heading to the Home? Yes No Q.11. If not, specfy the places where you go during your return trip ……………………… (Wife office,Companeon office etc) Q.12. Time you usually return home Q 13. Approximate distance between home and office ……………..kms. Q.14. If higher comfort and reliable public transport service (Premier Bus Service) is introduced, would you like to use such service instead of what you are using now? Yes No Q.15. How much you would be willing to pay for a comfortable personalized Premium Bus Service between residence and work place per trip. Rs……………….. Q.16. Do you have additional travel requirements (official trips etc.) during office hours?
Yes No Q.17. If yes what are the destinations……………………………….. (Banks, Head office, any other office etc)

88
Q.18.What is/are the mode/s that you use for these official trips? a) Bus b) Train c) Staff Transport (Van /Bus) (Own Cost) e) Office transport (Van/Bus) (Provided by the organization) f) Private own vehicle g) Official vehicle (car, Motor bicycle, etc.) (Provided by the organization) h) Other (Please specify) …………………………………

89
Appendix II: Survey Form of Variable Work Hours (NTC)
National Transport Commission – (Staff) The National Transport Commission intends to evaluate the advantages and disadvantages of flexible working hours. As such we decided to conduct a survey among the employees of the organizations presently implementing this system. Please fill this questionnaire and submit it to the relevant officer. Your cooperation in this national venture will be highly appreciated.
(Please tick in the relevant cage)
Male Female Occupation
Existing flexible time of the organization: Morning from ……..am to ……..am Evening from ……..pm to ……..pm
1) What are the modes of travel you usually use to come to office/work place?
a) Bus b) Train
c) Office transport (Van) d) Private vehicle (Car, Three Wheeler, Motor Cycle, Bicycle)
e) Official vehicle (Car, Van, Bus, Motor Cycle) f) Walk
2) When do you leave home to go to office/work place? (Please put the time in the relevant cage)
a) Before flexible time was introduced.
b) After flexible time was introduced
3) Is it possible to catch a bus, train, or van due to leaving home according to flexible hours
a) Yes b) No c) There is no difference

90
4) If your traveling (by bus, train or van) has been eased due to leaving home according to flexible time, what are the reasons for that? a) Less congestion on roads b) Can avoid crowded buses
c) There are trains at the required time d) Are there buses on time
e) Can match the time with the office transport
5) If your traveling has become difficult (by bus, train, or van) due to leaving home at flexible times, what are the reasons for that?
a) Severe road congestion b) Buses are too crowded
c) No trains at required times d) No buses at required times
e) Cannot match with the time of office transport
6) When do you leave the office after work?
a) Before introducing flexible time b) After introducing flexible time
7) `Is it possible to catch a bus, train or office van due to leaving office according to flexible time? a) Yes b) No c) There is no Change 8) How has the flexible time affected your traveling? Easy Difficult
a) Road congestion
b) Crowded buses
c) Trains available at required times
d) Buses available at required times
e) Office transport available at required times
9) Do you think that your day-to-day activities have been eased due to flexible time? a) Yes b) No c) No Change
p.m
p.m

91
10) What are the personal benefits you have gained due to flexible time? (Pl. mark all relevant features)
a) Tension reduced b) Easy to attend to children’s work c) Office work could be planned well d) Can attend to private matters as required e) Reduced cost on traveling (can use season tickets; can use normal buses rather than using luxury buses etc.)
11) Do you think that due to flexible time your official work has been eased? a) Yes b) No c) There is no change 12) Do you think that existing flexible time ranges are adequate to gain expected benefits? a) Yes b) No 13) If the answer for (12) is no, please propose suitable time Morning: Evening
14) In general what do you think about flexible time? a) very good d) not satisfactory b) good e) very unsatisfactory c) fair f) cannot say anything

92
National Transport Commission – (Department Heads) The following questions to be answered by Heads of Departments/Divisions/Units 1) Do you think that the efficiency of the members of your staff has been increased due to the flexible time? a) Yes b) No c) No Change 2) How do the following affect the efficiency of the staff members due to the implementation of flexible time? e) Reporting times of the staff members will help day-to-day activities of the organization a) Yes b) No c) Not Relevant f) Sign off time of the staff members will help day-to-day activities of the organization a) Yes b) No c) Not Relevant g) This has reduced the late attendance of the employees a) Yes b) No c) Not Relevant
h) It is now easy to plan the activities of the department/division/unit a) Yes b) No c) Not Relevant
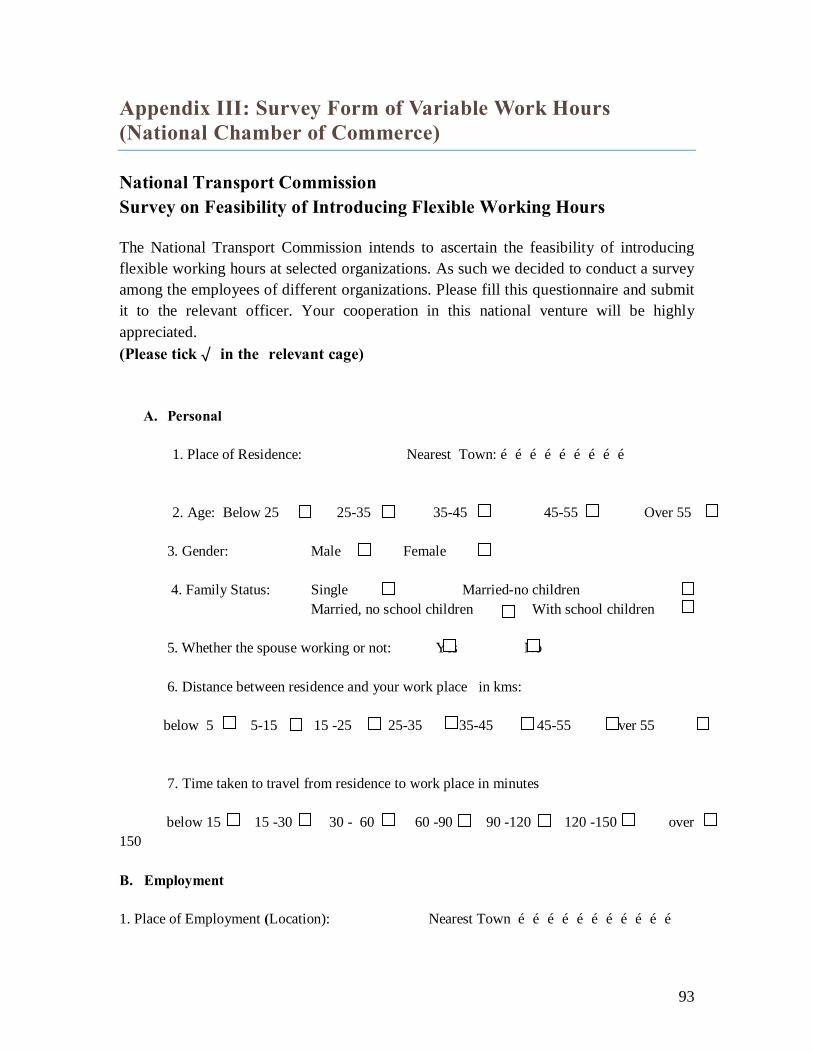
93
Appendix III: Survey Form of Variable Work Hours (National Chamber of Commerce)
National Transport Commission Survey on Feasibility of Introducing Flexible Working Hours The National Transport Commission intends to ascertain the feasibility of introducing flexible working hours at selected organizations. As such we decided to conduct a survey among the employees of different organizations. Please fill this questionnaire and submit it to the relevant officer. Your cooperation in this national venture will be highly appreciated. (Please tick √ in the relevant cage)
A. Personal
1. Place of Residence: Nearest Town: ………………………
2. Age: Below 25 25-35 35-45 45-55 Over 55
3. Gender: Male Female
4. Family Status: Single Married-no children Married, no school children With school children
5. Whether the spouse working or not: Yes No
6. Distance between residence and your work place in kms:
below 5 5-15 15 -25 25-35 35-45 45-55 Over 55
7. Time taken to travel from residence to work place in minutes
below 15 15 -30 30 - 60 60 -90 90 -120 120 -150 over 150
B. Employment 1. Place of Employment (Location): Nearest Town ……………………………
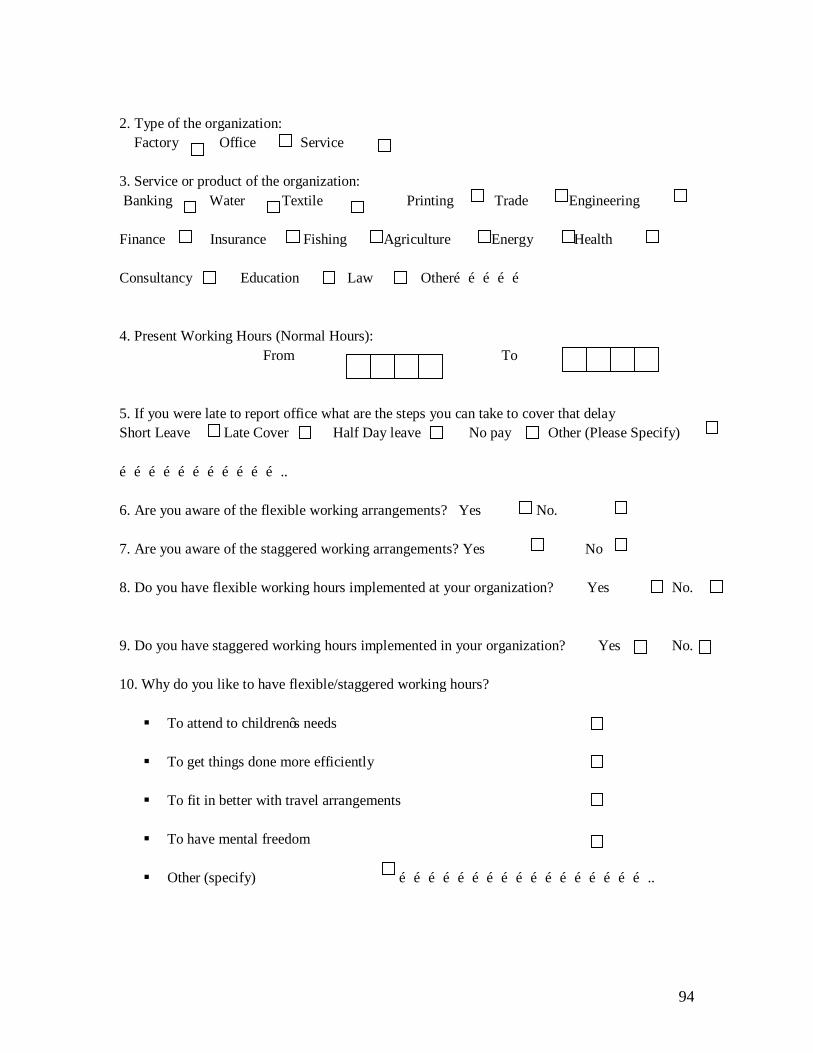
94
2. Type of the organization: Factory Office Service 3. Service or product of the organization: Banking Water Textile Printing Trade Engineering Finance Insurance Fishing Agriculture Energy Health Consultancy Education Law Other…………… 4. Present Working Hours (Normal Hours): From To 5. If you were late to report office what are the steps you can take to cover that delay Short Leave Late Cover Half Day leave No pay Other (Please Specify) …………………………….. 6. Are you aware of the flexible working arrangements? Yes No. 7. Are you aware of the staggered working arrangements? Yes No 8. Do you have flexible working hours implemented at your organization? Yes No. 9. Do you have staggered working hours implemented in your organization? Yes No. 10. Why do you like to have flexible/staggered working hours? § To attend to children’s needs § To get things done more efficiently § To fit in better with travel arrangements
§ To have mental freedom § Other (specify) ……………………………………………..

95
11. Why don’t you like to have flexible/staggered working hours? § Comfortable with present work arrangement § Job does not allow it/doesn’t suit to my job § Not fit in with travel arrangement § Other (specify) ………………………………………………
C. Transport to Work Place 1. What are the modes of travel you usually used to come to office/ work place? a) Bus b) Train c) Office transport d) Private vehicle (Car, Three wheeler, Motor Cycle) e) Other (Please specify) …………… 2. If transport provided officially, what is the mode? a) Bus arranged by office b) Cycle c) Shared Vehicle (Van, Double Cab etc) d) Motor bicycle e) car f) Other (Please Specify): …………………… 3. Do you accompany your children to school on your way to office? Yes No 4. At what time you leave home 5. At what time you arrive at office 6. At what time you leave office 7. At what time you reach home D. Opinion on Flexible Work Schedules 1. Do you think that present working hours are convenient to you? Yes No

96
2. If your answer is “No” what is the suggested flexible time duration? (the number of working hours should not be changed) Arrival (on) Departure (off) From To From To 3. Please specify the reasons why you like to have above mentioned times
• It helps me to avoid congested peak hours • It helps me to accompany kids to school • It helps me to do shopping in the afternoon • It helps me to attend to other family needs without taking leave • It helps me to share transport with my spouse/friends/colleagues • It matches with the transport schedules of the route I travel • I t allows me to avoid the congested/peak period in public transport • It gives me free time in the afternoon to spend with family • It helps me to manage family commitments easily
Definitions: Flexible Working Hours Employees work specified number of hours each day, but are given flexibility in arrival and departure times. Staggered Working Hour Employees arrive and depart work at different times in shifts

97
Appendix IV: Progress Reports
Monthly Progress of Greater Colombo Traffic Management Research This Progress report is forwarded on above research work for the duration of one month from 15th December 2007 to 15th January 2008. Followings are the primary work conducted in connection to the research work for the above month, 1. Studying the vehicular flow characteristic of the Greater Colombo Area.
Approach Methodology followed
1. Collection of Data and Maps relevant - 2. Quantifying the flow entering to the City Ø Analyzing the MCC at Colombo city
entry points 3. Determining the Type of Trip ends of different types trip categories producing at city entry points
Ø Producing Origin- Destination tables for
• Home based Work trips • Home based other trips • Non-Home based trips Under different vehicle categories of Motor Cycles, Three Wheelers, Cars/Saloon, Utility
4. Determining the Trip Attraction and Generation zones for the Colombo City commuters
Ø Identifying the zones of origin and the destination of city commuters who are entering to the city and circulating within the city
Ø Developing a graphical representation of above findings
5. Determining the share of modes used for above trips and Share of above trips for each vehicle category (Car, Utility, Motor Cycle, Three Wheelers)
Ø Analyzing trip types produced by each vehicle category and vise versa
6. Studying the variation of above trips in different time frame of a working day
Ø Analyzing the 15 minute samples of vehicle flow entering to the city during 6.00 to 18.00hrs.
7. Simulation of flexible working hour impact on peak period traffic
Ø Comparing the status of vehicular Flow vs Time under two scenarios of • Without a flexible working hour • With a flexible working hour
Results of these finding are included in the presentation attached herewith 2. Presenting above findings to Traffic Committee meeting at the Chairman Office of National Transport Commission on 11th January 2005. Copy of the presentation is attached herewith.
98
Monthly Progress of Greater Colombo Traffic Management Research This Progress report is forwarded on above research work for the duration of one month from 15th January 2008 to 15th February 2008. Followings are the primary work conducted in connection to the research work for the above month, 1. Studying the public transport passenger flow within the Greater Colombo Area.
Approach Methodology followed
1. Quantifying the bus passenger entry and exit of the city at each entry point
Ø Analyzing the Bus Volume Survey data at Colombo city entry points
2. Determining the bus passenger share for each route at the city entry and exit for the above locations
Ø Calculating the passengers using each route at the city limits and comparing with total passenger entry and exit for the particular location
3. Mapping of Bus Routes in Colombo City Ø Categorizing all the bus routes
considering their trip ends Ø Develop an AutoCad map for above
route categories(partly completed) 2. Studying the goods vehicles travel pattern in Greater Colombo Area.
Approach Methodology followed
1. Quantifying the goods vehicles entering to the City in major accessing corridors
Ø Analyzing the MCC at Colombo city entry points
2. Determining the trip ends for goods vehicles at each city entry points
Ø Producing Origin- Destination tables for
• Light, Medium & Heavy Goods Vehicles
• Multi-Axel Goods Vehicles 3. Determining the trip attraction and generation zones for the goods vehicles entering to Colombo City
Ø Identifying the zones of origin and the destination of goods vehicles entering to the city
Ø Developing a graphical representation of above findings
2. Presenting Existing Traffic Pattern and Proposed Strategic Action Plan for Traffic Management in Greater Colombo Area for the members of National Chamber of Commerce at the NCCSL board room on 25th January 2008. Additionally presentation highlighted the importance of Variable Work Hours in reducing peak period traffic.

99
Monthly Progress of Greater Colombo Traffic Management Research This Progress report is forwarded on above research work for the duration of one month from 15th February 2008 to 15th March 2008. Followings are the primary work conducted in connection to the research work for the above month, 1. Analyzing viable Mass Rapid Transit option between Dematagoda and Battaramulla
Step 1 Estimation of existing passenger demand for the proposed BRT corridor
Other steps of this analysis will be continued in next month 2. Producing a bus route map for the Greater Colombo Area.
Approach Methodology followed
1. Identification of operating corridors of the routes
Ø liaise with Western Provincial Transport Authority officials
2. Producing a regional route map for the Colombo City
Ø Selecting routes which are having both ends in Colombo District while one end in CMC
Ø Drawing those routes on an Autocad based Colombo City map
Be Continued in next month. Work done so far is attached herewith 3. Discussions
• Discussed with Police for setting up a specific bus lane for inter-province intercity buses traveling on southern corridor
Approach Methodology followed
1. Quantifying the probable bus passenger diversion for proposed BRT corridor
Ø Analyzing the entry and exit Bus Volume Survey data at Borella
2. Quantifying the probable private vehicle user diversion for proposed BRT corridor
Ø Analyzing Origin-Destination Survey results at Dematagoda, Kolonnawa and Borella
3. Quantifying total passenger demand for proposed BRT trace between Battaramulla and Dematagoda
Ø Reasonable assumptions are made in quantifying the demand
Be Continued with finer adjustment in next month

100
Monthly Progress of Greater Colombo Traffic Management Research This Progress report is forwarded on above research work for the duration of one month from 15th March 2008 to 15th April 2008. Followings are the primary work conducted in connection to the research work for the above month, 2. Assessing Flexible Work Hour program implemented in National Transport Commission.
This assessment is basically concern about following issues a. Level of convenience in traveling b. Level convenience in personal affairs c. Level of convenience in official affairs and d. Overall view and impact of Flexible Work Hour program
Summary of the analysis is attached herewith
3. Finalizing the maps of bus routes in the Greater Colombo Area. Maps are produced under following categories
a. Colombo regional buses serving CMC b. Western provincial(except Colombo regional) buses serving CMC c. Inter-provincial buses serving CMC
Sample map of Colombo regional buses serving CMC is attached herewith. (Original size of the map is A1) 4. Preparation of drawings and relevant documents for the proposed alterations of bus routes
120 (Pettah- Kesbewa), 187 (Pettah-Katunayaka), 138 (Kiribathgoda-Pettah & Pettah- Kottawa), 104 (Bambalapitiya- Wattala), 178 (Narahenpita-Mattakkuliya)

101
Monthly Progress of Greater Colombo Traffic Management Research This Progress report is forwarded on above research work for the duration of one month from 15th April 2008 to 15th May 2008. Followings are the primary work conducted in connection to the research work for the above month, 5. Analyzing the responses of survey carried out among targeted work group in private sector
for investigating their interest on Premier Service which is going to introduce recently. Summary of following results are attached herewith.
a. Frequency of service willing passenger distribution(According to trip length) b. Frequency of service willing passenger distribution(According to present mode
used) c. Passenger expected travel cost/km for a premium service d. Premium service willingness of Additional Trip Makers
6. Producing a report under the title of, “Guidelines for the Implementation of Variable Work
Hours Program in Sri Lanka”. This report mainly discuss following issues a. Introducing three different types of Variable Work Hour programs which are
suited for the Sri Lanka(Flex-Hours, Compressed Work Week and Staggered Work Hours)
b. Present work schedules impact on passenger transportation in Sri Lanka c. Expected Variable Work Hour Programs’ impact on passenger transportation in
Sri Lanka d. Administrative considerations for different types of programs e. Criteria for executing Variable Work Program in Sri Lanka

102
Monthly Progress of Greater Colombo Traffic Management Research This Progress report is forwarded on above research work for the duration of one month from 15th May 2008 to 15th June 2008. Followings are the primary work conducted in connection to the research work for the above month,
1. Preparation of the route maps for the proposed premium services of Nawam Mw.-Kadawata, Nawam Mw.-Thlangama, Nawam Mw.-Katubedda, Nawam-Wattala and Nawam Mw.-Werahera
2. Preparation of drawings for proposed Traffic Management Plan for Bambalapitiya and Kollupitiya.
3. Analysis of variable work Hour surveys conducted for National Chamber of Commerce
and Ceylon Electricity Board.
4. Analysis of passenger opinions in connection to the extension of 141 route from Narahenpita to Dematagoda.
Outputs of above analysis are attached

103
Monthly Progress of Greater Colombo Traffic Management Research This Progress report is forwarded on above research work for the duration of one month from 15th June 2008 to 15th July 2008. Followings are the primary work conducted in connection to the research work for the above month,
1. Analyzing the data in Boarding & Alighting survey conducted for the preparation of new time table for the Mt.Lavinia- Kottawa (255) route.(results are attached)
2. Analysis of transport sector fuel consumption for the year 2007
Analysis is done based on the vehicle fleet statistics presented in Central Bank report and a program developed for forecasting fuel consumption by of University of Moratuwa.
3. Analyzing contribution of proposed new projects for the fuel conservation Contribution of premium service, bus rapid transit options, Car and van pooling, park and rides and variable work hours are considered.( report on analysis is attached)

104
Monthly Progress of Greater Colombo Traffic Management Research This Progress report is forwarded on above research work for the duration of one month from 15th July 2008 to 15th August 2008. Followings are the primary work conducted in connection to the research work for the above month,
7. Study on Bus Flow in Pettah area Study covers following aspects
• Identification of paths or circuits of bus route within the city limits( 19 circuits were identified)
• Identification of major boarding and alighting stops or terminals for each circuit. • Analyzing the frequencies for each circuits(inbound & outbound) • Identification of overflow parking slots in the vicinity of Pettah and Fort.
Relavant maps and graphs were prepared for showing the afore-mentioned 8. Final report preparation Final report was prepared including all the items addressed for the research during the period of month.

105
Appendix V: Fort & Pettah Bus Circulation

106
Appendix VI: Bus Services Serving Colombo