green-oriented crowdfunding campaigns: their
TRANSCRIPT
1
Green-oriented Crowdfunding Campaigns:
Their Characteristics and Diffusion in Different Institutional Settings
Abstract: In this paper, we investigate how the institutional setting affects the diffusion of green crowdfunding campaigns across countries. To this aim, we develop and test two competing hypotheses about the association between country environmental sustainability orientation and the diffusion of green campaigns. To identify green campaigns, we develop an original machine-learning algorithm. We apply this algorithm to the population of 48,598 campaigns presented on Kickstarter between July 1, 2009 and July 1, 2012. By means of econometric estimates, we show that green campaigns differ from others along several dimensions and are more diffused in countries with a limited environmental sustainability orientation. Implications for research, practice, and policy are discussed.
Keywords: Crowdfunding, green, environmental performance index, institutional settings, classifier, random forest
2
1. INTRODUCTION
An increasing body of research has shown that green entrepreneurial initiatives, defined as
initiatives that have an environmental mission as their primal goal (Thompson, Kiefer, and York,
2011; Ortas, Burritt, and Moneva, 2013), face significant challenges in accessing financial
resources (Ridley-Duff, 2009; Fedele and Miniaci 2010; Ghosh and Nanda, 2010; Lehner, 2013;
Petkova, Wadhwa, Yao, and Jain, 2014; Gaddy, Sivaram, Jones, and Wayman, 2017). In this
scenario, crowdfunding animated the academic debate as a new, distinct avenue for green
entrepreneurial initiatives to obtain financial resources. Scholars in this field have shown that
different from other entrepreneurial financial actors, backers of a crowdfunding campaign are not
necessarily moved by profit motivations alone and select ideas based on their desire to help
others and to support causes they care for (Gerber and Hui, 2013; Belleflamme, Lambert, and
Schwienbacher 2014). Moving from these arguments, a number of prior studies has investigated
the relation between green initiatives and crowdfunding, focusing on the likelihood of success of
crowdfunding campaigns with an environmental focus (e.g., Bartenberger and Leitner, 2013;
Bonzanini, Giudici, Patrucco, 2015; Hörisch, 2015; Candelise, 2016; Lam and Law, 2016; Calic and
Mosakowski, 2016). Comparatively, little attention has been given to the likelihood of launching
green initiatives on crowdfunding platforms and to the contextual factors that might affect this
tendency (one notable exception is the work by Cumming, Leboeuf, and Schwienbacher, 2017).
The aim of this study is to contribute to filling this gap.
For this purpose, we take inspiration from the view that the institutional setting
contributes to inform the behavior of individuals and notably of entrepreneurs (Bruton, Ahlstrom
and Han-Lin, 2010). Particularly, we consider the environmental sustainability orientation of the
institutional settings in a given country. We define the environmental sustainability orientation as
the presence of formal (i.e., policy and regulation) and informal (i.e., norms, values, beliefs and
3
practices) institutions1, that are concerned not only with the current level of economic and non-
economic well-being but also with its sustainability over time i.e. the ability to pass natural,
physical, human, and social resources to future generations (Stiglitz, Sen and Fitoussi, 2010). We
argue that the environmental sustainability orientation of the institutional settings influences both
entrepreneurs’ willingness to launch a green-oriented entrepreneurial initiative and their
inclination to use crowdfunding to finance such initiatives. In countries where the institutional
setting has a stronger environmental sustainability orientation, one may expect that there are
more green-related business opportunities. Moreover, as green initiatives are more legitimized,
entrepreneurs may be more inclined to resort to crowdfunding to finance their green initiatives as
they anticipate a greater likelihood of success of their campaigns. However, in these countries,
entrepreneurs may also find it easier to finance their green initiatives through traditional
channels. The ease of traditional channels may have a direct negative effect on their inclination to
use crowdfunding. Moreover, because of adverse selection, green crowdfunding campaigns may
be perceived by potential backers as having low quality, which makes entrepreneurs even more
reluctant to finance their green initiatives through crowdfunding. Considering that opposed forces
are at work, it is difficult to argue a priori whether countries’ environmental sustainability
orientation of the institutions is positively or negatively associated with the diffusion of green-
oriented crowdfunding campaigns launched in those countries. In this paper, we investigate the
relative explanatory power of these competing hypotheses.
Answering this research question raises a serious methodological problem: identifying
green-oriented campaigns. Often prior studies have accomplished this task by either focusing on a
limited number of campaigns and providing a subjective evaluation of their green orientation
1 Informal institutions refer to “socially shared rules, usually unwritten, that are created, communicated, and enforced outside officially sanctioned channels” (Helmke and Levitsky, 2006: 5), while formal institutions are “rules and procedures that are created, communicated, and enforced through channels widely accepted as official” (Helmke and Levitsky, 2004: 727).
4
(Calic and Mosakowxki, 2016) or using the classification of green campaigns provided on
crowdfunding platforms (e.g., Hörisch, 2015). These strategies have important drawbacks. The
subjective evaluation of green campaign based on the textual description of the project has the
advantage of being very precise (Kononenko and Bratko, 1991), particularly if made by a sufficient
number of researchers, as in the case of Calic and Mosakowski (2016). However, this approach is
only applicable to a limited sample of campaigns, due to the considerable time required to
perform the evaluation. At the same time, using the classification of green campaigns provided on
the platform has the clear advantage of relying on an easy to access and publicly available
classification of green campaigns. However, it entails the risk of overlooking an important share of
green-oriented campaigns. Consider, for instance, a movie made with environmental sustainable
techniques or a piece of art created with the intent of warning people about an environmental
threat. It is hard to argue that these initiatives are not green, but it is hard as well to argue that
these campaigns are labeled green by the platforms, considering that platforms typically provide a
single label to a campaign (see e.g., Mollick, 2014). An interesting step forward is the approach by
Cummings et al. (2017). They implemented a computer-based text analysis technique aimed at
searching for a predefined set of related keywords in the project description. In this paper, we
considerably improve this methodology by employing a robust machine-learning algorithm to
create a classifier of green-oriented campaigns, based on the project descriptions posted on the
crowdfunding platform. Compared to the keywords-based algorithm implemented in (Cumming et
al., 2017), the machine-learning approach offers a great advantage. Indeed, the set of most
informative keywords used to discriminate between green and non-green campaigns is
automatically extracted from a training corpus of labeled descriptions of crowdfunding projects.
Therefore, keywords are not selected in advance, but they are learnt from the specific textual
domain.

5
We apply the machine-learning algorithm to the population of 48,598 crowdfunding
campaigns launched on Kickstarter in the period between July 1, 2009 and July 1, 2012, of which
5,000 campaigns are used as the training corpus. We found that approximately 9.5% of all the
campaigns presented on Kickstarter were identified as green initiatives. By means of a set of
econometric estimates, we found that these campaigns significantly differ from the others along
several dimensions. Specifically, we found that green crowdfunding campaigns have a larger
capital goal, provide more information (both visual and verbal), are launched by creators with
significantly larger amounts of social capital developed within the crowdfunding platform
(Colombo et al., 2015), and lower levels of external social capital (Mollick, 2014). More
importantly, we show that green campaigns are proportionally more common in countries
presenting a lower environmental sustainability orientation.
The paper is organized as follows. Section 2 discusses the theoretical background and
develops hypotheses. In section 3, we present data, methodology and descriptive statistics. Next,
we present the main results. The last section concludes the paper and discusses the implications
for practice, policy, and future research.
2. CONCEPTUAL BACKGROUND AND HYPOTHESES
Similar to other forms of entrepreneurial activity, green-oriented ventures require
significant initial investments. However, raising external finance has proven even more difficult for
green ventures than for other ventures (Agrawal, Catalini, Goldfarb, 2010; Fedele and Miniaci
2010; Ridley-Duff 2008). These difficulties arise from a combination of greater information
asymmetries (Ghosh and Nanda, 2010; Petkova et al., 2014), more uncertain returns due to higher
policy risk (Foxon and Pearson, 2008; Bürer and Wüstenhagen, 2009), and longer payback periods
(Hargadon and Kenney, 2012; Gaddy et al., 2017). In this regard, crowdfunding has gradually

6
emerged as a potential alternative means for green entrepreneurial initiatives to acquire financial
resources.
The authors engaged in this line of research have focused their attention mostly on the
behavior of potential backers of crowdfunding projects and relatedly on the success of green
crowdfunding campaigns. Specifically, they have moved from the observation that, particularly in
reward-based crowdfunding, backers’ motivations shift from monetary returns to values and
beliefs that are supportive of nature preservation and societal benefits (Belleflamme, Lambert and
Schwienbacher, 2014). This literature has already provided interesting, albeit not conclusive,
evidence in relation to whether green entrepreneurial initiatives present higher or lower
fundraising capability. This literature has also identified several potential drivers of the success of
green campaigns, including quality, creativity and legitimacy of the project (Bonzanini et al., 2015;
Hörisch, 2015; Candelise, 2016; Vasileiadou et al., 2016; Lam and Law, 2016; Calic and
Mosakowski, 2016).
In contrast, the issue regarding the diffusion of green initiatives on crowdfunding platforms
has been explored less, leaving open the question of what are the factors that explain the
presence of green entrepreneurial initiatives on crowdfunding platforms. To our knowledge, the
only contribution on this issue is Cumming et al.’s (2017) work on clean-tech campaigns. They
hypothesize that the levels of diffusion of clean-tech crowdfunding campaigns across countries
reflect countries’ informal institutional characteristics. Accordingly, clean-tech initiatives should be
more common in countries with specific cultural characteristics, such as long-term orientation
(i.e., care about future generations) and low individualism (i.e., propensity to accept that others
will benefit from positive externalities, without paying). The latter characteristics are indeed found
to be significantly associated with the probability of observing a clean-tech campaign on the
Indiegogo crowdfunding platform.

7
We build on this argument by observing that the characteristics of both formal and
informal institutions at country-level affect individuals and organizations (Crossland and Hambrick,
2011) as well as entrepreneurs (Williams and Vorley, 2015). Accordingly, we expect the diffusion
of green crowdfunding initiatives in a country to reflect the environmental sustainability
orientation of its formal and informal institutions. In particular, the environmental sustainability
orientation of institutions influences entrepreneurial behavior in two different ways. Namely, the
environmental sustainability orientation influences both the willingness to launch a green-
oriented entrepreneurial initiative and the decision to use crowdfunding to finance such initiative.
First, in countries characterized by a strong environmental sustainability orientation of
institutions, there generally are more business opportunities for developing green technologies,
products and services, as internal market demand is likely to be greater. Indeed, consumers have a
more positive attitude toward green purchases, and their positive inclination is magnified by the
existence of generous public subsidies.2 Moreover, in these countries, entrepreneurs interested in
launching green initiatives are more legitimate (Aldrich and Fiol, 1994). Legitimacy is defined here
as the congruency between the values, norms and expectations of a society and the activity and
outcome of an organization (Dowling and Pfeffer, 1975). As it has been widely discussed by the
literature (Dowling and Pfeffer, 1975; Oliver, 1991; Lounsbury and Glynn, 2001; Zimmerman and
Zeit, 2002; Zott and Hui, 2007), legitimacy enables entrepreneurs to obtain easier access to
external resources (such as financial and human capital). Accordingly, in these countries green
entrepreneurs, being more legitimate, will have relatively easier access to the resources needed to
survive and grow (Zimmerman and Zeit, 2002), both in early and later stages of a firm’s
development (Navis and Glynn, 2010). Based on these arguments, one would expect that a
2 See, e.g., the tax exemptions as well as various driving privileges (like such as the use of bus lanes, exemption from parking fees in city centrers, and battery charging at zero cost) of environmental policies in Norway.
8
relatively higher share of entrepreneurs should launch green initiatives in countries where
institutions have a strong sustainability orientation.
Moreover, operating in an institutional setting that makes green initiatives more legitimate
may also influence entrepreneurs’ decision to use crowdfunding to obtain the finance needed for
their green projects. First, given that green-oriented initiatives are more diffused in legitimized
contexts (Aldrich and Fiol, 1994), information asymmetries around these initiatives are
comparatively lower (Pollock and Rindova, 2003). Hence, a greater number of backers would likely
finance the campaign if entrepreneurs decided to collect money through crowdfunding (Ahlers et
al., 2015). Second, when entrepreneurs of green initiates are legitimized to operate in the market,
they are more likely to find local backers whose motivations are aligned with theirs (Calic and
Mosakowski, 2016). As highlighted by prior literature, being able to attract local backers is a key
determinant for the success of a crowdfunding campaign (Agrawal et al., 2014; Giudici, Guerini,
Rossi-Lamastra, 2017). Thus, entrepreneurs launching green initiatives may anticipate a relatively
higher probability of successfully collecting money through a crowdfunding campaign when
operating in countries characterized by institutions with a strong environmental sustainability
orientation. These two arguments support the view that entrepreneurs interested in running
green initiatives may increasingly use crowdfunding to finance their projects when located in
countries characterized by a strong environmental sustainability orientation.
In sum, we expect that in these countries, there are more green initiatives, and
entrepreneurs launching these initiatives are more inclined to use crowdfunding. Thus, we derive
our first hypothesis:
H1. The probability of presenting a green campaign is higher in countries where institutions
have a strong sustainability orientation.
9
However, there are also reasons to expect that in countries where institutions have a
strong sustainability orientation, a relatively lower share of entrepreneurs of green initiatives use
crowdfunding. First, given that in these countries green entrepreneurs are more legitimized to
operate in the market, they find it easier to access other sources of funding, such as direct
governmental subsidies3 (Harmon and Cowan, 2009), as well as specialized banks, credit
institutions, and venture capital funds dedicated to support green entrepreneurial ventures
(Hörisch, 2015). In this context, a higher availability of traditional sources of capital lowers the
need for alternative sources of capital, including crowdfunding (Mollick and Nanda, 2015). Second,
because of the easier access of green entrepreneurial initiatives to traditional providers of finance
(Pollock and Rindova, 2003), potential backers of crowdfunding campaigns may perceive that only
green initiatives of relatively lower quality will be present on crowdfunding platforms (Hildebrand
et al., 2017). Accordingly, because of this adverse selection, they will be reluctant to finance green
campaigns. Anticipating such an outcome, entrepreneurs would then abstain from using
crowdfunding when seeking external finance for their green initiatives. These arguments lead us
to our second hypothesis:
H2. The probability of presenting a green campaign is lower in countries where institutions
have a strong sustainability orientation.
In sum, the formulation of two contrasting hypotheses leaves it to the empirical analysis to
test whether the relationship between the probability to find a green entrepreneurial initiative on
a crowdfunding platform and the environmental sustainability orientation of the institutions of the
country where the initiative is proposed.
3 For instance, the presence of incentives, in the form of an environmental policy (e.g., carbon policy) or of a technology policy (e.g., renewable energy policy) has been shown to be crucial in the adoption of green technologies (Kerr and Newell 2003 and Popp et al., 2011, among others).
10
3. METHODOLOGY
3.1 The context of the study
For this study, we develop an original dataset including all the projects presented on
Kickstarter from July 1, 2009 to July 1, 2012. Kickstarter is among the largest crowdfunding providers
worldwide (Colombo, Franzoni and Rossi-Lamastra, 2015), and data coming from this platform have
been used in several prior studies (e.g., Pitschner and Pitschner, 2014; Mollick, 2014; Colombo et
al., 2015; Butticè, Colombo, and Wright, 2017; Courtney Dutta, and Li, 2017).
Kickstarter is a reward-based crowdfunding platform. In other words, Kickstarter does not
allow entrepreneurs to offer financial rewards, neither in the form of equity shares nor as an interest
rate, in exchange to backers’ support. By contrast, the platform advises creators to offer products,
services and gadgets. Some rewards, associated with small contributions, are typically symbolic
(e.g., “a thankful message from the creator”). Others comprise the offer of a gadget, such as a T-
shirt or a key ring with the project logo. Finally, some rewards involve the pre-purchase of the
product or service, and occasionally the participation in the co-creation of the product. On
Kickstarter, entrepreneurs can cash in the money only if the capital pledged at the closure of the
campaign is greater than the funding goal (these are called on the platform “successful campaigns”).
However, there is no upper limit to the amount of money an entrepreneur can collect during a
campaign. Thus, campaigns may raise more than 100% of the amount requested.
Kickstarter has the declared mission to bring creative project to life; thus, it is no surprise
that many projects posted on the platforms are related to visual art (Boeuf, Darveau, Legoux 2014).
However, as we will show in the descriptive statistic section, there is also a significant number of
projects related to technology and product design. Overall the platform hosts projects coming from
13 different industries (called in Kickstarter, categories). These industries include art, comics, crafts,
11
dance, design, fashion, film, food, games, journalism, music, photo, publishing, technology, and
theater.
3.2. Dependent variable: Classifying green campaigns
To test the hypotheses presented in section 2 we resort to econometric estimates where
the dependent variable is a dummy, indicating whether a crowdfunding campaign relates with a
green entrepreneurial initiative or not. Accordingly, our first methodological concern is the design
of a robust procedure to identify green vs. non-green campaigns.
Over the years, scholars have used several approaches to identify green crowdfunding
campaigns. In some cases, they have relied on human-based subjective evaluations of the green-
orientation of crowdfunding campaigns (e.g., Calic and Mosakowxki, 2016); in other cases, they
have used the classification of green campaigns provided on the crowdfunding platforms (e.g.,
Hörisch, 2015). Unfortunately, these research designs appear to be ineffective for our purposes
for different reasons. Using a subjective evaluation of green campaigns based on the textual
description of the projects is a very precise classification method (Kononenko and Bratko, 1991),
which unfortunately can be used only when dealing with a limited sample of campaigns, due to
the considerable time required to perform the evaluation. At the same time, using the platform
classification of green campaigns entails the risk of overlooking a large number of green-oriented
campaigns, considering that platforms typically provide a single label for each campaign (see, e.g.,
Mollick, 2014). Recently, Cummings et al. (2017) implemented a text analysis technique aimed at
searching, in the project description, a predefined set of pertinent keywords. This approach is
easily scalable to large datasets; however, it potentially introduces a bias in the classification
because of the use of a dictionary of keywords arbitrarily defined by the authors. In this paper, we
build on Cumming and colleagues (2017) and make an important step forward. In accordance with
12
their approach, we analyze campaigns’ textual description to create a dummy variable (green) that
is used to discriminate between green and non-green campaigns. However, unlike previous
studies, we resort to a machine-learning algorithm to define automatically the dictionary of
keywords used to discriminate between green and non-green campaigns. Automatically extracting
the keywords from the corpus of projects’ descriptions rather than relying on a predetermined list
of keywords has the advantage of reducing the risk of introducing biases in the creation of the
variable, considering that it is much easier for an analyst to characterize a concept extensionally,
i.e., to select instances of it, rather than intentionally, i.e., to describe the concept in words, or to
describe a procedure for recognizing its instances (Sebastiani, 2002).
Specifically, we resorted to text classification, that is the process of automatically assigning
documents to one or more predefined categories based on their content (Yang, 1999). Text
classification can be naturally modeled as a supervised learning task in which a decision function is
first derived by applying a machine-learning method on a set of labeled documents (training set)
and then is applied to predict the category of incoming texts whose class is unknown. To this aim,
a suitable representation must be designed to convert textual data into numeric vectors. A widely
used approach is the bag-of-words model (Sebastiani, 2002) in which a document is regarded as a
collection of terms that represent the explanatory variables (or predictors), and a numeric vector
is created containing the frequency of each term in the document.
The general framework for projects classification adopted in this study is depicted in Figure
1. In the first phase, a training corpus of labeled documents was created by randomly selecting a
subset of campaigns from the entire sample of projects and manually tagging their descriptions as
“green” or “non-green”. In so doing, we referred to the definition provided by Lehner (2013, p.2),
which defined as green those initiative “that have an environmental mission as their primal goal”.
Manual tagging has been made on a set of 5,000 documents by two research assistants separately.

13
When differences in the tagging arose (less than 5% of the cases), one of the authors classified the
document and then discussed the tagging with the research assistants until agreement was
reached. The output of this initial phase was a set of 5,000 manually tagged texts. Each labeled
text was then transformed using traditional natural language processing (NLP) filters, explained in
Appendix 1 and was converted into a numeric vector as described above. A machine-learning
algorithm was finally trained to determine the optimal classification function, which was
subsequently used to predict the class of the remaining projects in the sample.
Figure 1. Projects classification framework
A variety of machine learning techniques have been effectively applied to text
categorization; among these, the Random Forest algorithm (Breiman, 2001) attracted our interest
due to its accuracy, efficiency, scalability and robustness. Random forest has shown great
14
potential in several domains, ranging from risk assessment in social lending (Malekipirbazari and
Aksakalli, 2015) to bank failure predictions (Barboza et. al, 2017) and optimal investor portfolios
estimation (Laborda and Laborda, 2017). In addition to the predictive ability, however, two other
core features fostered its use in the present study. On the one hand, unlike other machine-
learning algorithms, it requires little effort for tuning its parameters, as illustrated in Appendix 1.
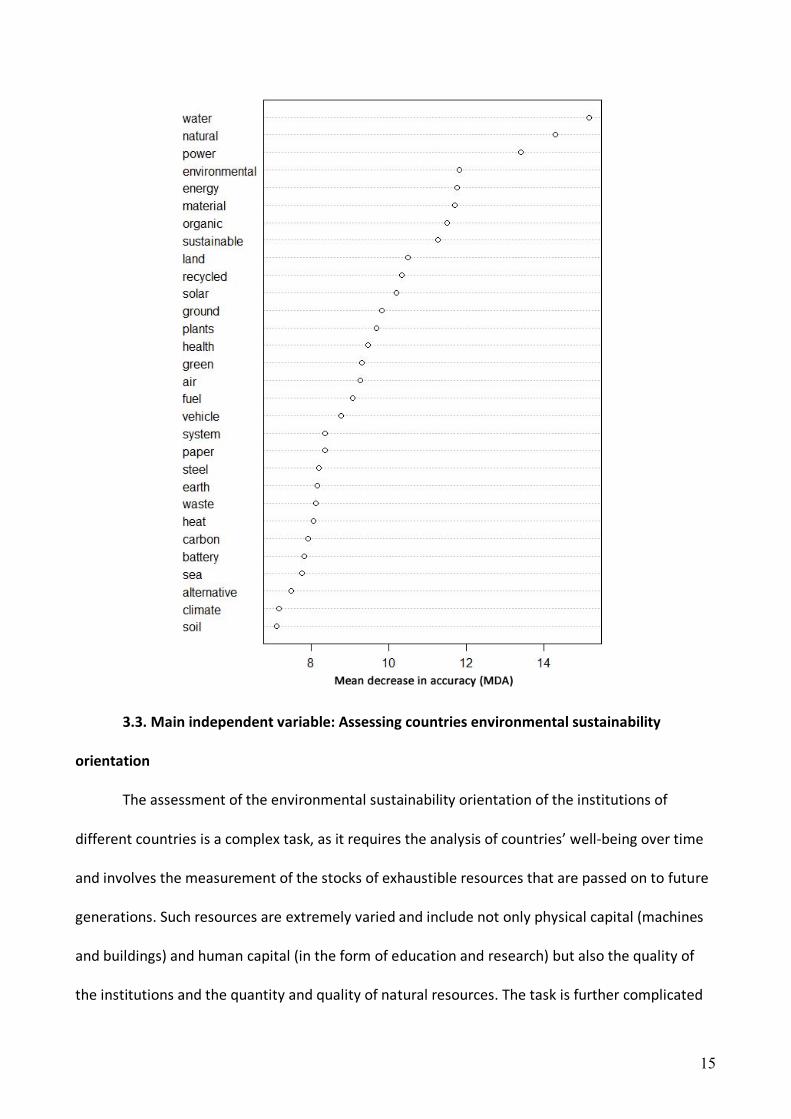
On the other hand, it generates internal estimates of variable importance, such as the mean
decrease in accuracy (MDA), which measures the impact of the predictors individually and in
multivariate interactions. Indeed, in our study, useful insights were achieved by analyzing the
words that, among others, contributed most to the accurate discrimination between green and
non-green campaigns. Not surprisingly, terms such as “water”, “natural”, “environmental” and
“sustainable” emerged as the most influential according to the best classification model. The list of
the 30 most relevant words used in the learning process is provided in Figure 2.
Figure 2. Most relevant terms for projects classification
15
3.3. Main independent variable: Assessing countries environmental sustainability
orientation
The assessment of the environmental sustainability orientation of the institutions of
different countries is a complex task, as it requires the analysis of countries’ well-being over time
and involves the measurement of the stocks of exhaustible resources that are passed on to future
generations. Such resources are extremely varied and include not only physical capital (machines
and buildings) and human capital (in the form of education and research) but also the quality of
the institutions and the quantity and quality of natural resources. The task is further complicated
16
by the interactions that exist between the socio-economic and environmental models followed by
different countries (Stiglitz et al., 2010).
Current approaches can be divided into several categories: large dashboards, composite
indices, indices that comprise correcting GDP in different ways, and indices that measure
overconsumption of current resources (Stiglitz et al., 2010). Among these different approaches,
capturing sustainability with a single index has the undeniable advantage to facilitate our
understanding and communication of economic phenomena and to enable better informed policy
decisions. In fact, although often criticized for the arbitrary character of the procedures used to
weight their various components, composite indices are today quite commonly used in a variety of
management and policy domains (de Sherbinin et al., 2013).
As for our choice of a composite measurement of sustainability, the Environmental
Performance Index (EPI) seemed particularly well-suited for the current work. It is a publicly
available index used in several previous studies. More importantly, as highlighted by Thomakos
and Alexopoulos (2016), the EPI reflects the aggregate result from the implementation of
measures and policies on a wide range of different environmental issues, and it covers changes
related to the social, technological and economic spheres. As such, it represents a highly desirable
choice to measure the environmental sustainability orientation of a country’s formal and informal
institutions.
Specifically, the EPI covers 180 countries and comprises more than 20 indicators reflecting
national-level data (for instance, trend in carbon intensity or access to drinking water). These
indicators can be composed to provide scores on nine key environmental aspects (for instance, air
or water resources quality). In turn, those nine scores can be further aggregated into two
composite indices measuring a country relative performance with respect to two main
sustainability goals: protection of human health and protection of the ecosystem. Finally, these
17
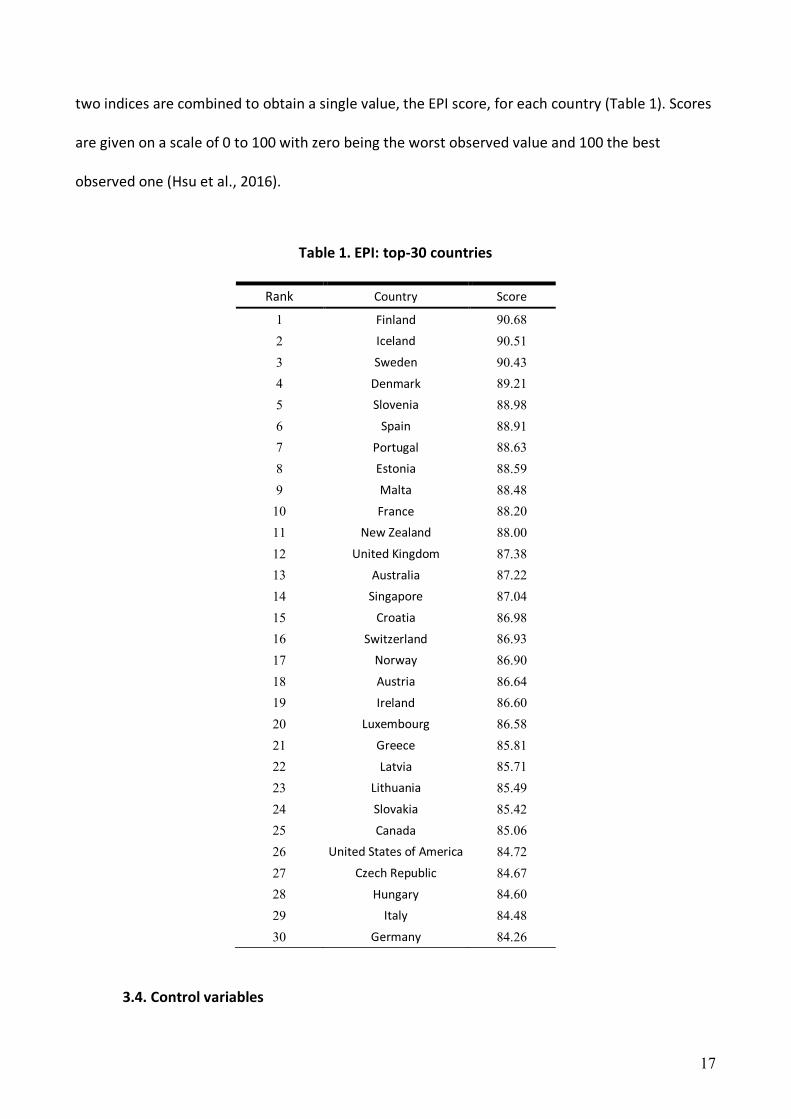
two indices are combined to obtain a single value, the EPI score, for each country (Table 1). Scores
are given on a scale of 0 to 100 with zero being the worst observed value and 100 the best
observed one (Hsu et al., 2016).
Table 1. EPI: top-30 countries
Rank Country Score
1 Finland 90.68 2 Iceland 90.51 3 Sweden 90.43 4 Denmark 89.21 5 Slovenia 88.98 6 Spain 88.91 7 Portugal 88.63 8 Estonia 88.59 9 Malta 88.48
10 France 88.20 11 New Zealand 88.00 12 United Kingdom 87.38 13 Australia 87.22 14 Singapore 87.04 15 Croatia 86.98 16 Switzerland 86.93 17 Norway 86.90 18 Austria 86.64 19 Ireland 86.60 20 Luxembourg 86.58 21 Greece 85.81 22 Latvia 85.71 23 Lithuania 85.49 24 Slovakia 85.42 25 Canada 85.06 26 United States of America 84.72 27 Czech Republic 84.67 28 Hungary 84.60 29 Italy 84.48 30 Germany 84.26
3.4. Control variables
18
Several pieces of information have been collected from Kickstarter and included as control
variables in our econometric models. This information regards the crowdfunding campaign, its
creator, and the country of reference.
As for the crowdfunding campaign, we kept track of its duration (campaign_duration) and
of its target capital (target_capital, in US$). Specifically, the logarithm of the target_capital was used
in the econometric specification, due to the high skewness of its distribution. Moreover, we
collected information about the number of visuals (videos plus images) contained within the project
description (visuals) and the number of links to external websites containing further information
about the project (external_information). Prior literature has often used these measures as a proxy
of the unobserved quality of the campaign (Mollick, 2014; Colombo et al., 2015). In addition, by
mean of categorical variables, we coded the location of campaign (location_country), the category
of the project according to Kickstarter taxonomy (category) and the date when the campaign was
launched. Finally, we created a set of dummy variables indicating whether the crowdfunding
campaign was located in one of the most active metropolitan areas for VC investments. Specifically,
we created four dummy variables; the first (d_SanFrancisco) assumes the value one when the
campaign was located in the San Francisco Bay Area; the second (d_NewYork) is equal to 1 when
the campaign was located in the New York area; the third dummy variable (d_Boston) assumes a
value equal to one for campaigns located in the Boston area; finally, the fourth variable (d_London)
assumes a value equal to one for campaigns located in London, which is the largest VC hub in Europe
(Bertoni, Colombo and Quas, 2015).
Referring to the project creator, we took inspiration from prior literature, and we collected
information about creator’s social capital. Similar to Mollick (2014), we created a measure of social
capital external to the crowdfunding platform. Particularly, we used the log of the number of
creator’s Facebook friends (ext_social_capital) and we kept track separately of creators with no
19
Facebook account (d_nofacebook). Moreover, we added information about the social capital
developed by a creator within the crowdfunding platform. In line with Butticè and colleagues (2017),
we computed this measure by using the log of the number of comments that the creator had posted
on backed campaigns at the point of the launch of the focal campaign (internal social capital). In
addition, we created a dummy variable (d_education) to keep track whether a creator had obtained
a degree. For creating this variable, we collected creators’ biographies posted on Kickstarter. We
then developed an ad hoc content analysis algorithm, based on a search for characterizing terms in
the creator’s bio. In particular, we looked into the bio posted on Kickstarter to check whether the
creator reported words related to higher education (e.g. bachelor, degree, etc.). We then tested the
goodness of this methodology on a random sample of 2,000 bios. To this aim, we asked two research
assistants to read each of these bios to determine whether the creator reported to have at least a
degree before the campaign. The algorithm performed well in approximately 90% of the cases.
Finally, as for the country of reference, we computed a variable (CF_activity), which
measures the total number of crowdfunding campaigns launched in each country.
3.5. Descriptive statistics
Overall, among the 48,598 crowdfunding campaign posted on Kickstarter during the
considered time window, 9.63% have been classified as green (4,682 projects). These projects
include, among others, a new solar thermal panel to heat water without using any fossil fuel, a
documentary to raise awareness about the environmental damages connected to the fishing
industry, and a book to inspire children to maintain, plant and protect trees. The number of green
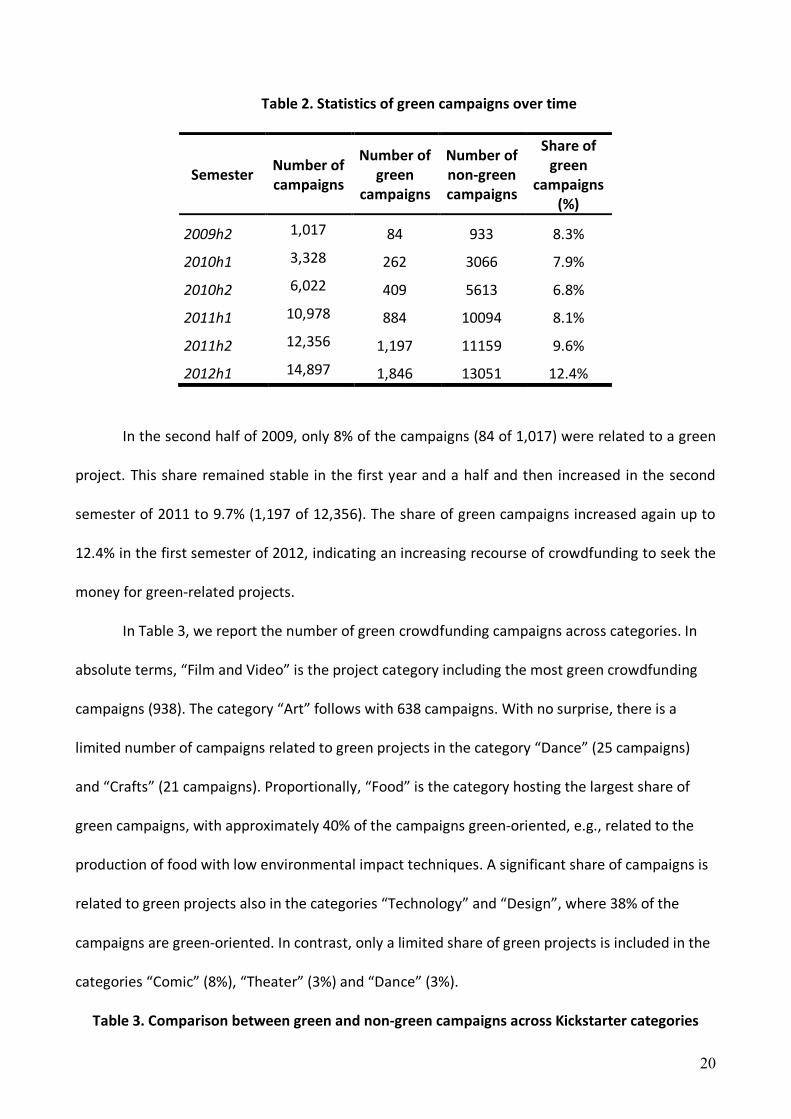
crowdfunding campaigns increased steadily semester by semester. In Table 2, we report the share
and the absolute number of green campaigns over time, together with the total number of
crowdfunding campaigns presented in the same time period.
20
Table 2. Statistics of green campaigns over time
Semester Number of campaigns
Number of green
campaigns
Number of non-green campaigns
Share of green
campaigns (%)
2009h2 1,017 84 933 8.3%
2010h1 3,328 262 3066 7.9%
2010h2 6,022 409 5613 6.8%
2011h1 10,978 884 10094 8.1%
2011h2 12,356 1,197 11159 9.6%
2012h1 14,897 1,846 13051 12.4%
In the second half of 2009, only 8% of the campaigns (84 of 1,017) were related to a green
project. This share remained stable in the first year and a half and then increased in the second
semester of 2011 to 9.7% (1,197 of 12,356). The share of green campaigns increased again up to
12.4% in the first semester of 2012, indicating an increasing recourse of crowdfunding to seek the
money for green-related projects.
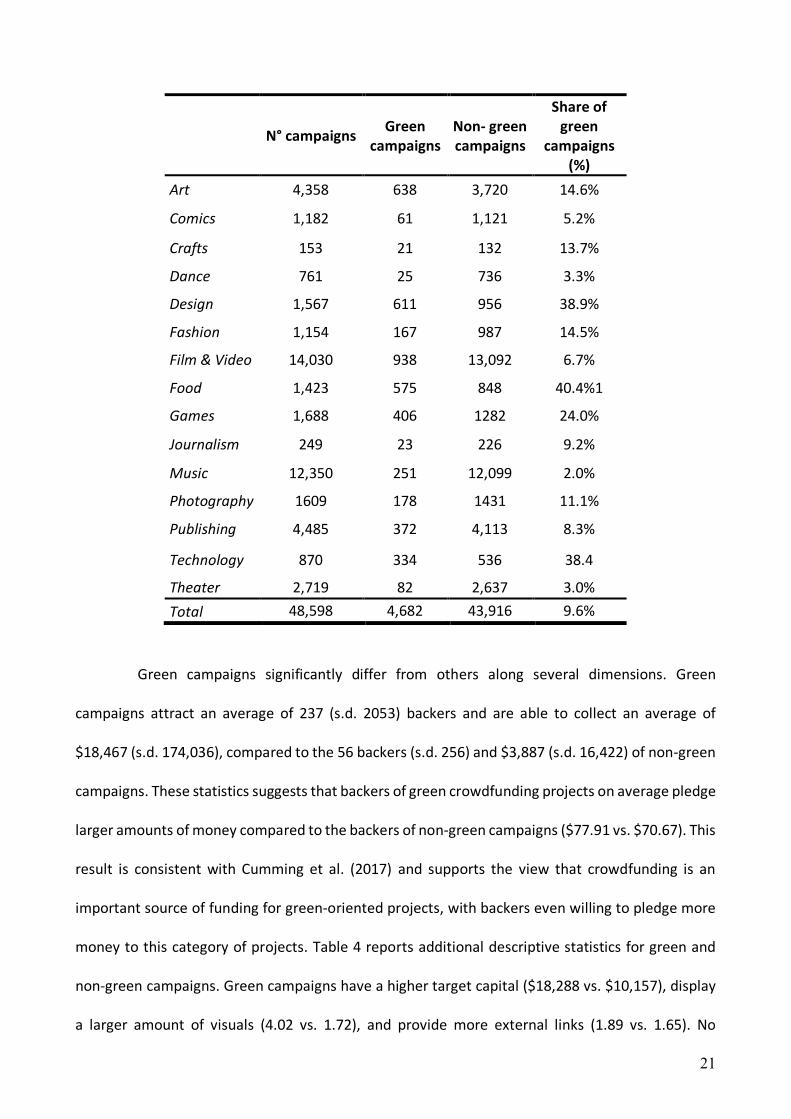
In Table 3, we report the number of green crowdfunding campaigns across categories. In
absolute terms, “Film and Video” is the project category including the most green crowdfunding
campaigns (938). The category “Art” follows with 638 campaigns. With no surprise, there is a
limited number of campaigns related to green projects in the category “Dance” (25 campaigns)
and “Crafts” (21 campaigns). Proportionally, “Food” is the category hosting the largest share of
green campaigns, with approximately 40% of the campaigns green-oriented, e.g., related to the
production of food with low environmental impact techniques. A significant share of campaigns is
related to green projects also in the categories “Technology” and “Design”, where 38% of the
campaigns are green-oriented. In contrast, only a limited share of green projects is included in the
categories “Comic” (8%), “Theater” (3%) and “Dance” (3%).
Table 3. Comparison between green and non-green campaigns across Kickstarter categories
21
N° campaigns Green campaigns
Non- green campaigns
Share of green
campaigns (%)
Art 4,358 638 3,720 14.6%
Comics 1,182 61 1,121 5.2%
Crafts 153 21 132 13.7%
Dance 761 25 736 3.3%
Design 1,567 611 956 38.9%
Fashion 1,154 167 987 14.5%
Film & Video 14,030 938 13,092 6.7%
Food 1,423 575 848 40.4%1
Games 1,688 406 1282 24.0%
Journalism 249 23 226 9.2%
Music 12,350 251 12,099 2.0%
Photography 1609 178 1431 11.1%
Publishing 4,485 372 4,113 8.3%
Technology 870 334 536 38.4
Theater 2,719 82 2,637 3.0% Total 48,598 4,682 43,916 9.6%
Green campaigns significantly differ from others along several dimensions. Green
campaigns attract an average of 237 (s.d. 2053) backers and are able to collect an average of
$18,467 (s.d. 174,036), compared to the 56 backers (s.d. 256) and $3,887 (s.d. 16,422) of non-green
campaigns. These statistics suggests that backers of green crowdfunding projects on average pledge
larger amounts of money compared to the backers of non-green campaigns ($77.91 vs. $70.67). This
result is consistent with Cumming et al. (2017) and supports the view that crowdfunding is an
important source of funding for green-oriented projects, with backers even willing to pledge more
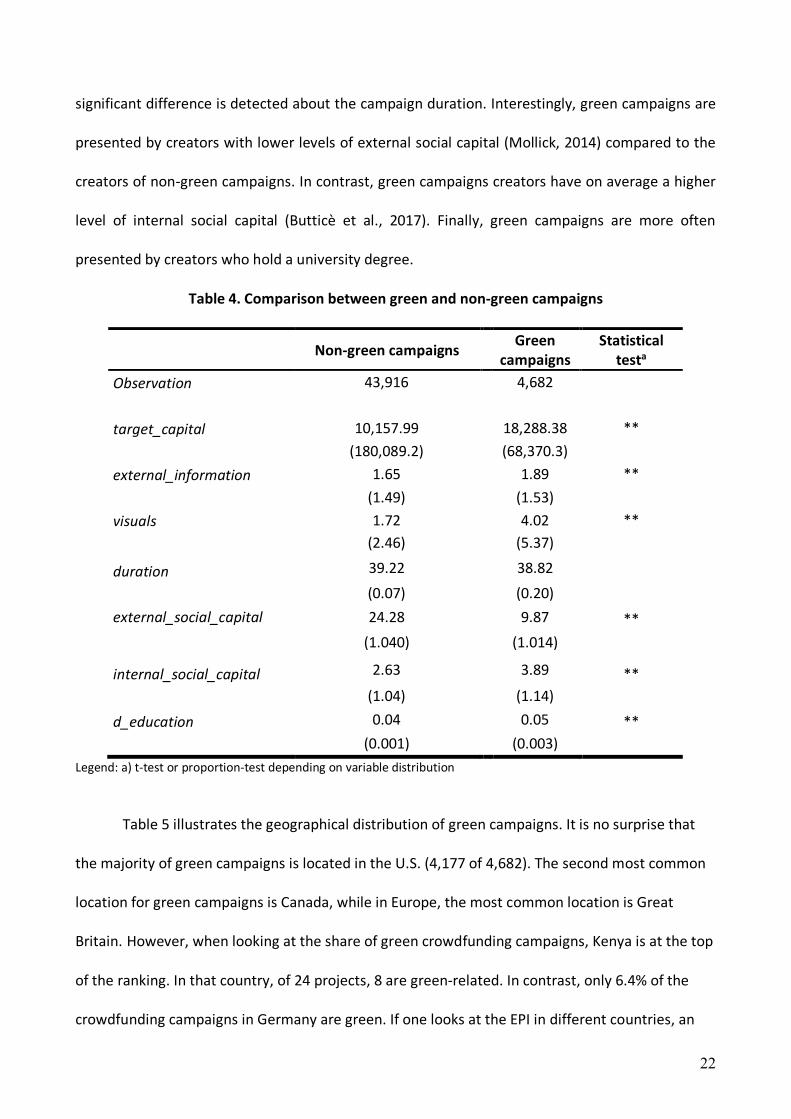
money to this category of projects. Table 4 reports additional descriptive statistics for green and
non-green campaigns. Green campaigns have a higher target capital ($18,288 vs. $10,157), display
a larger amount of visuals (4.02 vs. 1.72), and provide more external links (1.89 vs. 1.65). No
22
significant difference is detected about the campaign duration. Interestingly, green campaigns are
presented by creators with lower levels of external social capital (Mollick, 2014) compared to the
creators of non-green campaigns. In contrast, green campaigns creators have on average a higher
level of internal social capital (Butticè et al., 2017). Finally, green campaigns are more often
presented by creators who hold a university degree.
Table 4. Comparison between green and non-green campaigns
Non-green campaigns Green campaigns
Statistical testa
Observation 43,916 4,682
target_capital 10,157.99 18,288.38 **
(180,089.2) (68,370.3)
external_information 1.65 1.89 **
(1.49) (1.53)
visuals 1.72 4.02 **
(2.46) (5.37) duration 39.22 38.82 (0.07) (0.20) external_social_capital 24.28 9.87 ** (1.040) (1.014)
internal_social_capital 2.63 3.89 ** (1.04) (1.14) d_education 0.04 0.05 ** (0.001) (0.003)
Legend: a) t-test or proportion-test depending on variable distribution
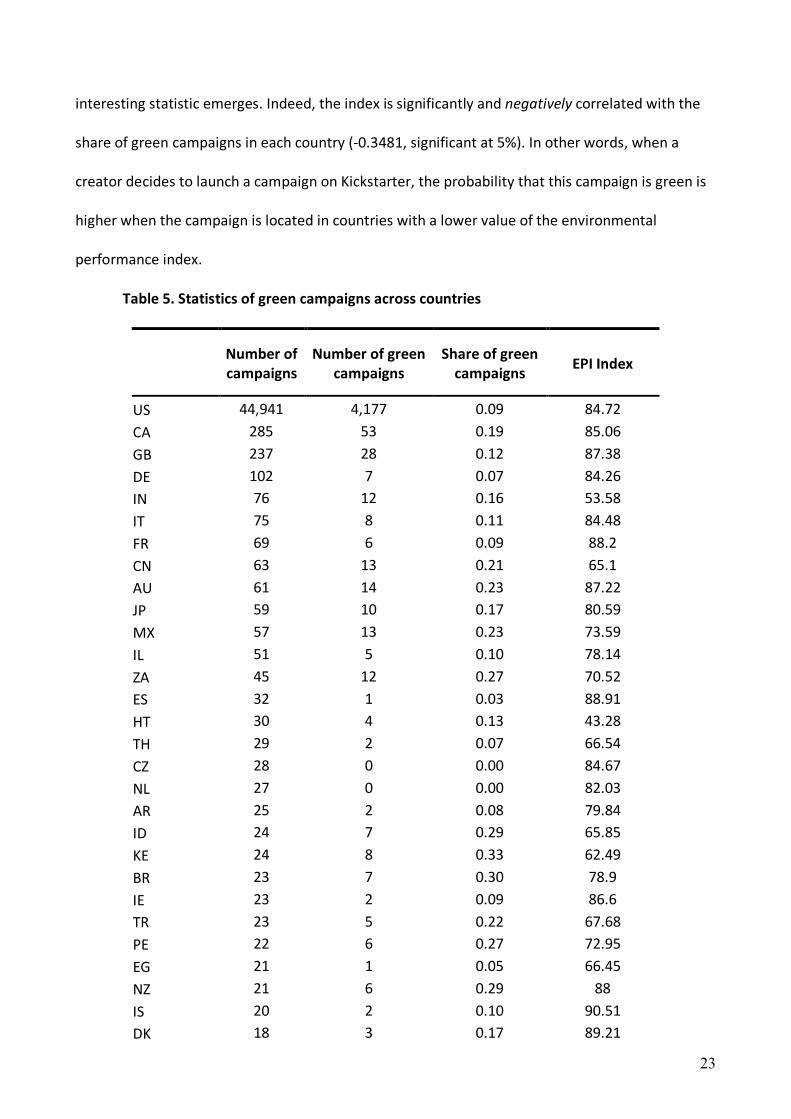
Table 5 illustrates the geographical distribution of green campaigns. It is no surprise that
the majority of green campaigns is located in the U.S. (4,177 of 4,682). The second most common
location for green campaigns is Canada, while in Europe, the most common location is Great
Britain. However, when looking at the share of green crowdfunding campaigns, Kenya is at the top
of the ranking. In that country, of 24 projects, 8 are green-related. In contrast, only 6.4% of the
crowdfunding campaigns in Germany are green. If one looks at the EPI in different countries, an
23
interesting statistic emerges. Indeed, the index is significantly and negatively correlated with the
share of green campaigns in each country (-0.3481, significant at 5%). In other words, when a
creator decides to launch a campaign on Kickstarter, the probability that this campaign is green is
higher when the campaign is located in countries with a lower value of the environmental
performance index.
Table 5. Statistics of green campaigns across countries
Number of campaigns
Number of green campaigns
Share of green campaigns EPI Index
US 44,941 4,177 0.09 84.72 CA 285 53 0.19 85.06 GB 237 28 0.12 87.38 DE 102 7 0.07 84.26 IN 76 12 0.16 53.58 IT 75 8 0.11 84.48 FR 69 6 0.09 88.2 CN 63 13 0.21 65.1 AU 61 14 0.23 87.22 JP 59 10 0.17 80.59 MX 57 13 0.23 73.59 IL 51 5 0.10 78.14 ZA 45 12 0.27 70.52 ES 32 1 0.03 88.91 HT 30 4 0.13 43.28 TH 29 2 0.07 66.54 CZ 28 0 0.00 84.67 NL 27 0 0.00 82.03 AR 25 2 0.08 79.84 ID 24 7 0.29 65.85 KE 24 8 0.33 62.49 BR 23 7 0.30 78.9 IE 23 2 0.09 86.6 TR 23 5 0.22 67.68 PE 22 6 0.27 72.95 EG 21 1 0.05 66.45 NZ 21 6 0.29 88 IS 20 2 0.10 90.51 DK 18 3 0.17 89.21

24
NP 18 4 0.22 50.21 SE 18 3 0.17 90.43 KR 17 2 0.12 70.61 PR 17 1 0.06 88.63 TZ 16 3 0.19 58.34 Other 2001 255 0.13
4. MAIN RESULTS
4.1 The association between the environmental sustainability orientation of countries’
institutions and the probability of presenting a green campaign
To test the hypotheses presented in section 2, we run a set of logit estimates with robust
standard errors that account for possible biases due to heteroscedasticity and used the probability
of observing a green (vs. non-green) campaign on the platform Kickstarter, as the dependent
variable. Table 6 reports the results of our estimates. First, we consider control variables (see
Model I). The multivariate analysis confirms the results illustrated in the previous section. Green
crowdfunding campaigns have larger target capital, provide more visuals in the description and
include a larger number of external links. Conversely, green crowdfunding campaigns are not
significantly different from their non-green counterparts in terms of duration. Green
crowdfunding campaigns are launched by creators with a significantly larger level of social capital
developed within the crowdfunding platform, but a lower level of external social capital. In
addition, the analysis shows that green crowdfunding campaigns are more likely launched by
creators who have obtained a university degree, even if the coefficient of this variable is only
weakly significant. We controlled also for the category of the focal campaign on Kickstarter and
the timing when the campaign was launched. The results related to the category of the campaign
should be compared to the baseline of a project belonging to the category “Food”. Coefficients are
negative and significant for all categories except for “Design” and “Technology”, which show a
positive and significant coefficient. Thus, compared to the baseline of a campaign belonging to the
25
food category, campaigns in the technology and design categories have a higher probability of
being green, while for campaigns belonging to all the other categories, this probability is lower.
The results related to the timing of the campaign should be interpreted compared to the baseline
that a campaign was launched in the first semester of 2012. All coefficients are not statistically
significant, thus suggesting that campaigns launched in 2012 are no more likely to be green, in
contrast to the result shown in the univariate analysis. The econometric analysis also shows that
the probability of launching a green campaign is lower when the campaign is located in the San
Francisco Bay Area or in the New York Area, compared to somewhere else. A possible explanation
is that creators in these areas may resort to other funding sources to finance their green projects.
Finally, the overall country crowdfunding activity is negatively associated with the probability of
presenting a green campaign.
In model II, we add the EPI variable as a proxy of the environmental sustainability
orientation of the institutions of a focal country. The analysis confirms a negative and significant
association between the value of EPI in the focal country and the probability of presenting a green
campaign. This effect is also large in magnitude. For instance, a campaign located in Turkey, which
represents the 10th percentile of the EPI distribution in our sample (99th overall position according
to EPI), is 64% more likely to be green compared with a campaign located in the UK, which
corresponds to the 90th percentile of the EPI distribution (13th overall position according to EPI). At
the mean value of all other variables, the predicted probability of a campaign being green
increases from 6% to 11%. This result suggests a possible crowding out effect. When a country
puts environmental issues at the top of its priorities, formal and informal institutions are oriented
toward sustaining green projects. In this context, the need for crowdfunding is lower, as
traditional sources of funding are available to creators. In contrast, when creators are located in
countries with a limited green orientation, it is difficult for them to find traditional sources of

26
funding. In this scenario, they are more inclined to use crowdfunding to collect the money
required for their projects.
Table 6. Main model
green I II EPI -0.0068** (0.003) int_social_capital 0.0771*** 0.0769*** (0.008) (0.008) ext_social_capital -0.071*** -0.074*** (0.011) (0.011) d_nofacebook -0.445*** -0.461*** (0.074) (0.073) moreinfo 0.1130*** 0.1148*** (0.016) (0.016) ln_visual 0.4504*** 0.4513*** (0.012) (0.012) ln_target 0.1883*** 0.1886*** (0.007) (0.007) duration 0.0001 -0.001 (0.001) (0.001) d_education 0.0479 0.0526 (0.039) (0.039) CF_activity -0.004** -0.003 (0.002) (0.003) d_2009 0.0240 -0.0214 (0.076) (0.076) d_2010 0.2253 0.0194 (0.029) (0.029) d_2011 -0.001 -0.033 (0.019) (0.020) art -0.084*** -0.091*** (0.031) (0.032) comics -0.763*** -0.763*** (0.062) (0.063) crafts -0.010*** -0.007 (0.138) (0.137) dance -0.623*** -0.618*** (0.085) (0.085) design 0.3801*** 0.3744*** (0.038) (0.038) fashion -0.161*** -0.165***

27
(0.047) (0.047) film -0.517*** -0.531*** (0.027) (0.028) games -0.061*** -0.052*** (0.039) (0.040) journalism -0.236** -0.230** (0.122) (0.122) music -0.889*** -0.887*** (0.033) (0.033) photo -0.200*** -0.201*** (0.047) (0.048) publishing -0.381*** -0.316*** (0.033) (0.034) tech 0.555*** 0.565*** (0.046) (0.047) d_SanFrancisco -0.032 -0.014 (0.046) (0.046) d_Boston 0.0230 0.0377 (0.066) (0.066) d_NewYork -0.1286*** -0.1288*** (0.028) (0.028) d_London 0.2498 0.2501 (0.163) (0.163) Country_dummy YES YES cons -2.3143*** -1.9532***
(0.118) (0.241) N° observations 48,598 48,598 Pseudo R2 0.2105 0.2186
4.2 Robustness checks
To assess the robustness of our results and avoid biased interpretation, we performed additional
analyses. First, we controlled for possible biases due to outliers. Following extant research on the
topic (Wainer, 1976), we winsorized continuous variables included in our estimates at the top and
bottom 1%. The results are consistent with those included in the main model. As a further control,
we performed a 1%, 5%, and 10% trimming of the data to remove extreme values from the
estimates. The results again are consistent (available from the authors upon request). Second, we
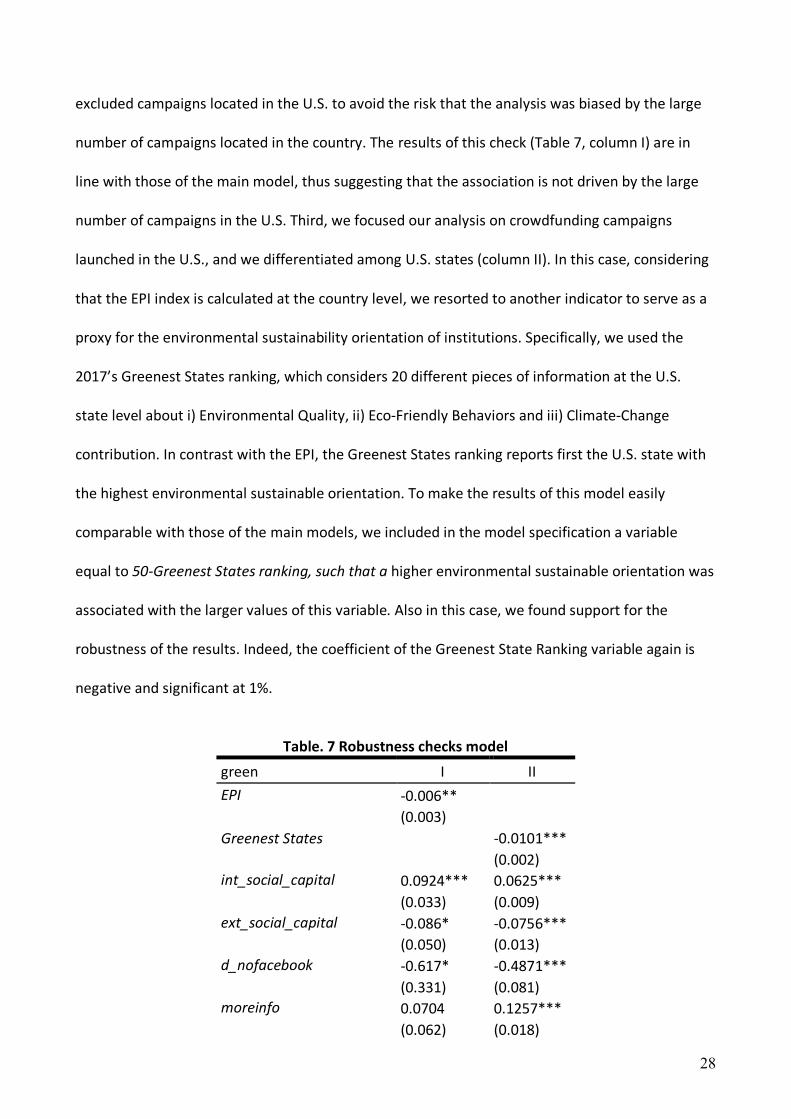
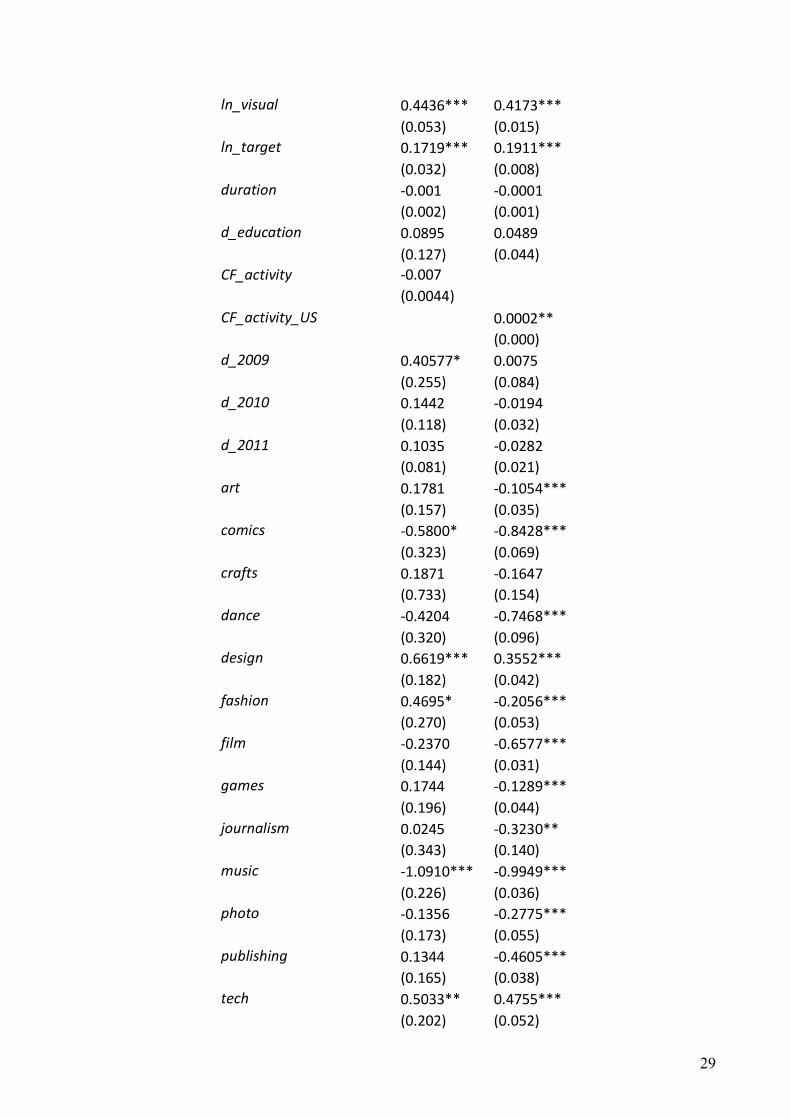
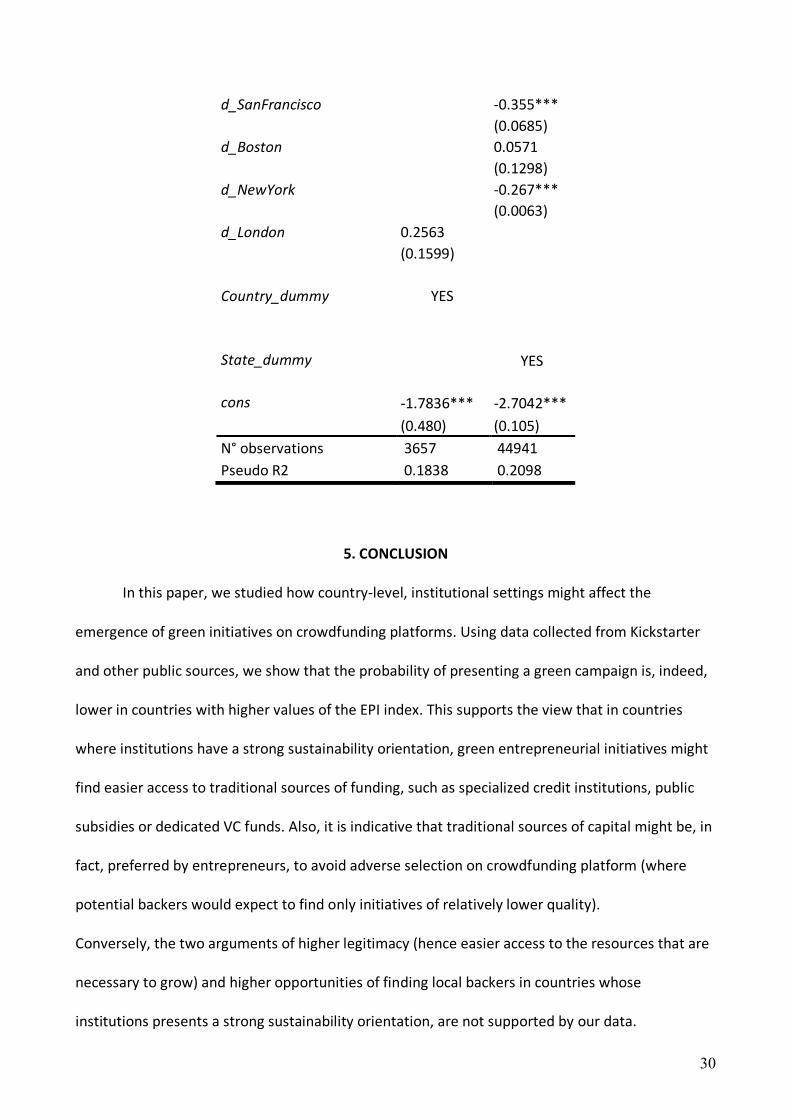
28
excluded campaigns located in the U.S. to avoid the risk that the analysis was biased by the large
number of campaigns located in the country. The results of this check (Table 7, column I) are in
line with those of the main model, thus suggesting that the association is not driven by the large
number of campaigns in the U.S. Third, we focused our analysis on crowdfunding campaigns
launched in the U.S., and we differentiated among U.S. states (column II). In this case, considering
that the EPI index is calculated at the country level, we resorted to another indicator to serve as a
proxy for the environmental sustainability orientation of institutions. Specifically, we used the
2017’s Greenest States ranking, which considers 20 different pieces of information at the U.S.
state level about i) Environmental Quality, ii) Eco-Friendly Behaviors and iii) Climate-Change
contribution. In contrast with the EPI, the Greenest States ranking reports first the U.S. state with
the highest environmental sustainable orientation. To make the results of this model easily
comparable with those of the main models, we included in the model specification a variable
equal to 50-Greenest States ranking, such that a higher environmental sustainable orientation was
associated with the larger values of this variable. Also in this case, we found support for the
robustness of the results. Indeed, the coefficient of the Greenest State Ranking variable again is
negative and significant at 1%.
Table. 7 Robustness checks model
green I II EPI -0.006** (0.003)
Greenest States -0.0101***
(0.002) int_social_capital 0.0924*** 0.0625*** (0.033) (0.009) ext_social_capital -0.086* -0.0756*** (0.050) (0.013) d_nofacebook -0.617* -0.4871*** (0.331) (0.081) moreinfo 0.0704 0.1257*** (0.062) (0.018)
29
ln_visual 0.4436*** 0.4173*** (0.053) (0.015) ln_target 0.1719*** 0.1911*** (0.032) (0.008) duration -0.001 -0.0001 (0.002) (0.001) d_education 0.0895 0.0489 (0.127) (0.044) CF_activity -0.007 (0.0044) CF_activity_US 0.0002** (0.000) d_2009 0.40577* 0.0075 (0.255) (0.084) d_2010 0.1442 -0.0194 (0.118) (0.032) d_2011 0.1035 -0.0282 (0.081) (0.021) art 0.1781 -0.1054*** (0.157) (0.035) comics -0.5800* -0.8428*** (0.323) (0.069) crafts 0.1871 -0.1647 (0.733) (0.154) dance -0.4204 -0.7468*** (0.320) (0.096) design 0.6619*** 0.3552*** (0.182) (0.042) fashion 0.4695* -0.2056*** (0.270) (0.053) film -0.2370 -0.6577*** (0.144) (0.031) games 0.1744 -0.1289*** (0.196) (0.044) journalism 0.0245 -0.3230** (0.343) (0.140) music -1.0910*** -0.9949*** (0.226) (0.036) photo -0.1356 -0.2775*** (0.173) (0.055) publishing 0.1344 -0.4605*** (0.165) (0.038) tech 0.5033** 0.4755*** (0.202) (0.052)
30
d_SanFrancisco -0.355*** (0.0685) d_Boston 0.0571 (0.1298) d_NewYork -0.267*** (0.0063) d_London 0.2563 (0.1599) Country_dummy YES State_dummy YES cons -1.7836*** -2.7042*** (0.480) (0.105) N° observations 3657 44941 Pseudo R2 0.1838 0.2098
5. CONCLUSION
In this paper, we studied how country-level, institutional settings might affect the
emergence of green initiatives on crowdfunding platforms. Using data collected from Kickstarter
and other public sources, we show that the probability of presenting a green campaign is, indeed,
lower in countries with higher values of the EPI index. This supports the view that in countries
where institutions have a strong sustainability orientation, green entrepreneurial initiatives might
find easier access to traditional sources of funding, such as specialized credit institutions, public
subsidies or dedicated VC funds. Also, it is indicative that traditional sources of capital might be, in
fact, preferred by entrepreneurs, to avoid adverse selection on crowdfunding platform (where
potential backers would expect to find only initiatives of relatively lower quality).
Conversely, the two arguments of higher legitimacy (hence easier access to the resources that are
necessary to grow) and higher opportunities of finding local backers in countries whose
institutions presents a strong sustainability orientation, are not supported by our data.
31
All in all, this study contributes to the literature in several respects. First, our results add to
the debate on the role of crowdfunding as an alternative source of funding for environmentally
sustainable projects (e.g., Hörisch, 2015; Belz and Binder, 2017). Specifically, our data suggests
that crowdfunding is particularly used to finance green initiatives located in countries where
institutions are less oriented toward environmental sustainability and that it helps to relax the
constraints that make it difficult for green entrepreneurs to access the external resources (notably
finance) required to successfully develop their projects. Second, this paper contributes to the
broader literature on the reasons driving creators to resort to crowdfunding (e.g., Gerber & Hui,
2013), by showing that also country-level dimensions influence the creator’s motivation to present
a campaign. More specifically, the paper contributes to the nascent debate on how country-level
institutional and socio-cultural aspects influence the choice of launching a crowdfunding campaign
(e.g., Cumming, et al., 2017), through the influence they exert on the behavior of both creators
and backers. In this respect, our results suggest a negative relationship between a country
sustainability orientation and a creator’s preference for crowdfunding. The final important
contribution of this work is methodological. Often, prior literature on crowdfunding has
disregarded the actual content of the campaign in their analysis (Bogers, Cincotti, Nielsen, Testa,
2017; Nielsen and Reisch, 2016). In this paper, we overcome this limitation by using the campaign
description as the main informative sources in combination with an easily scalable machine-
learning algorithm to classify green vs. non-green crowdfunding campaigns. Given the amount of
textual information provided in a crowdfunding campaign, we advise scholars to introduce similar
methodologies in their studies, particularly when they are interested in emerging fields, such as
nanotechnologies, self-driving vehicles or the Internet of things, which generally are not well
covered by standard classification.
32
We acknowledge that this paper is not exempt of limitations. First, we used cross-section
multivariate analysis to investigate the association between green-oriented crowdfunding
campaigns and the environmental sustainability orientation of institutions at the country level.
However, our analyses do not provide any compelling evidence about neither the casual linkage
nor the mechanisms underlying this relationship. We call for further studies that, by using a
different research design, can overcome this limit. Second, our paper focuses on the use of
crowdfunding to finance green-oriented campaigns in different institutional settings. By contrast,
it does not provide evidence about the likelihood of success of these campaigns. As prior literature
has provided inconclusive results on the topic, we call for further studies to provide robust
quantitative-based evidence on the issue and its underling mechanisms. Finally, we limit our
analysis to campaigns posted on Kickstarter. Using data from a single platform raises some caution
about the generalizability of our results. Kickstarter is a reward-based generalist platform, so it is
not clear whether our findings extend to other forms of crowdfunding (e.g., equity crowdfunding
and peer-to-peer lending) or to specialized green-oriented platforms (e.g., the platform
“Greenfunding”). Developing a data set including crowdfunding campaigns from multiple
platforms would allow future studies to observe whether our results are context-specific rather
than generalizable to any platform type.
These limitations withstanding, we believe that our paper has interesting implications for
policymakers and practitioners. First, policymakers in countries where institutions have limited
sustainability orientation, should consider that local entrepreneurs are inclined to use
crowdfunding to overcome the funding gap they suffer. Moving from this evidence, policymakers
in these countries can define economical measures to sustain these green initiatives. For instance,
they may focus on providing support to entrepreneurs in the process of designing and running
their crowdfunding campaigns. Similarly, they can promote tools to advertise and share green-
33
oriented campaigns among citizens. Such tools would help to increase the public awareness about
the campaigns, their legitimacy, and ultimately their chances of obtaining the required funding.
Policy makers in these countries may also use crowdfunding as a privileged source of information
to have an outlook on green emerging trends and define funding priorities according to the
backer’s reaction to different campaigns. Conversely, policymakers operating in countries with a
strong environmental sustainability orientation should consider the results of this paper to inform
the debate about the use of crowdfunding for supporting green projects. Often policymakers in
countries with a strong environmental sustainability orientation have agreed that crowdfunding is
an important source of funding for green initiatives4 and have developed ad hoc measures to
support these campaigns5. However, our analysis shows that only a limited share of entrepreneurs
resorts to crowdfunding when seeking money for their green initiatives possibly driven by an
adverse selection process existing for these initiatives. In light of our results, we advise
policymakers to re-design direct forms of support to green oriented crowdfunding initiatives
presented in these countries to expunge the risk of subsidizing lower quality projects. Finally, the
results of this paper are relevant also for practitioners. In countries with limited environmental
sustainability orientation, creators interested in running a green initiative should consider that
many others preceded them. Considering that closed crowdfunding campaigns typically remain
accessible on the platform websites (Butticè, Orsenigo & Wrigth, 2017), predecessors’ experiences
may become an important source of hints for prospect creators to increase the chances of success
for their campaigns. More generally, the significant number of creators who use crowdfunding for
financing green initiatives in these countries creates interesting market opportunities. For
4 See, e.g., https://www.theneweconomy.com/energy/crowdfunding-could-create-a-greener-world, accessed on November 3, 2017. 5 For instance, the program “Public Spaces Community Places” resulted from the joint effort of the Michigan Economic Development Corp. (MEDC) and a local crowdfunding platform proposes that civic projects (many of which green-oriented) that reach success in a crowdfunding campaign will get a matching public grant up to 50,000$.
34
instance, advisors and consulting companies that support creators in designing a crowdfunding
campaign (e.g., to write an appealing description in English) may find fertile ground to establish
their businesses in these countries. Similarly, the results of this work are also relevant for
practitioners in countries with a strong environmental sustainability orientation. Creators in these
countries should be aware that presenting a green-oriented campaign may be a double-edged
sword. On the one hand, green-oriented campaigns may engender an advantage for creators;
creators would face less competition due to the share of green campaigns limited. On the other
hand, considering that creators in these countries typically do not use crowdfunding for financing
green-oriented initiatives, backers may perceive their projects as being of low quality and avoid
financing them. Creators informed of the results of this paper should put in place actions to limit
the negative side effect related to the perceived low quality of their campaigns (e.g., writing a
convincing description that stresses the high quality of the initiative and providing more numerous
and informative external links). In this way, they will fully benefit from the lower level of
competition.
Overall, our paper has provided important insights about the use of crowdfunding to
finance green-oriented initiatives. Considering that crowdfunding is still an expanding field, it
seems likely that more green-oriented initiatives will resort to it in the future, making this funding
method an important source of funding for this category of projects, particularly in countries
where institutions have limited environmental sustainability orientation.
REFERENCES
Agrawal, A., Catalini, C., & Goldfarb, A. (2014) Some simple economics of crowdfunding.
Innovation Policy and the Economy, 14(1):63–97.
35
Agrawal, A., Catalini, C., & Goldfarb, A. (2010) Entrepreneurial finance and the flat-world
hypothesis: evidence from crowd-funding entrepreneurs in the arts. Technical report, 2010.
Ahlers, G. K., Cumming, D., Günther, C., & Schweizer, D. (2015). Signaling in equity
crowdfunding. Entrepreneurship Theory and Practice, 39(4), 955-980.
Aldrich, H. E., & Fiol, C. M. (1994). Fools rush in? The institutional context of industry creation.
Academy of Management Review, 19(4), 645-670.
Barboza, F., Kimura, H., & Altman, E. (2017). Machine learning models and bankruptcy
prediction. Expert Systems with Applications, 83, 405-417.
Bartenberger, M., & Leitner, P. (2013). Crowdsourcing and crowdfunding: approaches to foster
social innovation. In Proceedings of the IADIS International Conference Web Based Communities
and Social Media 2013 (pp. 81-85).
Bartenberger, M., & Leitner, P. (2013). Crowdsourcing and crowdfunding: approaches to foster
social innovation. In Proceedings of the IADIS International Conference Web Based Communities
and Social Media 2013 (pp. 81-85).
Belleflamme, P., Lambert, T., & Schwienbacher, A. (2014). Crowdfunding: Tapping the right
crowd. Journal of Business Venturing, 29(5), 585-609.
Belz, F. M., & Binder, J. K. (2017). Sustainable entrepreneurship: a convergent process model.
Business Strategy and the Environment, 26(1), 1-17.
Bertoni, F., Colombo, M. G., & Quas, A. (2015). The patterns of venture capital investment in
Europe. Small Business Economics, 45(3), 543-560.
Boeuf, B., Darveau, J., & Legoux, R. (2014). Financing creativity: Crowdfunding as a new
approach for theatre projects. International Journal of Arts Management, 16(3), 33.
Bonzanini, D., Giudici, G., & Patrucco, A. (2015). The Crowdfunding of Renewable Energy
Projects. Handbook of Environmental and Sustainable Finance, 429.
Boso, N., Danso, A., Leonidou, C., Uddin, M., Adeola, O., & Hultman, M. (2017). Does financial
resource slack drive sustainability expenditure in developing economy small and medium-sized
enterprises? Journal of Business Research, 80(C), 247-256.
Breiman, L. (2001). Random forests. Machine learning, 45(1), 5-32.
Bruton, G., Khavul, S., Siegel, D., & Wright, M. (2015). New financial alternatives in seeding
entrepreneurship: Microfinance, crowdfunding, and peer-to-peer innovations. Entrepreneurship
Theory and Practice, 39(1), 9-26.
36
Bruton, G. D., Ahlstrom, D., & Li, H. L. (2010). Institutional theory and entrepreneurship: where
are we now and where do we need to move in the future?. Entrepreneurship Theory and Practice,
34(3), 421-440.
Bürer, M. J., & Wüstenhagen, R. (2009). Which renewable energy policy is a venture
capitalist's best friend? Empirical evidence from a survey of international cleantech investors.
Energy Policy, 37(12), 4997-5006.
Butticè, V., Colombo, M. G., & Wright, M. (2017). Serial crowdfunding, social capital, and
project success. Entrepreneurship Theory and Practice, 41(2), 183-207.
Butticè, V., Orsenigo, C., & Wright, M. (2017). The effect of information asymmetries on serial
crowdfunding and campaign success. Economia e Politica Industriale, 1-31.
Calic, G., & Mosakowski, E. (2016). Kicking off social entrepreneurship: how a sustainability
orientation influences crowdfunding success. Journal of Management Studies, 53(5), 738-767.
Candelise, C. (2016). Smart financing and empowerment: the use of crowdfunding in the
energy sector. Working paper.
Choi, D. Y., & Gray, E. R. (2008). The venture development processes of “sustainable”
entrepreneurs. Management Research News, 31(8), 558-569.
Clarkson, M. E. (1995). A stakeholder framework for analyzing and evaluating corporate social
performance. Academy of management review, 20(1), 92-117.
Cohen, B., & Winn, M. I. (2007). Market imperfections, opportunity and sustainable
entrepreneurship. Journal of Business Venturing, 22(1), 29-49.
Colombo, M. G., Franzoni, C., & Rossi-Lamastra, C. (2015). Internal social capital and the
attraction of early contributions in crowdfunding. Entrepreneurship Theory and Practice, 39(1),
75-100.
Courtney, C., Dutta, S., & Li, Y. (2017). Resolving information asymmetry: Signaling,
endorsement, and crowdfunding success. Entrepreneurship Theory and Practice, 41(2), 265-290.
Crossland, C., & Hambrick, D. C. (2011). Differences in managerial discretion across countries:
how nation-level institutions affect the degree to which CEOs matter. Strategic Management
Journal, 32(8), 797-819.
Cumming, D. J., Leboeuf, G., & Schwienbacher, A. (2017). Crowdfunding cleantech. Energy
Economics, 65, 292-303.
Cumming, D., Henriques, I., & Sadorsky, P. (2016). ‘Cleantech’venture capital around the
world. International Review of Financial Analysis, 44, 86-97.
37
Dowling, J., & Pfeffer, J. (1975). Organizational legitimacy: Social values and organizational
behavior. Pacific sociological review, 18(1), 122-136.
Drury, J., & Stott, C. (2011). Contextualising the crowd in contemporary social science.
Contemporary Social Science, 6(3), 275-288.
Emerson, J. (2003). The blended value proposition: Integrating social and financial returns.
California Management Review, 45(4), 35-51.
Fedele, A., & Miniaci., R. (2010) Do social enterprises finance their investments differently
from for-profit firms? The case of social residential services in Italy. Journal of Social
Entrepreneurship, 1(2): 174–189.
Foxon, T., & Pearson, P. (2008). Overcoming barriers to innovation and diffusion of cleaner
technologies: some features of a sustainable innovation policy regime. Journal of cleaner
production, 16(1), S148-S161.
Gaddy, B. E., Sivaram, V., Jones, T. B., & Wayman, L. (2017). Venture Capital and Cleantech:
The wrong model for energy innovation. Energy Policy, 102, 385-395.
Gerber, E. M., & Hui, J. (2013). Crowdfunding: Motivations and deterrents for participation.
ACM Transactions on Computer-Human Interaction (TOCHI), 20(6), 34.
Giudici, G., Guerini, M., & Rossi-Lamastra, C. (2017). Reward-based crowdfunding of
entrepreneurial projects: the effect of local altruism and localized social capital on proponents’
success. Small Business Economics, 1-18.
Ghosh, S., & Nanda, R. (2010). Venture capital investment in the clean energy sector. Working
Paper.
Goodman, A., & Polycarpou. L. (2013) The sustainability-social networking nexus.
Sustainability: The Journal of Record, 6(1):26–32.
Hahn, T., Preuss, L., Pinkse, J., & Figge, F. (2014). Cognitive frames in corporate sustainability:
Managerial sensemaking with paradoxical and business case frames. Academy of Management
Review, 39(4), 463-487.
Hargadon, A. B., & Kenney, M. (2012). Misguided Policy?. California Management Review,
54(2), 118-139.
Harmon, R. R., & Cowan, K. R. (2009). A multiple perspectives view of the market case for
green energy. Technological Forecasting and Social Change, 76(1), 204-213.
Hemer, J. (2011). A snapshot on crowdfunding (No. R2/2011). Working papers firms and
region.
38
Hildebrand, T., Puri, M., & Rocholl, J. (2016). Adverse incentives in crowdfunding.
Management Science, 63(3), 587-608.
Hörisch, J. (2015). Crowdfunding for environmental ventures: an empirical analysis of the
influence of environmental orientation on the success of crowdfunding initiatives. Journal of
cleaner production, 107, 636-645.
Kerr, S., & Newell, R. G. (2003). Policy-Induced Technology Adoption: Evidence from the US
Lead Phasedown. The Journal of Industrial Economics, 51(3), 317-343.
Kononenko, I., & Bratko, I. (1991). Information-based evaluation criterion for classifier's
performance. Machine Learning, 6(1), 67-80.
Laborda, R., & Laborda, J. (2017). Can tree-structured classifiers add value to the investor?.
Finance Research Letters.
Lam, P. T., & Law, A. O. (2016). Crowdfunding for renewable and sustainable energy projects:
An exploratory case study approach. Renewable and Sustainable Energy Reviews, 60, 11-20.
Lehner, O. M. (2013). Crowdfunding social ventures: a model and research agenda. Venture
Capital, 15(4), 289-311.
Lindenberg, S., & Steg, L. (2007). Normative, gain and hedonic goal frames guiding
environmental behavior. Journal of Social issues, 63(1), 117-137.
Lounsbury, M., & Glynn, M. A. (2001). Cultural entrepreneurship: Stories, legitimacy, and the
acquisition of resources. Strategic management journal, 22(6-7), 545-564.
Malekipirbazari, M., & Aksakalli, V. (2015). Risk assessment in social lending via random
forests. Expert Systems with Applications, 42(10), 4621-4631.
McCarthy, J. D., & Zald, M. N. (1977). Resource mobilization and social movements: A partial
theory. American journal of sociology, 82(6), 1212-1241.
Merton, R. K. (1957). Priorities in scientific discovery: a chapter in the sociology of science.
American sociological review, 22(6), 635-659.
Mollick E.(2014). The dynamics of crowdfunding: An exploratory study. Journal of Business
Venturing, 29(1):1–16.
Mollick, E., & Nanda, R. (2015). Wisdom or madness? Comparing crowds with expert
evaluation in funding the arts. Management Science, 62(6), 1533-1553.
Moss, T. W., Neubaum, D. O., & Meyskens, M. (2015). The effect of virtuous and
entrepreneurial orientations on microfinance lending and repayment: A signaling theory
perspective. Entrepreneurship Theory and Practice, 39(1), 27-52.
39
Navis, C., & Glynn, M. A. (2010). How new market categories emerge: Temporal dynamics of
legitimacy, identity, and entrepreneurship in satellite radio, 1990–2005. Administrative Science
Quarterly, 55(3), 439-471.
Nielsen, K.R. & Reisch, L.A. (2016). Crowdfunding for Sustainability - The Role of Value
Orientation Frames in Guiding Individual Investment Behavior. Proceedings of the International
Conference on Business, Policy and Sustainability. Copenhagen Business School, 16-17 June,
Denmark.
Oliver, C. (1991). Strategic responses to institutional processes. Academy of management
review, 16(1), 145-179.
Ordanini, A., Miceli, L., Pizzetti, M., & Parasuraman, A. (2011). Crowd-funding: transforming
customers into investors through innovative service platforms. Journal of service management,
22(4), 443-470.
Ortas, E., Burritt, R. L., & Moneva, J. M. (2013). Socially Responsible Investment and cleaner
production in the Asia Pacific: does it pay to be good?. Journal of Cleaner Production, 52, 272-280.
Petkova, A. P., Wadhwa, A., Yao, X., & Jain, S. (2014). Reputation and decision making under
ambiguity: a study of US venture capital firms' investments in the emerging clean energy sector.
Academy of Management Journal, 57(2), 422-448.
Pitschner, S., & Pitschner-Finn, S. (2014). Non-profit differentials in crowd-based financing:
Evidence from 50,000 campaigns. Economics Letters, 123(3), 391-394.
Pollock, T. G., & Rindova, V. P. (2003). Media legitimation effects in the market for initial
public offerings. Academy of Management Journal, 46(5), 631-642.
Popp, D., Hascic, I., & Medhi, N. (2011). Technology and the diffusion of renewable energy.
Energy Economics, 33(4), 648-662.
Ridley-Duff, R. (2009). Co-operative social enterprises: company rules, access to finance and
management practice. Social Enterprise Journal, 5(1), 50-68.
Sebastiani, F. (2002). Machine learning in automated text categorization. ACM computing
surveys (CSUR), 34(1), 1-47.
Thomakos, D. D., & Alexopoulos, T. A. (2016). Carbon intensity as a proxy for environmental
performance and the informational content of the EPI. Energy Policy, 94, 179-190.
Thompson, N., Kiefer, K., & York, J. G. (2011). Distinctions not dichotomies: Exploring social,
sustainable, and environmental entrepreneurship. In Social and sustainable entrepreneurship (pp.
201-229). Emerald Group Publishing Limited.
40
Überbacher, F. (2014). Legitimation of new ventures: A review and research programme.
Journal of Management Studies, 51(4), 667-698.
Vasileiadou, E., Huijben, J. C. C. M., & Raven, R. P. J. M. (2015). Three is a crowd? Exploring the
potential of crowdfunding for renewable energy in the Netherlands. Journal of Cleaner
Production, 30, 1-14.
Vasileiadou, E., Huijben, J. C. C. M., & Raven, R. P. J. M. (2015). Three is a crowd? Exploring the
potential of crowdfunding for renewable energy in the Netherlands. Journal of Cleaner
Production, 30, 1-14.
Williams, N., & Vorley, T. (2015). Institutional asymmetry: How formal and informal
institutions affect entrepreneurship in Bulgaria. International Small Business Journal, 33(8), 840-
861.
Yang, Y. (1999). An evaluation of statistical approaches to text categorization. Information
retrieval, 1(1), 69-90.
Zimmerman, M. A., & Zeitz, G. J. (2002). Beyond survival: Achieving new venture growth by
building legitimacy. Academy of management review, 27(3), 414-431.
Zott, C., & Huy, Q. N. (2007). How entrepreneurs use symbolic management to acquire
resources. Administrative Science Quarterly, 52(1), 70-105.
41
APPENDIX
Appendix A1- Discrimination between green and non-green projects via text classification
The classification of the projects encompassed several steps. First, we collected a set 𝑆 of
documents used for training. These consisted in the descriptions of 5,000 campaigns randomly
selected from the entire sample of 48,598 projects, which were manually labeled as “green” (26%)
and “non-green” (74%). Textual data were then tokenized and represented as vectors of terms
according to the bag-of-words model. Indeed, each description was converted into a multi-
dimensional feature vector, where each dimension contains the frequency of occurrence of the
corresponding word. Before tokenization, classical NLP filters were applied. Specifically, we
dropped punctuation and numbers, converted all upper-case to lower-case letters and performed
stop word removal, with the aim of discarding English-specific functional terms that are highly
frequent but useless for text classification. Another common filter known as stemming was not
applied since we observed a mild degradation of the prediction performance when the root of the
words was employed in place of their original form. A final filter was instead used to remove the
terms occurring in less than five documents; this led to a final dataset comprising 5,000 labeled
examples and 1,243 explanatory variables (words).
For supervised learning, we resorted to the Random forest algorithm, which represents a
powerful extension of decision trees (Breiman et al., 1984). Random forest (RF) is an ensemble
technique that grows a collection of binary classification trees to vote for the most popular class.
According to the RF paradigm, random perturbations are introduced in the learning procedure
with the purpose of enhancing the effectiveness of classical decision trees, which usually suffer
from high variance. Specifically, several classification trees are independently built on different
subsets of data comprising examples randomly selected from the training set (bootstrapped
instances), to reduce the complexity of the model and the risk of overfitting. Moreover, to further

42
diversify the decision trees and avoid correlation in the bootstrapped samples, the recursive
partitioning of the nodes in a tree is based on a random subset of candidate explanatory variables,
for which the best split is determined. Once the forest of random trees is learnt, the classification
of new examples is performed through a majority voting scheme: indeed, each new example
receives a label by traversing each tree from the root node to one of the leaves, and the most
popular label is assigned as the final prediction, as illustrated in Figure 3.
Figure 3. Random forest class prediction based on majority voting scheme
Random forest models depend on three parameters: the number of trees in the forest (𝑀),
the maximum number of variables to select in individual trees (𝑝) and the maximum number of
their leaves (𝑔). In our computational setting, as recommended in (Breiman, 2001), we set 𝑝 =
√𝑛, where 𝑛is the total number of variables in the dataset, and 𝑔 = 1, thus leaving the trees to
Class «non-green»

43
grow at their maximum depth. The number of trees was instead set to 𝑀=200, since at this value,
we reached a satisfactory and stable out-of-bag estimate of the generalization error (4.8%).
Once the RF model was built with this fixed set of parameters, it was used to classify the
remaining 43,598 projects; among these, 3,633 (9%) were labeled “green” and the rest 39,965
(91%) as “non-green”.
The Random forest algorithm used in the present study can be summarized as follows:
1) For 𝑖 = 1,… ,𝑀: a. Draw a bootstrap sample of documents from the original training
dataset 𝑆. b. Build a classification tree on the bootstrapped sample by recursively
repeating the following steps for each node, until its maximum size is reached: i. Randomly select 𝑝 variables out of the 𝑛predictors.
ii. Select the best split based on one of the 𝑝 variables and divide the current node into two children nodes.
2) Output the set of trees generated. 3) Combine the trees predictions to assign the class to out-of-sample
documents based on the majority voting principle.
To obtain an insight into the Random forest outcome, we investigated the variable
importance according to the mean decrease in accuracy (MDA), which, in our case, measures the
impact of each word on the quality of the model. The idea behind MDA is to permute the values of
each variable and evaluate at what extent the permutation affects the prediction error. For
irrelevant terms, permutation should have little or no effect; in contrast, permuting the values of
informative words should significantly decrease the accuracy of the model. The result of this
analysis is shown in Figure 2, where the terms at the top of the list appeared as the most
influential, being associated with the largest drop in accuracy. As we might expect, the most
relevant terms are highly pertained to green campaigns, mainly devoted to promoting innovative
ideas addressing environmental and natural elements, new materials or novel green technologies
for transportation or energy supply.
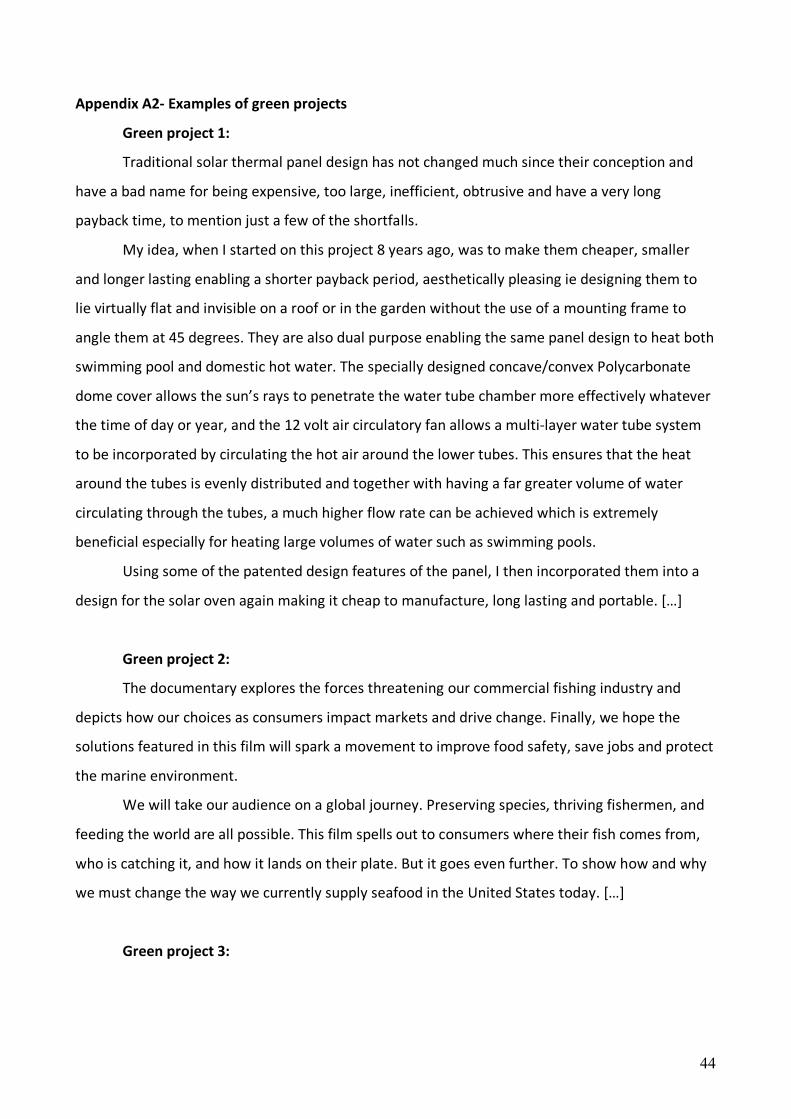
44
Appendix A2- Examples of green projects
Green project 1:
Traditional solar thermal panel design has not changed much since their conception and
have a bad name for being expensive, too large, inefficient, obtrusive and have a very long
payback time, to mention just a few of the shortfalls.
My idea, when I started on this project 8 years ago, was to make them cheaper, smaller
and longer lasting enabling a shorter payback period, aesthetically pleasing ie designing them to
lie virtually flat and invisible on a roof or in the garden without the use of a mounting frame to
angle them at 45 degrees. They are also dual purpose enabling the same panel design to heat both
swimming pool and domestic hot water. The specially designed concave/convex Polycarbonate
dome cover allows the sun’s rays to penetrate the water tube chamber more effectively whatever
the time of day or year, and the 12 volt air circulatory fan allows a multi-layer water tube system
to be incorporated by circulating the hot air around the lower tubes. This ensures that the heat
around the tubes is evenly distributed and together with having a far greater volume of water
circulating through the tubes, a much higher flow rate can be achieved which is extremely
beneficial especially for heating large volumes of water such as swimming pools.
Using some of the patented design features of the panel, I then incorporated them into a
design for the solar oven again making it cheap to manufacture, long lasting and portable. […]
Green project 2:
The documentary explores the forces threatening our commercial fishing industry and
depicts how our choices as consumers impact markets and drive change. Finally, we hope the
solutions featured in this film will spark a movement to improve food safety, save jobs and protect
the marine environment.
We will take our audience on a global journey. Preserving species, thriving fishermen, and
feeding the world are all possible. This film spells out to consumers where their fish comes from,
who is catching it, and how it lands on their plate. But it goes even further. To show how and why
we must change the way we currently supply seafood in the United States today. […]
Green project 3:
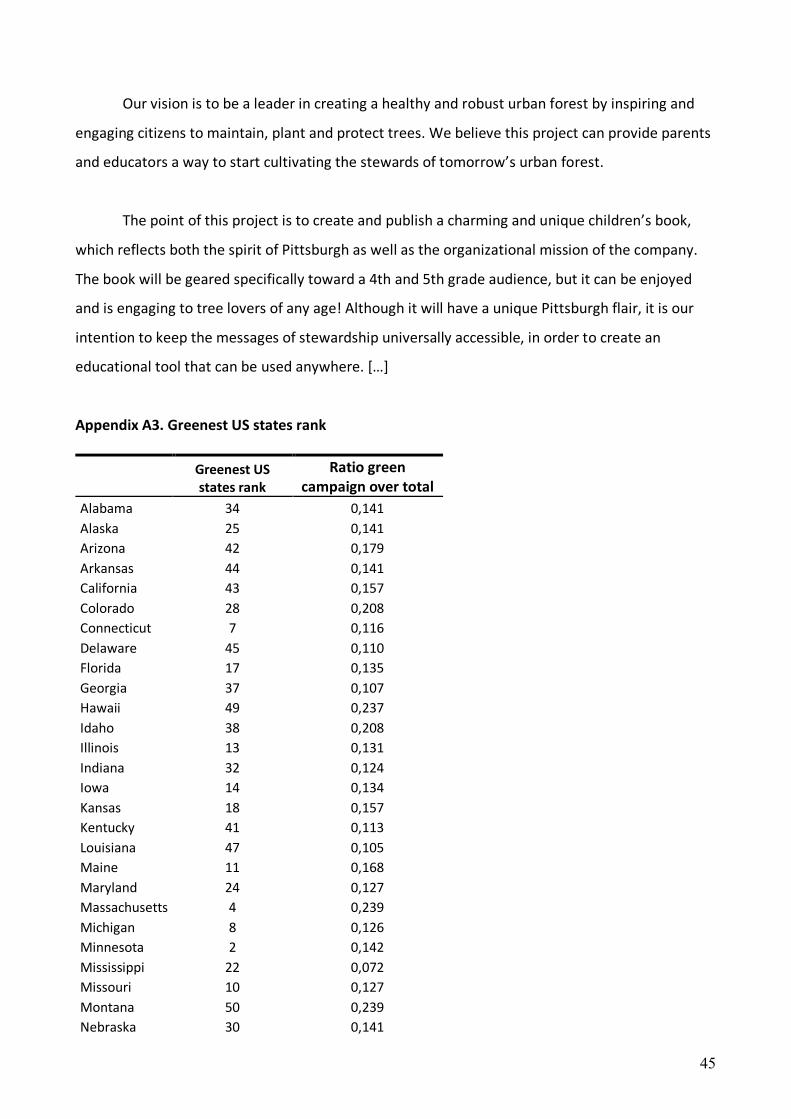
45
Our vision is to be a leader in creating a healthy and robust urban forest by inspiring and
engaging citizens to maintain, plant and protect trees. We believe this project can provide parents
and educators a way to start cultivating the stewards of tomorrow’s urban forest.
The point of this project is to create and publish a charming and unique children’s book,
which reflects both the spirit of Pittsburgh as well as the organizational mission of the company.
The book will be geared specifically toward a 4th and 5th grade audience, but it can be enjoyed
and is engaging to tree lovers of any age! Although it will have a unique Pittsburgh flair, it is our
intention to keep the messages of stewardship universally accessible, in order to create an
educational tool that can be used anywhere. […]
Appendix A3. Greenest US states rank
Greenest US states rank
Ratio green campaign over total
Alabama 34 0,141 Alaska 25 0,141 Arizona 42 0,179 Arkansas 44 0,141 California 43 0,157 Colorado 28 0,208 Connecticut 7 0,116 Delaware 45 0,110 Florida 17 0,135 Georgia 37 0,107 Hawaii 49 0,237 Idaho 38 0,208 Illinois 13 0,131 Indiana 32 0,124 Iowa 14 0,134 Kansas 18 0,157 Kentucky 41 0,113 Louisiana 47 0,105 Maine 11 0,168 Maryland 24 0,127 Massachusetts 4 0,239 Michigan 8 0,126 Minnesota 2 0,142 Mississippi 22 0,072 Missouri 10 0,127 Montana 50 0,239 Nebraska 30 0,141
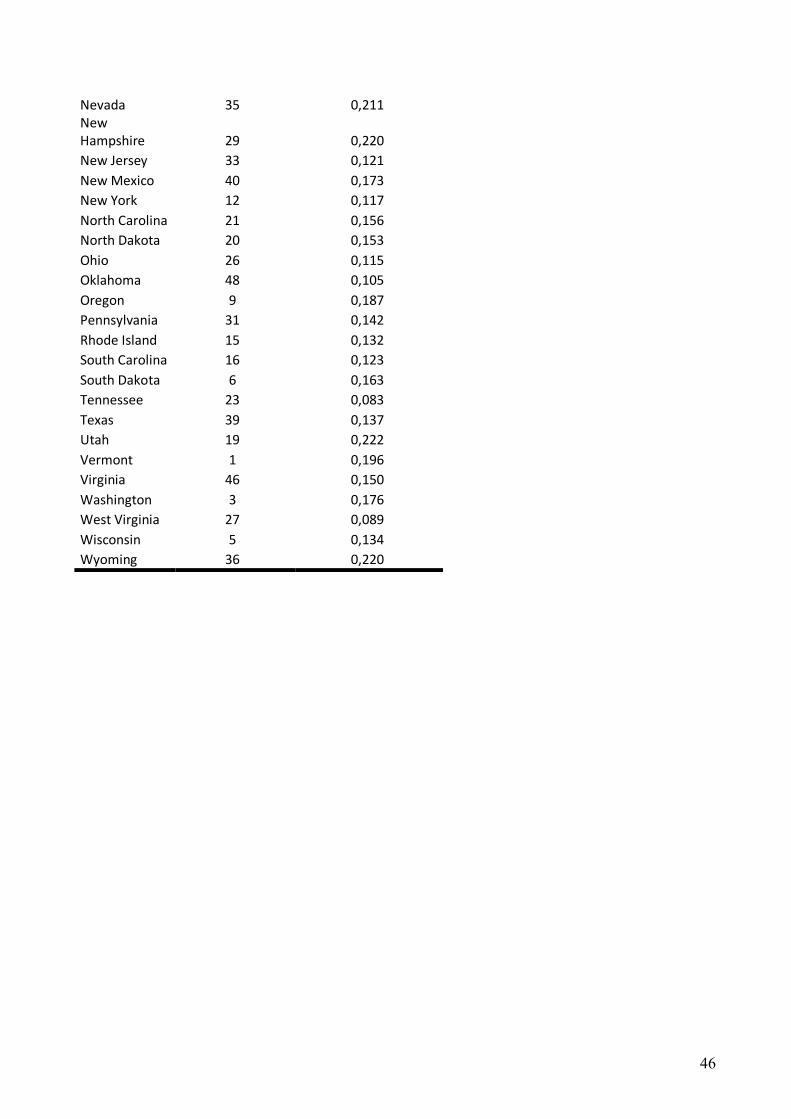
46
Nevada 35 0,211 New Hampshire 29 0,220 New Jersey 33 0,121 New Mexico 40 0,173 New York 12 0,117 North Carolina 21 0,156 North Dakota 20 0,153 Ohio 26 0,115 Oklahoma 48 0,105 Oregon 9 0,187 Pennsylvania 31 0,142 Rhode Island 15 0,132 South Carolina 16 0,123 South Dakota 6 0,163 Tennessee 23 0,083 Texas 39 0,137 Utah 19 0,222 Vermont 1 0,196 Virginia 46 0,150 Washington 3 0,176 West Virginia 27 0,089 Wisconsin 5 0,134 Wyoming 36 0,220