greenhouse gas emissions and fossil energy use from small
TRANSCRIPT

Greenhouse gas emissions and fossil energy use from small ruminant supply chains
Guidelines for assessment
http://www.fao.org/partnerships/leap
VERSION 1
MJ733-E


VERSION 1
Greenhouse gas emissions and fossil energy use from small ruminant supply chains
Guidelines for assessment

The designations employed and the presentation of material in this informationproduct do not imply the expression of any opinion whatsoever on the part of theFood and Agriculture Organization of the United Nations (FAO) concerning the legalor development status of any country, territory, city or area or of its authorities, orconcerning the delimitation of its frontiers or boundaries. The mention of specificcompanies or products of manufacturers, whether or not these have been patented,does not imply that these have been endorsed or recommended by FAO in preferenceto others of a similar nature that are not mentioned.
The views expressed in this information product are those of the author(s) and do notnecessarily reflect the views or policies of FAO.
ISBN 978-92-5-109500-3
© FAO, 2016
FAO encourages the use, reproduction and dissemination of material in this informationproduct. Except where otherwise indicated, material may be copied, downloaded andprinted for private study, research and teaching purposes, or for use in non-commercialproducts or services, provided that appropriate acknowledgement of FAO as the sourceand copyright holder is given and that FAO’s endorsement of users’ views, products orservices is not implied in any way.
All requests for translation and adaptation rights, and for resale and other commercialuse rights should be made via www.fao.org/contact-us/licence-request or addressed [email protected].
FAO information products are available on the FAO website (www.fao.org/publications)and can be purchased through [email protected]
Recommended CitationFAO. 2016. Greenhouse gas emissions and fossil energy use from small ruminant supply chains: Guidelines for assessment. Livestock Environmental Assessment and Performance Partnership. FAO, Rome, Italy.
These document will be regularly updated. To verify if this version is the most recent, please visit page http://www.fao.org/partnerships/leap/publications/en/

iii
Table of contents
Foreword vii
Acknowledgements ix
Abbreviations and acronyms xiii
Glossary xv
Summary of Recommendations for the LEAP guidance xxxv
PART 1OVERVIEW AND GENERAL PRINCIPLES 1
1. INTENDED USERS AND OBJECTIVES 3
2. SCOPE 4
2.1 Environmental impact categories addressed in the guidelines 4
2.2 Application 4
3. STRUCTURE AND CONVENTIONS 6
3.1 Structure 6
3.2 Presentational conventions 6
4. ESSENTIAL BACKGROUND INFORMATION AND PRINCIPLES 8
4.1 A brief introduction to LCA 8
4.2 Environmental impact categories 8
4.3 Normative references 10
4.4 Non-normative references 10
4.5 Guiding principles 11
5. LEAP AND THE PREPARATION PROCESS 14
5.1 Development of sector-specific guidelines 15
5.2 The Small ruminants TAG and the preparation process 15
5.3 Period of validity 16
6. BACKGROUND INFORMATION ON SMALL RUMINANT SUPPLY CHAINS 17
6.1 Background and context 17
6.2 Diversity of small ruminant production systems 18
6.3 Diversity of small ruminant value chains 20
6.4 Multi-functionality of small ruminant supply chains 21
6.5 Overview of global emissions from small ruminants 21

iv
PART 2METHODOLOGY FOR QUANTIFICATION OF GREENHOUSE GAS EMISSIONS AND FOSSIL ENERGY USE OF SMALL RUMINANT PRODUCTS 23
7. DEFINITION OF PRODUCTS AND PRODUCTION SYSTEMS 25
7.1 Products description 25
7.2 Life cycle stages: modularity 25
8. GOAL AND SCOPE DEFINITION 26
8.1 Goal of the LCA study 26
8.2 Scope of the LCA 26
8.3 Functional unit and reference flows 27
8.4 System boundary 288.4.1 General/scoping analysis 28
8.4.2 Criteria for system boundary 30
8.4.3 Material contribution and threshold 31
8.4.4 Time boundary for data 32
8.4.5 Capital goods 32
8.4.6 Ancillary activities 32
8.4.7 Delayed emissions 33
8.4.8 Carbon offsets 33
8.5 Impact categories 33
9. MULTI-FUNCTIONAL PROCESSES AND ALLOCATION 34
9.1 General principles 34
9.2 A decision tree to guide methodology choices 35
9.3 Application of general principles for small ruminant systems and processes 389.3.1 Cradle to farm gate 38
9.3.2 Allocation of manure exported off-farm 40
9.3.3 Primary processing 41
10. COMPILING AND RECORDING INVENTORY DATA 42
10.1 General principles 42
10.2 Requirements and guidance for the collection of data 4310.2.1 Requirements and guidance for the collection of primary data 44
10.2.2 Requirements and guidance for the collection and use of secondary data 45
10.2.3 Approaches for addressing data gaps in LCI 46
10.3 Data quality assessment 4710.3.1 Data quality rules 47
10.3.2 Data quality indicators 47
10.4 Uncertainty analysis and related data collection 4810.4.1 Secondary activity data 48
10.4.2 Default/proxy data 48
10.4.3 Inter- and intra-annual variability in emissions 48

v
11. LIFE CYCLE INVENTORY 49
11.1 Overview 49
11.2 Cradle to farm gate 4911.2.1 Feed assessment 49
10.2.1 Animal population and productivity 53
11.2.3 Manure production and management 57
11.2.4 Emissions from other farm-related inputs 59
11.2.5 Multi-functional processes and allocation of GHG emissions between co-products 61
11.3 Transportation 66
11.4 Inclusion and treatment of land-use change 67
11.5 Biogenic and soil carbon sequestration 67
11.6 Primary processing stage 6711.6.1 Milk processing 68
11.6.2 Fibre processing 70
11.6.3 Meat processing 71
11.6.4 On-site energy generation 74
12. INTERPRETATION OF LCA RESULTS 75
12.1 Identification of key issues 75
12.2 Characterizing uncertainty 7612.2.1 Monte Carlo Analysis 76
12.2.2 Sensitivity analysis 77
12.2.3 Normalization 77
12.3 Conclusions, recommendations and limitations 77
12.4 Use and comparability of results 78
12.5 Good practice in reporting LCA results 78
12.6 Report elements and structure 78
12.7 Critical review 79
REFERENCES 80
APPENDICES 87
APPENDIX 1: GREENHOUSE GAS EMISSIONS FROM SMALL RUMINANTS: A REVIEW OF EXISTING METHODOLOGIES AND GUIDELINES 89
APPENDIX 2: SMALL RUMINANTS - MAIN PRODUCING COUNTRIES 94
APPENDIX 3: SUMMARY OF CARCASS WEIGHT: LIVE WEIGHT RATIOS (AS PERCENTAGES) FOR GOATS AND SHEEP FOR DIFFERENT REGIONS 96
APPENDIX 4: AVERAGE SHEEP FLOCK AND GOAT HERD PARAMETERS FOR DIFFERENT REGIONS OF THE WORLD 98
APPENDIX 5: CALCULATION OF ENTERIC METHANE EMISSIONS FROM ANIMAL ENERGY REQUIREMENTS 99


vii
Foreword
The methodology developed in these draft guidelines aims to introduce a harmonized international approach to the assessment of the environmental performance of small ruminant supply chains in a manner that takes account of the specificity of the vari-ous production systems involved. It aims to increase understanding of small ruminant supply chains and help improve their environmental performance. The guidelines are a product of the Livestock Environmental Assessment and Performance (LEAP) Partnership, a multi-stakeholder initiative whose goal is to improve the environmen-tal sustainability of the livestock sector through better metrics and data.
The small ruminant1 sector is of worldwide importance. It comprises a wide diver-sity of systems that provide a variety of products and functions. In 2011, sheep and goats produced more than 5 million tonnes of meat and 24 million tonnes of milk. Production has increased by 1.7 percent and 1.3 percent per year, respectively, during the past 20 years (FAO, 2013). This increase was driven mainly by developing coun-tries in Africa and Asia. However, Oceania (mainly for meat) and Europe still con-tribute significantly to production. Production systems can vary from intensive sys-tems, in which animals are partially or predominantly housed, to extensive systems that rely on grazing and native forages, and transhumance systems that involve large flock movements. Products are not restricted to meat and milk; sheep are also valued for their wool (more than 2 million tonnes of greasy wool was produced in 2011), and goats for their mohair and cashmere. Small ruminants also play a crucial role in sustaining livelihoods in traditional, small-scale, rural and family-based production systems. Across the small ruminant sector, there is strong interest in measuring and improving environmental performance.
In the development of these draft guidelines, the following objectives were re-garded as key:
• to develop a harmonized, science-based approach founded on a consensus among the sector’s stakeholders;
• to recommend a scientific, but at the same time practical, approach that builds on existing or developing methodologies;
• to promote an approach to assessment suitable for a wide range of small rumi-nant supply chains; and
• to identify the principal areas where ambiguity or differing views exist as to the right approach.
These guidelines underwent a public review. The purpose of the review was to strengthen the advice provided and ensure it meets the needs of those seeking to im-prove performance through sound assessment practice. The present document is not intended to remain static. It will be updated and improved as the sector evolves and more stakeholders become involved in LEAP, and as new methodological frame-works and data become available. The development and inclusion of guidance on the evaluation of additional environmental impacts is viewed as a critical next step.
1 Small ruminants include goats, sheep, cervids and new world camelids (llamas and alpacas). These guidelines focus on goats and sheep. Potential application to other small ruminant species is discussed in Section 2.2 and 10.2.3.

viii
The strength of the guidelines developed within the LEAP Partnership for the various livestock subsectors stems from the fact that they represent a coordinated cross-sectoral and international effort to harmonize measurement approaches. Ide-ally, harmonization will lead to greater understanding, transparent application and communication of metrics, and, importantly for the sector, real and measurable im-provement in performance.
Rogier Schulte, Teagasc - The Agriculture and Food Development Authority, Government of Ireland (2015 LEAP chair)
Lalji Desai, World Alliance of Mobile Indigenous People (2014 LEAP chair)Frank Mitloehner, University of California, Davis (2013 LEAP chair)Henning Steinfeld, Food and Agriculture Organization of the United Nations,
(LEAP co-chair)

ix
Acknowledgements
AUTHORSHIP AND DEVELOPMENT PROCESSThese guidelines are a product of the LEAP Partnership. Three groups contributed to their development: an ad hoc Technical Advisory Group (TAG), the LEAP Sec-retariat and the LEAP Steering Committee.
The TAG on small ruminants conducted the background research and devel-oped the core technical content of the guidelines. The small ruminants TAG was composed of: Stewart Ledgard (TAG leader, AgResearch, New Zealand), Bever-ley Henry (Queensland University of Technology, Australia), Marc Benoit (French National Institute for Agricultural Research, France), C. Devendra (Independent Consultant, Malaysia), Jean-Baptiste Dollé and Armelle Gac (Institut de l’Elevage, France), Christopher Lloyd (Organisation for the English beef and sheep industry, EBLEX, UK) and Hans-Peter Zerfas (World Vision, Germany).
The LEAP Secretariat coordinated and facilitated the work of the TAG, guided and contributed to the content development and ensured coherence among the vari-ous guidelines. The LEAP secretariat, hosted at the Food and Agriculture Organi-zation (FAO) of the United Nations was composed of: Pierre Gerber (Coordina-tor); Alison Watson (LEAP Manager until Dec 2013), Camillo De Camillis (LEAP manager since Feb 2014), Carolyn Opio (Technical officer), Félix Teillard (Techni-cal officer) and Aimable Uwizeye (Technical officer).
The LEAP Secretariat coordinated and facilitated the work of the TAG, guided and contributed to content development and ensured coherence among the various guidelines. The LEAP secretariat, hosted at FAO, was composed of: Pierre Ger-ber (Coordinator), Alison Watson (LEAP Manager until Dec 2013), Camillo De Camillis (LEAP manager since Feb 2014), Carolyn Opio (Technical officer), Félix Teillard (Technical officer) and Aimable Uwizeye (Technical officer).
The LEAP Steering Committee provided overall guidance for the activities of the Partnership and helped review and cleared the guidelines for public release. During development of the guidelines the LEAP Steering Committee was composed of:
Steering committee membersMonikka Agarwal (World Alliance of Mobile Indigenous People, in LEAP since Oct 2014), Douglas Brown (World Vision), Giuseppe Luca Capodieci (The European Livestock And Meat Trading Union, International Meat Secretariat), Camillo De Camillis (FAO, LEAP manager since Feb 2014), Richard de Mooij (The European Livestock And Meat Trading Union, International Meat Secretariat), Elsa Delcom-bel (Government of France), Lalji Desai (World Alliance of Mobile Indigenous Peo-ple, 2014 LEAP Chair), Pierre Gerber (FAO, LEAP secretariat coordinator until Jan 2015), Mathias Ginet (Government of France, in LEAP since Oct 2014), Jan Grenz (Bern University of Applied Sciences, Government of Switzerland, in LEAP un-til Mar 2014), Vincent Guyonnet (International Egg Commission), Dave Harrison (International Meat Secretariat), Matthew Hooper (Government of New Zealand), Hsin Huang (International Meat Secretariat), Delanie Kellon (International Dairy

x
Federation), Lionel Launois (Government of France), Pablo Manzano (International Union for Conservation of Nature), Nicolas Martin (European Feed Manufactur-ers’ Federation, The International Feed Industry Federation), Ian McConnel (World Wide Fund for Nature, in LEAP since Jan 2015), Paul Melville (Government of New Zealand), Paul McKiernan (Government of Ireland), Frank Mitloehner (University of California, Davis, The International Feed Industry Federation, 2013 LEAP Chair), Anne-Marie Neeteson-van Nieuwenhoven (International Poultry Council), Frank O’Mara (Teagasc - The Agriculture and Food Development Authority, Government of Ireland), Antonio Onorati (International Planning Committee for World Food Sovereignty) Carolyn Opio (FAO, LEAP secretariat coordinator since Jan 2015), Lara Sanfrancesco (International Poultry Council), Fritz Schneider (Bern University of Applied Sciences, Government of Switzerland, in LEAP until Feb 2015), Rogier Schulte (Teagasc - The Agriculture and Food Development Authority, Govern-ment of Ireland, 2015 LEAP chair), Henning Steinfeld (FAO, LEAP Partnership co-chair), Nico van Belzen (International Dairy Federation), Elsbeth Visser (Gov-ernment of the Netherlands), Alison Watson (FAO, LEAP manager until Dec 2013), Bryan Weech (World Wide Fund for Nature, in LEAP until 2014), Geert Westen-brink (Government of the Netherlands) and Hans-Peter Zerfas (World Vision).
Observers and advisersAlejandro Acosta (FAO, Global Agenda For Sustainable Livestock, in LEAP since Feb 2015), Rudolph De Jong (International Wool Textile Organization, in LEAP until Oct 2014), Jeroen Dijkman (FAO, Global Agenda For Sustainable Livestock, in LEAP until Jan. 2015), Matthias Finkbeiner (International Organization for Standardization), Neil Fraser (FAO, Global Agenda For Sustainable Livestock), Michele Galatola (European Commission, Directorate-General for Environment), James Lomax (United Nations Environment Programme), Llorenç Milà i Canals (United Nations Environment Programme), Paul Pearson (International Council of Tanners, in LEAP since Feb 2015), Erwan Saouter (European Commission, Joint Research Centre), Sonia Valdivia (United Nations Environment Programme), and Elisabeth van Delden (International Wool Textile Organization).
Although not directly responsible for the preparation of these guidelines, the LEAP TAGs on feed and poultry indirectly contributed to this technical document.
MULTI-STEP REVIEW PROCESSThe initial draft guidelines developed by the TAG over 2013 went through an exter-nal peer review before being revised and submitted for public review.
Laura Drauker (World Resource Institute), Christel Cederberg (SIK and Chalm-ers University of Technology, Gothenburg) John Kazer (Carbon Trust, London) peer reviewed these guidelines in late 2013. The LEAP Secretariat reviewed this technical guidance before its submission for both external peer review and pub-lic review. The LEAP Steering Committee also reviewed the guidelines at various stages of their development and provided additional feedback before clearing their release for public review.
The public review was announced at the 1st Annual Meeting of the LEAP Part-nership on 6 March 2014 and lasted until 31 July 2014. The review period was also announced to the public through an article published on the FAO website. The sci-entific community working on the accounting of greenhouse gas (GHG) emissions

xi
from livestock was alerted through the Livestock and Climate Change Mitigation in Agriculture Discussion group on the forum of the Mitigation of Climate Change in Agriculture (MICCA) Programme. Experts in life cycle assessment (LCA) were in-formed through an issue of the United Nations Environment Programme (UNEP)/Society for Environmental Toxicology and Chemistry (SETAC) Life Cycle Initia-tive newsletter and through announcements and reminders circulated via the mail-ing list on LCA held by PRé Consultants. The LEAP Secretariat also publicized the 2014 LEAP public review through oral speeches in the Product Environmental Footprint (PEF) World Forum and other regional conferences. The following have participated in the public review and hence contributed to improving the quality of this technical document: Tim McAllister and Sarah Meale (Agriculture and Agri-Food Canada), Bo Weidema (2.-0 LCA consultants, Denmark), Sebastian Gollnow (PE International, New Zealand), Florence Scarsi on behalf of the French Ministry of Ecology, Sustainable Development and Energy, Adrian Leip, Hanna Tuomisto, Luca Zampori, Erwin Schau, Erwan Saouter and David Pennington (European Commission, Joint Research Centre) and Christine Walsh (EBLEX, UK).
SPONSORS, ADVISORY AND NETWORKINGFAO is very grateful for all valuable contributions provided at various levels by LEAP partners.
Particular gratitude goes to the following countries that have continually sup-ported the Partnership through funding and often in-kind contributions: France, Ireland, the Netherlands, New Zealand, and Switzerland.
Particularly appreciated were the in-kind contributions from the following civil society organizations and non-governmental organizations represented in the Steering Committee: the International Planning Committee for Food Sovereignty, the International Union for Conservation of Nature, The World Alliance of Mobile Indigenous People, World Vision and the World Wildlife Fund.
The following international organizations and companies belonging to the LEAP private sector cluster also played a major role by actively supporting the project via funding and/or in-kind contributions: the International Dairy Federation (IDF), the International Egg Commission, the International Feed Industry Federation, the International Meat Secretariat, the International Poultry Council, the International Council of Tanners, the International Wool and Textile Organization, FEDIOL, the International Federation for Animal Health, DSM Nutritional Products AG and Novus International.
Substantial in-kind contribution came from FAO staff and the MICCA Pro-gramme.
Last but not least, the LEAP Partnership is also grateful for the advisory pro-vided by the International Organization for Standardization (ISO), UNEP, and the European Commission, and is glad to network with World Organisation for Ani-mal Health and the Global Agenda for Sustainable Livestock.


xiii
Abbreviations and acronyms
BSI British Standards InstitutionCFP Carbon footprint of a productCO2e Carbon dioxide equivalentdLUC direct Land-Use ChangeDM Dry MatterECM Energy-Corrected MilkFAO Food and Agriculture Organization of the United NationsGHG Greenhouse GasGWP Global Warming PotentialIDF International Dairy FederationILCD International Reference Life Cycle Data SystemiLUC Indirect Land-Use ChangeIPCC Intergovernmental Panel on Climate ChangeISO International Organization for StandardizationLCA Life Cycle AssessmentLCI Life Cycle InventoryLCIA Life Cycle Impact AssessmentLEAP Livestock Environmental Assessment and Performance PartnershipLUC Land-Use ChangeLW Live WeightME Metabolizable EnergyPAS Publicly Available SpecificationPCR Product Category RulesPEF Product Environmental FootprintPDF Probability Density FunctionsSETAC Society for Environmental Toxicology and Chemistry TAG Technical Advisory GroupUNEP United Nations Environment ProgrammeUNFCCC United Nations Framework Convention on Climate ChangeWBCSD World Business Council for Sustainable DevelopmentWRI World Resource InstituteVS Volatile solids


xv
Glossary
Terms relating to feed and food supply chains
Annual forage Forage established annually, usually with annual plants, and generally involves soil disturbance, removal of existing vegeta-tion, and other cultivation practices.
Animal by-product
Livestock production output classified in the European Union in three categories mostly due to the risk associated to the bo-vine spongiform encephalopathy.
Cold chain Refers to a system for distributing products in which the goods are constantly maintained at low temperatures (e.g. cold or frozen storage and transport), as they move from pro-ducer to consumer.
Combined heat and power (CHP)
Simultaneous generation in one process of useable thermal en-ergy together with electrical and/or mechanical energy.
Compound feed/concentrate
Mixtures of feed materials that may contain additives for use as animal feed in the form of complete or complementary feed-stuffs.
Conserved forage
Conserved forage saved for future use. Forage can be con-served in situ (e.g. stockpiling) or harvested, preserved and stored (e.g. hay, silage or haylage).
Cropping Land on which the vegetation is dominated by large-scale pro-duction of crops for sale (e.g. maize, wheat, and soybean pro-duction).
Crop product Product from a plant, fungus or algae cultivation system that can either be used directly as feed or as raw material in food or feed processing.
Crop residues Materials left in an agricultural field after the crop has been harvested.
Crop rotation Growing of crops in a seasonal sequence to prevent diseases, maintain soil conditions and optimize yields.

xvi
Cultivation Activities related to the propagation, growing and harvesting of plants including activities to create favourable conditions for their growing.
Retail packaging Containers and packaging that reach consumers.
Feed (feedingstuff)
Any single or multiple materials, whether processed, semi-processed or raw, which is intended to be fed directly to food producing animals.- Codex Alimentarius Code of Practice on Good Animal Feeding CAC/RCP 54 (FAO/WHO Codex Alimentarius Commission, 2008).
Feed additive Any intentionally added ingredient not normally consumed as feed by itself, whether or not it has nutritional value, which af-fects the characteristics of feed or animal products. Note: Micro-organisms, enzymes, acidity regulators, trace ele-ments, vitamins and other products fall within the scope of this definition depending on the purpose of use and method of ad-ministration.- Codex Alimentarius Code of Practice on Good Animal Feed-ing CAC/RCP 54 (FAO/WHO Codex Alimentarius Commis-sion, 2008).
Feed conversion ratio
Measure of the efficiency with which an animal converts feed into tissue, usually expressed in terms of kg of feed per kg of output (e.g. live weight or protein).
Feed digestibility Determines the relative amount of ingested feed that is actu-ally absorbed by an animal and therefore the availability of feed energy or nutrients for growth, reproduction, etc.
Feed ingredient A component part or constituent of any combination or mix-ture making up a feed, whether or not it has a nutritional value in the animal’s diet, including feed additives. Ingredients are of plant, animal or aquatic origin, or other organic or inorganic substances- Codex Alimentarius Code of Practice on Good Animal Feeding CAC/RCP 54 (FAO/WHO Codex Alimentarius Commission, 2008).
Fodder Harvested forage fed intact to livestock, which can include fresh and dried forage.
Forage crop Crops, annual or biennial, grown to be used for grazing or harvested as a whole crop for feed.

xvii
Medicated feed Any feed that contains veterinary drugs as defined in the Co-dex Alimentarius Commission Procedural Manual.- Codex Alimentarius Code of Practice on Good Animal Feeding CAC/RCP 54 (FAO/WHO Codex Alimentarius Commission, 2008).
Natural or cross ventilation
Limited use of fans for cooling; frequently a building’s sides can be opened to allow air circulation.
Natural pasture Natural ecosystem dominated by indigenous or naturally oc-curring grasses and other herbaceous species used mainly for grazing by livestock and wildlife.
Packing Process of packing products in the production or distribution stages.
Production unit A group of activities (and the necessary inputs, machinery and equipment) in a processing facility or a farm that are needed to produce one or more co-products. Examples are the crop fields in an arable farm, the potential multiple animal herds that are common in smallholder operations (sheep, goats deer, dairy cattle, suckling cattle or even rearing of heifers, produc-tion of milk, etc.), or the individual processing lines in a manu-facturing facility.
Repackaging facility
A facility where products are repackaged into smaller units without additional processing in preparation for retail sale.
Raw material Primary or secondary material used to produce a product.
Secondary packaging materials
Additional packaging, not contacting the product, which may be used to contain relatively large volumes of primary pack-aged products or transport the product safely to its retail or consumer destination.
Silage Forage harvested and preserved (at high moisture contents generally greater than 500 g per kg) by organic acids produced during partial anaerobic fermentation.
Volatile solids Volatile solids (VS) are the organic material in livestock ma-nure and consist of both biodegradable and non-biodegrad-able fractions. VS is measured as the fraction of sludge com-busted at 550 degrees Celsius after 2 hours.

xviii
Terms relating to small ruminant supply chains
Abbatoir An animal slaughterhouse.
Browse A general term applied to shrubs or trees that are fed on by goats by picking mouthfuls as they move.
Carcass The body after slaughter from which the viscera, skin and head, and some other parts have been removed.
Cashmere Fine fibre from the Cashmere goat.
Cull To reduce the size of a herd or flock by selling or killing a pro-portion of its members.
Doe Mature female goat.
Ewe Mature female sheep usually over 2 years of age.
Graze To feed directly on growing grass, pasturage or forage crops.
Greasy fibre Untreated fibre straight off an animal (e.g. raw wool, cashmere or mohair).
Hogget Young sheep between a lamb and an adult sheep (a two-tooth from approximately 10–16 months of age).
Kid Young male or female goat.
Lamb A young sheep from birth up until it is classified as a hogget, at approximately 12 months of age, although there is no specific age or time for this change.
Lanolin Also called wool fat. A yellowish viscous substance extracted from wool, consisting of a mixture of esters of fatty acids; used in some ointments.
Mohair Fine, hairy fibre produced by an Angora goat.
Offal The internal organs of the body removed from the butchered animal (not included in a carcass).
Retail cuts Cuts of meat for retail sale (e.g. breast/thigh meat, wings, livers).
Ram An uncastrated (entire) male sheep.
Rendering A process that converts animal tissue and blood into stable, value-added materials.

xix
Replacement rate The percentage of adult animals in the herd replaced by younger adult animals.
Ruminant Any of various even-toed, hoofed mammals of the suborder Ruminantia. Ruminants usually have a stomach divided into four compartments (one of which is called a rumen), and chew a cud consisting of regurgitated, partially digested food. Ru-minants include cattle, sheep, goats, deer, giraffes, antelopes and camels.
Scouring Treating textiles in aqueous or other media to remove natural fats, waxes, proteins and other constituents, as well as dirt, oil and other impurities.
Tallow Rendered fat.
Weaning Removal of lambs or kids from their mothers, usually at about 10–16 weeks.
Wool The outer coat of sheep consisting of short curly hairs.
Terms relating to environmental accounting and environmental assessment
Acidification Impact category that addresses impacts due to acidifying sub-stances in the environment. Emissions of nitrogen oxides (NOx), ammonia (NH3) and sulphur oxides (SOx) lead to releases of hy-drogen ions (H+) when the gases are mineralised. The protons contribute to the acidification of soils and water when they are released in areas where the buffering capacity is low. Acidifica-tion may result to forest decline and lake acidification.- Adapted from: Product Environmental Footprint (PEF) Guide (European Commission, 2013)
Activity data Data on the magnitude of human activity resulting in emis-sions or removals taking place during a given period of time (UNFCCC, n.d.).
Allocation Partitioning the input or output flows of a process or a prod-uct system between the product system under study and one or more other product systems.- ISO 14044:2006, 3.17 (ISO, 2006c)
Anthropogenic Relating to, or resulting from the influence of human beings on nature.

xx
Attributional modelling approach
System modelling approach in which inputs and outputs are attributed to the functional unit of a product system by linking and/or partitioning the unit processes of the system according to a normative rule.- Global Guidance Principles for Life Cycle Assessment Data-bases (UNEP/SETAC Life Cycle Initiative, 2011)
Background system
The background system consists of processes on which no or, at best, indirect influence may be exercised by the decision-maker for which an LCA is carried out. Such processes are called “background processes.”- Global Guidance Principles for Life Cycle Assessment Data-bases (UNEP/SETAC Life Cycle Initiative, 2011)
Biogenic carbon Carbon derived from biomass.- ISO/TS 14067:2013, 3.1.8.2 (ISO, 2013a)
Biomass Material of biological origin excluding material embedded in geological formations and material transformed to fossilized material, and excluding peat.- ISO/TS 14067:2013, 3.1.8.1 (ISO, 2013a)
Capital goods Capital goods are final products that have an extended life and are used by the company to manufacture a product; provide a service; or sell, store, and deliver merchandise. In financial ac-counting, capital goods are treated as fixed assets or as plant, property, and equipment. Examples of capital goods include equipment, machinery, buildings, facilities, and vehicles.- Technical Guidance for Calculating Scope 3 Emissions, Chap-ter 2 (WRI and WBCSD, 2011b)
Carbon dioxide equivalent (CO2e)
Unit for comparing the radiative forcing of a greenhouse gas (GHG) to that of carbon dioxide.- ISO/TS 14067:2013, 3.1.3.2 (ISO, 2013a)
Carbon footprint of a product (CFP)
Sum of greenhouse gas emissions and removals in a product system, expressed as CO2 equivalents and based on a life cycle assessment using the single impact category of climate change.- ISO/TS 14067:2013, 3.1.1.1 (ISO, 2013a)
Carbon storage Carbon removed from the atmosphere and stored as carbon.- ISO 16759:2013, 3.1.4 (ISO, 2013b)

xxi
Characterization Calculation of the magnitude of the contribution of each clas-sified input/output to their respective impact categories, and aggregation of contributions within each category. This re-quires a linear multiplication of the inventory data with char-acterization factors for each substance and impact category of concern. For example, with respect to the impact category ‘cli-mate change’, CO2 is chosen as the reference substance and kg CO2-equivalents as the reference unit.- Adapted from: Product Environmental Footprint (PEF) Guide (European Commission, 2013)
Characterization factor
Factor derived from a characterization model that is applied to convert an assigned life cycle inventory analysis result to the common unit of the category indicator.- ISO 14044:2006, 3.37 (ISO, 2006c)
Classification Assigning the material/energy inputs and outputs tabulated in the Life Cycle Inventory (LCI) to impact categories accord-ing to each substance’s potential to contribute to each of the impact categories considered.- Adapted from: Product Environmental Footprint (PEF) Guide (European Commission, 2013)
Combined production
A multi-functional process in which production of the vari-ous outputs can be independently varied. For example, in a backyard system the number of poultry and swine can be set independently.
Comparative assertion
Environmental claim regarding the superiority or equivalence of one product versus a competing product that performs the same function.- ISO 14044:2006, 3.6 (ISO, 2006c)
Comparison A comparison of two or more products regarding the results of their life cycle assessment as according to these guidelines and not including a comparative assertion.
Consequential data modelling
System modelling approach in which activities in a product system are linked so that activities are included in the product system to the extent that they are expected to change as a consequence of a change in demand for the functional unit.- Global Guidance Principles for Life Cycle Assessment Databases (UNEP/SETAC Life Cycle Initiative, 2011)

xxii
Consumable Ancillary input that is necessary for a process to occur but that does not form a tangible part of the product or co-products arising from the processNote 1: Consumables differ from capital goods in that they have an expected life of one year or less, or a need to replenish on a one year or less basis (e.g. lubricating oil, tools and other rapidly wearing inputs to a process).Note 2: Fuel and energy inputs to the life cycle of a product are not considered to be consumables.- PAS 2050:2011, 3.10 (BSI, 2011)
Co-production A generic term for multifunctional processes; either com-bined- or joint-production.
Co-products Any of two or more products coming from the same unit pro-cess or product system.- ISO 14044:2006, 3.10 (ISO, 2006c)
Cradle to gate Life-cycle stages from the extraction or acquisition of raw ma-terials to the point at which the product leaves the organiza-tion undertaking the assessment.- PAS 2050:2011, 3.13 (BSI, 2011)
Critical review Process intended to ensure consistency between a LCA and the principles and requirements of the international standards on LCA.- ISO 14044:2006, 3.45 (ISO, 2006c)
Critical review report
Documentation of the critical review process and findings, in-cluding detailed comments from the reviewer(s) or the criti-cal review panel, as well as corresponding responses from the practitioner of the LCA study.- ISO 14044:2006, 3.7 (ISO, 2006c)
Cut-off criteria Specification of the amount of material or energy flow or the level of environmental significance associated with unit pro-cesses or product system to be excluded from a study.- ISO 14044:2006, 3.18 (ISO, 2006c)
Data quality Characteristics of data that relate to their ability to satisfy stat-ed requirements.- ISO 14044:2006, 3.19 (ISO, 2006c)

xxiii
Dataset (both LCI dataset and LCIA dataset)
A document or file with life cycle information of a specified product or other reference (e.g. site, process), covering de-scriptive metadata and quantitative. life cycle inventory and/or life cycle impact assessment data, respectively.- International Reference Life Cycle Data System (ILCD) Handbook: General guide for Life Cycle Assessment - Detailed guidance (European Commission, 2010b).
Delayed emissions
Emissions that are released over time, e.g. through prolonged use or final disposal stages, versus a single, one-time emission.- Adapted from: Product Environmental Footprint (PEF) Guide (European Commission, 2013)
Direct Land-Use Change (dLUC)
Change in human use or management of land within the prod-uct system being assessed.- ISO/TS 14067:2013, 3.1.8.4 (ISO, 2013a)
Direct energy Energy used on farms for livestock production activities (e.g. lighting, heating).
Downstream Occurring along a product supply chain after the point of re-ferral.- Product Environmental Footprint (PEF) Guide (European Commission, 2013)
Drainage basin Area from which direct surface runoff from precipitation drains by gravity into a stream or other water body.Note 1: The terms ‘watershed’, ‘drainage area’, ‘catchment’, ‘catchment area’ or ‘river basin’ are sometimes used for the concept of ‘drainage basin’.Note 2: Groundwater drainage basin does not necessarily cor-respond in area to surface drainage basin.Note 3: The geographical resolution of a drainage basin should be determined at the goal and scope stage: it may regroup dif-ferent sub-drainage basins.- ISO 14046:2014, 3.1.8 (ISO, 2014)
Economic value Average market value of a product at the point of production possibly over a 5-year time frame.- Adapted from: PAS 2050:2011, 3.17 (BSI, 2011) Note 1: Where barter is in place, the economic value of the commodity traded can be calculated on the basis of the market value and amount of the commodity exchanged.

xxiv
Eco-toxicity Environmental impact category that addresses the toxic im-pacts on an ecosystem, which damage individual species and change the structure and function of the ecosystem. Eco-toxic-ity is a result of a variety of different toxicological mechanisms caused by the release of substances with a direct effect on the health of the ecosystem.- Adapted from: Product Environmental Footprint (PEF) Guide (European Commission, 2013)
Elementary flow Material or energy entering the system being studied that has been drawn from the environment without previous human transformation, or material or energy leaving the system being studied that is released into the environment without subse-quent human transformation. - ISO 14044:2006, 3.12 (ISO, 2006c)
Emission factor Amount of greenhouse gases emitted, expressed as carbon di-oxide equivalent and relative to a unit of activity (e.g. kg CO2e per unit input)- Adapted from UNFCCC (n.d.). Note: Emission factor data is obtained from secondary data sources.
Emissions Release of substance to air and discharges to water and land.
Environmental impact
Any change to the environment, whether adverse or beneficial, wholly or partially resulting from an organization’s activities, products or services.- ISO/TR 14062:2002, 3.6 (ISO, 2002)
Eutrophication Excess of nutrients (mainly nitrogen and phosphorus) in water or soil, from sewage outfalls and fertilized farmland. In water, eutrophication accelerates the growth of algae and other vegetation in water. The degradation of organic mate-rial consumes oxygen resulting in oxygen deficiency and, in some cases, fish death. Eutrophication translates the quantity of substances emitted into a common measure expressed as the oxygen required for the degradation of dead biomass. In soil, eutrophication favours nitrophilous plant species and modifies the composition of the plant communities.- Adapted from: Product Environmental Footprint (PEF) Guide (European Commission, 2013)

xxv
Extrapolated data
Refers to data from a given process that is used to represent a similar process for which data is not available, on the assump-tion that it is reasonably representative.- Product Environmental Footprint (PEF) Guide (European Commission, 2013)
Final product Goods and services that are ultimately consumed by the end user rather than used in the production of another good or service.- Product Life Cycle Accounting and Reporting Standard (WRI and WBCSD, 2011a)
Foreground system
The foreground system consists of processes which are under the control of the decision-maker for which an LCA is carried out. They are called ‘foreground processes’.- Global Guidance Principles for Life Cycle Assessment Data-bases (UNEP/SETAC Life Cycle Initiative, 2011)
Functional unit Quantified performance of a product system for use as a refer-ence unit.- ISO 14044:2006, 3.20 (ISO, 2006c) It is essential that the functional unit allows comparisons that are valid where the compared objects (or time series data on the same object, for benchmarking) are comparable.
GHG removal Mass of a GHG removed from the atmosphere.- ISO/TS 14067:2013, 3.1.3.6 (ISO, 2013a)
Global Warming Potential (GWP)
Characterization factor describing the radiative forcing impact of one mass-based unit of a given GHG relative to that of car-bon dioxide over a given period of time.- ISO/TS 14067:2013, 3.1.3.4 (ISO, 2013a)
Greenhouse gases (GHGs)
Gaseous constituent of the atmosphere, both natural and an-thropogenic, that absorbs and emits radiation at specific wave-lengths within the spectrum of infrared radiation emitted by the Earth’s surface, the atmosphere and clouds.- ISO 14064-1:2006, 2.1 (ISO, 2006d)
Human toxicity – cancer
Impact category that accounts for the adverse health effects on human beings caused by the intake of toxic substances through inhalation of air, food/water ingestion, penetration through the skin insofar as they are related to cancer.- Product Environmental Footprint (PEF) Guide (European Commission, 2013)

xxvi
Human toxicity – non cancer
Impact category that accounts for the adverse health effects on human beings caused by the intake of toxic substances through inhalation of air, food/water ingestion, penetration through the skin insofar as they are related to non-cancer effects that are not caused by particulate matter/respiratory inorganics or ionizing radiation.- Product Environmental Footprint (PEF) Guide (European Commission, 2013)
Indirect Land-Use Change (iLUC)
Change in the use or management of land which is a conse-quence of direct land-use change, but which occurs outside the product system being assessed.- ISO/TS 14067:2013, 3.1.8.5 (ISO, 2013a)
Impact category Class representing environmental issues of concern to which life cycle inventory analysis results may be assigned.- ISO 14044:2006, 3.39 (ISO, 2006c)
Impact category indicator
Quantifiable representation of an impact category.- ISO 14044:2006, 3.40 (ISO, 2006c)
Infrastructure Synonym for capital good.
Input Product, material or energy flow that enters a unit process.- ISO 14044:2006, 3.21 (ISO, 2006c)
Ionizing radiation, human health
Impact category that accounts for the adverse health effects on human health caused by radioactive releases.- Product Environmental Footprint (PEF) Guide (European Commission, 2013)
Intermediate product
Output from a unit process that is input to other unit pro-cesses that require further transformation within the system.- ISO 14044:2006, 3.23 (ISO, 2006c)
Joint production A multi-functional process that produces various outputs, such as meat and eggs in backyard systems. Production of the different goods cannot be independently varied, or only varied within a very narrow range.
Land occupation Impact category related to use (occupation) of land area by activities such as agriculture, roads, housing and mining.- Adapted from: Product Environmental Footprint (PEF) Guide (European Commission, 2013)

xxvii
Land-use change Change in the purpose for which land is used by humans (e.g. between crop land, grass land, forestland, wetland, industrial land).- PAS 2050:2011, 3.27 (BSI, 2011)
Life cycle Consecutive and interlinked stages of a product system, from raw material acquisition or generation from natural resources to final disposal.- ISO 14044:2006, 3.1 (ISO, 2006c)
Life Cycle Assessment (LCA)
Compilation and evaluation of the inputs, outputs and the po-tential environmental impacts of a product system throughout its life cycle.- ISO 14044:2006, 3.2 (ISO, 2006c)
Life cycle GHG emissions
Sum of GHG emissions resulting from all stages of the life cycle of a product and within the specified system boundaries of the product.- PAS 2050:2011, 3.30 (BSI, 2011)
Life Cycle Impact Assessment (LCIA)
Phase of LCA aimed at understanding and evaluating the mag-nitude and significance of the potential impacts for a product system throughout the life cycle of the product.- Adapted from: ISO 14044:2006, 3.4 (ISO, 2006c)
Life Cycle Inventory (LCI)
Phase of LCA involving the compilation and quantification of inputs and outputs for a product throughout its life cycle.- ISO 14046:2014, 3.3.6 (ISO, 2014)
Life Cycle Interpretation
Phase of life cycle assessment in which the findings of either the inventory analysis or the impact assessment, or both, are evaluated in relation to the defined goal and scope in order to reach conclusions and recommendations.- ISO 14044:2006, 3.5 (ISO, 2006c)
Material contribution
Contribution from any one source of GHG emissions of more than 1% of the anticipated total GHG emissions associated with the product being assessed. Note: A materiality threshold of 1 percent has been established to ensure that very minor sources of life cycle GHG emissions do not require the same treatment as more significant sources.- PAS 2050:2011, 3.31 (BSI, 2011)

xxviii
Multi-functionality
If a process or facility provides more than one function, i.e. if it delivers several goods and/or services (‘co-products’), it is ‘multi-functional’. In these situations, all inputs and emissions linked to the process must be partitioned between the product of interest and the other co-products in a principled manner.- Product Environmental Footprint (PEF) Guide (European Commission, 2013)
Normalization After the characterization step, normalization is an optional step in which the impact assessment results are multiplied by normalization factors that represent the overall inventory of a reference unit (e.g. a whole country or an average citizen). Nor-malized impact assessment results express the relative shares of the impacts of the analysed system in terms of the total contri-butions to each impact category per reference unit. When dis-playing the normalized impact assessment results of the differ-ent impact topics next to each other, it becomes evident which impact categories are affected most and least by the analysed system. Normalized impact assessment results reflect only the contribution of the analysed system to the total impact poten-tial, not the severity/relevance of the respective total impact. Normalized results are dimensionless, but not additive.- Product Environmental Footprint (PEF) Guide (European Commission, 2013)
Offsetting Mechanism for compensating for all or for a part of the carbon footprint of a product through the prevention of the release of, reduction in, or removal of an amount of greenhouse gas emis-sions in a process outside the boundary of the product system.- ISO/TS 14067:2013, 3.1.1.4 (ISO, 2013a)
Output Product, material or energy flow that leaves a unit process.- ISO 14044:2006, 3.25 (ISO, 2006c)
Ozone depletion
Impact category that accounts for the degradation of strato-spheric ozone due to emissions of ozone-depleting substances, for example long-lived chlorine and bromine containing gases (e.g. chlorofluorocarbons, hydrochlorofluorocarbon, Halons).- Product Environmental Footprint (PEF) Guide (European Commission, 2013)
Particulate matter
Impact category that accounts for the adverse health effects on human health caused by emissions of particulate matter (PM) and its precursors (NOx, SOx, NH3)- Product Environmental Footprint (PEF) Guide (European Commission, 2013)

xxix
Photochemical ozone formation
Impact category that accounts for the formation of ozone at the ground level of the troposphere caused by photochemical oxidation of Volatile Organic Compounds (VOCs) and carbon monoxide (CO) in the presence of nitrogen oxides (NOx) and sunlight. High concentrations of ground-level tropospheric ozone damage vegetation, human respiratory tracts and man-made materials through reaction with organic materials.- Product Environmental Footprint (PEF) Guide (European Commission, 2013)
Primary data Quantified value of a unit process or an activity obtained from a direct measurement or a calculation based on direct measure-ments at its original source.- ISO 14046:2014, 3.6.1 (ISO, 2014)
Primary activity data
Quantitative measurement of activity from a product’s life cycle that, when multiplied by the appropriate emission fac-tor, determines the GHG emissions arising from a process. Examples of primary activity data include the amount of en-ergy used, material produced, service provided or area of land affected.- PAS 2050:2011, 3.34 (BSI, 2011)
Product(s) Any goods or service.- ISO 14044:2006, 3.9 (ISO, 2006c)
Product category
Group of products that can fulfil equivalent functions.- ISO 14046:2014, 3.5.9 (ISO, 2014)
Product category rules (PCR)
Set of specific rules, requirements and guidelines for develop-ing Type III environmental declarations for one or more prod-uct categories.- ISO 14025:2006, 3.5 (ISO, 2006a)
Product system Collection of unit processes with elementary and product flows, performing one or more defined functions, and which models the life cycle of a product.- ISO 14044:2006, 3.28 (ISO, 2006c)
Proxy data Data from a similar activity that is used as a stand-in for the given activity. Proxy data can be extrapolated, scaled up, or customized to represent the given activity. For example, using a Chinese unit process for electricity production in an LCA for a product produced in Viet Nam.- Product Life Cycle Accounting and Reporting Standard (Global Protocol, 2011a)

xxx
Reference flow Measure of the outputs from processes in a given product sys-tem required to fulfil the function expressed by the functional unit.- ISO 14044:2006, 3.29 (ISO, 2006c)
Releases Emissions to air and discharges to water and soil.- ISO 14044:2006, 3.30 (ISO, 2006c)
Reporting Presenting data to internal management or external users, such as regulators, shareholders, the general public or specific stakeholder groups.- Adapted from: ENVIFOOD Protocol (Food SCP RT, 2013).
Residue or Residual
Substance that is not the end product (s) that a production pro-cess directly seeks to produce.- Communication from the European Commission 2010/C 160/02 (European Commission, 2010a)More specifically, a residue is any material without economic value leaving the product system in the condition as it created in the process, but which has a subsequent use. There may be value-added steps beyond the system boundary, but these ac-tivities do not impact the product system calculations. Note 1: Materials with economic value are considered products. Note 2: Materials whose economic value is both negligible relative to the annual turnover of the organization, and is also entirely determined by the production costs necessary not to turn such materials in waste streams are to be considered as residues from an environmental accounting perspective.Note 3: Those materials whose relative economic value vola-tility is high in the range of positive and negative value, and whose average value is negative are residues from an envi-ronmental accounting perspective. Materials economic value volatility is possibly calculated over a 5-year time frame at the regional level.
Resource depletion
Impact category that addresses use of natural resources, either renewable or non-renewable, biotic or abiotic.- Product Environmental Footprint (PEF) Guide (European Commission, 2013)
Secondary data Data obtained from sources other than a direct measurement or a calculation based on direct measurements at the original source.- ISO 14046:2014, 3.6.2 (ISO, 2014). Secondary data are used when primary data are not available or it is impractical to obtain primary data. Some emissions, such as methane from litter management, are calculated from a model, and are therefore considered secondary data.

xxxi
Sensitivity analysis
Systematic procedures for estimating the effects of the choices made regarding methods and data on the outcome of a study.- ISO 14044:2006, 3.31 (ISO, 2006c)
Sink Physical unit or process that removes a GHG from the atmo-sphere.- ISO 14064-1:2006, 2.3 (ISO, 2006d)
Soil Organic Matter (SOM)
The measure of the content of organic material in soil. This de-rives from plants and animals and comprises all of the organic matter in the soil exclusive of the matter that has not decayed.- Product Environmental Footprint (PEF) Guide (European Commission, 2013)
System boundary
Set of criteria specifying which unit processes are part of a product system.- ISO 14044:2006, 3.32 (ISO, 2006c)
System expansion
Expanding the product system to include additional functions related to co-products.
Temporary carbon storage
Phenomoneon that occurs when a product “reduces the GHGs in the atmosphere” or creates “negative emissions”, by remov-ing and storing carbon for a limited amount of time.- Product Environmental Footprint (PEF) Guide (European Commission, 2013)
Tier-1 method Simplest method that relies on single default emission factors (e.g. kg methane per animal).
Tier-2 method A more complex approach that uses detailed country-specific data (e.g. gross energy intake and methane conversion factors for specific livestock categories).
Tier-3 method Method based on sophisticated mechanistic models that ac-count for multiple factors such as diet composition, product concentration from rumen fermentation, and seasonal varia-tion in animal and feed parameters.
Uncertainty analysis
Systematic procedure to quantify the uncertainty introduced in the results of a life cycle inventory analysis due to the cu-mulative effects of model imprecision, input uncertainty and data variability.- ISO 14044:2006, 3.33 (ISO, 2006c)

xxxii
Unit process Smallest element considered in the life cycle inventory analysis for which input and output data are quantified.- ISO 14044:2006, 3.34 (ISO, 2006c).
Upstream Occurring along the supply chain of purchased goods/services prior to entering the system boundary.- Product Environmental Footprint (PEF) Guide (European Commission, 2013)
Waste Substances or objects that the holder intends or is required to dispose of.- ISO 14044:2006, 3.35 (ISO, 2006c)Note 1: Deposition of manure on a land where quantity and availability of soil nutrients such as nitrogen and phosphorus exceed plant nutrient requirement is considered as a waste management activity from an environmental accounting per-spective. Derogation is only possible whereas evidences prove that soil is poor in terms of organic matter and there is no other way to build up organic matter. See also: Residual and Economic value.
Water body Entity of water with definite hydrological, hydrogeomorpho-logical, physical, chemical and biological characteristics in a given geographical area (e.g. lakes, rivers, groundwater, seas, icebergs, glaciers and reservoirs).Note 1: In case of availability, the geographical resolution of a water body should be determined at the goal and scope stage: it may regroup different small water bodies.- ISO 14046:2014, 3.1.7 (ISO, 2014)
Water use Use of water by human activity.Note 1: Use includes, but is not limited to, any water withdraw-al, water release or other human activities within the drainage basin impacting water flows and/or quality, including in-stream uses such as fishing, recreation and transportation.Note 2: The term ‘water consumption’ is often used to describe water removed from, but not returned to, the same drain-age basin. Water consumption can be because of evaporation, transpiration, integration into a product, or release into a dif-ferent drainage basin or the sea. Change in evaporation caused by land-use change is considered water consumption (e.g. res-ervoir). The temporal and geographical coverage of the water footprint assessment should be defined in the goal and scope.- ISO 14046:2014, 3.2.1 (ISO, 2014)

xxxiii
Water withdrawal
Anthropogenic removal of water from any water body or from any drainage basin, either permanently or temporarily.- ISO 14046:2014, 3.2.2 (ISO, 2014)
Weighting Weighting is an additional, but not mandatory, step that may support the interpretation and communication of the results of the analysis. Impact assessment results are multiplied by a set of weighting factors, which reflect the perceived relative im-portance of the impact categories considered. Weighted impact assessment results can be directly compared across impact cat-egories, and also summed across impact categories to obtain a single-value overall impact indicator. Weighting requires mak-ing value judgements as to the respective importance of the impact categories considered. These judgements may be based on expert opinion, social science methods, cultural/political viewpoints, or economic considerations.- Adapted from: Product Environmental Footprint (PEF) Guide (European Commission, 2013)


xxxv
Summary of Recommendations for the LEAP guidance
ENVIRONMENTAL PERFORMANCE OF SMALL RUMINANT SUPPLY CHAINS: GUIDELINES FOR QUANTIFICATIONThe methodology developed in these guidelines aims to introduce a harmonised in-ternational approach to the assessment of the environmental performance of small ruminant supply chains in a manner that takes account of the specificity of the various production systems involved. It aims to increase understanding of small ruminant supply chains and to help improve their environmental performance. The guidelines are a product of the Livestock Environmental Assessment and Perfor-mance (LEAP) Partnership, a multi-stakeholder initiative whose goal is to improve the environmental sustainability of the livestock sector through better methods, metrics and data.
The table below summarises the major recommendations of the technical advi-sory group for performance of lifecycle assessment to evaluate environmental per-formance of small ruminant supply chains. It is intended to provide a condensed overview and information on location of specific guidance within the document.
LEAP guidance uses a precise language to indicate which provisions of the guide-lines are requirements, which are recommendations, and which are permissible or allowable options that intended user may choose to follow. The term “shall” is used in this guidance to indicate what is required. The term “should” is used to indicate a recommendation, but not a requirement. The term “may” is used to indicate an option that is permissible or allowable. In addition, as general rule, assessments and guidelines claiming to be aligned with the present LEAP guidelines should flag and justify with reasoning any deviations.
xxxvi
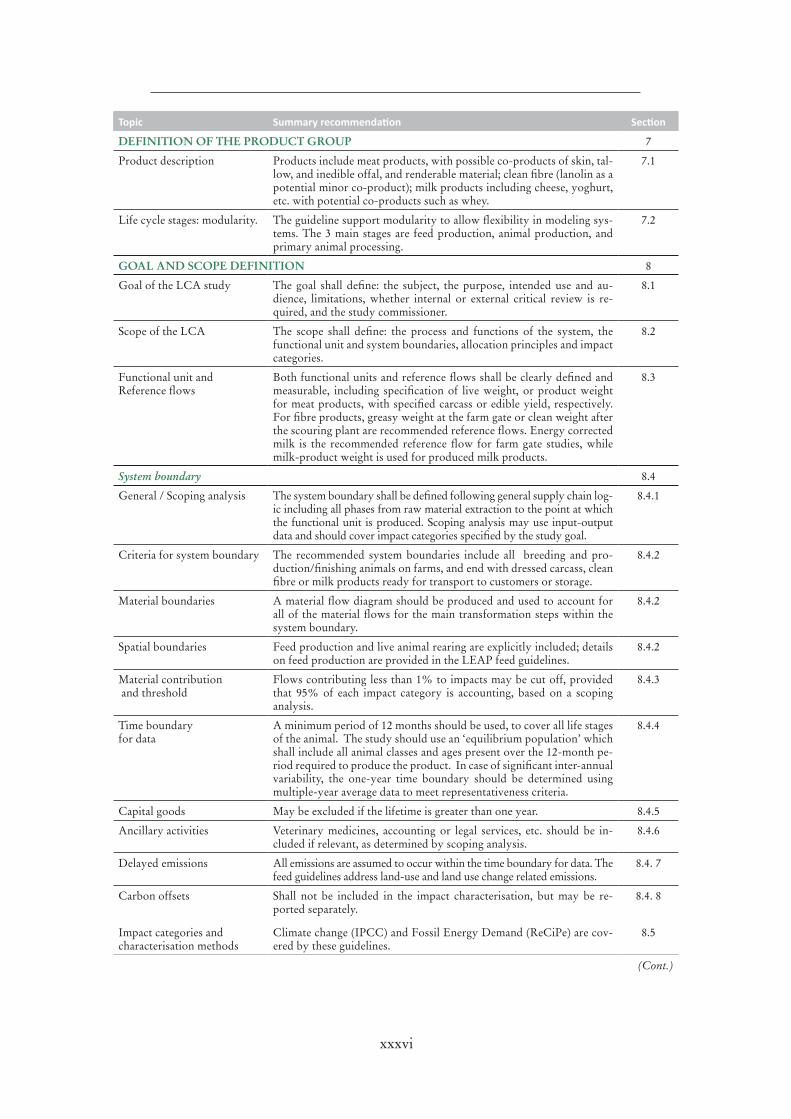
Topic Summary recommendation Section
DEFINITION OF THE PRODUCT GROUP 7
Product description Products include meat products, with possible co-products of skin, tal-low, and inedible offal, and renderable material; clean fibre (lanolin as a potential minor co-product); milk products including cheese, yoghurt, etc. with potential co-products such as whey.
7.1
Life cycle stages: modularity. The guideline support modularity to allow flexibility in modeling sys-tems. The 3 main stages are feed production, animal production, and primary animal processing.
7.2
GOAL AND SCOPE DEFINITION 8
Goal of the LCA study The goal shall define: the subject, the purpose, intended use and au-dience, limitations, whether internal or external critical review is re-quired, and the study commissioner.
8.1
Scope of the LCA The scope shall define: the process and functions of the system, the functional unit and system boundaries, allocation principles and impact categories.
8.2
Functional unit and Reference flows
Both functional units and reference flows shall be clearly defined and measurable, including specification of live weight, or product weight for meat products, with specified carcass or edible yield, respectively. For fibre products, greasy weight at the farm gate or clean weight after the scouring plant are recommended reference flows. Energy corrected milk is the recommended reference flow for farm gate studies, while milk-product weight is used for produced milk products.
8.3
System boundary 8.4
General / Scoping analysis The system boundary shall be defined following general supply chain log-ic including all phases from raw material extraction to the point at which the functional unit is produced. Scoping analysis may use input-output data and should cover impact categories specified by the study goal.
8.4.1
Criteria for system boundary The recommended system boundaries include all breeding and pro-duction/finishing animals on farms, and end with dressed carcass, clean fibre or milk products ready for transport to customers or storage.
8.4.2
Material boundaries A material flow diagram should be produced and used to account for all of the material flows for the main transformation steps within the system boundary.
8.4.2
Spatial boundaries Feed production and live animal rearing are explicitly included; details on feed production are provided in the LEAP feed guidelines.
8.4.2
Material contribution and threshold
Flows contributing less than 1% to impacts may be cut off, provided that 95% of each impact category is accounting, based on a scoping analysis.
8.4.3
Time boundary for data
A minimum period of 12 months should be used, to cover all life stages of the animal. The study should use an ‘equilibrium population’ which shall include all animal classes and ages present over the 12-month pe-riod required to produce the product. In case of significant inter-annual variability, the one-year time boundary should be determined using multiple-year average data to meet representativeness criteria.
8.4.4
Capital goods May be excluded if the lifetime is greater than one year. 8.4.5
Ancillary activities Veterinary medicines, accounting or legal services, etc. should be in-cluded if relevant, as determined by scoping analysis.
8.4.6
Delayed emissions All emissions are assumed to occur within the time boundary for data. The feed guidelines address land-use and land use change related emissions.
8.4. 7
Carbon offsets Shall not be included in the impact characterisation, but may be re-ported separately.
8.4. 8
Impact categories and characterisation methods
Climate change (IPCC) and Fossil Energy Demand (ReCiPe) are cov-ered by these guidelines.
8.5
(Cont.)

xxxvii
Topic Summary recommendation Section
MULTI-FUNCTIONAL PROCESSES AND ALLOCATION 9
General principles Follow ISO 14044 standard (section 4.3.4) – with restrictions on appli-cation of system expansion. The application of consequential modeling is not supported by these guidelines. System expansion may be used in the context of including expanded functionality. For example, calculat-ing whole farm impacts without separately assigning impacts to milk and meat as co-products.
9.1
Methodological choices
Guidance for separation of complicated multifunctional systems and application of bio-physical or economic allocation when process sepa-ration is not feasible. A decision tree is presented to facilitate division of complicated processes into separate production units, and subsequently into individual products.
9.2
Cradle to farm gate
Two situations lead to multi-functionality for assessments with a farm gate boundary: when several species share the same inputs (feed sourc-es, or pasture) and when ruminants produce milk, meat (and inedible co-products), and fibre.
9.3.1
Allocation of manure
First the determination of whether the manure is classified as a co-product, residual or waste is made on the basis of revenue generation for the operation. Co-product: use biophysical reasoning (an example provided). Residual: the system is cut-off at the boundary and no bur-den is carried to downstream use of the litter. Waste: emissions from subsequent activities are assigned to the main co-products.
9.3.2
Multifunctional manufacturing facilities, primary processing
These guidelines do not support differentiation of edible products. Revenue based allocation is recommended for products which serve different markets (e.g., edible products vs. rendering products).
9.3.3
COMPILING AND RECORDING INVENTORY DATA 10
General principles Inventory should be aligned with the goal and scope, shall include all resource use and emissions within the defined system boundaries that are relevant to the chosen impact categories. Primary data are preferred, where possible. Data sources and quality shall be documented.
10.1
Collection of data Primary and secondary data are described. A data management plan is recommended which should address: data collection procedures; data sources; calculation methodologies; data storage procedures; and qual-ity control and review procedures
10.2
Primary activity data
To the full extent possible, primary data are recommended for all fore-ground processes, those under control of the study commissioner.
10.2.1
Secondary and default data
Data from existing databases, peer-reviewed literature, may be used for background processes, or some foreground processes that are minor contributors to total emissions. Secondary data is also subject to data quality requirements.
10.2.2
Addressing LCI data gaps
Proxy data may be used, with assessment of the uncertainty. Environ-mentally extended input-output tables may also be used where avail-able.
10.2.3
Data quality assessment
LCI data quality address representativeness, consistency, completeness, precision/uncertainty, and methodological appropriateness.
10.3
Uncertainty analysis Uncertainty information should be collected along with primary data. If possible, the standard deviation should be estimated, if not a reason-able range should be estimated.
10.4
LIFE CYCLE INVENTORY 11
Overview Inventory should be aligned with the goal and scope, shall include all resource use and emissions within the defined system boundaries that are relevant to the chosen impact categories and shall support the at-tribution of emissions and resources use to single production units and co-products. Primary data are preferred, where possible. Data sources and quality shall be documented.
11.1
(Cont.)

xxxviii
Topic Summary recommendation Section
Cradle-to-farm gate Data shall be collected for feed production (FEED guidelines), breed-ing and milk, meat, and/or fibre production, manure production and emissions.
11.2
Feed assessment The type, quantity and characteristics of feed produced and consumed must be documented. Because feed characteristics and environmental conditions can affect feed conversion ratio, primary data on feed con-sumption is critical.
11.2.1
Animal population and production
A full accounting of breeding animals is required, including spent ani-mals, and must be connected to the reference flows of relevant products. Procedures for calculating enteric methane emissions are provided.
11.2.2
Manure production and management
Estimates of volatile solids and nitrogen excretion based on daily feed intake and properties of the feed are recommended. Procedures for cal-culating grazing and housing emissions of methane and direct and indi-rect nitrous oxide are provided.
11.2.3
Emissions from other farm-related inputs
The total use of fuel (diesel, petrol) and lubricants (oil) associated with all on-farm operations, including provision of water, shall be estimated.
11.2.4
By-products and waste Mortality management as well as disposal of packaging or other solid waste shall be included in the inventory.
11.3.5
Transportation The load factor shall account for empty transport distance, maximum load (mass for volume limited), and use physical causality (mass or vol-ume share) for simultaneous transport of multiple products.
11.3
Biogenic and soil carbon sequestration
This relates only to the feed production stage, the specific methods are covered in the LEAP Animal Feed Guidelines.
11.5
Primary processing stage 11.6
Milk processing Milk collected from goats or sheep may be used to produce one or more of the following products: fresh milk, yoghurt, cheese, cream/butter, whey and milk powder. A material flow diagram of milk input and output products should be produced to account for a minimum of 99 percent of the fat and protein.
11.6.1
Fibre processing The fibre collected from goats (i.e. cashmere, mohair) or sheep (i.e. wool) may be used for a wide range of purposes, including clothing, carpet-making and housing insulation. The main processes that need to be accounted for in fibre scouring are the use of cleaning chemicals (e.g. detergents, bleaching agents and acids), water, within-plant transporta-tion and wastewater processing
11.6.2
Meat processing Primary processing of sheep or goats for meat production can occur in facilities ranging from backyards to large-scale commercial process-ing abattoirs. The main processes that need to be accounted for are: animal deconstruction, production and use of packaging, refrigeration, water use and wastewater processing, and within-plant transportation. Data for resource consumption including energy, water, refrigerants and consumables (e.g. cleaning chemicals, packaging and disposable ap-parel) should be collected
11.6.3
INTERPRETATION OF LCA RESULTS 12
Identification of key issues The practitioner shall evaluate the completeness (with respect to the goal and scope); shall perform sensitivity checks (methodological choices); and consistency checks (methodological choices, data quality assessment and impact assessment steps)
12.1
Characterising uncertainty Data uncertainty should be estimated and reported through formal quantitative analysis or by qualitative discussion, depending upon the goal and scope.
12.2
Conclusions, Recommendations and Limitations
Within the context of the goal and scope, the main results and recom-mendations should be presented and limitations which may impact ro-bustness of results clearly articulated.
12.3
(Cont.)

xxxix
Topic Summary recommendation Section
Use and comparability of results
These guidelines support cradle-to-gate LCA and do not include guid-ance for post-processing, distribution, consumption or end of life ac-tivities.
12.4
Report elements and structure
The following elements should be included:Executive summary summarising the main results and limitations; identification of the practitioners and sponsor; goal and scope defini-tion (boundaries, functional unit, materiality and allocation); lifecycle inventory modeling and life cycle impact assessment; results and inter-pretation, including limitations and trade-offs. A statement indicating third-party verification for reports to be released to the public.
12.6


PART 1
OVERVIEW AND GENERAL PRINCIPLES


3
Greenhouse gas emissions and fossil energy use from small ruminant supply chains
1. Intended users and objectives
The methodology and guidance developed here can be used by stakeholders in all countries and across the entire range of small ruminant production systems. In de-veloping the guidelines, it was assumed that the primary users will be individuals or organizations with a good working knowledge of LCA. The main purpose of the guidelines is to provide a sufficient definition of calculation methods and data re-quirements to enable consistent application of LCA across differing small ruminant supply chains.
This guidance is relevant to a wide range of livestock stakeholders including: • livestock producers who wish to develop inventories of their on-farm resourc-
es and assess the performance of their production systems; •supply chain partners such as feed producers, farmers and processors seeking
a better understanding of the environmental performance of products in their production processes; and
•policy makers interested in developing accounting and reporting specifica-tions for livestock supply chains.
The benefits of this approach include:• the use of a recognized, robust and transparent methodology developed to
take account of the nature of small ruminant supply chains;• the identification of supply chain hotspots and opportunities to improve and
reduce environmental impact;• the identification of opportunities to increase efficiency and productivity;• the ability to benchmark performance internally or against industry standards; • the provision of support for reporting and communication requirements; and•awareness raising and supporting action on environmental sustainability.

4
Greenhouse gas emissions and fossil energy use from small ruminant supply chains
2. Scope
2.1 ENVIRONMENTAL IMPACT CATEGORIES ADDRESSED IN THE GUIDELINESThese guidelines cover only the following environmental impact categories: climate change, and fossil energy demand. This document does not provide support for the assessment of comprehensive environmental performance, nor the social or eco-nomic aspects of small ruminant supply chains.
The LEAP Animal Feed Guidelines cover additional impact categories: acidifi-cation, eutrophication and land occupation. These categories may be reported for the life cycle stages of small ruminant products. It is intended that in future these guidelines will be updated to include multiple categories, if enough reliable data become available to justify the changes.
In the LEAP Animal Feed Guidelines, GHG emission from direct land-use change is analysed and recorded separately from GHG emissions from other sourc-es. There are two reasons for doing this. The first relates to the time frame, as emis-sions attributed to land-use change may have occurred in the past or may be set to occur in the future. Secondly, there is much uncertainty and debate about the best method for calculating direct land-use change.
Regarding land use, the LEAP Animal Feed Guidelines divided land areas into two categories: arable land and grassland. Appropriate indicators were included in the guidelines, as they provide important information about the use of a finite resource (land) but also about the follow-on impacts on soil degradation, biodiver-sity, carbon sequestration or loss and water depletion. Nevertheless, users wishing to specifically relate land use to follow-on impacts will need to collect and analyse additional information on production practices and local conditions.
2.2 APPLICATIONSome flexibility in methodology is desirable to accommodate the range of possible goals and special conditions arising in different sectors. This document strives for a pragmatic balance between flexibility and rigorous consistency across scales, geo-graphic locations, and project goals.
A more strict prescription on the methodology, including allocation and accept-able data sources, is required for product labelling or comparative performance claims. Users are referred to ISO 14025:2006 (ISO, 2006a) for more information and guidance on comparative claims of environmental performance.
The LEAP guidelines are based on the attributional approach to life cycle ac-counting. The approach refers to process-based modelling, intended to provide a static representation of average conditions.
Due to the limited number of environmental impact categories covered here, re-sults should be presented in conjunction with other environmental metrics to under-stand the wider environmental implications, either positive or negative. It should be noted that comparisons between final products should only be based on a full LCA. Users of these guidelines shall not employ results to claim overall environmental superiority of some small ruminant production systems and products.
5
Greenhouse gas emissions and fossil energy use from small ruminant supply chains
The methodology and guidance developed in the LEAP Partnership are not in-tended to create barriers to trade or contradict any World Trade Organization re-quirements.
These guidelines have been developed with a focus on sheep and goat produc-tion. Their application to other small ruminant species is possible. However, for other species, there may be specific circumstances not covered in this document. For example, the co-production of velvet (antlers) and meat by deer would require additional consideration regarding allocation methodology.

6
Greenhouse gas emissions and fossil energy use from small ruminant supply chains
3. Structure and conventions
3.1 STRUCTURE This document adopts the main structure of ISO 14040:2006 (ISO, 2006b) and the four main phases of LCA: goal and scope definition, inventory analysis, impact assessment and interpretation. Figure 1 presents the general relationship between the phases of an LCA study defined by ISO 14040:2006 and the steps needed to complete a GHG inventory in conformance with this guidance. Part 2 of this meth-odology sets out the following:
•Section 7 outlines the operational areas to which these guidelines apply.•Section 8 includes requirements and guidance to help users define the goals
and scope, and system boundary of an LCA.•Section 9 presents the principles for handling multiple co-products and
includes requirements and guidance to help users select the most appropriate allocation method to address common processes in their product inventory.
•Section 10 presents requirements and guidance on the collection and assess-ment of the quality of inventory data as well as on identification, assessment and reporting on inventory uncertainty.
•Section 11 outlines key requirements, steps, and procedures involved in quan-tifying GHG and other environmental impact inventory results in the studied supply chain.
•Section 12 provides guidance on interpretation and reporting of results and summarizes the various requirements and best practices in reporting.
A glossary intended to provide a common vocabulary for practitioners has been included. Additional information is presented in the appendices.
Users of this methodology should also refer to other relevant guidelines where necessary and indicated. The LEAP small ruminants guidelines are not intended to stand alone, but are meant to be used in conjunction with the LEAP Animal Feed Guidelines. Relevant guidance developed under the LEAP Partnership and published in other documents will be specifically cross-referenced to enable ease of use. For example, specific guidance for calculating associated emissions for feed is contained in the LEAP Animal Feed Guidelines.
3.2 PRESENTATIONAL CONVENTIONSThese guidelines are explicit in indicating which requirements, recommendations, and permissible or allowable options users may choose to follow.
The term “shall” is used to indicate what is required for an assessment to con-form to these guidelines.
The term “should” is used to indicate a recommendation, but not a requirement.The term “may” is used to indicate an option that is permissible or allowable.Commentary, explanations and general informative material (e.g. notes) are pre-
sented in footnotes and do not constitute a normative element. Examples illustrating specific areas of the guidelines are presented in boxes.

7
Greenhouse gas emissions and fossil energy use from small ruminant supply chains
Figure 1Main life cycle steps in the small ruminant supply chain
INTERPRETATION
Reporting and communication of
LCA Results Section 12.5
Interpretation of LCA results
Section 12
GOAL AND SCOPE DEFINITION
Describe system boundary and functional unitSection 8.3 and 8.4
Impact categoriesSection 11.6
Goal of the LCA studySection 8.1
Feed production(LEAP Animal
Feed Guidelines)Manure production and management
Primary processing stageSection 11.6
Section 11.2.3
Animal population and productivity
Section 11.2.2
Animal production
LIFE CYLE INVENTORY
LIFE CYCLE IMPACT ASSESSMENT

8
Greenhouse gas emissions and fossil energy use from small ruminant supply chains
4. Essential background information and principles
4.1 A BRIEF INTRODUCTION TO LCALCA is recognized as one of the most complete and widely used methodological frame-works for assessing the environmental impact of products and processes. LCA can be used as a decision support tool within environmental management. ISO 14040:2006 defines LCA as a “compilation and evaluation of the inputs, outputs and the potential environmental impacts of a product system throughout its life cycle”. In other words, LCA provides quantitative, confirmable, and manageable process models to evaluate production processes, analyse options for innovation, and improve understanding of complex systems. LCA can identify processes and areas where process changes stem-ming from research and development can significantly contribute to reducing environ-mental impacts. According to ISO14040:2006, LCA consist of four phases:
•goal and scope definition, including appropriate metrics (e.g. GHG emissions, water consumption, hazardous materials generated and/or quantity of waste);
• life cycle inventories (LCIs), i.e. the collection of data that identify the system inputs and outputs and discharges to the environment;
•performance of impact assessment, i.e the application of characterization fac-tors to the LCI emissions that normalizes groups of emissions to a common metric, such as global warming potential reported in carbon dioxide equiva-lents (CO2 e); and
•analysis and interpretation of results.
4.2 ENVIRONMENTAL IMPACT CATEGORIESLife Cycle Impact Assessment (LCIA) aims at understanding and evaluating the magnitude and significance of potential environmental impacts for a product sys-tem throughout the life cycle of the product (ISO 14040:2006). The selection of environmental impacts is a mandatory step of LCIA and this selection shall be justi-fied and consistent with the goal and scope of the study (ISO 14040:2006). Impacts can be modelled at different levels in the environmental cause-effect chain linking elementary flows of the LCI to midpoint and endpoint impact categories (Figure 2).
A distinction must be made between midpoint impacts, which characterize im-pacts in the middle of the environmental cause-effect chain, and endpoint impacts, which characterize impacts at the end of the environmental cause-effect chain. End-point methods provide indicators at, or close to, an area of protection. Usually three areas of protection are recognized: human health, ecosystems and resources. The aggregation at endpoint level and at the areas of protection level is an optional phase of the assessment according to ISO 14044:2006.
Climate change is an example of a midpoint impact category. The results of the LCI are the amounts of GHG emissions per functional unit. Based on a radiative forcing model, characterization factors, known as global warming potentials, spe-cific to each GHG, can be used to aggregate all of the emissions to the same mid-point impact category indicator (kg of CO2e per functional unit.)

9
Greenhouse gas emissions and fossil energy use from small ruminant supply chains
The LEAP Animal Feed Guidelines include additional categories and related methodologies (Figure 2). These guidelines do not describe methodologies for oth-er resource use and environmental impact categories, but some relevant methodolo-gies are described for the following:
• land use or land occupation, which should be further subdivided into land suitable or unsuitable for arable production since it is important to recognize the potential of small ruminants for utilizing land that is otherwise incapable of growing arable crops for direct human consumption;
•water use accounting for blue water (e.g. Ridoutt and Pfister, 2010; for water footprint methodologies see ISO/TC 14046:2014, ISO, 2014);
•resource depletion of non-renewable resources, such as minerals and fossil fuels (e.g. Guinée et al., 2002); and
•eutrophication (e.g. the eutrophication potential method of Guinée et al., 2002, or separate eutrophication terrestrial and aquatic methodologies, as in Goedkoop et al., 2009).
Figure 2Environmental cause-effect chain and categories of impact
Life cycle inventoryelementary flows Ecosystem quality
Human health
Resources
Climate change
Ozone depletion
Human toxicity
Respiratory inorganics
Ionizing radiation
Noise
Photochemical ozone formation
Acidification
Eutrophication(terrestrial and aquatic)
Land occupation
Fossil energy use
Ecotoxicity
Water use
Inventoryresults
Midpointimpacts
Midpoint impact category covered in these guidelines
Additional midpoint impact category covered in the LEAP Animal Feed Guidelines
Areasof protection
Resource depletion
Source: Adapted from the International Reference Life Cycle Data System (ILCD) Handbook (European Commission 2010b, 2011).

10
Greenhouse gas emissions and fossil energy use from small ruminant supply chains
4.3 NORMATIVE REFERENCESThe following referenced documents are indispensable in the application of this methodology and guidance.
•ISO 14040:2006 Environmental management – Life cycle assessment – Prin-ciples and framework (ISO, 2006b)These standards give guidelines on the principles and conduct of LCA studies providing organizations with information on how to reduce the overall envi-ronmental impact of their products and services. ISO 14040:2006 define the generic steps that are usually taken when conducting an LCA, and this docu-ment follows the first three of the four main phases in developing an LCA (goal and scope, inventory analysis, impact assessment and interpretation).
•ISO14044:2006 Environmental management – Life cycle assessment – Require-ments and guidelines (ISO, 2006c)ISO 14044:2006 specifies requirements and provides guidelines for LCA in-cluding: definition of the goal and scope of the LCA, the LCI, the LCIA, the life cycle interpretation, reporting and critical review of the LCA, limitations of the LCA, relationship between the LCA phases, and conditions for use of value choices and optional elements.
4.4 NON-NORMATIVE REFERENCES•ISO 14025:2006 Environmental labels and declarations – Type III environ-
mental declarations – Principles and procedures (ISO, 2006a)ISO 14025:2006 establishes the principles and specifies the procedures for de-veloping Type III environmental declaration programmes and Type III en-vironmental declarations. It specifically establishes the use of the ISO 14040 series of standards in the development of Type III environmental declaration programmes and Type III environmental declarations. Type III environmental declarations are primarily intended for use in business-to-business communi-cation, but their use in business-to-consumer communication is not precluded under certain conditions.
•ISO/TS 14067:2013 Greenhouse gases – Carbon footprint of products – Require-ments and guidelines for quantification and communication (ISO, 2013a)ISO/TS 14067:2013 specifies the principles, requirements and guidelines for the quantification and communication of the carbon footprint of a product. It is based on ISO 14040:2006 and ISO 14044:2006 for quantification, and ISO 14020:2000 (ISO, 2000), ISO 14024:1999 (ISO, 1999) and ISO 14025:2006, which deal with environmental labels and declarations, for communication.
•Product Life Cycle Accounting and Reporting Standard (WRI and WBCSD, 2011a)
•This standard from the World Resources Institute (WRI) and the World Business Council for Sustainable Development (WBCSD) provides a frame-work to assist users in estimating the total GHG emissions associated with the life cycle of a product. It is broadly similar in its approach to the ISO standards, although it puts more emphasis on analysis, tracking changes over time, reduction options and reporting. Like PAS2050:2011 (see below), this standard excludes impacts from the production of infrastructure, but whereas PAS2050:2011 includes ‘operation of premises’, such as retail lighting or office heating, the Product Life Cycle Accounting and Reporting Standard does not.

11
Greenhouse gas emissions and fossil energy use from small ruminant supply chains
•ENVIFOOD Protocol, Environmental Assessment of Food and Drink Proto-col (Food SCP RT, 2013) The Protocol was developed by the European Food Sustainable Consumption Round Table to support a number of environmental instruments for use in communication and the identification of environmental improvement options. The Protocol might be the baseline for developing communication methods, product category rules (PCRs), criteria, tools, datasets and assessments.
•International Reference Life Cycle Data System (ILCD) Handbook: - Gen-eral guide for Life Cycle Assessment - Detailed guidance (European Commis-sion, 2010b).
•The ILCD Handbook was published in 2010 by the European Commission Joint Research Centre and provides detailed guidance for LCA based on ISO 14040:2006 and 14044:2006. It consists of a set of documents, including a gen-eral guide for LCA and specific guides for LCI and LCIA.
•Product Environmental Footprint (PEF) Guide (European Commission, 2013)This Guide is a general method to measure and communicate the potential life cycle environmentaimpact of a product developed by the European Commis-sion primarily to highlight the discrepancies in environmental performance information.
•BPX-30-323-0 General environmental footprinting methodology developed by the ADEME-AFNOR stakeholder platform and its further specifications (AFNOR, 2011).
•This is a general method developed by the ADEME-AFNOR stakeholder platform to measure and communicate the potential life cycle environmental impact of a product. It was developed under request of the French Govern-ment, again with the purpose of highlighting the discrepancies in environ-mental performance information. Food production specific guidelines are also available, along with a large set of product specific rules on livestock products.
•PAS 2050:2011 Specification for the assessment of life cycle greenhouse gas emissions of goods and services (BSI, 2011)PAS 2050:2011 is a Publicly Available Specification (PAS), i.e. a not standard spec-ification. An initiative of the United Kingdom sponsored by the Carbon Trust and the Department for Environment, Food and Rural Affairs, PAS 2050:2011 was published through the British Standards Institution (BSI) and uses BSI methods for agreeing on a PAS. It is designed for applying LCA over a wide range of prod-ucts in a consistent manner for industry users, focusing solely on the carbon foot-print indicator. PAS 2050:2011 has many elements in common with the ISO 14000 series methods but also a number of differences, some of which limit choices for analysts (e.g. exclusion of capital goods and setting materiality thresholds).
4.5 GUIDING PRINCIPLESFive guiding principles support users in their application of this sector-specific methodology. These principles are consistent across the methodologies developed within the LEAP Partnership. They apply to all the steps, from goal and scope defi-nition, data collection and LCI modelling, through to reporting. Adhering to these principles ensures that any assessment made in accordance with the methodology prescribed is carried out in a robust and transparent manner. The principles can also guide users when making choices not specified by the guidelines.

12
Greenhouse gas emissions and fossil energy use from small ruminant supply chains
The principles are adapted from the ISO 14040:2006, the Product Environmental Footprint (PEF) Guide, the Product Life Cycle Accounting and Reporting Standard, the PAS 2050:2011, the ILCD Handbook and ISO/TS 14067:2013, and are intended to guide the accounting and reporting of environment impacts categories.
Accounting and reporting of GHG emissions and other environmental impacts from small ruminant supply chains shall accordingly be based on the following principles:
Life cycle perspective“LCA considers the entire life cycle of a product, from raw material extraction and acquisition, through energy and material production and manufacturing, to use and end of life treatment and final disposal. Through such a systematic overview and per-spective, the shifting of a potential environmental burden between life cycle stages or individual processes can be identified and possibly avoided” (ISO 14040:2006, 4.1.2).
Relative approach and functional unitLCA is a relative approach, which is structured around a functional unit. This func-tional unit defines what is being studied. All subsequent analyses are then relative to that functional unit, as all inputs and outputs in the LCI and consequently the LCIA profile are related to the functional unit (ISO 14040:2006, 4.1.4).
RelevanceData, accounting methodologies and reporting shall be appropriate to the decision-making needs of the intended users. Information should be reported in a way that is easily understandable to the intended users.
CompletenessQuantification of the product environmental performance shall include all envi-ronmentally relevant material/energy flows and other environmental interventions as required for adherence to the defined system boundaries, the data requirements, and the impact assessment methods employed (Product Environmental Footprint (PEF) Guide).
ConsistencyData that are consistent with these guidelines shall be used throughout the inven-tory to allow for meaningful comparisons and reproducibility of the outcomes over time. Any deviation from these guidelines shall be reported, justified and documented.
AccuracyBias and uncertainties shall be reduced as far as practicable. Sufficient accuracy shall be achieved to enable intended users to make decisions with reasonable confidence as to the reliability and integrity of the reported information.
Iterative approachLCA is an iterative technique. The individual phases of an LCA use results of the other phases. The iterative approach within and between the phases contributes to the comprehensiveness and consistency of the study and the reported results (ISO 14040:2006, 4.1.5).

13
Greenhouse gas emissions and fossil energy use from small ruminant supply chains
Transparency“Due to the inherent complexity in LCA, transparency is an important guiding principle in executing LCAs, in order to ensure a proper interpretation of the re-sults” (ISO 14040:2006, 4.1.6).
Priority of scientific approach“Decisions within an LCA are preferably based on natural science. If this is not possible, other scientific approaches (e.g. from social and economic sciences) may be used or international conventions may be referred to. If neither a scientific basis exists nor a justification based on other scientific approaches or international con-ventions is possible, then, as appropriate, decisions may be based on value choices” (ISO 14040:2006, 4.1.8).

14
Greenhouse gas emissions and fossil energy use from small ruminant supply chains
5. LEAP and the preparation process
LEAP is a multi-stakeholder initiative launched in July 2012 with the goal of im-proving the environmental performance of livestock supply chains. Hosted by FAO, LEAP brings together the private sector, governments, civil society represen-tatives and leading experts who have a direct interest in the development of science-based, transparent and pragmatic guidance to measure and improve the environ-mental performance of livestock products.
Demand for livestock products is projected to grow 1.3 percent per year until 2050, driven by global population growth and increasing wealth and urbanization (Alexandratos and Bruinsma, 2010). Against the background of climate change and increasing competition for natural resources, this projected growth places signifi-cant pressure on the livestock sector to perform in a more sustainable way. The identification and promotion of the contributions that the sector can make towards more efficient use of resources and better environmental outcomes is also impor-tant.
Currently, many different methods are used to assess the environmental impacts and performance of livestock products. This causes confusion and makes it difficult to compare results and set priorities for continuing improvement. With increasing demands in the marketplace for more sustainable products there is also the risk that debates about how sustainability is measured will distract people from the task of driving real improvement in environmental performance. There is also the danger that labelling or private standards based on poorly developed metrics could lead to erroneous claims and comparisons.
The LEAP Partnership addresses the urgent need for a coordinated approach to developing clear guidelines for environmental performance assessment based on international best practices. The scope of LEAP is not to propose new standards but to produce detailed guidelines that are specifically relevant to the livestock sec-tor, and refine guidance for existing standards. LEAP is a multi-stakeholder part-nership bringing together the private sector, governments and civil society. These three groups have an equal say in deciding work plans and approving outputs from LEAP, thus ensuring that the guidelines produced are relevant to all stakeholders, widely accepted and supported by scientific evidence.
With this in mind, the first three TAGs of LEAP were formed in early 2013 to develop guidelines for assessing the environmental performance of small ruminants (goats and sheep), animal feeds and poultry supply chains.
The work of LEAP is challenging but vitally important to the livestock sector. The diversity and complexity of livestock farming systems, products, stakeholders and environmental impacts can only be matched by the willingness of the sector’s practitioners to work together to improve performance. LEAP provides the essen-tial backbone of robust measurement methods to enable assessment, understanding and improvement in practice. More background information on the LEAP Partner-ship can be found at www.fao.org/partnerships/leap/en/

15
Greenhouse gas emissions and fossil energy use from small ruminant supply chains
5.1 DEVELOPMENT OF SECTOR-SPECIFIC GUIDELINESSector-specific guidelines for assessing the environmental performance of the live-stock sector are a key aspect of the LEAP Partnership work programme. Such guidelines take into account the nature of the livestock supply chain under inves-tigation and are developed by a team of experts with extensive experience in LCA and livestock supply chains.
The benefit of a sector-specific approach is that it gives guidance on the applica-tion of LCA to users and provides a common basis from which to evaluate resource use and environmental impacts.
Sector-specific guidelines may also be referred to as supplementary require-ments, product rules, sector guidance, PCRs or product environmental footprint (PEF) category rules, although each programme will prescribe specific rules to en-sure conformity and avoid conflict with any existing parent standard.
The first set of sector-specific guidelines addresses small ruminants, poultry and animal feeds. The former two place emphasis on climate-related impacts, while the LEAP Animal Feed Guidelines address a broader range of environmental catego-ries. LEAP is also considering developing guidance for the assessment of other ani-mal commodities and wider environmental impacts, such as biodiversity, water and nutrients.
5.2 THE SMALL RUMINANTS TAG AND THE PREPARATION PROCESSThe small ruminants TAG of the LEAP Partnership was formed at the start of 2013. The team included nine experts in small ruminant supply chains, as well as leading LCA researchers and experienced industry practitioners. Their backgrounds, com-plementary between products, systems and regions, allowed them to understand and address different interest groups and ensure credible representation. The TAG was led by Dr Stewart Ledgard of AgResearch, New Zealand.
The role of the TAG was to:•review existing methodologies and guidelines for the assessment of GHG
emissions from livestock supply chains and identify gaps and priorities for further work;
•develop methodologies and sector specific guidelines for the LCA of GHG emissions from small ruminant supply chains; and
•provide guidance on future work needed to improve the guidelines and encourage greater uptake of LCA assessment of GHG emissions from small ruminant supply chains.
The TAG met for its first workshop on 12–14 February 2013. The TAG contin-ued to work via email and teleconferences before meeting for a second workshop from 5–7 September 2013 in Rome. The nine experts were drawn from six countries: Australia, France, Germany, Malaysia, New Zealand and the United Kingdom.
As a first step, existing studies and associated methods were reviewed by the TAG to assess whether they offered a suitable framework and orientation for a sec-tor-specific approach. This avoids confusion and unnecessary duplication of work through the development of potentially competing standards or approaches. The review also followed established procedures set by the overarching international guidance sources listed in Section 4.3.
The selection of these studies for background review in support of the develop-ment of these guidelines was driven by the availability of full LCA studies in the

16
Greenhouse gas emissions and fossil energy use from small ruminant supply chains
small ruminant sector. The purpose was to determine the range of methodological choices that have been used. The intention was to carry out the broadest possible evaluation, and for this reason, peer-reviewed articles, conference proceedings and technical reports were included on the process. These sources allowed for an evalu-ation of the methodological consistencies and differences for global systems. The TAG identified 12 studies addressing aspects of the small ruminant supply chain, with eight covering only the cradle to farm gate, four covering the cradle to retail gate, and one covering a whole life cycle (meat only). All 12 studies focused on sheep, with one also covering goats. A review of these studies can be found in Ap-pendix 1. After the evaluation, it was concluded that no existing approach or study set out fully comprehensive guidance for quantifying GHG emissions and energy use across the supply chain, and that the TAG would need to undertake further work to reach consensus on more detailed guidance. This activity built on initial work on a methodology for carbon footprinting of lamb (cradle to farm gate) by LCA researchers (including some in this TAG), which was supported by the Inter-national Meat Secretariat and Beef + Lamb New Zealand.
5.3 PERIOD OF VALIDITY It is intended that these guidelines will be periodically reviewed to ensure the valid-ity of the information and methodologies on which they rely. Because there is not currently a mechanism in place to ensure such review, users are invited to visit the LEAP website (www.fao.org/partnerships/leap) for the latest version.

17
Greenhouse gas emissions and fossil energy use from small ruminant supply chains
6. Background information on small ruminant supply chains
6.1 BACKGROUND AND CONTEXTThe world populations of goats and sheep in 2011 were 876 and 1 043 million, re-spectively. A breakdown of their distribution from the main countries shows that most goats are raised in Africa and Asia, although the dominance of specific prod-ucts varies, with most meat production in China, and most milk production in India (Table A2 in Appendix 2). Similarly, for sheep, China is the largest producer of meat, wool and milk, with Australia and New Zealand being the next largest pro-ducers of meat and wool (Table A3 in Appendix 2). The world’s regions also show differences in terms of trends in sheep and goat production. The production of both milk and meat from sheep and goats has increased significantly during the past 20 years in Asia, while the increase was lower in Africa (Figure 3). However, produc-tion trends have been stable or declined in Europe and Oceania.
Both species present a wide mix of breeds and play valuable multi-functional roles, especially in small farm systems. Their preferred environments are somewhat differ-ent, with goats being more heavily concentrated in semi-arid and arid areas, while sheep thrive best in cooler environments. Goats and sheep play an important socio-economic role in many rural areas. They are capable of utilizing low-quality fibrous feeds (goats more so than sheep) and are highly valued for the multiple products they produce, including edible products, such as meat and milk, and non-edible products,
Figure 3Trends in the global production of sheep and goats (a) meat and (b) milk
0
2
4
6
8
10
12
0
5
10
15
20
25
Shee
p a
nd
go
at m
eat
pro
d. (
mill
ion
t)
Shee
p a
nd
go
at m
ilk p
rod
. (m
illio
n t
)
1960 1970 1980 1990 2000 2010Year
AsiaAfricaEuropeOceaniaS. AmericaN. America
1960 1970 1980 1990 2000 2010Year
AsiaAfricaEurope
OceaniaS. America
A B
Note: Production is summed between the two species (FAO, 2013). Regions with low production: meat production for North and South America went from 0.8 and 0.4 million tonnes in 1980 to 0.4 and 0.09 million tonnes in 2011, respectively; milk production for South America and Oceania went from 182 and 0.03 x10³ tonnes in 1980 to 254 and 0.04 x10³ tonnes in 2011, respectively.

18
Greenhouse gas emissions and fossil energy use from small ruminant supply chains
such as manure, hides and skins and natural fibre (mohair, cashmere or wool). In larger farms one or the other species may be reared intensively for a particular prod-uct. In most small farms and low-input systems, both species may be reared together often for purposes of livelihood diversification.
6.2 DIVERSITY OF SMALL RUMINANT PRODUCTION SYSTEMSThe agro-ecosystem conditions (climatic, edaphic, biotic) determine the plants that are found there or that can potentially be cultivated. This in turn determines the quantity, quality and distribution of the feed base, which governs the develop-ment of animal production systems. Small ruminant production occurs worldwide across a range of agro-ecological zones and presents a wide diversity of systems with different intensities and objectives of production (Figure 4). While a range of constraints to production of small ruminants exist across agro-ecological zones (Devendra, Morton and Rischkovsky, 2005), sheep and, in particular, goats are also well adapted to a wide range of conditions and to zones that are often unsuitable for other food production systems. Additionally, small ruminant production in these landscapes can deliver environmental benefits through nutrient cycling and the maintenance of biodiversity.
Examples of the diversity of sheep or goat production systems include:.1. Intensive production systems for meat or milk as the main product, with
animals housed permanently or through most of the year. Feed supply can be brought in entirely from arable crops or from cut-and-carry pasture and cultivated improved forages. The system is common in humid regions where feed is generally more plentiful.
2. Extensive to intensive systems with animals reared predominantly on pastures in confined farms. These may include animals housed for part of the year to some animals (e.g. lambs) being housed throughout their life, with concentrates being fed during the confinement period. Main products may include meat, milk or fibre.
3. Extensive systems with animals managed communally for grazing and fed on native forages and residues from crops or trees. Main products may include meat, milk or fibre (manure may also be a useful co-product).
4. Very extensive systems where animals are grazed on large areas of unpro-ductive and marginal lands, including rangelands, forest areas and road-sides. Very low annual rainfall produces a sparse feed-resource base where ani-mals have to seek feed. Inadequate control of numbers can lead to overgrazing and damage to the environment. This system is very common in semi-arid and arid agro-ecological zones.
5. Nomadic and transhumance systems that involve regular movements of whole flocks, along with the pastoralist families. These systems are found in agro-eco-systems where crop production is not possible. Grazing and water availability are the main drivers of these movements, which can involve very large flocks.
6. Rural landless production systems. Several million poor farmers manage landless small ruminant production systems, especially systems 3 to 5 listed above. The poorest are found in vulnerable semi-arid and arid agro-ecological zones. In this system, small ruminants play a vital role in ensuring household survival by providing meat and milk and some income.

19
Greenhouse gas emissions and fossil energy use from small ruminant supply chains
Figure 4Global distribution of (a) sheep and (b) goats from the two main
production systems – grassland based and mixed
Heads per square km
Mixed system
< 10
10-25
25-50
50-100
100-250
> 250
Grassland-based system
50-100
100-250
> 250
< 10
10-25
25-50
Density < 1 head per square km
A
B
Note: The colour (see legend) indicates the dominant production system and the number of animals in each grid cell. Source: Gerber et al., 2013.

20
Greenhouse gas emissions and fossil energy use from small ruminant supply chains
7. Sylvo-pastoral systems where small ruminant production is integrated with tree cultivation. Residues from trees are often used as feed. These inte-grated systems are a good example of diversification, which is mainly driven by seasonality and risk.
6.3 DIVERSITY OF SMALL RUMINANT VALUE CHAINSValue chains play an important role in linking production to consumption and waste disposal, and the many services involved in these processes. An LCA approach is appropriate to account for the many stages of resource use and environmental emis-sions throughout the value chain, from raw materials to production, transportation, processing, consumption and waste management. A value chain approach enables the identification of potential factors for improvement throughout the life cycle.
In a number of developing countries, small farm owners encounter major dif-ficulties coping with complexity and general inefficiency of prevailing marketing chains. The market chain involves rural, peri-urban, urban and international mar-kets, and a major challenge lies in finding ways to link small farmers with these markets and marketing systems. At present in developing countries, inadequate ac-cess to market outlets and weak marketing arrangements are a major constraint for smallholder owners and producers of sheep and goats and hinders the the devel-opment of systems linking production to consumption. In Asia, village slaughter centres can be important for increasing farmers’ access to marketing chains. Rural markets are especially important to rural communities and their households, and are also used for the sale of live animals for slaughter in urban areas. Without im-provements in marketing and transport systems, the prevailing systems constitute major impediments to the sale of animals and products from small farms.
In contrast, in intensive production systems in developed countries, linked value chains are prevalent. They are generally associated with large processing facilities and strive to gain greater value from the many co-products from small ruminants.
The processing of products from small ruminants can involve many complex stages with multiple end products. These guidelines extend only to primary pro-cessing. There are a diversity of primary processing systems:
•Specialist abattoirs disassemble animals into a very wide range of meat prod-ucts and co-products. The latter include hides (for leather), tallow (e.g. for soap, biofuel), internal organs and meat waste (for pet food), blood (e.g. for pharmaceutical products), fibre and renderable material (e.g. for fertilizer).
•Specialist milk processing plants produce a wide range of basic products including cheese, yoghurt, whey and dried milk.
•Specialist fibre scouring plants wash and clean the fibre and may produce co-products, such as lanolin.
•Some animals are sold for ‘backyard’ slaughter (sometimes called ‘wet mar-kets’) primarily for meat products.
•Village slaughter centres (especially in Asia) are associated with the slaughter of a relatively small number of animals to provide meat to villagers. At these cen-tres, the offal and skins are generally sold and processed at other specialist sites.
Alternatively, primary processed products (e.g. packaged cuts of meat from ab-attoirs, wool for use in insulation of houses) may be sent directly to wholesale or retailers for direct sale to customers. It is acknowledged that the various stages after primary processing may result in significant use of energy and refrigerantsm, with

21
Greenhouse gas emissions and fossil energy use from small ruminant supply chains
associated GHG emissions. However, data requirements for these stages are often difficult to obtain and are usually derived from secondary data in published reports. It was considered impractical to attempt to include these various stages after pri-mary processing in the current guidelines. However, a number of other specifica-tions or PCRs account for secondary processing and subsequent stages for textiles (e.g. BSI, 2014) and meat (e.g. Boeri, 2013).
A very wide range of secondary processing systems exists, but no attempt was made to account for them in these guidelines. Examples include: transforming meat into specialist cuts or final processed products (e.g. cooked lasagne pre-packed for retailers); carding and spinning fibre into yarns for clothing or carpet production; and the addition of further ingredients to basic milk products to produce specialist products, such as infant milk products.
6.4 MULTI-FUNCTIONALITY OF SMALL RUMINANT SUPPLY CHAINSSmall ruminant production systems generate a range of goods and services. They make multiple contributions to supporting the local economy, maintaining social structures, safeguarding food security and reaching agronomic and ecological objectives.
For many poor and vulnerable people, small ruminants play an important role in the four dimensions of food security (availability, access, stability and utilization). They are crucial to nutrition, providing high-quality proteins and a wide diversity of micronutrients. Where people have no access to banks and other financial ser-vices, small ruminants allow them to store and manage wealth, and are an important buffer in times of crisis.
In mixed crop-livestock systems, small ruminants often contribute to crop pro-ductivity, as their manure is used to fertilize the soil and maintain organic matter, and herds are used to control weeds.
Small ruminants also play an important role in cultural and religious events. One example, is the Muslim celebration of the festival of Eidul Adha, which requires the ritual sacrifice of animals. Small ruminants can also contribute to the management of landscapes and preserve ecosystems. In some areas (e.g. mountainous regions), small ruminants are part of the cultural landscape, providing ecosystem services through encroachment control, conservation of biodiversity, and maintaining tra-ditional agricultural activities and infrastructure.
While wealth management and the benefits of landscape management, including multiple ecosystem services, are recognized, they have not specifically been cap-tured in these guidelines. A methodology to account for these is under develop-ment, but is not yet ready to be included in these guidelines. However, these con-siderations should be included in future guidance.
6.5 OVERVIEW OF GLOBAL EMISSIONS FROM SMALL RUMINANTSGlobally, sheep and goats are responsible for about 6.5 percent of the livestock sec-tor’s emissions (475 million tonnes CO2e) (Gerber et al., 2013; Opio et al., 2013). The global average GHG emission intensity of milk is lower for goats than for sheep (5.2 and 8.4 kg CO2q/kg product, respectively), mainly because goats have higher milk yields on average at the global level. The corresponding GHG emission intensity of meat is very similar between the two species at about 23 kg CO2e/kg meat. For both milk and meat, emission intensity tends to be lower in developed than in developing regions. However, this should not be interpreted as suggesting

22
Greenhouse gas emissions and fossil energy use from small ruminant supply chains
an overall environmental superiority of developed country production systems, as noted in Section 2.2. Enteric fermentation and feed production largely dominated the sources of GHG emissions along the supply chains in these studies, accounting for 55 percent and 35 percent of emissions from small ruminants, respectively. In regions where natural fibre production (wool, cashmere, mohair) is economically important, a substantial share of emissions can be attributed to these products when the economic value is used to allocate emissions between edible and non-edible products.
Gerber et al. (2013) also show that emission intensities vary greatly between pro-duction units, even within similar production systems, leaving much room for im-provement. If the bulk of the world’s small ruminant producers adopted technolo-gies and practices already used by the most efficient producers in terms of emission intensity, significant reductions in emissions would result. A major driver of GHG emission intensity is the efficiency of feed conversion into product, which is de-termined by potential animal productivity, as well as feed availability and quality through the year. Manure management also has an important effect on GHG emis-sions. Opportunities for reducing GHG emission intensity include improved ani-mal breeding, feeding, health and reproduction. Management practices to improve production and quality of feed sources, including the efficient use of manure for better nutrient capture and recycling, can also enhance animal productivity. How-ever, the potential for reducing GHG emission intensity are dependent on local cli-matic and feed conditions. Indeed, in some ecosystems, small ruminants may be one of the only options landholders have to utilize low-quality forage for production of protein for human consumption. In some grassland and rangeland systems, there is also potential for increased carbon sequestration in vegetation and soils.

PART 2
METHODOLOGY FOR QUANTIFICATION OF GREENHOUSE GAS EMISSIONS AND FOSSIL ENERGY USE OF SMALL RUMINANT PRODUCTS


25
Greenhouse gas emissions and fossil energy use from small ruminant supply chains
7. Definition of products and production systems
7.1 PRODUCTS DESCRIPTIONThese guidelines cover the cradle to primary processing gate. The main products generated may comprise:
•meat products, with possible co-products, such as fat, skins and renderable material;
•clean fibre (wool, mohair or cashmere) and possible minor lanolin co-prod-ucts;
•milk products, such as cheese, yoghurt and milk powder, with possible co-products, such as whey.
These products are generated from a very diverse range of production systems around the globe.
7.2 LIFE CYCLE STAGES: MODULARITYAn LCA of primary products can be conducted by dividing the production system into modules that relate to the different life cycle stages. The three main stages are: feed production, including feed processing, milling and storage; animal production, including animal breeding; and primary animal processing (Section 8.4) (Figure 5). Feed production covers the cradle-to-animal-mouth stage and encompasses a range of feeds, including processed concentrates, forage crops, pastures, shrubs trees and native vegetation (see the LEAP Animal Feed Guidelines). Animal production covers the cradle-to-farm-gate stage, and the main products are live animals, fibre (e.g. wool for sheep and mohair or cashmere for goats) and/or milk.
Figure 5Modular scheme of small ruminant production chains
Feedproduction
Animalproduction
Primary animalprocessing

26
Greenhouse gas emissions and fossil energy use from small ruminant supply chains
8. Goal and scope definition
8.1 GOAL OF THE LCA STUDYThe first step when initiating an LCA is to clearly set the goal or statement of purpose. This statement describes the goal pursued and the intended use of results. Numerous reasons for performing an LCA exist. LCAs can be used, for exam-ple, to serve the goal of GHG emission management by determining the carbon footprint of products and understanding the GHG emission hotspots to prioritize emission-reduction opportunities along supply chains. However, LCAs can go be-yond a carbon footprint and include other environmental impact categories, such as eutrophication, and provide detailed information on a product’s environmental performance. They can also serve performance tracking goals and set progress and improvement targets. LCAs could also be used to support reporting on the envi-ronmental impacts of products. However, these guidelines are not intended for the comparison of products or labelling of environmental performance.
It is of paramount importance that the goal and scope be given careful consider-ation as these decisions define the overall context of the study. A clearly articulated goal helps ensure that aims, methods and results are aligned. For example, fully quantitative studies will be required for benchmarking or reporting, but somewhat less rigour may be required for hotspot analysis.
Interpretation is an iterative process occurring at all steps of the LCA and ensur-ing that calculation approaches and data match the goal of the study (Figure 1 and Section 12). Interpretation includes completeness checks, sensitivity checks, con-sistency checks and uncertainty analyses. The conclusions (reported or not) drawn from the results and their interpretation shall be strictly consistent with the goal and scope of the study.
Seven aspects shall be addressed and documented during the goal definition (ILCD Handbook):
•subject of the analysis and properties of the assessed system: organization, location(s), dimensions, products, sector, and position in the value chain;
•purpose for performing the study and decision context; • intended use of the results: will the results be used internally for decision mak-
ing or shared externally with third parties?;• limitations due to the method, assumptions and choice of impact categories, in
particular, those related to broad study conclusions associated with exclusion of impact categories;
• target audience of the results;•comparative studies to be disclosed to the public and need for critical review;
and•commissioner of the study and other relevant stakeholders.
8.2 SCOPE OF THE LCA The scope is defined in the first phase of an LCA, as an iterative process with the goal definition. It states the depth and breadth of the study. The scope shall identify the product system or process to be studied, the functions of the system, the functional

27
Greenhouse gas emissions and fossil energy use from small ruminant supply chains
unit, the system boundaries, the allocation principles and the impact categories. The scope should be defined so that the breadth, depth and detail of the study are compat-ible and sufficient to achieve the stated goal. While conducting an LCA of livestock products, the scope of the study may need to be modified as information is collected to reflect data availability and techniques or tools for filling data gaps. Specific guidance is provided in the subsequent sections. It is also recognized that the scope definition will affect the data collection for the LCI, as described in more detail in Section 10.1.
These guidelines refer only to two environmental impact categories: climate change, characterized through GHG emissions and reported as CO2e; and fossil energy use, reported in megajoules (MJ). The guidelines therefore should not be used to provide an indicator of overall environmental effects of the production systems and products. Care is needed in the reporting and communication of the results of assessments based on these guidelines to avoid misinterpretation of the scope and application of the results.
8.3 FUNCTIONAL UNIT AND REFERENCE FLOWSBoth functional units and reference flows provide references to which input and out-put data are normalized in a mathematical sense. Both functional units and reference flows shall be clearly defined and measurable (ISO 14044:2006). A functional unit describes the quantified performance of the function(s) delivered by a final product. Reference flows provide a quantitative reference for intermediate products.
Livestock products are characterized by a large variety of uses (see ENVIFOOD Protocol, 6.2.2.2) and the functions they deliver change according to their use. In addition, many livestock products might be both intermediate products and final products. For example, farmers can distribute raw milk directly to consumers or supply it to dairy industry for processing. For these reasons, and to ensure consis-tency across assessments conducted at the sectoral level, livestock products are not classified in final and intermediate products in these guidelines, and accordingly, no differentiation is made between functional units and reference flows.
Recommended functional units/reference flows for different main product types are given in Table 1. Where meat is the product type, the functional unit/reference flow when the animal leaves the farm shall be live weight, and when the product leaves the meat-processing plant (or abattoir) the functional unit/reference flow shall be the weight of product (meat-product weight) destined for human consumption. In many Western countries with commercial processing plants, the product weight has traditionally been identified as carcass weight at the stage of leaving the meat-processing plant. Carcass weight (sometimes called dead weight) generally refers to the weight of the carcass after removal of the skin, head, feet and internal organs, in-cluding the digestive tract (and sometimes some surplus fat). However, these internal organs, for the most part, are edible. Red offals (e.g. liver, kidney, heart) and green offals (e.g. stomach and intestines) are increasingly being harvested and should be included in the edible yield where they are destined for human consumption.
In developing countries, the meat-processing site may vary from processing plants to ‘backyard’ or cottage industry processing, and a higher proportion of the animal may be harvested for human consumption. Note that the ‘product weight’ includes bone retained within the animal parts for human consumption (primary processing plants for small ruminants typically leave bone in many of the meat cuts). The relative bone content has been estimated at approximately 18 percent of a sheep’s carcass weight in UK studies (EBLEX, 2012, 2013). Ideally, the bone

28
Greenhouse gas emissions and fossil energy use from small ruminant supply chains
content of the total meat product would be defined, but this is rarely measured. However, it shall be stated when the functional unit/reference flow includes bone-in, and if the bone content is outside the usual range for the carcass component, it shall be described, and an estimate of the bone content provided. Where specific data for ‘product weight’ is not available, the cold carcass weight shall be used and can be estimated from the live weight using default values, based on a summary of international data (Appendix 3). No distinction is made between different cuts of meat, including edible offal, and they shall be treated as equivalent (with no specific allocation method used for different cuts). An example of the relative content by weight of different meat cuts and co-products is given in Box 4 in Section 11.6.3.
Where fibre is the main product type, the functional unit/reference flow shall be greasy weight (as shorn off the animals) at the farm gate or clean weight after it leaves a scouring plant. The scouring plant is the only primary processing stage covered by these guidelines (see Section 8.4).
Where milk is the main product type, the functional unit/reference flow shall be the weight of the milk as it leaves the farm gate corrected for fat, protein and lactose content. The latter standardizes the milk after adjustment for differences associated with animal type, breed and production. To provide comparison with dairy cow milk, the following equation from the IDF (2010) methodology is recommended for energy-corrected milk (ECM):
kg ECM = kg milk x (0.1226 x fat% + 0.0776 x true-protein% + 0.0621 x lactose%)
Where crude-protein percentage is used instead of true-protein percentage, the relevant multiplier is 0.0722 (instead of 0.0776). This equation standardizes the milk to 4 percent fat, 3.3 percent protein and 4.8 percent lactose. Research indicates that lactose percentage can vary during the lactation season and with the species (e.g. Park and Haenlein, 2006), and therefore it is desirable to account for lactose percentage in the equation for ECM. However, if data on lactose percentage are unavailable, a default value of 4.8 percent lactose shall be used for sheep and goats. After the milk primary processing stage there are a wide range of possible products, and the appropriate functional unit/reference flow reported shall be the weight of the specific product (milk-product weight).
8.4 SYSTEM BOUNDARY8.4.1 General/scoping analysisThe system boundary shall be defined following general supply chain logic and include all phases from raw material extraction to the point at which the functional unit is produced. A full LCA would include processing, distribution, consumption
Table 1: Recommended functional units/ reference flows for the three different main product types from small ruminants according to whether they are leaving the farm or the primary product processing gate
Main product type Cradle to farm gate Cradle to primary processing gate
Meat Live weight (kg) Meat product(s) (kg)
Fibre Greasy weight (kg) Clean weight (kg)
Milk ECM (kg) Milk product(s) (kg)

29
Greenhouse gas emissions and fossil energy use from small ruminant supply chains
and product end-of-life management. However, this guide does not cover post-primary processing stages in the supply chain.
The overall system boundary covered by these guidelines represents the cradle-to-primary-processing stages of the life cycle of the main products from small ruminants (Figure 6). It covers the main stages from the cradle to farm gate, the transportation of animals to primary processor and to the primary processing gate (e.g. to the output loading dock).
The modular approach outlined in Section 7.2 illustrates the three main stages from the cradle to primary processing gate. The feed stage is addressed in detail in the associated LEAP Animal Feed Guidelines and encompasses the cradle-to-ani-mal-mouth stage for all feed sources, including raw materials, inputs, production, harvesting, storage and feeding, and other feed-related inputs (e.g. milk powder for feeding lambs and kids and nutrients directly fed to animals), which are covered in detail in Section 11.2).
The animal production stage deals with all other inputs and emissions associated with animal production and management not covered by the LEAP Animal Feed Guidelines. It is important to ensure that all farm-related inputs and emissions are included in the feed and animal stages, and to avoid double counting. The animal production stage includes accounting for breeding animals and animals used direct-ly for meat/milk/fibre production. This may involve more than one farm if animals are traded between farms before processing.
The primary processing stage shall be limited to the primary milk-processing factory, the scouring or cleaning stage for fibre, and animal slaughter facility (back-yard, village slaughter centre and abattoir) for meat processing. All transportation steps within and between the cradle and primary processing gate shall be included.
The choice of basic milk, meat products and clean fibre as typical sector outputs is intended to provide a point in the supply chain that has an analogue across the range of possible systems, geographies and goals that may be encountered in prac-tice. Basic milk and meat products may be used directly by the consumer (particu-larly in developing countries) or may undergo further secondary processing with the addition of other constituents to make more complex food products (e.g. sweet-ened fruit yoghurt, lasagne). For fibre, a range of secondary processing options exists, depending on the end product. Examples include: yarn and fibre spinning, dyeing, knitting and weaving and garment-making; spinning and carpet or rug mak-ing; or the direct use as insulation or absorbent for contaminants, such as oil spills.
Several available PCRs extend beyond the system boundary covered in these guidelines, and include the post-primary processing supply chain for meat (Boeri, 2013) and fibre (Rossi, 2012). There are currently no PCRs for processed milk prod-ucts from small ruminants, but there are for dairy cow milk products (e.g. Sessa, 2013b). There are no PCRs for carpets, but some early LCA publications exist for carpets (e.g. Petersen and Solberg, 2004; Potting and Blok, 1995) that illustrate some of the non-fibre constituents and additional processes. There is a PAS for textile products (BSI, 2014).
Figure 6 illustrates a range of co-products produced from the farm to primary pro-cessing gate, whose further processing fall outside the system boundary covered by these guidelines. There are no PCRs related specifically to these co-products. How-ever, there are some relevant LCA publications for leather (Joseph and Nithya, 2009; Milà i Canals et al., 1998; Milà i Canals et al., 2002), biofuel from tallow (Thamsiriroj

30
Greenhouse gas emissions and fossil energy use from small ruminant supply chains
and Murphy, 2011), thermoplastic from blood meal (Bier, Verbeek and Lay,2012) and products from rendering the by-products of animal processing (Ramirez et al., 2011).
Frequently a scoping analysis based on a relatively rapid assessment of the sys-tem can provide valuable insight into areas that may require additional resources to establish accurate information for the assessment. A scoping analysis can be con-ducted using secondary data to provide an overall estimate of the system’s impact. Furthermore, based on existing literature reviews in the small ruminant sector (Ap-pendix 1), it is relatively clear that for production systems the following factors are extremely important to assess with high accuracy: the ration, the feed conversion efficiency, reproduction efficiency, livestock daily growth rates and manure pro-duction and management. Depending upon the particular operation under study, additional effects may be observed. In the post-farm supply chain, energy efficiency at the processing and manufacturing stages, as well as an accurate assessment of transportation modes and distances are important.
8.4.2 Criteria for system boundaryMaterial system boundaries: A flow diagram of all assessed processes should be drawn that indicates where processes were cut off. For the main transformation steps within the system boundary, it is recommended that a material flow diagram
Figure 6System Boundary diagram for the life cycle of sheep or goats covering
three Main products (fibre, milk and meat)
(
t
Cradle to farm gate
Co-product(e.g. grain, oil)
Co-product(e.g. cattle live weight)
Wool/fibrescouring
Milk processing
Meatprocessing
Consumer
0
Productmanufacturer(e.g. carpet,
lasagne, flavoured yoghurt)
t
t
t
t
t
t
Co-product(e.g. lanolin)
Co-product(e.g. skin, blood,
tallow, renderables)
raw milk
live weight
greasy fibre
cleanfibre
milk products
meat products
Farm to primary processor gate
Co-product(e.g. whey)
Retailer orFood service
outlet
t
t
Land
Land
Externalfeed
On-farmfeed
Otheranimals
(e.g. cattle)
Sheepor
goats
Note: The large box covering the cradle-to-primary processing gate represents the stages covered by guidelines in this document, while the inner left box relating to land and feed is covered in the LEAP Animal Feed Guidelines. The encircled t symbol refers to the main transportation stages. The terms in italics refer to functional units of products leaving several different stages. The ‘sheep or goats’ box may include up to several phases of movement of animals between different farms/areas/systems before progress to primary processor.

31
Greenhouse gas emissions and fossil energy use from small ruminant supply chains
is produced and used to account for all of the material flows, (e.g. within the milk processing stage, the mass of milk solids entering the factory is defined and shall equate to the sum of the mass of milk solids in the range of products produced).
Spatial system boundaries: The cradle-to-farm-gate stage includes feed and animal components. The LCA of feeds is covered in detail in the LEAP Animal Feed Guidelines and covers the cradle-to-animal-mouth stage for all feed sources, including raw materials, inputs, production, harvesting, storage, loss and feeding. Feeds may be grown on-farm, animals may graze or browse across a range of feed sources on land with multiple ownership, and/or a proportion of the feeds may be produced off-farm and transported to the farm for feeding to animals. The LEAP Animal Feed Guidelines cover all emissions associated with direct land occupation and land-use change.
These guidelines cover all other inputs and emissions in the small ruminant sup-ply chain not covered by the LEAP Animal Feed Guidelines, i.e. emissions associ-ated with small ruminant production and management. Management includes ac-counting for the fate of excreta, where it is important to avoid double counting, if excreta is captured as manure and represents a direct input for feed production. The estimation of manure emissions from transport and application is included in the LEAP Animal Feed Guidelines. Animal production may involve more than one farm if animals are traded between farms prior to processing. For example, lambs and kids may be weaned or partly grown on one farm and sold on to another farm for finishing. These multiple components shall be accounted for in the calculations.
The primary processing stage is limited to animal slaughter, which may be done in the backyard, village slaughter unit or abattoir, for meat processing to produce the functional unit. For primary processing in developing countries, village slaughter centres are common. These can include direct processing, as well as sale of live ani-mals to consumers for home processing or on-selling to large abattoirs near cities. All emissions directly related to inputs and activities in the cradle-to-primary-process-ing-chain stages are included, irrespective of their location. All transportation steps within and between the cradle and primary processing gate are included, as well as any packaging materials associated with products sold from the slaughtering facility.
The system boundaries covered shall include the feed production, animal pro-duction and primary processing stages.
8.4.3 Material contribution and thresholdLCA requires tremendous amounts of data and information. Managing this infor-mation is an important aspect of performing LCAs, and all projects have limited re-sources for data collection. In principle, all LCA practitioners attempt to include all relevant exchanges in the inventory. Some exchanges are clearly more important in their relative contribution to the impact categories of the study, and significant ef-fort is required to reduce the uncertainty associated with these exchanges. In deter-mining whether or not to expend significant project resources to reduce the uncer-tainty of small flows, cut-off criteria may be adopted (Section 8.2). Exchanges that contribute less than 1 percent of mass or energy flow may be cut off from further evaluation, but should not be excluded from the inventory. Larger thresholds shall be explicitly documented and justified by the project goal and scope definition. A minimum of 95 percent of the impact for each category shall be accounted for. Inputs to the system that contribute less than 1 percent of the impact for a specific

32
Greenhouse gas emissions and fossil energy use from small ruminant supply chains
unit process (activity) in the system can be included with an estimate from a scoping analysis (Section 8.2). The scoping analysis can also provide an estimate of the total environmental impact to evaluate against the 95 percent minimum.
For some exchanges that have small mass or energy contributions there still may be a significant impact in one of the environmental categories. Additional effort should be expended to reduce the uncertainty associated with these flows. Lack of knowledge regarding the existence of exchanges that are relevant for a particular system is not considered a cut-off issue but rather a modelling mistake. The ap-plication of cut-off criteria in an LCA is not intended to support the exclusion of known exchanges, it is intended to help guide the expenditure of resources towards the reduction of uncertainty associated with those exchanges that matter the most in the system.
8.4.4 Time boundary for dataFor products from small ruminants, a minimum period of 12 months should be used, if this is able to cover all life stages of the animal through to the specified endpoint of the analysis. To achieve this, the study shall use an ‘equilibrium popula-tion’ that shall include all animal classes and ages present over the 12-month period required to produce the given mass of product.
Documentation for temporal system boundaries shall describe how the assess-ment deviates from the one-year time frame. The time boundary for data shall be representative of the time period associated with the average environmental impacts for the products.
In extensive production systems, it is common for important parameters to vary between years. For example, reproductive rates or growth rates may change based on seasonal conditions. In these cases where there may be considerable inter-annual variability in inputs, production and emissions, it is necessary for the one-year time boundary to be determined using data averaged over 3 years to meet representative-ness criteria. An averaging period of 3 to 5 years is commonly used to smooth the impact of seasonal and market variability on agricultural products.
It is important to state that in this section the time boundary for data is described, and not the time boundary of a specific management system. When the specific management system or additional system functions, such as wealth management or the provision of draught power, influence the life cycle of the animal this needs to be clearly stated. However, this would in general not influence the time boundary for the data being 12 months.
8.4.5 Capital goodsThe production of capital goods (buildings and machinery) with a lifetime greater than one year may be excluded in the LCI. All consumables and at least those capi-tal goods whose life span is below one year should be included for assessment, un-less it falls below the 1 percent cut-off threshold noted in Section 8.4.3.
8.4.6 Ancillary activitiesEmissions from ancillary inputs (e.g. veterinary medicines, servicing, employee commutes, executive air travel, accounting or legal services) may be included if rel-evant. To determine if these activities are relevant, an input-output analysis can be used as a scoping analysis.

33
Greenhouse gas emissions and fossil energy use from small ruminant supply chains
8.4.7 Delayed emissionsAll emissions associated with products to the primary processing stage are assumed to occur within the time boundary for data, generally of one year (Section 8.4.4). Delayed emissions from soil and vegetation are considered in the LEAP Animal Feel Guidelines. The PAS 2050:2011 provides additional guidance regarding de-layed emissions calculations for interested practitioners.
8.4.8 Carbon offsetsOffsets shall not be included in the carbon footprint. However, they may be report-ed separately as ‘additional information’. If reported, details for the methodology and assumptions need to be clearly documented.
8.5 IMPACT CATEGORIESThese guidelines are primarily based on an assessment of GHG emissions. The total GHG emissions for individual gases are summed along the system boundary. Indi-vidual gases are then multiplied by the relevant characterization factor to convert them all into a common unit of carbon dioxide equivalents (kg CO2e). The char-acterization factors shall be based on the global warming potentials of the specific gases over a 100-year time horizon using the most recent Intergovernmental Panel on Climate Change (IPCC) factors, which can be found in the latest IPCC guid-ance documentation. Because characterization factors change as our understanding evolves, it is important to note in the report documentation what specific sources were used for them.
The fossil energy use should also be calculated, since all inputs of fossil fuels shall be determined as part of the data collection requirements for assessing GHG emis-sions. This is captured in the impact category called ‘cumulative energy demand’ and sub-category of non-renewable energy resources, and uses the higher heating value of the fuel for its characterization factor (Frischknecht, Heijungs and Hofstet-ter, 1998). It shall account for the embodied primary energy for the production and combustion of the various energy sources and may draw on recognized databases, such as ecoinvent (Frischknecht and Rebitzer, 2005). Fossil energy demand for the production and use of electricity, which will be specific for a particular country, shall also be included.
The LCA of products should account for a range of resource use and environmental impact categories. It is intended that in future these guidelines will be updated to in-clude multiple categories (Section 5.3).

34
Greenhouse gas emissions and fossil energy use from small ruminant supply chains
9. Multi-functional processes and allocation
One of the challenges in LCA has always been associated with the proper assign-ment (allocation) of shared inputs and emissions to the multiple products from multi-functional processes. The choice of the method for handling co-production often has a significant impact on the final distribution of impacts across the co-products. Whichever procedure is adopted shall be documented, explained and in-clude a a sensitivity analysis of the choice on the results. As far as feasible, multi-functional procedures should be applied consistently within and among the data sets. For situations where system separation or expansion is not used, the allocated inputs and outputs should equal unallocated inputs and outputs.
9.1 GENERAL PRINCIPLESThe ISO 14044:2006 standard gives the following guidelines for LCA practitioners with respect to practices for handling multi-functional production:
Step 1: Wherever possible, allocation should be avoided by:a. dividing the unit process to be allocated into two or more sub-processes and
collecting the input and output data related to these sub-processes; orb. expanding the product system to include the additional functions related to
the co-products.Step 2: Where allocation cannot be avoided, the inputs and outputs of the sys-
tem should be partitioned between its different products or functions in a way that reflects the underlying physical relationships between them. In other words they should reflect the way in which the inputs and outputs are affected by quantitative changes in the products or functions delivered by the system.
Step 3: Where physical relationship alone cannot be established or used as the basis for allocation, the inputs should be allocated between the products and functions in a way that reflects other relationships between them. For example, input and output data might be allocated between co-products in proportion to their economic value.
Where allocation of inputs is required (e.g. the allocation of process energy be-tween small ruminant meat and other non-human edible products), the allocation procedures should follow the ISO 14044:2006 allocation hierarchy. When alloca-tion choices significantly affect the results, a sensitivity analysis shall be performed to ensure the robustness of conclusions. Below is a list of commonly used proce-dures for addressing multi-functional processes in attributional studies:
•biophysical causality, arising from underlying biological or physical relation-ships between the co-products, such as material or energy balances;
•physical properties, such as mass, or protein or energy content; and•economic value (revenue share) based on market prices of the products.

35
Greenhouse gas emissions and fossil energy use from small ruminant supply chains
9.2 A DECISION TREE TO GUIDE METHODOLOGY CHOICES A decision tree diagram to help with decisions on the appropriate methodology for dealing with co-products is given in Figure 7. It uses a three-stage approach, and the principles involved in working through it are as follows:
Stage 1: Avoid allocation by subdividing the processing system.A production unit is defined here as a group of activities (along with the inputs, machinery and equipment) in a processing facility or a farm that are needed to pro-duce one or more co-products. Examples are the crop fields in an arable farm; the different animal herds (sheep, goats, cattle, deer);or the individual processing lines in a manufacturing facility.
In the first stage (ISO step 1a subdivision), all processes and activities of a farm/processing facility are subdivided based on the following characteristics:
flow 1.a. Inputs/activities that can be directly assigned to a single co-product should be assigned to that co-product (e.g. packaging and post-processing storage for meat products, or rendering energy requirements in the post-exsanguina-tion phase at the processing plant).
flow 1.b. Inputs/activities that can be assigned to single production units and that may provide multiple co-products should be assigned to the specific production unit, (e.g. input of pesticides for corn are assigned to the ‘corn production unit’ of a farm with multiple crops; or energy inputs for a specific barn operation or manufacturing facility; or feed for a spe-cific animal, which may yield multiple products, in a farm operation with several species).
flow 1.c. Inputs/activities of a non-specific nature in a farm or processing facility, such as heating, ventilation, climate control and internal transport in a manufacturing facility or farm, that cannot be directly attributed to specific production units. For example energy to pump drinking wa-ter for multiple animal species in a small-scale, multi-species operation would be categorized as non-specific. It may be possible for these inputs to be assigned to each production unit in proportion to the causal rela-tionship that determines increased need for each input, such as weight, volume or area (transport, roads, buildings) or revenue (office and ac-counting).
Stage 2. Attribute combined production to separate production unitsIn theory, all combined production systems are separable, where sufficiently de-tailed data exist, and should normally follow path 1a. Nevertheless, situations exist where this is impractical, and in the next stage (stage 2 in Figure 7), the non-specific processes should be attributed to production units on the basis of ISO steps 1b, 2 and 3. For example sheep, goats, cattle, alpaca and deer may be all raised in a single production unit. In this situation, farm overhead operations that cannot be explic-itly assigned to an individual species should be handled using the criteria in Box 2. For some production systems, the 1b path to Box 3 will be followed, as the inputs and outputs in a single animal-species system are clearly assigned to the single pro-duction unit and its activities/operations and products.
System expansion: ISO step 1b: As part of the harmonization effort behind these guidelines, the range of allocation options in application of LCA is restricted to small ruminant systems and exclude the application of system expansion by means

36
Greenhouse gas emissions and fossil energy use from small ruminant supply chains
Figu
re 7
Syst
em B
ound
ary
diag
ram
for
the
life
cycl
e of
she
ep o
r go
ats
cove
ring
thre
e M
ain
prod
ucts
(fibr
e, m
ilk a
nd m
eat)
2b
Is it
po
ssib
le t
oat
trib
ute
in/o
utp
uts
to a
sin
gle
pro
du
ctio
n u
nit
?
YES
For
exam
ple
CH
P
Dra
w u
p in
ven
tory
tab
leA
ttri
bu
te a
ll in
pu
tsan
d o
utp
uts
to
th
esi
ng
le p
rod
uct
ion
un
its
Do
th
ese
op
erat
ion
sg
ener
ate
an o
utp
ut
that
un
amb
igu
ou
sly
avo
ids
exte
rnal
pro
du
ctio
n?
Ap
ply
sys
tem
exp
ansi
on
by
esti
mat
ing
avo
ided
emis
sio
ns.
(e
.g. E
ner
gy
del
iver
ed t
o g
rid
)
NO
Can
gen
eric
inp
uts
/o
utp
uts
be
div
ided
on
th
e b
asis
of
a(b
io)p
hys
ical
mec
han
ism
/p
aram
eter
that
exp
lain
sat
trib
uti
on
to
sin
gle
pro
du
ctio
n u
nit
s?
NO
Ap
ply
eco
no
mic
allo
cati
on
YES
Ap
ply
(b
io)p
hys
ical
allo
cati
on
. (e.
g.
Plan
t/an
imal
nee
ds
(bio
ph
ysic
al))
NO
Is a
co
-pro
du
ct u
sed
to g
ener
ate
ano
utp
ut
that
un
amb
igu
ou
sly
avo
ids
exte
rnal
pro
du
ctio
n?
YES
Ap
ply
sys
tem
exp
ansi
on
by
esti
mat
ing
avo
ided
emis
sio
ns.
(e.g
. En
erg
y d
eliv
ered
to
gri
d)
NO
Are
th
e re
mai
nin
gco
-pro
du
cts
con
sid
ered
as
bei
ng
resi
du
al, w
aste
or
mai
n c
o-p
rod
uct
CO
-PR
OD
UC
TS
Can
th
e re
mai
nin
gco
-pro
du
cts
be
div
ided
on
th
e b
asis
of
a (b
io)p
hys
ical
mec
han
ism
/ p
aram
eter
that
exp
lain
sat
trib
uti
on
to
co
-pro
du
cts?
RESID
UA
LP
RO
DU
CT
WA
STE
Cu
t o
ff
(an
d a
ttri
bu
tep
ost
sp
litti
ng
ste
ps
if n
eed
ed)
Incl
ud
e em
issi
on
san
d r
eso
urc
e u
sefr
om
was
tetr
eatm
ent
inin
ven
tory
YES
Ap
ply
(b
io)p
hys
ical
allo
cati
on
NO
NO
Is g
rou
pin
g o
f co
-pro
du
cts
des
irab
lefo
r va
luat
ing
th
eso
ciet
al f
un
ctio
n(v
alu
e) o
f p
rod
uct
s?(e
.g. D
iffe
ren
t q
ual
ity
gra
des
)
Ap
ply
eco
no
mic
allo
cati
on
on
pro
du
ct g
rou
p le
vel
Y
ES
Is it
po
ssib
le t
oat
tib
ute
in/o
utp
uts
dir
ectl
y to
a s
ing
lep
rod
uct
?
NO
YES
1a
1b
1c
2a 2c
3a 3b 3c 3d 3e
3f
3b1
3a1
3e3f
1a
SIN
GLE
PR
OD
UC
T
Avo
id a
lloca
tio
n b
y su
bd
ivid
ing
th
e p
roce
ss s
yste
m f
urt
her
an
dg
rou
p a
ll d
ata
in t
hre
e ca
teg
ori
es
Att
rib
ute
jo
int
pro
du
ctio
n o
n f
arm
or
pro
cess
ing
pla
nt
to s
ing
le p
rod
uct
ion
un
its
1
2
Split
sin
gle
pro
du
ctio
n u
nit
s in
to s
ing
le p
rod
uct
s3
Use
th
e al
loca
tio
nke
ys +
th
e d
efin
edav
oid
ed p
rod
uct
sto
rel
ate
the
sin
gle
pro
du
ctio
nu
nit
inve
nto
ry
to s
pec
ific
sin
gle
pro
du
cts.
Als
oin
clu
de
imp
acts
fro
m w
aste
man
agem
ent
Ap
ply
eco
no
mic
allo
cati
on
on
pro
du
ct le
vel
YES
For
exam
ple
• Pe
stic
ides
use
• A
pp
lied
fee
d•
Shee
p o
r g
oat
s
NO
For
exam
ple
• G
ener
ic f
arm
/fiel
d o
per
atio
ns
• H
eati
ng
, ven
tila
tio
n, a
nd
air
con
dit
ion
ing
an
d li
gh
tin
g
Not
e: T
he c
hoic
e of
met
hod
for
hand
ling
mul
ti-f
unct
iona
l out
puts
for
each
sta
ge o
r pr
oces
s in
the
supp
ly c
hain
sha
ll be
bas
ed o
n th
is d
ecis
ion
algo
rith
m. A
lloca
tion
key
s us
ed in
the
righ
t-m
ost b
ox r
efer
to
the
fact
ors
deri
ved
duri
ng a
pplic
atio
n of
the
deci
sion
tree
that
are
use
d to
allo
cate
inpu
ts a
mon
g m
ulti
ple
func
tion
s. F
or e
xam
ple,
if e
cono
mic
allo
cati
on is
use
d (e
.g. t
o ar
rive
at 3
c), t
he a
lloca
tion
key
fo
r th
at s
tage
is th
e ra
tio
of th
e re
venu
e of
the
co-p
rodu
ct o
f int
eres
t to
the
tota
l rev
enue
for
the
acti
vity
.

37
Greenhouse gas emissions and fossil energy use from small ruminant supply chains
of substitution. Furthermore, its use is limited to situations in which “expanding the product system to include the additional functions related to the co-products” is acceptable within the goal and scope of the study (ISO 14044:2006). In sheep production, for example, this implies that the environmental impacts can only be attributed to the combined multiple outputs of cull ewe and lambs (as meat), wool and milk, and that no individual function receives a separately identified impact. For benchmarking operations, this is an entirely appropriate perspective; the over-all reduction of impacts for the multi-functional system can be easily monitored and managed. The alternative, the consequential use of system expansion using an avoided burden calculated through substitution is not compliant with these guide-lines.
Allocation: ISO step 2: When system expansion to include additional functions within the scope of analysis is not possible, the second question is whether a physi-cal allocation is possible. The condition imposed by these guidelines here is that the products should have similar physical properties and serve similar goals or markets (e.g. human food as opposed to pet food markets for products of meat processing). Alternatively, known processing or biophysical relationships can be used to assign inputs and outputs of a single production unit to each product that is produced from that production unit (ISO 14044:2006, 4.3.4.2, Step 2). For example, if feed is provided to multiple animal species, the animal growth requirements may be used to apportion the shared feed between the species. The result of this stage will be a splitting of some inventory flows between the production units, and if the resul-tant process is multifunctional, these inventory flows will be allocated to single co-products in the next stage of the procedure (Box 3 in Figure 7).
If inputs in a multiple production system benefit all products and cannot be spe-cifically assigned to production units, the allocation should be preferably based on a mechanistic algorithm or physical property (flow 2b in Figure 7).
Allocation: ISO step 3: When physical allocation is not possible or allowed, the last option is economic allocation. As with physical allocation, the result of this step will be a splitting of some inventory flows between the production units, and if the resultant unit process is still multifunctional, these inventory flows will be allocated to single co-products in the next stage of the procedure (Box 3 in Figure 7).
Stage 3. Split single production units into individual co-products.After stages 1 and 2, all inputs and operations will have been attributed to the single
production unit, or already to a single product. An inventory table is made for the production unit. Stage 3 guides the assignment of inputs and emissions from a single production unit to each co-product produced by the unit. If there is only a single product at this stage, the process is complete. The same rule holds as the one defined above for production units, so system expansion (without substitution) should be ap-plied in situations where supported by the goal and scope definition. Any flow aris-ing from 2a will follow this path. When system expansion is not used, the remaining outputs shall be classified as co-products, residual products or wastes.
Outputs of a production process are considered as residual flows (3f) if:• they are exported in the condition in which they are created in the process and
do not contribute revenue to the owner; • they are included in value-added steps beyond the boundary of the small
ruminant system under study, but these activities do not impact the small ruminant system calculations in these guidelines.

38
Greenhouse gas emissions and fossil energy use from small ruminant supply chains
Residual products will not receive any allocated emissions, nor will they contrib-ute emissions to the main co-products of the production unit. However, it is useful to track residual flows for the purpose of understanding the mass balance for the production unit.An output of a production process shall be considered as waste if the production unit incurs a cost for treatment or removal. Waste has to be treated and/or disposed of, and these emissions shall be included in the inventory and allocated among the co-products. It is, of course, necessary that all activities associated with waste treatment fully comply with any local legal or regulatory requirements. For the small ruminant sector, the most common process in this category is wastewater treatment at manufacturing facilities.
Co-products, i.e. not residual or waste, are subject to allocation where some frac-tion of the entire production unit’s emissions are assigned to each co-product, lead-ing to flows 3b, 3c and 3d in Figure 7. Assignment to these flows depends upon whether biophysical or mechanistic allocation or an allocation based on physical characteristics is possible or allowed under these guidelines (3b), or whether an economic allocation at a single product (3c) or product group level (3d) is applied.
Following the ISO standard, the preferred approach is to identify a straightfor-ward mechanistic algorithm, or biophysical, causal relationship that can be used to assign inputs and emissions to each co-product. The condition for determining whether physical characteristic-based allocation (e.g. energy or protein content) is appropriate is that the products should have similar physical properties and serve similar functions or markets. When physical allocation is not feasible (interactions are too complex to accurately define a mechanistic relationship) or is not allowed (dissimilar properties or markets), the last option is economic allocation.
In the case of economic allocation, one option (flow 3d) is grouping a number of co-products and performing the allocation with some co-products at the group level instead of the single product level. This option is relevant for the various edible meat components (e.g. carcass cuts and edible offal), which shall be grouped before alloca-tion between them and other inedible co-products, such as hide and renderables.
9.3 APPLICATION OF GENERAL PRINCIPLES FOR SMALL RUMINANT SYSTEMS AND PROCESSES In practice, dealing with multi-functional processes and the choice of allocation method is a contentious issue in LCA studies. For small ruminants, there are a number of steps where allocation decisions are required. Thus, these guidelines go into some detail on each of these steps and give recommendations on the preferred allocation methodology for each one (Section 11.2.5 and 11.6). The recommended methods, based on use of the decision tree, are summarized in Table 2.
9.3.1 Cradle to farm gateWithin the cradle-to-farm-gate boundary there are a number of allocation decisions associated with feeds. The multi-functionality of feeds is addressed in the LEAP Animal Feed Guidelines. Within the animal production stage, there are two main areas where co-products need to be accounted for. These are:
•where different animal species consume the same feed source(s) and/or share non-feed related inputs; and
•where small ruminants produce multiple products of live animals (e.g. lamb, cull ewes), milk and fibre.

39
Greenhouse gas emissions and fossil energy use from small ruminant supply chains
In ruminant livestock systems, the major determinant of GHG emissions is en-teric methane (CH4) and excreta nitrous oxide (N2O) emissions, and the driver of these is feed intake. Consequently, if the activities, inputs or emissions cannot be separated, the preferred method to account for multi-functional processes and co-products shall be a biophysical approach based on feed intake associated with the different animal species or co-products.
In practice, accounting for multiple animal species (step 1c in Figure 7 since this is not a single production unit) is based initially on separation of activities between species and then on the determination of feed intake for each species (step 2b in Figure 7). Remaining shared inputs (e.g. energy use for water provision and animal movement) are allocated according to relative feed intake between species.
At a whole farm level, the equivalent output from this approach would be to determine all feed- and animal-related emissions for the farm, and use the allocation value for the target small ruminant species based on relative feed intake to deter-mine that species’ total emissions.
For sheep or goats, which are a single production unit and therefore follow step (1b), the allocation between live animals, milk and fibre co-products shall be based on biophysical allocation according to feed requirements for production of the products (described in detail in Section 11.2.5; step (3a1) and (3b) in Figure 7). This aligns with the IDF (2010) methodology for allocation between milk and meat for dairy cows. Previous studies have shown that the choice of allocation method for meat, milk and fibre co-products can have a significant effect on reported GHG
Table 2: Recommended methods for dealing with multi-functional processes and allocation between co-products for the cradle-to-primary-processing-gate stages of the life cycle of small ruminant products
Source/stage of co-products
Recommended method* Basis
Animal species (within farm)
1. System separation
2. Biophysical causality
First, separate the activities specific to an animal species. Then determine emissions specific to feeds relating to the sheep or goats under study. For remaining non-feed inputs, use biophysical allocation based on the proportion of total energy requirements for each of the different animal species.
Live animals, fibre, milk (within farm)
1. System separation
2. Biophysical causality
First, separate activities specific to products (e.g. electricity for shearing or milking). Then use biophysical allocation according to energy or protein requirements for animal physiological functions of growth, fibre production, milk production, reproduction and maintenance.
Milk processing to milk products
1. System separation
2. Physical
First, separate activities specific to individual products where possible. Then use allocation based on dry matter content
Fibre processing to clean fibre and lanolin
1. System separation
2. Economic
First, separate the activities specific to individual products where possible. Then use economic allocation possibly based on five years of recent average economic value.
Meat processing to meat and non-meat products
1. System separation
2. Economic
First, separate the activities specific to individual products where possible. Then use economic allocation possibly based five of recent average economic.
Note: * Where choice of allocation can have a significant effect on results, it is recommended to use more than one method to illustrate the effects of choice of allocation methodology. Specifically, it is recommended that biophysical causality and economic allocation are used in sensitivity assessment, and that market price fluctuations be included as a tested parameter in all economic allocation (ENVIFOOD Protocol).

40
Greenhouse gas emissions and fossil energy use from small ruminant supply chains
emissions (e.g. Ledgard et al., 2011; Gac et al., 2012). As noted previously, where choice of allocation can have a significant effect on results, more than one method shall be used to illustrate the effects of choice of allocation methodology.
This is also important when the guidelines are used for analysing the implications for co-products and the potential benefits of mitigation options. For example, de-pending on the methodology employed, the use of mitigation to reduce emissions from a main product may have unintended effects on increasing emissions from co-products and their associated production systems, leading to no overall benefits (e.g. Flysjö et al., 2012).
9.3.2 Allocation of manure exported off-farmThis discussion follows the decision tree presented in Figure 7. The first determi-nation that shall be made is the classification of manure as a co-product, waste or residual. This results in a separation of the system where all post-farm emissions from use of the manure are assigned to that subsequent use, while all on-farm man-agement is assigned to the main product(s) from the farm (live animals, milk, fibre) for which the previous allocation procedures apply.
Co-product: When manure is a valuable output of the farm, and if the system of manure production cannot be separated from the system of animal production, then the full supply chain emissions to the farm gate shall be shared by all the co-products. Following the recommendations provided in Figure 7, the first method for allocation is to apply a biophysical approach based on the energy for digestion that must be expended by the animal in order to utilize the nutrients and create the manure. This is calculated as the heat increment for feeding of the diet. It represents the energy expended by the end associated with the process of feeding and digestion, and is dis-tinct from maintenance energy requirements (Emmans, 1994; Kaseloo and Lovvorn, 2003). This situation may occur in any small ruminant system. There may be several co-products: culled ewes/does, lambs/kids, fibre, milk and manure. The allocation fraction assigned to each of the co-products shall be calculated as the ratio of the feed consumed that was required to perform each of the respective functions to the total feed consumed for all of the functions. In situations where energy content of the diet is unknown, the next step in a decision tree results in an economic allocation, because allocation based on physical characteristics parameters is clearly not appropriate, as the functions are different for the product (in the case of manure, fertilizer as op-posed to energy). However, it should be noted that in this situation, an inconsistency in methodology arises if biophysical allocation is used for part of the system while economic allocation is used for another part.
Residual: Manure has essentially no value at the system boundary. This is equiv-alent to system separation by cut off, in that activities associated with conversion of the residual to a useful product (e.g. energy or fertilizer) occur outside of the production system boundary. In this recommended approach, as previously stated, emissions associated with manure management up to the point of field application are assigned to the animal system, and emissions from the field are assigned to the crop production system.
Waste: Manure is classified as a waste generally only in two situations: when it is disposed of by landfill, incineration without energy recovery, or sent to a treatment facility; and when it is applied in excess of crop nutrient requirements. In the first case, all on-farm emissions shall be assigned to the animal product(s). However, in

41
Greenhouse gas emissions and fossil energy use from small ruminant supply chains
the second case, the fraction of manure applied to meet crop nutrient requirements should be considered as a residual as described above. The excess manure applica-tion shall be treated as a waste, and field emissions assigned to the animal produc-tion system. Emissions associated with the final disposition of manure as a waste are within the system boundary and shall be accounted and assigned to the animal product(s).
9.3.3 Primary processingFor the milk-primary-processing stage (a single production unit following steps 1b, 3a1 and 3b in Figure 7), allocation between co-products shall be based on the relative mass of fat + protein + lactose. The use of this approach for dairy prod-ucts aligns with that used in recent publications for milk products from dairy cows (Flysjö et al., 2011; Thoma et al., 2013b), and meets the requirements for similar-ity of products in Figure 7. However, for fibre and meat-processing systems the products have very different end uses, except in meat processing for offal and meat cuts, which are seen as having the same function, and are considered together in the same product group of ‘edible meat products’.Therefore, economic allocation is considered the most appropriate approach to allocate between the edible meat product group and the other non-edible co-products (e.g. hide, tallow, renderables), using Figure 7 steps (3b1) and (3c) or (3d). It is recognized that some co-products, which may be identified as being of no economic value after primary processing and would be classified as a residual (step 3f), may be collected and used for secondary processing (e.g. used for burning for energy or used for producing blood-and-bone meal). In that case, the product, having undergone secondary processing, is consid-ered to fall outside the system boundary for these guidelines.

42
Greenhouse gas emissions and fossil energy use from small ruminant supply chains
10. Compiling and recording inventory data
10.1 GENERAL PRINCIPLES The compilation of the inventory data should be aligned with the goal and scope of the LCA. The LEAP guidelines are intended to provide LCA practitioners with practical advice for a range of potential study objectives. This is in recognition of the fact that studies may wish to assess small ruminant supply chains ranging from individual farms, to integrated production systems, to regional, national or sectoral levels. When evaluating the data collection requirements for the project, it is nec-essary to consider the influence of the project scope. In general these guidelines recommend collection of primary activity data (Section 10.2.1) for foreground pro-cesses, those processes generally being considered as under the control or direct influence of the study commissioner. However, it is recognized that for projects with a larger scope, such as sectoral analyses at the national scale, the collection of primary data for all foreground processes may be impractical. In such situations, or when an LCA is conducted for policy analysis, foreground systems may be mod-elled using data obtained from secondary sources, such as national statistical data-bases, peer-reviewed literature or other reputable sources.
An inventory of all materials, energy resource inputs and outputs, including prod-ucts, co-products and emissions, for the product supply chain under study shall be compiled. The data recorded in relation to this inventory shall include all processes and emissions occurring within the system boundary of that product.
As far as possible, primary inventory data shall be collected for all resources used and emissions associated with each life cycle stage included within the defined sys-tem boundaries. For processes where the practitioner does not have direct access to primary data (background processes), secondary data can be used. When possible, data collected directly from suppliers should be used for the most relevant products they supply. If secondary data are more representative or appropriate than primary data for foreground processes (to be justified and reported), secondary data shall also be used for these foreground processes (e.g. the economic value of products over 5 years).
For agricultural systems, two main differences exist compared to industrial sys-tems. First, production may not be static from year to year, and second, some inputs and outputs are very difficult to measure. Consequently, the inventory stage of an agricultural LCA is far more complex than most industrial processes, and may re-quire extensive modelling to define the inputs and outputs of the system. For this reason, agricultural studies often rely on a far smaller sample size and are often presented as ‘case studies’ rather than ‘industry averages’. For agricultural systems, many foreground processes shall be modelled or estimated rather than measured. Assumptions made during the inventory development are critical to the results of the study and need to be carefully explained in the methodology of the study. To clarify the nature of the inventory data, it is useful to differentiate between ‘mea-sured’ and ‘modelled’ foreground system LCI data.

43
Greenhouse gas emissions and fossil energy use from small ruminant supply chains
The LCA practitioner shall demonstrate that the following aspects in data collec-tion have been taken into consideration when carrying out the assessment (adapted from ISO14044:2006):
•representativeness: qualitative assessment of the degree to which the data set reflects the true population of interest. Representativeness covers the three following dimensions:a. temporal representativeness: age of data and the length of time over which
data was collected;b. geographical representativeness: geographical area from which data for unit
processes was collected to satisfy the goal of the study;c. technology representativeness: specific technology or technology mix;
•precision: measure of the variability of the data values for each data expressed (e.g. standard deviation);
•completeness: percentage of flow that is measured or estimated;•consistency: qualitative assessment of whether the study methodology is
applied uniformly to the various components of the analysis;•reproducibility: qualitative assessment of the extent to which information
about the methodology and data values would allow an independent practi-tioner to reproduce the results reported in the study;
•sources of the data; •uncertainty of the information (e.g. data, models and assumptions).For significant processes, the LCA practitioner shall document data sources, data
quality and any efforts made to improve data quality.
10.2 REQUIREMENTS AND GUIDANCE FOR THE COLLECTION OF DATATwo types of data may be collected and used in performing LCAs:
•Primary data: defined as directly measured or collected data representative of processes at a specific facility or for specific processes within the product supply chain.
•Secondary data: defined as information obtained from sources other than direct measurement of the inputs and outputs (or purchases and emissions) from processes included in the life cycle of the product (PAS 2050:2011, 3.41). Secondary data are used when primary data of higher quality are not available or it is impractical to obtain them. Some emissions, such as those arising from enteric fermentation in the rumen of animals, are calculated from a model, and are therefore considered secondary data. For agricultural production, a large proportion of the data used will be secondary.
For projects where significant primary data is to be collected, a data management plan is a valuable tool for managing data and tracking the process of the LCI data set creation, including metadata documentation. The data management plan should include (WRI and WBCSD, 2011b, Appendix C):
•description of data collection procedures;•data sources;•calculation methodologies;•data transmission, storage and backup procedures; and •quality control and review procedures for data collection, input and handling
activities, data documentation and emissions calculations.

44
Greenhouse gas emissions and fossil energy use from small ruminant supply chains
The recommended hierarchy of criteria for acceptance of data is: •primary data collected as part of the project and that have a documented Qual-
ity Assessment (Section 10.3); •data from previous projects that have a documented Quality Assessment; •data published in peer-reviewed journals or from generally accepted LCA
databases, such as those described by the Database Registry project of the UNEP/SETAC Life Cycle Initiative;
•data presented at conferences or otherwise publicly available (e.g. internet sources); and
•data from industrial studies or reports.
10.2.1 Requirements and guidance for the collection of primary dataIn general, primary data shall, to the fullest extent feasible, be collected for all fore-ground processes and for the main contributing sources of GHG emissions. Fore-ground processes, here defined as those processes under the direct control of, or significantly influenced by, the study commissioner, are depicted in Figure 6 under feed, water and animals. Raw material acquisition represents background data. In most systems, the production of feed on farm is fully integrated into the produc-tion system and is therefore a foreground process, whereas brought-in feeds from off farm can be considered a background process. Some foreground processes are impractical to measure for an LCA, for example, a farm’s methane emissions from enteric and manure sources. In cases such as this, a model is used to estimate emis-sions, but if possible, the input data used for the model should be obtained from sources where direct measurements were made.
The practicality of measured data for all foreground processes is also related to the scale of the project. For example, if a national-scale evaluation of the small ruminant sector is planned, it is impractical to collect farm-level data from all small ruminant pro-ducers. In these cases, aggregated data from national statistical databases or other sourc-es (e.g. trade organizations) may be used for foreground processes. In every case, clear documentation of the data collection process and data quality documentation to ensure compatibility with the study goal and scope shall be incorporated into the report.
Relevant specific data shall be collected that is representative for the product or processes being assessed. To the greatest extent possible, recent data shall be used, such as current data from industry stakeholders. Data shall be collected that respect geographic relevance (e.g. for crop yield in relation to climate and soils) and aligned to the defined goal and scope of the analysis. Each data source should be acknowl-edged and uncertainty in the data quality noted.
Prior work (see Appendix 1) has identified the main hotspots and primary data (or modelled estimates using primary input data) that shall be used for these stages of the supply chain. Specifically, the cradle-to-farm-gate stage can dominate whole life cycle emissions (e.g. around 80 percent in Ledgard et al., 2011) and animal enteric methane can represent around 50-70 percent of cradle-to-farm-gate emissions. Thus, animal population and productivity, and feed quality data are key primary activity data need-ed to calculate enteric methane emissions and subsequently total emissions. Similarly, methane and nitrous oxide from animal excreta can represent about 5-35 percent of cradle-to-farm-gate emissions and also require that data on feed composition and chemical analysis be calculated. Where manure is collected from animals, methods of storage and use can have a significant effect on emissions. Primary activity data on

45
Greenhouse gas emissions and fossil energy use from small ruminant supply chains
this area is therefore required. The contribution from emissions associated with feed production can vary greatly from minimal in low-input extensive grassland/range-land/nomadic/transhumance systems to about 40 percent in intensive crop-based or zero-grazing systems where large amounts of chemical fertilizer may be used. Cor-responding direct on-farm energy use is also variable from minimal to about 20 per-cent, with a global average of about 2 percent (Gerber et al., 2013). In a whole life cycle analysis, Ledgard et al. (2011) showed that transportation accounted for up to 5 percent of total GHG emissions, including shipping of products up to 20 000 km to distant markets. The study showed that all emissions associated with meat processing (abattoirs) represented 3 percent of total life cycle emissions, with fuel use, electricity use and wastewater processing being the dominant contributors.
10.2.2 Requirements and guidance for the collection and use of secondary dataSecondary data refers to life cycle inventory data sets generally that are available from existing third-party databases, government or industry association reports, peer-reviewed literature, or other sources. It is normally used for background sys-tem processes, such as electricity or diesel fuel, which may be consumed by fore-ground system processes. When using secondary data it is necessary to selectively choose the data sets that will be incorporated into the analysis. Specifically, LCI for goods and services consumed by the foreground system should be geographically and technically relevant. An assessment of the quality of these data sets (Section 10.3.2) for use in the specific application should be made and included in the docu-mentation of the data quality analysis.
Where primary data are unavailable and where inputs or processes make a mi-nor contribution to total GHG emissions, secondary or default data may be used. However, geographic relevance should be considered. For example, if default data are used for a minor input, such as a pesticide, the source of production should be determined and a transportation component added to the estimated emissions to account for its delivery from site of production to site of use. Similarly, where there is an electricity component related to an input, an electricity emission factor for the country or site of use should be used that accounts for the energy grid mix.
Secondary data should only be used for foreground processes if primary data are unavailable, if the process is not environmentally significant; or if the goal and scope permit secondary data from national databases or equivalent sources. All sec-ondary data shall satisfy the following requirements:
•They shall be as current as possible and collected within the past 5-7 years. However, if only older data is available, documentation of the data quality is necessary and determination of the sensitivity of the study results to these data shall be investigated and reported.
•They should be used only for processes in the background system. When available, sector-specific data shall be used instead of proxy LCI data.
•They shall fulfil the data quality requirements specified in this guide (Section 10.3).•They should, where available, be sourced following the data sources provided
in this guide (e.g. Section 11.2.2 for animal assessment and Appendices 3 and 5).•They may only be used for foreground processes if specific data are unavail-
able or the process is not environmentally significant. However, if the quality of available specific data is considerably lower, and the proxy or average data sufficiently represents the process, then proxy data shall be used.

46
Greenhouse gas emissions and fossil energy use from small ruminant supply chains
An assessment of the quality of these data sets for use in the specific application should be made and included in the documentation of the data quality analysis.
10.2.3 Approaches for addressing data gaps in LCIData gaps exist when there is no primary or secondary data available that are suffi-ciently representative of the given process in the product’s life cycle. LCI data gaps can result in inaccurate and erroneous results (Reap et al., 2008). When missing LCI is set to zero, the result is bias towards lower environmental impacts (Huijbregts et al., 2001).
Several approaches have been used to bridge data gaps, but none are considered standard LCA methodology (Finnveden et al., 2009). As much as possible, the LCA practitioner shall attempt to fill data gaps by collecting the missing data. However, data collection is time-consuming, expensive and often not feasible. This section provides additional guidance on filling data gaps with proxy and estimated data, and is primarily targeted at LCA practitioners. Proxy data is never recommended for use in foreground systems as discussed elsewhere in this guidance.
The use of proxy data sets, i.e. LCI data sets that are the most similar to a pro-cess or product for which data is available, is common. This technique relies on the practitioner’s judgment, and is therefore, arguably, arbitrary (Huijbregts et al., 2001). Using the average of several proxy data sets instead of a single data set has been sug-gested as an option to reduce uncertainty, as has bridging data gaps by extrapolating from another related data set (Milà i Canals et al., 2011). For example, data from goat and sheep production could be extrapolated for production of other small ruminants (e.g. deer, llama, alpaca), based on expert knowledge of differences in feed require-ments, feed conversion ratios, excreta characteristics and fibre or antler production. Adapting an energy emission factor for one region to another with a different gen-eration mix is another example. While use of proxy datasets is the simplest solution, it also has the highest element of uncertainty. Extrapolation methods require expert knowledge and are more difficult to apply, but provide more accurate results.
For countries where environmentally extended economic input-output tables have been produced, a hybrid approach can also be used to bridge data gaps. In this approach the monitor value of the missing input is analysed through the input-output tables and then used as a proxy LCI data set. This approach is subject to uncertainty and has been criticized (Finnveden et al., 2009).
Any data gaps shall be filled using the best available secondary or extrapolated data. The contribution of such data, including gaps in secondary data, shall not ac-count for more than 20 percent of the overall contribution to each impact category considered. When such proxy data are utilized it shall be reported and justified. When possible, an independent peer review of proxy data sets by experts should be sought, especially when they approach the 20 percent cut-off point of overall contribution to each emission factor, as errors in extrapolation at this point can be significant. Panel members should have sufficient expertise to cover the breadth of LCI data that is being developed from proxy data sets.
In line with the guidance on data quality assessment, any assumptions made in filling data gaps, along with the anticipated effect on the product inventory final results, shall be documented. If possible, the use of such gap-filling data should be accompanied by data quality indicators, such as a range of values or statistical measures that convey information about the possible error associated with using the chosen method.

47
Greenhouse gas emissions and fossil energy use from small ruminant supply chains
10.3 DATA QUALITY ASSESSMENT LCA practitioners shall assess data quality by using data quality indicators. Gener-ally, data quality assessment can indicate how representative the data are and their quality. Assessing data quality is important for a number of reasons. It improves the inventory’s data content for the proper communication and interpretation of results, and informs users about the possible uses of the data. Data quality refers to characteristics of data that relate to their ability to satisfy stated requirements (ISO14040:2006). Data quality covers various aspects, such as technological, geo-graphical and temporal representativeness, as well as the completeness and precision of the inventory data. This section describes how the data quality shall be assessed.
10.3.1 Data quality rules Criteria for assessing LCI data quality can be structured by representativeness (tech-nological, geographical and temporal), the completeness regarding the impact cat-egory coverage in the inventory, the precision and uncertainty of the collected or modelled inventory data, and methodological appropriateness and consistency. Rep-resentativeness addresses how well the collected inventory data represents the ‘true’ inventory of the process for which they are collected regarding technology, geogra-phy and time. For data quality, the representativeness of the LCI data is a key com-ponent, and primary data gathered shall adhere to the data quality criteria of techno-logical, geographical and temporal representativeness. Table 3 presents a summary of selected requirements for data quality. Any deviations from the requirements shall be documented. Data quality requirements shall apply to both primary and secondary data. For LCA studies using actual farm data and targeted at addressing farmer behav-iour, ensuring that farms surveyed are representative and the data collected is of good quality and well managed is more important than a detailed uncertainty assessment.
10.3.2 Data quality indicatorsData quality indicators define the standard for the data to be collected. These stan-dards relate to issues such as representativeness, age and system boundaries. During the data collection process, quality of activity data, emission factors, and/or direct emissions data shall be assessed using the data quality indicators.
Data collected from primary sources should be checked for validity by ensuring consistency of units for reporting and conversion, and material balances to ensure that, for example, all incoming materials are accounted in products leaving the pro-cessing facility.
Table 3: Overview of selected requirements for data qualityIndicator Requirements/data quality rules
Technological representativeness • The data gathered shall represent the processes under consideration.
Geographical representativeness: • If multiple units are under consideration for the collection of primary data, the data gathered shall, at a minimum, represent a local region, such as EU-27.
• Data should be collected respecting geographic relevance to the defined goal and scope of the analysis.
Temporal representativeness • Primary data gathered shall be representative for the past three years and 5-7 years for secondary data sources.
• The representative time period on which data is based shall be documented.

48
Greenhouse gas emissions and fossil energy use from small ruminant supply chains
Secondary data for background processes can be obtained from different sources, for example, the ecoinvent database. In this situation, the data quality information provided by the database manager should be evaluated to determine if it requires modification for the study underway (e.g. if the use of European electricity grid processes in other geographical areas will increase the uncertainty of those unit processes).
10.4 UNCERTAINTY ANALYSIS AND RELATED DATA COLLECTION Data with high uncertainty can negatively impact the overall quality of the inven-tory. The collection of data for the uncertainty assessment and understanding un-certainty is crucial for the proper interpretation of results (Section 12) and reporting and communication (Section 12.5). The Product life cycle accounting and reporting standard provides additional guidance on quantitative uncertainty assessment that includes a spreadsheet to assist in the calculations.
The following guidelines shall apply for all studies intended for distribution to third parties and should be followed for internal studies intended for process im-provement:
•Whenever data are gathered, data should also be collected for the uncertainty assessment.
•Gathered data should be presented as a best estimate or average value, with an uncertainty indication in the form a standard deviation (where plus and minus twice the standard deviation indicates the 95 percent confidence interval) and an assessment if data follow a normal distribution.
•When a large set of data is available, the standard deviation should be calcu-lated directly from this data. For single data points, the bandwidth shall be estimated. In both cases, the calculations or assumptions for estimates shall be documented.
10.4.1 Secondary activity dataSee Section 10.2.2.
10.4.2 Default/proxy dataSee Section 10.2.2.
10.4.3 Inter- and intra-annual variability in emissions Agricultural processes are highly susceptible to year-to-year variations in weather patterns. This is particularly true for crop yields, but these variations may also affect feed conversion ratios when environmental conditions are severe enough to have an impact on an animal’s performance. Depending on the goal and scope definition for the study, additional information may be warranted to capture and identify either seasonal or inter-annual variability in the efficiency of the product system.

49
Greenhouse gas emissions and fossil energy use from small ruminant supply chains
11. Life cycle inventory
11.1 OVERVIEWThe LCI analysis phase involves the collection and quantification of inputs and out-puts throughout the life cycle stages covered by the system boundary of the study (Figure 6). This typically follows an iterative process (as described in ISO 14044: 2006), with the first steps involving data collection adhering to principles outlined in Section 10. The subsequent steps in this process involve recording and validation of the data; relating the data to each unit process and functional unit, including the allocation for different co-products; and aggregating the data, ensuring all signifi-cant processes, inputs and outputs are included within the system boundary. The system boundary (Figure 6) includes pre- and post-farm-gate stages.
11.2 CRADLE TO FARM GATEThe cradle-to-farm-gate stage consists of three main processes: the acquisition of raw material;, the supply of water and feed;, and animal production (Figure 8). Most raw material acquisition is associated with the production of feeds. Note that these guidelines provide limited background information related to animal feeds, as these are covered in the LEAP Animal Feed Guidelines. Information on animal feeds presented in this document is largely for context and because of the strong linkages between feeds and animal production. These linkages need to be considered when completing the LCA.
Supplying water to animals is essential for their survival, and energy inputs are often required for the provision of water (e.g. for pumping and reticulation) and/or its transport. The GHG emissions associated with these activities and other uses of energy shall be included. The production and provision of animal health inputs, which may include treatments for internal and external parasites, and infectious, reproductive and metabolic diseases, also make a small contribution to resource use and GHG emissions (e.g. Besier et al., 2010).
To assist the user in working through the process of calculating the carbon foot-print of products for the cradle-to-farm-gate stage, a flow diagram is presented in Figure 9.
At the cradle-to-farm-gate stage, previous research has shown that the largest single source of GHG emissions is methane from the digestion of feeds in the ru-men of goats and sheep (enteric fermentation). For example, Ledgard et al. (2011) estimated enteric methane at 57 percent of the total life cycle emissions for lamb from New Zealand consumed in England. Thus, it is important to obtain an accu-rate estimate (measured or modelled) of feed intake by small ruminants. This aspect is covered in detail in Section 11.2.2. However, an important first step is to define the feed types used and their feed quality characteristics.
11.2.1 Feed assessmentThe production, conservation and use of feeds can represent a significant contribu-tor to the total resource use and GHG emissions from small ruminant products. It is important to accurately identify the number and types of feeds used, which can

50
Greenhouse gas emissions and fossil energy use from small ruminant supply chains
vary markedly in different small ruminant production systems, as discussed in Sec-tion 6.2. The determination of the amount of each feed used is described in detail in Section 11.2.2.
Feed types can include: annual crop, where the feed source may be harvested grains; whole crop silage/hay or forage crops grazed in situ; and perennial plants, including pastures, range forages, browse and tree cuttings. A summary of the typi-cal composition (dry matter, energy, protein, fibre and phosphorus concentrations) of a very wide range of these feed types is given in a United States National Re-search Council document on feed requirements for small ruminants (NRC, 2007, Tables 15.11 and 15.12). Primary data on the composition of the main feed sources used shall be obtained for use in the LCI analysis wherever possible, but the Na-tional Research Council tables provide default values when primary data cannot be obtained.
Figure 8Processes that contribute to GHG emissions and fossil energy use covering raw materials, water use, feed production and use, and animal production
within the system boundary of the cradle to farm gate
INPUTS FOR WATER SUPPLY
• Production of energy carriers
INPUTS FOR MANAGEMENT AND ANIMAL HEALTH• Production of energy carriers• Production of animal health inputs e.g. anthelmintics
ANIMAL
Feed Use• Feed intake, digestion• Feed wastage
(during feeding)• Excreta deposition
Management• Use of fuel and electricity for: - Animal housing - Manure storage - Shearing, fibre handling - Milking• Use of refrigerants for: - Chilling milk
Animal Health• Use of consumables
Feed and waterRaw material acquisition Animals
WATER
• Use of fuels and electricity
INPUTS FOR MANAGEMENT AND ANIMAL HEALTH
• Production of energy carriers• Production of animal health
inputs (e.g. anthelmintics)
INPUTS INPUTS FOR FEED PRODUCTION
• Fertilizer production• Manure transport• Production of energy carriers• Production of pesticides
INPUTS FOR OTHER FEED-RELATED SOURCES
• Production of energy carriers• Production of milk powder• Production of nutrient supplements
OTHER FEED-RELATED SOURCES
• Milk powder for feeding lambs/kids
• Nutrients fed directly to animals (e.g. P, N, Mg, Se)
From LEAP Feeds LCA Guidelines
FEED (home-grown and brought in)
Production and Storage• Use of fertilisers, manure• Use of fuels and electricity• Use of consumables• Use of pesticides• Soil nitrogen and carbon processes• Direct Land Use Change• Savannah and crop residue burning• Emissions from applied manureProcessing, Storage and Feeding• Use of fuels and electricity• Transport of feeds to the animal’s
mouth
Note: The box with a blue background refers to inputs, processes and emissions covered by the LEAP Animal Feed Guidelines and not part of the current guidelines.

51
Greenhouse gas emissions and fossil energy use from small ruminant supply chains
Calculating environmental impacts of feed productionThe LEAP Guidelines document on the LCA of feeds describes the methodol-ogy for calculation of GHG emissions associated with the production, processing and storage of animal feeds. The main raw materials and processes that shall be accounted for in determining the emissions of feeds are given in Figure 8. Key con-tributors to GHG emissions are: inputs of fertilizers, manures and lime, including manufacturing, transport and application; fuel used for production, processing and
Figure 9Flow diagram as a guide to the procedure for determining the carbon footprint of
small ruminant products for the cradle-to-farm-gate stage
Define goal and scope
2. Describe system andfunctional Unit (s)
Draw system boundary diagram
Define farm structure, exclude non-animal
components (e.g. cash crops)
Define animal population(s) and draw
animal flow diagram
Summarize annual animal production, including
co-product (number/quantity, live weight , sales dates…)
Use animal data to calculate annual animal
energy requirements and DM intake
If > 1 animal species: Separate activities that
contribute to GHGs between individual species
Calculate actual amount of feed DM consumed annually
from purchased andhome-grown/grazed feeds.
Obtain related feed quality data
Define feed DM digestibility and calculate
volatile solids excreted
From DM intake and feed %N, calculate feed-N
intake by animals
From product yield and product %N, calculate
product-N output
Calculate Nexcreted fromNintake - Nproducts
Define electricity and fuel use
For each feed, determine GHG/kg DM for production,
processing, storage and use (see LEAP Animal Feed Guidelines)
Define other farm-related inputs used
Define quantity of each Functional Unit (FU)
Allocation decisions may be required to assign emission
to Functional Unit
Calculate direct andindirect N2O from excreta on pasture
Calculate CO2e from fuel and electricity
Calculate CO2e from feeds used (including
wastage)
Calculate CO2e from other inputs
Calculate GHGs and use GWP factors to calculate total CO2e
Calculate entericmethane
Calculate kg CO2e/FU
Calculate direct and indirect N2O from (housing) manure
management
Calculate dung/manure methane
1
2
3
4
5
6
7
8
12
9
10
11
13
14
15
16
17
Note: Content within the ellipse relates to allocation decisions, while rounded boxes are the specific GHG calculation steps.
52
Greenhouse gas emissions and fossil energy use from small ruminant supply chains
transport; crop residues that produce nitrous oxide emissions; and land-use change. Land-use change and carbon sequestration in soil can be important contributors to GHG emissions or removals, but these relate specifically to the feed production and, therefore, these aspects are covered in the LEAP Animal Feed Guidelines (see also PAS 2050:2011).
Many processed feeds or concentrates are used globally. Various databases are being developed by a number of groups, including FAO, that could provide default values for the total GHG emissions per kg feed. Default values are appropriate where relevant country-specific data are unavailable, and where their use is a minor component of the main feeds used.
When default published values for GHG emissions from the production of feeds are used, it is important to account for their system boundary. For example, the system boundary for the default values in the LEAP Animal Feed Guidelines ends at the ‘animal’s mouth’. When feed production emissions are integrated into the calculation of emissions for the cradle to farm gate, it is important to ensure that double counting is avoided and that all emissions are included.
In practice, there is wastage of feed at various stages between harvest and storage (covered in the LEAP Animal Feed Guidelines) and during the feeding of animals, and this shall be accounted for. For example, if there is 30 percent wastage between the amount fed to animals and the amount consumed, the emissions from feed in-puts shall be based on the amount fed. This waste feed may end up in the manure management system, and its contribution to subsequent methane and nitrous oxide emissions during storage shall be accounted for.
As noted in Section 6, a large proportion of sheep and goats globally are man-aged in extensive systems in which animals graze on perennial pastures or browse on mixed forage systems. In contrast to annual crops and concentrates, the impor-tant features of these feed types include: relatively low inputs associated with their production; lack of crop residues associated with regular plant renewal; and variable feed quality throughout the year. The latter characteristic means that a single aver-age dataset will be less accurate than if a seasonal or monthly profile of plant analy-ses is used and is linked with seasonal or monthly estimates of animal feed intake.
The amount of feed used shall be based on the calculated intake by the animals over a one-year period. Thus, for a feed that is harvested and brought to the animals (e.g. a concentrate), the annual amount of feed dry matter (DM) used (plus any allowance for wastage) shall be calculated and multiplied by the emissions per kg feed (i.e. kg CO2-equivalent/kg DM). In some extensive systems in Asia, Africa and Australia, during periods of extended drought, cuttings from trees would also represent a feed that is harvested and brought to animals. In such cases, there is a need to account for any inputs used in their production, as well as for the harvesting and transport of feed to the animals, to determine any feed-related emissions. Where that tree has multiple uses (e.g. for fruit production for sale as well as for a source of forage), the GHG emissions from the total inputs to the tree shall be allocated between the two uses, or if they are a very low-value waste product, no production-related emissions would be allocated to them (described in the LEAP Animal Feed Guidelines).
Cereal straw or other plant residues may be used for bedding in housed animal systems. In such cases, GHG emissions associated with the harvest and transporta-tion steps of such products shall be included.

53
Greenhouse gas emissions and fossil energy use from small ruminant supply chains
10.2.1 Animal population and productivityThe calculation of animal-derived GHG emissions (e.g. methane from enteric fer-mentation and, nitrous oxide from excreta) requires data on total feed intake and some feed quality parameters. In most small ruminant production systems, it is not possible to obtain direct data on feed intake. This applies particularly to farm sys-tems with direct grazing or browsing of perennial forage plants. Thus, feed intake is commonly determined indirectly using models that calculate feed requirements according to animal numbers and their productivity.
Most models used for the calculation of feed requirements derive intake from the energy requirements for animal processes of growth, reproduction, fibre production, milk production, activity (grazing and walking) and maintenance (e.g. IPCC, 2006; NRC, 2007). This requires data on relevant animal numbers and productivity.
To account for the total GHG emissions from animal products over a one-year time period, it is necessary to define the animal population associated with the pro-duction of the products (see Figure 10 for an example of a simplified sheep popula-tion). This requires accounting for the number of breeding female and male animals, replacement female and male animals, and surplus animals, not required for main-tenance of the flock, that are sold for meat. A minimum requirement for animal numbers for a stable population could be the number of adult breeding animals and
Figure 10Simplified example of a sheep population illustrating relative numbers of breeding
and replacement sheep on- arm and surplus sheep sold for meat processing
Cradle-to-farm-gate
Breeding rams
Rams lambs
Breeding ewes
Cull rams for
processing
Rams lambs for
processing
Cull ewesfor
processing
Ewe lambsfor
processingEwe lambs
Replacementrams hoggets
Replacementewe hoggets
20
500
1000
500
250
43
486
225
240
Deaths 1
Deaths 5
Deaths 10
Deaths 20
Deaths 10
Note: Based on breeding ewe flock of 1 000, 100 percent lambing, 25 percent replacement rate, 2 percent death rate and first lambing at 2 years of age.

54
Greenhouse gas emissions and fossil energy use from small ruminant supply chains
the number and class (age, category and gender) of animals sold for meat. However, it is recommended that an animal population ‘model’ be constructed from:
• the number of adult breeding animals; •a herd replacement rate, from which numbers of replacement animals could
be calculated; • fertility, i.e. lambing or kidding percentage, which is equivalent to the number
of animals weaned as a proportion of the number of breeding adult ewes/does, as well as lambs/kids produced from growing replacements (e.g. ewe hoggets);
•death rate; and•average age at first lambing/kidding.From the base animal population data, an annual stock reconciliation needs to
be derived that accounts for the time of lambing/kidding and time of sale of surplus animals. Ideally, a monthly stock reconciliation would be used. The benefit of hav-ing a Tier-2 methodology that uses calculated energy requirements (see Glossary) and specific seasonal or monthly data is that the effects of improvement in animal productivity on reducing the carbon footprint of products can be determined. For example, achieving the final slaughter weight of lambs earlier results in a lower feed intake and the maintenance feed requirement is reduced relative to the feed needed to achieve a given level of animal production.
The population data may need to be extended to include animals transferred between farms. For example, growing ‘store’ lambs may be sold or moved to another farm for finishing to final live weight before sending them off for pro-cessing. In this case, all necessary components for the production of the acquired animals on the contributing farm shall be accounted for, including adult breed-ing stock. For national or regional level analyses, this can be accounted for using average data. However, for case studies, it will require primary data from all the source farms. Where these data are unavailable, it will be necessary to use regional data for the specific animal classes on the contributing farm(s). Simplifications may be necessary for minor contributors, such as accounting for breeding rams or bucks. These are often sourced off other farms, but can be accounted for by assuming that they are derived from within the base farm system (e.g. Figure 10). Ideally, the transport component of externally sourced ram/bucks should be in-cluded in the calculations.
Calculation of animal productivity also requires average data on male and female adult live weight, the live weight of animal classes at slaughter, fibre production and milk production for milking sheep or goats. Average birth weight is also required, but a reasonable default value for lambs is 9 percent of the adult ewe live-weight and about 7 percent for goats.
Primary data on the animal population and productivity shall be used where pos-sible. The minimum amount of primary data to develop an animal population sum-mary was described above, but if this is unavailable, then an example of sheep flock and goat herd parameters for different regions of the world is given in Appendix 5.
Calculating energy or protein requirements of animalsA range of models are used internationally for estimating the energy require-ments, either as net energy or metabolizable energy (ME) of ruminants from ani-mal population and productivity data. Many of these have similar driving functions (e.g. maintenance requirements based on metabolic weight = body-weight0.75), with

55
Greenhouse gas emissions and fossil energy use from small ruminant supply chains
variations in equation parameters according to data from specific animal metabo-lism studies and field validations.
Where country-specific models for calculating the energy requirements for sheep or goats have been published, and used in that country’s National Greenhouse Gas Inventory, these shall be used. Where alternative models (e.g. region-specific pub-lished models) are used to improve the accuracy of the calculations, these should be described in detail and justified. Many groups in the GHG research area use the IPCC (2006) energy requirement model. Therefore, it is recommended that this model be used as the main default methodology. However, the equation for energy requirements for fibre growth shall be adjusted to account for the efficiency of ME requirements for fibre growth using 157 MJ/kg fibre (NRC, 2007) and not the cur-rent IPCC (2006) value of 24 MJ/kg fibre, which is simply based on energy content of wool. It is acknowledged that use of the IPCC (2006) model requires applica-tion of the sheep model for goats, and that it may give lower estimates than some other models, such as NRC (2007) and CSIRO (2007). The recommended order of preference is:
1. country-specific models used in the country’s National Greenhouse Gas Inventory;
2. other models that have been peer-reviewed and published that are applicable to the region and country;
3. IPCC (2006) model; 4. IPCC default Tier-1 values (this should be seen as a last resort).The determination of metabolizable protein requirements by animals is required
for systems where fibre is an important product, so that biophysical allocation between fibre and co-products (e.g. meat) can be calculated (Section 11.2.5). The above information on energy requirements also applies for protein requirements, including the hierarchy of methods. However, IPCC (2006) does not include cal-culations for protein requirements, and therefore option 3 will be the NRC (2007) metabolizable protein requirement models for sheep or goats.
Assessment of feed intakeIn a limited number of situations, it will be possible to use measured data to de-fine the amount of feed intake on farm to produce the animal product(s). This is only likely to apply where animals are permanently housed and all feed is brought to them. However, in most cases, small ruminants obtain feeds from a number of sources, including by grazing or browsing, and it is not possible to have an accurate measurement of the total amount of feed consumed. In such cases, the total feed intake is calculated from the total energy requirements of the animals.
Calculation of feed intake from the energy requirements of an animal that con-sumes a number of feed types will commonly require several steps. The following describes the process using ME.
The first step is to define the measured amount of feed intake from any supplied feed sources brought into the farm from an outside source (e.g. where concentrates are provided as a supplement). This must account for the total amount of the par-ticular feed(s) provided and adjusted for the level of feed consumption and wastage, using a utilization percentage. Some examples of losses by wastage are 5-10 percent when feed is provided to animals in specialized feeding facilities. These losses can be as high as 20-40 percent when animals are fed by spreading feed on the ground

56
Greenhouse gas emissions and fossil energy use from small ruminant supply chains
or pasture (DairyNZ, 2012). The first step in the calculation will involve subtracting the amount of ME consumed from the supplied feed(s), (based on the amount of feed DM intake and its specific energy concentration in MJ ME/kg DM) from the total energy requirements to determine ME intake from other feed source(s):
ME intakeother = Total ME requirement – (DM intake x MJ ME/kg DM)feed1 – (DM intake x MJ ME/kg DM)feed2
The difference (ME intakeother) will be the amount of energy consumed from other feed sources, such as from grazing pasture or browsing a mix of shrubs and forages. If there is one source (e.g. pasture), then the amount of DM intake from that source can be calculated (based on its specific energy concentration in MJ ME/kg DM) from:
DM intakeother = ME intakeother / (MJ ME/kg DM)other
If there is more than one other feed source, it will be necessary to determine the DM intake for each source from an estimate of the proportion of each feed type consumed and their specific energy concentrations in MJ ME/kg DM.
For each feed source utilized by sheep or goats, there is a need to have an accurate average estimate of the concentrations of DM, ME (MJ ME/kg DM), digestibility (kg digestible DM/kg total DM) and nitrgogen (g N/kg DM). While these will be necessar-ily averaged values, the most accurate data available for the specific system or regional system should be used. Digestibility and nitrogen content of the faeces are used in the calculations of emissions from excreta for methane andnitrous oxide, respectively. These feed compositional parameters can be obtained from feed measurements from the farm system(s) studied by using average published data relevant to the agro-eco-logical zone of interest, or consulting published national or global data for the relevant feeds. For forage or browse species that show marked seasonal variation in quality, seasonal data (or monthly data if available) should be used where possible. Default an-nual average data for a wide range of different feed sources are given in NRC (2007).
Animal enteric methane emissions According to IPCC (2006), an average of 6.5 percent (±1 percent) of gross energy intake is lost as enteric methane from the rumen of mature sheep and 4.5 percent from lambs less than 1 year old. Goats are assumed to have the same methane loss factors. Data for cattle generally indicate that this loss factor is higher for lower digestibility feeds, but there are limited data for development of scaling factors for small ruminants, and therefore the single emission factors shall be used.
Determination of the amount of methane emitted from each animal class requires multiplication of the total net energy or ME intake by each animal class (as described in Section 11.2.2) by methane emission factors. However, a first step is the conversion of total net energy or ME intake to gross energy intake, using data on feed percentage digestibility (see IPCC, 2006, Appendix 6). The annual quantity of methane emitted for each animal class is then calculated using the following equations:
kg methane/mature animal/year = gross energy intake (MJ/year) x 0.065 / 55.65kg methane/animal(<1 year-old)/year = gross energy intake (MJ/year) x 0.045 / 55.65

57
Greenhouse gas emissions and fossil energy use from small ruminant supply chains
The values of 0.065 and 0.045 refer to the 6.5 percent and 4.5 percent loss factors for methane of gross energy intake, while 55.65 is the energy content of methane in MJ/kg.
Thus, annual enteric methane emissions per animal per year are calculated through the above equations, using data on gross energy intake for one year for each animal class and integrating them across the number of animals. This represents a default in-ternational emission approach based on Tier-2 methodology. Where country-specific emission factors have been peer reviewed, published and integrated into the national GHG Inventory, then these shall be used instead If a user of these guidelines is unable to access sufficient basic data to apply the above approach, then a Tier-1 emission fac-tor could be used based on the IPCC (2006) default values of 8.5 kg and 5 kg methane/animal/year for sheep in developed countries, and sheep in developing countries and goats, respectively (based on live weights of 65 kg, 45 kg and 40 kg, respectively). How-ever, the use of Tier-1 factors means that the user has no ability to account for carbon footprint reductions associated with improvements in animal productivity.
11.2.3 Manure production and managementMethane emissions from animal excreta and manureMethane emissions from animal excreta and manure are estimated by first calcu-lating the amount of volatile solids produced. This represents the amount of feed consumed corrected for the component digested by animals and the non-volatile ash component that remains. The equations for calculating volatile solids in IPCC (2006; Equation 10.24) can be simplified to:
kg volatile solids = (kg DM intake / animal x (1.04 – DMD)) x 0.92
where DMD is the dry matter digestibility expressed as a fraction. For example, the percentage of DMD for perennial pastures in New Zealand varies throughout the year, from about 74 percent in summer to 84 percent in winter (Pickering, 2011). The 0.92 factor in the above equation is based on a default of 8 percent ash content of manure (i.e. using 1 – (%ash/100)), which should be modified if measured, or if country-specific values differ from this default.
The methane emission factor calculations for the volatile solids vary according to the manure management system and climate (IPCC, 2006). If the Tier-2 approach cannot be used, generic Tier-1 emission factors are given by IPCC (2006; Table 10.15) for sheep and goats in developed or developing countries, and different temperature regimes. Where country-specific emission factors have been peer reviewed, published and integrated into the national GHG inventory, then these shall be used instead
Nitrous oxide emissions from animal excreta and manureNitrous oxide emissions result from direct emissions from excreta, indirectly from ammonia released from excreta into the atmosphere and deposited back onto soil, and from nitrate leached to waterways. A Tier-2 approach shall be used whereby the amount of nitrogen excreted by animals is calculated using the animal produc-tion and feed intake model outlined in Section 11.2. The amount of DM intake is multiplied by the average nitrogen concentration (percentage nitrogen) of the diet (weighted according to the relative proportions of different feed types “t” in the diet) to get the amount of nitrogen consumed:

58
Greenhouse gas emissions and fossil energy use from small ruminant supply chains
kg N consumed = Σ (kg DM intake t x %N in feedt /100)
Nitrogen output in product(s) (meat, fibre, milk) is then subtracted from the nitrogen consumed to calculate the amount of nitrogen excreted:
kg N excreted = kg N consumed – kg N in products
Data on the average nitrogen concentration of a wide range of different feed sources is given in the LEAP Animal Feed Guidelines and NRC (2007), but this shall be over-ridden by measured values (primary data) or country-specific peer-re-viewed published values, if available. The nitrogen output in products is calculated from the amount of product multiplied by the protein concentration of the product and divided by 6.25 to convert protein to nitrogen:
kg N in products = Σ (kg product x (% protein in product / 100) / 6.25)
The values for protein concentration of products should be based on measured values or country-specific peer-reviewed published values, where possible. Typical default values for the protein concentration of meat (live weight gain basis), clean wool (dry weight basis; scoured wool typically has about 16 percent water) and milk from sheep are 21 percent, 100 percent and 5.8 percent, respectively (e.g. Pu-lina, Macciotta and Nudda, 2005). Corresponding typical values for goats for meat, clean fibre and milk are 21 percent, 100 percent and 3.0 percent, respectively.
Direct nitrous oxide emissions from excreta deposited on soil during grazing or browsing are calculated by multiplying the annual amount of nitrogen excreted by the IPCC (2006) emission factor of 0.01 kg N2O-N/kg nitrogen excreted (see Figure 11 for a summary of calculation components). Where country-specific emis-sion factors have been published and integrated into the national GHG Inventory, then these shall be used instead. When excreta is collected and processed through a manure management system, the storage-related emissions are to be included in this analysis. Where the stored manure is transported away and applied to land grow-ing a crop or pasture, the emissions associated with transport and application (after adjustment for nitrogen lost by volatilization) are found in the LEAP Animal Feed Guidelines.
It should be noted that in some cases, small ruminants may be moved from confined systems where manure is subject to management practices to grazing system where the manure is deposited on pasture within the duration of a single day. In this situation, the practitioner should estimate the total amount of time that the herd spends in each location and apportion the amount of volatile solids, calculated as described in Section 11.2.3, on the basis of the duration that the animals spend in each location. For example, if goats were held in confinement for 12 hours per day where manure was collected and subject to management practices, and allowed to graze pasture for 12 hours per day, the total volatile solids produced would be divided equally between manure manage-ment and pasture deposition. It is equally important to carefully consider the fraction of manure that is managed in each type of manure management system (e.g. composting, liquid storage). The best means of obtaining manure management system distribution data is to consult regularly published national statistics. If such statistics are unavailable, the preferred alternative is to conduct an independent survey of manure management

59
Greenhouse gas emissions and fossil energy use from small ruminant supply chains
system usage. If the resources are not available to conduct a survey, experts should be consulted to obtain an opinion of the system distribution.
For the calculation of N2O emissions from manure during storage, the relevant IPCC (2006) emission factors shall be used. For example, direct N2O emission factors in kg N2O-N/kg N from storage vary from nil for uncovered anaerobic lagoons; 0.005 to 0.01 from aerobic ponds (being less with forced aeration); 0.02 from dry lot; to 0.1 for composting with regular turning and aeration (IPCC, 2006; Table 10.21).
Indirect nitrous oxide emissions from ammonia emissions during storage first require an estimate of the amount of ammonia emitted. This can be calculated using model-predicted emissions, country-specific factors that have been pub-lished and integrated into the national GHG Inventory. These estimates should be aligned with manure handling and storage practices. If these estimates are not available, IPCC (2006) default ammonia loss factors (FRACGASM) for excreta-N deposited in deep-bedding or solid storage animal-housing manure management systems (25 percent and 12 percent, respectively) may be used. Ammonia-nitrogen loss is then multiplied by the IPCC (2006) emission factor (EF4) of 0.01 kg N2O-N/kg N excreted.
Indirect nitrous oxide emissions from ammonia loss and nitrogen leaching from excreta deposited directly to land during grazing shall be calculated as shown in Figure 11. Country-specific factors that have been published and integrated into the national GHG Inventory shall be used and, if not available, the IPCC (2006) default factors shall be used. Calculations first require an estimate of the amounts of ammonia loss and nitrogen leaching from excreta deposited on land. The default IPCC (2006) loss factor for FRACGASM is 20 percent of nitrogen excreted, and for FRACLEACH is 30 percent (for soils with net drainage, otherwise 0 percent) of ni-trogen excreted. These are then multiplied by the corresponding IPCC (2006) emis-sion factors (EF4 and EF5) of 0.01 kg N2O-N/kg N lost as ammonia and 0.0075 kg N2O-N/kg N lost from leaching/runoff, respectively.
The total nitrous oxide emissions from excreta and manure are calculated by add-ing the direct and indirect nitrous oxide emissions, after adjustment for the N2O/ N2O-N ratio of 44/28.
11.2.4 Emissions from other farm-related inputsThe other main inputs on farm that contribute to GHG emissions are largely asso-ciated with the use of fuels and electricity. Additional farm-related inputs that need to be accounted for include consumables used on farm. Nutrients administered di-rectly to animals and milk powder used for rearing lambs or kids are covered in the LEAP Animal Feed Guidelines.
The total use of fuel (diesel, petrol) and lubricants (oil) associated with all on-farm operations shall be estimated. Estimations shall be based on actual use and shall in-clude fuel and lubricants used by contractors involved in on-farm operations. Where actual fuel-use data are unavailable, these should be calculated from the operating time (hours) for each activity involved in fuel use and the fuel consumption per hour. This latter parameter can be derived from published data or from appropriate data-bases, such as ecoinvent. Note that any operations associated with the production, storage and transportation of animal feeds are not included here, but are covered in the LEAP Animal Feed Guidelines. Figure 8 indicates some of the main non-feed processes associated with the use of fuels, such as water transport, use of vehicles

60
Greenhouse gas emissions and fossil energy use from small ruminant supply chains
for animal movement, the removal of wasted feed and other farm-specific activities (e.g. visits by veterinarians).
The total amount use of a particular fuel type is then multiplied by the relevant coun-try-specific GHG emission factor, which accounts for production and use of fuel, to determine fuel-related GHG emissions. The process for calculating fuel-related GHG emissions also applies to electricity. Thus, all electricity use associated with farm activi-ties, excluding feed production and storage where they are included within the emission factor for feeds, shall be estimated. This includes electricity for water reticulation, ani-mal housing, milking and shearing of fibre from animals (Figure 8). Country-specific emission factors for electricity production and use shall be applied according to the electricity source. This would typically be the national or regional average and would account for the electricity grid mix of renewable and non-renewable energy sources, and should be based on the demand load from the farms if national data is available.
In some extensive production systems, nutrients required to avoid deficiency by animals (e.g. phosphorus, magnesium, sodium) may be delivered directly to animals rather than being applied to land for uptake by plants used as animal feeds. In such
Figure 11Summary of approach for calculating Nitrous Oxide emissions from animal excreta
and the animal waste management systems
N2O N2O N2ON2O N2O
NH3
EF3 EF4
Excreta N depositedduring grazing
Total excretaproduction
AnimalNumber
N excretionper headX
FRACGASM FRACGASM
Direct (grazing)
Indirect(volatile)
Indirect(leaching)
FRACGASM NH3 EF4
EF3
Indirect
Direct
FRACLEACH
In LEAP Feeds LCA Guidelines
Excreta N in AnimalWaste Management
System
Stored manure
EF5
N2O N2O
N2O
N2O
N2ON2O N2O
EF1 EF4
Direct (AWMS)
Indirect(volatile)
Indirect(leaching)
FRACLEACH
NO3 NH3 NO3
IPCC (2006)grazing values
FRACGASM = 0.20FRACLEACH = 0 or 0.3EF3 = 0.01EF4 = 0.01EF5 = 0.0075
IPCC (2006) AWMS
FRACGASM = 0.12 or 0.25EF3 = 0 to 0.1
EF5
(1-FRACGASM)
Applied to land
FRACLEACH NH3 EF5
Indirect
N2O
Note: Summary of approach for calculating N2O-N emissions from animal excreta and the animal waste management system (AWMS) using IPCC (2006, Volume 4, Chapter 10) activity factors (FRAC refers to fraction of N source contributing) and emission factors (EF in kg N2O-N/kg N). GASM = gaseous loss as ammonia; FRACgasm and EF1 vary with type of AWMS. For manure, only manure storage losses are included in these guidelines. Losses from land application are covered in the LEAP Animal Feed Guidelines.

61
Greenhouse gas emissions and fossil energy use from small ruminant supply chains
cases, this may represent a significant contribution to total GHG emissions and shall be accounted for, as described in the LEAP Animal Feed Guidelines.
Where there is a significant use of consumables in farm operations, the GHG emissions associated with their production and use should be accounted for. An example of this would be the emissions associated with the production of farm machinery or building infrastructure. This would generally be estimated from pub-lished data or from appropriate databases (e.g. ecoinvent). However, in practice, these will often constitute a very minor contribution and relevant data may be dif-ficult to access. See Section 8.4.3 for treatment of minor contributors.
11.2.5 Multi-functional processes and allocation of GHG emissions between co-productsAccounting for different animal species and non-feed activities within a farmMany farms present a mixture of animal species (e.g. sheep, goats, cattle, deer), which are often farmed together. It is recommended to separate activities of the farm sys-tem for the different animal species where specific uses can be defined (e.g. the use of summer forage crops to finish lambs only; the use of nitrogen fertilizer specifical-ly for pasture growth to feed beef cattle). For the remainder of the GHG emissions for the cradle-to-farm-gate stage, where there is common grazing or feeding of the same feed source, the actual amount of feed consumed by the sheep or goats under study shall be calculated as outlined in Section 11.2.2. Emissions associated with other non-feed shared activities (e.g. fuel used for animal movement, drain cleaning, hedge cutting, fencing maintenance) shall be allocated between animal species using a biophysical allocation approach. Preferably, this should be based on the calcula-tion of the total feed intake for each of the different animal species and the alloca-tion based on the relative feed intake between species (see Box 1).
Allocation between meat, milk and fibre productionSmall ruminants produce meat, milk and fibre. However, in most production sys-tems the focus is on one main product, or one product may provide the largest proportion of economic returns for the producer. For dairy cows where the main product is milk and meat is a co-product, a biophysical allocation approach is most widely used (e.g. Thoma et al., 2013a), and is recommended in the IDF (2010) meth-odology. The same approach shall be used for sheep or goats, where the main prod-uct is milk. Using a Tier-2 approach, the energy requirements for milk and meat production are calculated according to an internationally acceptable methodology (Section 11.2.2; since energy is the main determining requirement for these prod-ucts). The allocation ratio for milk, relative to milk plus meat (plus fibre, if it is also a minor co-product), is then calculated from the ratio of the energy requirement for milk production to the energy requirement for the production of milk, meat (the component for live weight sold for meat) and fibre (if relevant) (see Box 2):
Allocation % to milk = 100 x (energy req. for milk/[energy req. for milk + energy req. for meat + energy req. for fibre])
This equation is rearranged to calculate the corresponding allocation percentage to live weight for meat and fibre. Where milk or meat is the main product from the production system, biophysical allocation based on energy requirements shall be used. However, where fibre is an important product, biophysical allocation based

62
Greenhouse gas emissions and fossil energy use from small ruminant supply chains
Box 1. Example of calculation of multi-functional processes and allocation in a French mixed sheep and cattle farm
The figure below describes the farm system (based on Benoit and Laignel, 2011). The area identified as being used for cash crops is excluded in the calculation of GHG emissions from animals on farm. The main fodder area is pasture (in white), which is commonly grazed and used for silage or hay production for both sheep and beef cattle. The table below describes a process used in France to apportion GHG emissions between cash crops and animal species for the case study farm.
The figure above describes the farm system (based on Benoit and Laignel, 2011). The area identi-fied as being used for cash crops is excluded in the calculation of GHG emissions from animals on farm. The main fodder area is pasture (in white), which is commonly grazed and used for silage or hay production for both sheep and beef cattle. The table below describes a process used in France to apportion GHG emissions between cash crops and animal species for the case study farm.
Source/stage of co-products Recommended method Basis
1st: Split between cash crops and animal production (including crops for animals and forages)
Fuel Total fuel use only French empirical references (Litres/ha and litres/LU) used to build specific allocation keys
Electricity Total electricity only, except for specific usages (irrigation)
French empirical references (kWh/LU) used to build specific allocation keys
Manure fertilizers Amounts known for each crop and forages Split between cash crop and feeds for animals, i.e. system separation
Manure application
2nd: Then split between the different types of animal production
Forages (production and conservation for silage or hay, including plastics)
General data on forages only Biophysical allocation (based on relative feed intake) for forages (pasture, silage, hay) used by both animal species
Cereal crops and maize silage for animals
Quantities distributed to each animal species are known
System separation
Feed inputs (concentrates, vitamins, minerals, milk powder)
Quantities (or amount in €) distributed to each animal species are known
System separation
Breeding operations (e.g. reproduction, veterinary, drenches)
Can be assessed through economic value, but are known for each animal type
System separation
MaizeSilage(8 ha)
1/3
2/3
ForSheep
ForCattle
CashCrops
(34 ha)
Sheep (500 ewes: 73 Livestock Units or LU)
Beef cattle (35 cows: 40 LU)
Main fodder area (85 ha) Crops (41 ha)
(Cont.)

63
Greenhouse gas emissions and fossil energy use from small ruminant supply chains
Total fuel use is known, but this is used for production of cash crops, feeds for animals and general farm activities relating to animals (e.g. provision of feed, removal of feed waste, manure manage-ment, vehicles for animal movements). French researchers allocate fuel-related emissions between cash crops and each animal type using empirical functions derived from regional survey data and related to hectares of crop or livestock units (LU). In this case, a LU equates to one animal eating 4 750 kg DM; see table below).
Sheep production Cattle production Cash crops Total
References in buildings on areas
1 GJ/LU + 0.9 GJ/ha of fodder area +0.4GJ/ha crop
1.8 GJ/LU + 1.4 GJ/ha of fodder area +0.4GJ/ha crop
4.3 GJ/ha
Theoretical consumption
1*73LU +0.9*56= 123.4
1.8*40LU +1.4*36= 122.4
4.3*34ha=146.2
392
Allocation % 31.5 31.2 37.3 100
An alternative approach for fuel is to use records of all specific farm operations relating to each crop (e.g. hectares ploughed, rotary-tilled, sown, harvested), then use country-specific or published values for typical fuel use per hectare (e.g. Witney 1988) and integrate these for each system, thereby allowing a system separation approach. In this case, biophysical allocation would then be applied for the remaining fuel used for pasture-related activities and non-feed animal activities (e.g. manure management, animal movements) to allocate it between sheep and cattle (see below).
A similar approach is used for electricity use in France based on a database of average use for sheep, cattle or cropping (0.4 GJ/LU or 0.4 GJ/ha). Alternatively, a biophysical allocation ratio could be applied to allocate between animal types (see below).
System separation can be used for the main crops, other feed sources and animal breeding op-erations (see table above). However, the sheep and cattle jointly graze pasture on the farm and are jointly fed pasture silage and hay. Therefore, some method is required for apportioning the related inputs and emissions between sheep and cattle. The simplest biophysical allocation method is to use the total energy requirements (or DM intake) for sheep and cattle. In this case, the allocation factor (A) was calculated using:
A (%) = 100 x Sheep total DM intake/ (Sheep total DM intake + Cattle total DM intake)
In this farm, A = 100x347/(347+190) = 65% (where 347 and 190 are t DM intake calculated for sheep and cattle respectively). Thus, 65 percent of farm-related GHG emissions (or fossil energy use) that could not be separately estimated or derived through system separation would be attributed to sheep.
on protein requirements shall be used. The latter recommendation is based on the fact that fibre production is largely determined by protein requirements and not energy requirements. Additionally, most energy-based models are relatively weak in accounting for fibre production and simply include fibre production within the energy requirements for maintenance, or use a crude estimate of energy content of fibre (e.g. IPCC, 2006) In Section 11.2.2, it is recommended that the IPCC energy requirement for fibre be changed to 157 MJ/kg fibre).

64
Greenhouse gas emissions and fossil energy use from small ruminant supply chains
Box 2. Example of calculation of biophysical allocation between milk and live-weight for meat for goats in Kenya
This example refers to a dual-purpose goat system based on 100 breeding does producing 8 775 kg milk sold (and the same amount being fed to kids), and 3 440 kg live weight sold for meat (from surplus kids and cull does and bucks). It was based on data from Bett et al. (2007).
This example refers to a dual-purpose goat system based on 100 breeding does producing 8 775 kg milk sold (and the same amount being fed to kids), and 3 440 kg live weight sold for meat (from surplus kids and cull does and bucks). It was based on data from Bett et al. (2007).
A goat population structure was prepared and production data was used to calculate energy requirements using the IPCC (2006) model. Results for the goat population showing the relative breakdown between functions are given in the figure above.
The ratio (R) of energy requirements for sold-milk production (half of the total was sold, with the rest fed to kids) relative to meat production (based on the requirements for growth) was calculated using:
R = energy req. sold-milk/(energy req. sold-milk + energy req. growth) = 40.3/(40.3+17.4) = 0.70
Thus, the allocation percentage for milk and live weight for meat was 70 percent and 30 percent, respectively.
For sensitivity analysis of the effect of allocation method, the corresponding allocation percent-age for milk using economic allocation was 45 percent and using protein-mass was 50 percent.
0
50
100
150
200
250
300
GJ/yr
Lactation
Pregnancy
Activity
Maintenance
Growth
Thus, where fibre is an important co-product, the allocation ratio for fibre, rela-tive to fibre plus meat (plus milk if it is also a minor co-product), is then calculated from the ratio of the metabolizable protein requirement for fibre production to the metabolizable protein requirement for fibre, meat (the component for live weight sold for meat) and milk (if relevant) production using:Allocation % to fibre = 100 x (protein req. for fibre/(protein req. for fibre + protein req. for meat + protein req. for milk))

65
Greenhouse gas emissions and fossil energy use from small ruminant supply chains
This equation is rearranged to calculate the corresponding allocation percentage to live weight for meat and milk co-products. Box 3 provides an illustration of application of this approach for a New Zealand farm system.
In practice, there are relatively few small ruminant production systems where fibre is the main product and returns the highest proportion of revenue. These include specialist ultra-fine wool sheep in Australia and some goat systems for specialist cashmere and mohair production. It is acknowledged that the use of a biophysical allocation approach based on protein requirements for fibre, meat and milk is still in a state of development. There has been only one scientific publi-cation addressing the topic in detail (Wiedemann et al., 2015). Based on that paper, biophysical allocation is recommended, preferably using analysis of protein requirements for wool relative to all components of growth (exclud-ing flock maintenance). Wiedemann et al. (2015) showed that similar results were obtained when a simpler protein mass approach was applied. In prac-tice, the use of a protein requirement model may not always be possible, and an alternative is the use of energy requirements only. However, this is less preferred because there is not as direct a causal relationship, as wool pro-duction is mainly determined by protein requirements. The recommended hierarchy for calculating biophysical allocation where fibre is a dominant or important co-product is:
Box 3. Example of calculation of biophysical allocation between fibre and live weight for meat for sheep in New Zealand
In North Island, New Zealand, Romney-cross sheep graze on hill country with cattle. On average, for this farm class, the sheep are stocked at 5.6 sheep/ha/year and produce 207 kg live weight sold/ha/year and 30.8 kg wool/ha/year (Beef + Lamb New Zealand survey data). It is based on data from Ledgard et al. (2009, 2011).
Farm survey data were used to define a sheep population structure and sheep production. The data were incorporated into a protein requirement model, based on the Australian Feeding Stand-ards model (CSIRO, 2007) to determine protein requirements.
Of the total metabolizable protein requirements, 17 percent was required for wool production and 29 percent for sheep growth, pregnancy and lamb production. The remaining protein require-ment was for flock maintenance.
The ratio (R) of protein requirements for wool production relative to production of live weight for meat (based on the total requirements for growth) was calculated using biophysical allocation as:
R = protein req. wool / (protein req. wool + protein req. growth) = 17/(17+29) = 0.37
Thus, the allocation percentages for wool and live weight for meat were 37 percent and 63 per-cent, respectively.
Sensitivity analysis was carried out to examine the effect of other methods of allocation. This resulted in calculated values for the allocation percentage for wool using biophysical allocation based on energy requirements (and using 157MJ/kg wool), economic allocation or protein mass allocation of 16, 19 or 39 percent, respectively.

66
Greenhouse gas emissions and fossil energy use from small ruminant supply chains
a. Apply a published recommended model (see section 11.2.2) for protein requirements of fibre relative to all components of growth (excluding flock/herd maintenance).
b. Apply a published recommended model for protein requirements based on some simplification (e.g. Allocation% to fibre = fibre yield x fibre pro-tein%/100 x fibre protein-use-efficiency%/100 / (fibre yield x fibre pro-tein%/100 x fibre protein conversion efficiency% + live weight gain x live weight protein%/100 x protein-use efficiency for growth%/100),
c. In the absence of primary data, use default values of; 60 percent for fibre pro-tein; 60 percent for protein-use efficiency for fibre; 18 percent for live weight protein; and 70 percent for protein-use efficiency for growth.
d. Use protein mass of fibre relative to protein mass of total products. e. Use energy requirements for fibre relative to total products.If the first option is not used, it shall be accompanied by a detailed description
and justification of the method used for the assessment.In conformance with ISO/TS 14067:2013, where the choice of allocation can have
a significant effect on results, it is recommended to conduct a sensitivity analysis making use of more than one method to illustrate the effects of choice of allocation methodology. For example, protein mass or economic allocation should be used for comparison, with the latter based on the relative gross economic value of the prod-ucts received (e.g. using regional/national data) possibly over a period of five years to reduce potential effects of price fluctuations over time.
11.3 TRANSPORTATIONThis section refers to transportation stages and covers: transport of animals, fibre or milk from the site of production to the site of primary processing; and any internal transport within the primary processing site(s) to the output loading dock (see Sec-tion 11.6). It also includes transportation of inputs, such as water, within the farm and animals between different farms that contribute to production before going for processing.
Fuel consumption from transport can be estimated using: (i) the fuel cost meth-od; (ii) the fuel consumption method; or (iii) the tonne-kilometre method. When using the fuel cost method (fuel use estimated from cost accounts and price) or the fuel consumption method (reported fuel purchased), the ‘utilization ratio’ of mate-rials transported shall be taken into account. Transport distances may be estimated from routes and mapping tools or obtained from navigation software.
The allocation of empty transport distance (backhaul) is often done already in the background models used for deriving the secondary LCI data for transportation. However, if primary data for transport should be derived, the LCA user should make an estimate of the empty transport distance. It is good practice to provide a best estimate with a corresponding uncertainty, per the requirement in Section 10.4.
Allocation of empty transport kilometres shall be carried out on the basis of the average load factor of the transport that is representative for the transport under study. If no supporting information is collected, it is good practice to provide a best estimate with a corresponding uncertainty, per the requirement in Section 12.2
Allocations of transport emissions to transported products shall be performed on the basis of the mass share, unless the density of the transported product is sig-nificantly lower than average, to the extent that the volume restricts the maximum

67
Greenhouse gas emissions and fossil energy use from small ruminant supply chains
load. In the latter case, it shall be done on a volume basis. When cold chain is used, life cycle emissions from cold and frozen storage shall be collected, including re-frigerant loss.
Where live exports of animals occur, it is necessary to account for all related transport emissions and loss of animals during transportation. The use of fuels and GHG emission factors associated with the type of transportation shall be calculated according to the size of transportation vehicle and the typical fuel consumption rate. The type of fuel utilized should also be considered. Where refrigerated trans-portation is used, the typical rate of loss of refrigerant and associated GHG emis-sion factor shall be included.
11.4 INCLUSION AND TREATMENT OF LAND-USE CHANGELand-use change relates to the feed production stage and is covered in the LEAP Animal Feed Guidelines. These guidelines describe two calculation methods, in-cluding a global averaging method if specific land use details are unknown and where land-use change effects are spread across all land use. Calculations using the latter method shall exclude long-term perennial forages such as perennial pastures, rangeland and browse systems (i.e. global average land-use change GHG is zero). Long-term perennial forage systems can be significant in some small ruminant sys-tems. GHG emissions associated with land-use change should be accounted sepa-rately and reported. PAS 2050:2011 provides additional guidance.
11.5 BIOGENIC AND SOIL CARBON SEQUESTRATIONBiogenic and soil carbon sequestration can be important for some small ruminant systems. However, since this relates only to the feed production stage, the specific methods are covered in the LEAP Animal Feed Guidelines. As these guidelines note, biogenic and soil carbon sequestration shall be included in the final GHG emissions value. Where no data relating to soil carbon sequestration are available, the LEAP Animal Feed guidelines provide default values for temperate climate. The last option is to assume zero change in soil carbon.
11.6 PRIMARY PROCESSING STAGEThe three primary products of milk, fibre and meat are covered in these guidelines. For all products, there are a number of generic processes that contribute to GHG emissions. These are summarized in Figure 12 and include transportation of prod-ucts within or between primary processing plants, processing, water use, cold/fro-zen storage, and wastes and wastewater treatment. Each component requires raw materials associated with production of energy carriers, refrigerants, consumables, cleaning chemicals and packaging. The following sections discuss the specific prod-ucts and the assessment of GHG emissions with their primary processing.

68
Greenhouse gas emissions and fossil energy use from small ruminant supply chains
11.6.1 Milk processingThe milk collected from goats or sheep may be used to produce one or more of the following products: fresh milk, yoghurt, cheese, cream/butter, whey and milk powder. A very diverse range of products are produced during processing, and a wide range of technologies are used for their production, from cottage industry to large multi-process facilities. IDF (2010) and DairyCo (2010) provide an outline of processes and methods for LCA-based carbon footprinting of dairy cow milk, but there are no corresponding reports or PCRs for goat or sheep milk processing.
The main processes that need to be accounted for are processing of milk, pro-duction and use of packaging, refrigeration, water use and wastewater processing, and within-plant transportation (Figure 12). The milk-processing stage covers the use of resources including energy, water and consumables (e.g. detergents, cleaning chemicals).
Figure 12Processes that contribute to GHG emissions and fossil energy use within the system
boundary of the cradle to primary processing gate
ANIMAL PRODUCT PROCESSING
Transport• Use of fuel (from farm
to plant; production within/between plants)
Processing• Use of fuel and electricity• Use of consumables• Use of packaging• Use of cleaning chemicals• Use of refrigerants
Water use• Use of fuel and electricity
including water heating
Cold/frozen storage• Use of energy• Refrigerant use/loss
Wastes and waster water• Use of energy• Non-CO2 emissions
Feed and waterRaw material acquisition
CRADLE TO FARM GATE
Animals
From LEAP Feeds LCA Guidelines
PRIMARY PROCESSING
INPUTS FOR FEEDPRODUCTION
INPUTS FORWATER SUPPLY
INPUTS FOR MANAGEMENT AND ANIMAL HEALTH
FEED (home-grown and brought-in)
• Production• Processing, Storage
and Feeding
INPUTS FOR PROCESSING
Production of:• energy carriers• refrigerants• consumables• packaging• cleaning chemicals
INPUTS FOR OTHER FEED-RELATED SOURCES
OTHER FEED-RELATED SOURCES
WATER• Use
ANIMAL
• Feed Use• Management• Animal Health
Note: Related cradle-to-farm-gate processes are also given and a further breakdown of these is given in Figure 8). The box with a blue background refers to inputs, processes and emissions covered by the LEAP Animal Feed Guidelines and not part of the current guidelines.

69
Greenhouse gas emissions and fossil energy use from small ruminant supply chains
Data collection and handling of co-productsRepresentative data need to be collected from the milk-processing plant(s) for the defined one-year period on the amount of milk, along with its fat and protein con-tent, entering the plant and the amount and fat and protein content of the different products produced. A material flow diagram of milk input and output products should be produced to account for a minimum of 99 percent of the fat and protein.
Representative data also need to be collected on the resources used for process-ing. Ideally this would be collected for each unit process so that it can be allocated according to the products produced. However, these data are rarely available. In some cases, data may be available that can be attributed to the production of one specific product. In such cases, these process data should first be separately assigned to the specific product before applying an allocation methodology to the remaining data. In most cases, it is only possible to obtain data for a whole processing plant, and in such cases a method for allocation of resource use and emissions between the products is required. The IDF (2010) has defined a physico-chemical method for al-location between dairy cow milk co-products, but this is untested for goat or sheep milk. Thus, a simpler approach is recommended for used based on the relative fat plus protein content of the co-products (Thoma et al., 2013a).
Packaging is generally a relatively small contributor to total GHG emissions (less than 1 percent) and, where this is the case, secondary data are often used where no specific on-site production data are available. When packaging is manufactured off site, the calculated GHG emissions should include the production of the packaging and the raw materials. Where glass bottles are used for liquid milk, the rate of re-use should be accounted for in the calculations. The guidelines produced by DairyCo (2010) provide useful information related to the range of packaging materials and factors to include in the calculation of GHG emissions associated with their production and use. Similarly, many other consumables and cleaning chemicals are used in the processing of dairy products, and secondary data sources from databases such as ecoinvent will generally be used for their production and use. This also applies to refrigerants, although the use of primary activity data on the type and amount of refrigerants used is desirable.
Calculating GHG emissions from milk processingActivity data are required on the amounts of the various resources used. Energy use shall account for the type of energy. Similarly, the type of packaging materials and refrigerant(s) used should be identified. The activity data are then combined with relevant GHG emission factors to calculate the total emissions. For refrigerants, Forster et al. (2007, Table 2.14) provide a list of global warming potential factors (100-year period) for a wide range of refrigerants, which should be updated to co-incide with future revisions by IPCC.
Data are required on the quantities of wastewater produced, its composition and the method of processing (e.g. anaerobic ponds, aerobic ponds, land application). The method of processing will determine the GHGs produced (e.g. methane from anaerobic treatment systems). Emission factors for methane and nitrous oxide for the different wastewater processing systems are given in IPCC (2006).
Total GHG emissions are calculated from the sum of all contributing sources and converted to CO2-equivalents according to the latest global warming potential fac-tors from IPCC. The calculation of total GHG emissions shall include adjustment for allocation between the various co-products, as outlined in Section 9.3.

70
Greenhouse gas emissions and fossil energy use from small ruminant supply chains
11.6.2 Fibre processingThe fibre collected from goats (cashmere, mohair) or sheep (wool) may be used for a wide range of purposes, including clothing, carpet-making and housing insulation. Again, there is a wide diversity in the processes used to produce these products, rang-ing from cottage industry to large-scale commercial processing. An outline of the processes and methods for LCA-based carbon footprinting are covered in draft PCRs on textile yarn and thread of natural fibres (EPD, 2012), and woven fabrics of wool or animal hair that are relevant for cashmere and wool processing (EPD, 2011).
The present guidelines refer only to the primary processing stage of scouring or cleaning of the fibre. The cleaned fibre may then go on to other stages, such as yarn making for textiles (with secondary processing or for direct use by a consumer), carpet-making, or low-value uses, such as insulation or absorbents.
Fibre collected from small ruminants often contains grease, suint, soil and plant material (which for wool can amount to 20-40 percent of the weight of the raw greasy wool), and this is commonly removed by scouring to produce clean fibre. During the scouring process lanolin may be extracted, and is a useful co-product. The main processes that need to be accounted for in fibre scouring are the use of cleaning chemicals (e.g. detergents, bleaching agents and acids), water, within-plant transportation and wastewater processing (Figure 12). The primary processing stage includes the use of resources, such as energy, water and consumables.
Data collection and handling of co-productsRepresentative data need to be collected from the fibre-scouring plant(s) for the defined one-year period on the amount of greasy fibre entering the plant and the amount of clean fibre, lanolin and residue (vegetable matter and dirt, which usually goes to waste). A material flow diagram of input and output products should be produced to account for a minimum of 99 percent of the mass.
Data on all resources used shall be collected, with important resources being electricity, water and cleaning chemicals. The main energy resource used is usu-ally electricity. Primary data on electricity use shall, therefore, be collected. Where possible, the data should be collected to allow allocation according to the products produced (e.g. electricity use for final purification of the lanolin). Where data are only available for a whole processing plant, a method for allocation of resource use and emissions between the products is required. In most cases, the clean fibre and lanolin can be considered as the main products, with the residue as a valueless waste. However, in some cases the residue may be further processed into a conditioner or fertilizer, and in such cases, should be treated as a co-product.
A relatively large volume of wastewater can be generated during the scouring process and data shall be collected on the volume and composition (e.g. chemical oxygen demand and nitrogen load) of the wastewater and the method of wastewater processing.
For consistency with Figure 7 and the other LEAP Guidelines, economic al-location between co-products is recommended. In practice, the recovery of lanolin from greasy wool amounts to about 2-7 percent by weight (higher for finer wool). Therefore, most of the resource use and GHG emissions will be allocated to the wool. Goat fibres generally have a lower grease content than sheep wool. There-fore, lanolin becomes a minor co-product and possibly a residual if it is less than 1 percent of the overall value (see Figure 7).

71
Greenhouse gas emissions and fossil energy use from small ruminant supply chains
Calculating GHG emissions from fibre processingThe total GHG emissions are calculated from the sum of the emissions associated with resource use and wastewater processing. Calculation of GHG emissions as-sociated with electricity use shall account for total embodied emissions, recogniz-ing the relative unconstrained energy sources used for electricity production in the country where the primary processing occurs. Emissions from use of other resourc-es shall also be determined using activity data and relevant GHG emission factors to calculate the total emissions.
Data on wastewater quantity and composition are used, in conjunction with GHG emission factors according to the method of wastewater processing (IPCC, 2006), to calculate GHG emissions from wastewater processing.
Total GHG emissions shall be allocated between the various co-products, as out-lined in Section 9.3.
11.6.3 Meat processingPrimary processing of sheep or goats for meat production can occur in facilities ranging from backyards to large-scale commercial processing abattoirs. This can re-sult in a wide range of co-products, including hides (e.g. for leather), tallow (e.g. for soap, biofuel), pet food, blood (e.g. for pharmaceutical products), fibre and render-able material (e.g. for fertilizer).
A PCR (Boeri, 2013) has been produced for generic meat processing, where the core functional unit is 1 kg of meat (fresh, chilled or frozen), and includes details on accounting for cold and frozen storage. It also covers upstream and downstream processes, including the use phase (meat cooking).
The present guidelines refer to primary processing for fresh, chilled or frozen meat, and do not account for secondary processing (e.g. further processing of meat into ready-to-cook dishes) or subsequent retail, use and waste stages, which would be included in a full ‘cradle-to-grave’ LCA. The main processes that need to be accounted for are: animal deconstruction into many component parts; produc-tion and use of packaging; refrigeration; water use and wastewater processing; and within-plant transportation (Figure 12). The meat processing stage involves the use of resources including energy, water, refrigerants and consumables (e.g. cleaning chemicals, packaging and disposable apparel).
Data collection and handling of co-productsRepresentative data need to be collected from the meat-processing plant(s) for a recent representative one-year period on the amount of sheep or goat live-weight entering the plant and the amount of different products produced. A material flow diagram of input and output products should be produced to account for a mini-mum of 99 percent of the mass. While primary data shall be used for meat, they may not be available for the relative quantity of all co-products (e.g. blood, gut contents), and therefore secondary data would be required, or could be aggregated across several minor co-products. An indication of the approximate relative weight of products for a lamb is: meat 52 percent, hide 6 percent, wool 4 percent, blood 5 percent, tallow 3 percent and renderable material 30 percent (see also Box 4).
Data are required on the use of the various resources. Energy use is a major con-tributor to total GHG emissions for the processing stage. Therefore, it is important to obtain primary data on the various sources of energy use. Similarly, water use

72
Greenhouse gas emissions and fossil energy use from small ruminant supply chains
can be relatively large and wastewater processing can represent a sizable component of the processing GHG emissions. Thus, data shall be collected on the volume and composition (e.g. chemical oxygen demand and nitrogen load) of the wastewater and the method of wastewater processing. Some resources such as consumables and refrigerant use are relatively small and typically constitute a minimal proportion of the total GHG emissions (e.g. less than 1 percent). Secondary data on use of these resources are acceptable.
Following the product category rules proposed by Boeri et al., (2012), the present guidelines recommend the use of economic allocation. However, some co-products may be identified as of limited economic value, but may be collected and used for secondary processing (e.g. used for burning for energy or for producing blood-and-bone meal).
An example of the effects of economic allocation compared to mass allocation for the average lamb from New Zealand abattoirs in mid-2009 (Box 4) shows a much higher allocation to meat using economic allocation than when mass allocation was used. Box 4 also shows the large variation in price per kg between different cuts of meat. The present guidelines recommend treating all meat components as the same per kg, i.e. no separate economic allocation is made between meat cuts).
Some abattoirs process multiple animal species (e.g. cattle and sheep). In such cases, there is a need to allocate emissions according to species. This shall be based on the relative number and live-weights of the animal species processed. In addi-tion, this approach will need to account for relative differences in requirements (e.g. for energy use) between species. For example, the energy use per kg live weight processed for sheep can be about 1.3 to 2 times that for cattle. Similarly, some abat-toirs may have an associated rendering plant, and if energy use cannot be appor-tioned between meat processing and rendering, some adjustment may be appro-priate to account for the greater energy requirements for rendering (e.g. require-ments associated with steam production). One available method is to apply specific energy-adjusted values based on survey data, where specific energy uses between rendering and non-rendering facilities have been obtained. For example, Lovatt and Kemp (1995) obtained specific fuel use per tonne of meat processed at eight-fold and two-fold higher for fuel and electricity use, respectively.
Calculating GHG emissions from meat processingCalculation of GHG emissions shall account for resource use, wastewater process-ing, animal wastes and the associated GHG emission factors. Electricity and other sources of energy use shall account for total embodied emissions relevant to the country where the primary processing occurs. Data on wastewater quantity and composition are used with the GHG emission factors for the method of wastewater processing to calculate GHG emissions from wastewater processing (IPCC, 2006). In meat-processing plants, wastewater will generally include excreta from animals held prior to processing, the contents of the stomachs and intestines of slaughtered animals, and various wastes (e.g. blood, if not collected for further processing). However, where these sources are not specifically captured in wastewater systems they shall be estimated and GHG emissions from them accounted for using the IPCC (2006) method for waste. Total GHG emissions shall be allocated between the various co-products, as outlined in Section 9.3.
To assist in understanding the relative importance of the various contributors to meat processing in abattoirs, Ledgard et al. (2011) found from a survey of New

73
Greenhouse gas emissions and fossil energy use from small ruminant supply chains
Box 4. Example of variation in the mass and economic value of components of an aver-age New Zealand lamb leaving an abattoir and effects on allocation calculations
Data in the table below were based on a summary of the average weight of different meat cuts and co-products from lamb leaving an average abattoir in New Zealand in mid-2009 (New Zealand Meat Association, 2009). The associated average relative economic value of the different com-ponents is also given, and this is used to calculate the average allocation to meat. The weighted average value across all edible components was used, thereby assuming no difference in ‘value’ be-tween the different edible components when applying economic allocation. The table shows that, in practice, there was more than an eight-fold difference in price per kilogramme between the lamb rack and neck cuts of meat. It also illustrates the relatively large difference in economic value of the co-products.
Average mass of com-ponent (kg)
Component % of total mass
Price per-kg relative to leg meat
Component as % of total economic value
Meat:
Neck 0.54 1.5 0.21 0.8
Shoulder 4.6 12.7 0.51 16.1
Rack 1.21 3.4 1.73 14.3
Breast and shank 1.46 4.1 0.47 4.8
Loin 1.43 4.0 1.04 10.2
Legs 4.68 13.0 1.00 32.1
Other meat 2.43 6.7 0.38 6.4
Edible offal 2.0 5.5 0.28 3.9
Co-products:
Hide/skin 2.21 6.1 0.28 4.3
Wool 1.59 4.4 0.27 3.0
Blood 1.76 4.9 0.01 0.1
Inedible offal 0.65 1.8 0.14 0.6
Rendering/tallow 11.54 32.0 0.04 3.5
Thus the economic allocation percentage (EA) for meat relative to the total returns for the lamb was calculated using:
EA (%) = 100 x Σ (weight of meat component i x relative value of meat component i) / (Σ (weight of meat component i x relative value of meat component i) + Σ (weight of co-product i x relative value of co-product i))
The mass allocation percentage (MA) for meat was calculated using:MA (%) = 100 x Σ (weight of meat component i) / (Σ(weight of meat component i + Σ (weight of
co-product i))The results from these calculations for % allocation to meat using economic or mass allocation
were 88 percent and 51 percent, respectively.
Zealand sheep meat-processing plants that the relative contributors to GHG emis-sions from electricity for chilling/freezing was 18 percent, other energy use (par-ticularly for water use and heating) 47 percent, wastewater processing 26 percent and other sources 9 percent.

74
Greenhouse gas emissions and fossil energy use from small ruminant supply chains
11.6.4 On-site energy generationIn some processing plants, waste material may be used for on-site energy genera-tion. This may simply be used to displace energy requirements within the plant, in which case emissions from the energy generation system are assigned to the main products, and net energy consumption from external sources used as input to the process for the analysis. Where there is a surplus of energy generated within the pri-mary processing system, and some fraction sold outside the system under study, the present guidelines recommend the use of system expansion to include the additional functionality of the sold energy. This is in line with ISO 14044:2006. When this does not match the goal and scope of the study, then the system shall be separated and the waste feedstock to the energy production facility shall be considered a residual from the processing operation. All emissions associated with the generation of en-ergy shall be accounted, and the fraction used on-site treated as a normal input of energy (with the calculated environmental burdens). The fraction sold carries the burden associated with its production.

75
Greenhouse gas emissions and fossil energy use from small ruminant supply chains
12. Interpretat on of LCA results
Interpretation of the results of the study serves two purposes (ILCD Handbook):At all steps of the LCA, the calculation approaches and data shall match the goals and
quality requirements of the study. In this sense, interpretation of results may inform an iterative improvement of the assessment until all goals and requirements are met.
The second purpose of the interpretation is to develop conclusions and recom-mendations, for example in support of environmental performance improvements. The interpretation entails three main elements detailed in the following subsections: ‘Identification of important issues’, ‘Characterizing uncertainty’ and ‘Conclusions, limitations and recommendations’.
12.1 IDENTIFICATION OF KEY ISSUES Identifying important issues encompasses the identification of most important impact categories and life cycle stages, and the sensitivity of results to methodological choices.
The first step is to determine the life cycle stage processes and elementary flows that contribute most to the LCIA results, as well as the most relevant impact cat-egories. To do this, a contribution analysis shall be conducted. It quantifies the relative contribution of the different stages/categories/items to the total result. Such contribution analysis can be useful for various interests, such as focusing data col-lection or mitigation efforts on the most contributing processes.
Secondly, the extent to which methodological choices such as system boundaries, cut-off criteria, data sources and allocation choices affect the study outcomes shall be assessed, especially impact categories and life cycle stages having the most im-portant contribution. In addition, any explicit exclusion of supply chain activities, including those that are excluded as a result of cut-off criteria, shall be documented in the report. Tools that should be used to assess the robustness of the footprint model include (ILCD Handbook):
• Completeness checks: Evaluate the LCI data to confirm that it is consistentwith the defined goals, scope, system boundaries and quality criteria, and thatthe cut-off criteria have been met. This includes: completeness of process, i.e. ateach supply chain stage, the relevant processes or emissions contributing to theimpact have been included; and exchanges, i.e. all significant energy or materialinputs and their associated emissions have been included for each process.
• Sensitivity checks: Assess the extent to which the results are determined by spe-cific methodological choices and the impact of implementing alternative, defensi-ble choices where these are identifiable. This is particularly important with respectto allocation choices. It is useful to structure sensitivity checks for each phase ofthe study: goal and scope definition, the LCI model and impact assessment.
• Consistency checks: Ensure that the principles, assumptions, methods and datahave been applied consistently with the goal and scope throughout the study. Inparticular, ensure that the following are addressed: (i) the data quality along thelife cycle of the product and across production systems; (ii) the methodologicalchoices (e.g. allocation methods) across production systems; and (iii) the appli-cation of the impact assessments steps with the goal and scope.

76
Greenhouse gas emissions and fossil energy use from small ruminant supply chains
12.2 CHARACTERIZING UNCERTAINTY This section is related to Section 10 on data quality. Several sources of uncertainty are present in LCA. First is knowledge uncertainty, which reflects limits of what is known about a given datum, and second is process uncertainty, which reflects the inherent variability of processes. Knowledge uncertainty can be reduced by collect-ing more data, but often limits on resources restrict the breadth and depth of data acquisition. Process uncertainty can be reduced by breaking complex systems into smaller parts or aggregations, but inherent variability cannot be eliminated com-pletely. The LCIA characterization factors that are used to combine the large num-ber of inventory emissions into impacts also introduce uncertainty into the estima-tion. In addition, there is bias introduced if the LCI model is missing processes, or may have larger flows than actually present.
Variation and uncertainty of data should be estimated and reported. This is im-portant because results based on average data, i.e. the mean of several measurements from a given process at a single or multiple facilities, or on LCIA characterization factors with known variance, do not reveal the uncertainty in the reported mean value of the impact. Uncertainty may be estimated and communicated quantita-tively through a sensitivity and uncertainty analysis and/or qualitatively through a discussion. Understanding the sources and magnitude of uncertainty in the results is critical for assessing robustness of decisions that may be made based on the study results. When mitigation action is proposed, knowledge of the sensitivity to, and uncertainty associated with the changes proposed provides valuable information regarding decision robustness, as described in Table 4. At a minimum, efforts to accurately characterize stochastic uncertainty and its impact on the robustness of decisions should focus on those supply chain stages or emissions identified as sig-nificant in the impact assessment and interpretation. Where reporting to third par-ties, this uncertainty analysis shall be conducted and reported.
12.2.1 Monte Carlo AnalysisIn a Monte Carlo analysis, parameters (LCI) are considered as stochastic variables with specified probability distributions, quantified as probability density functions (PDF). For a large number of realizations, the Monte Carlo analysis creates an LCA model with one particular value from the PDFs of every parameter and calculates the LCA results. The statistical properties of the sample of LCA results across the range of realizations are then investigated. For normally distributed data, variance is typically described in terms of an average and standard deviation. Some data-bases, notably EcoInvent, use a lognormal PDF to describe the uncertainty. Some software tools (e.g. OpenLCA) allow the use of Monte Carlo simulations to char-acterize the uncertainty in the reported impacts as affected by the uncertainty in the input parameters of the analysis.
Table 4: Guide for decision robustness from sensitivity and uncertaintySensitivity Uncertainty Robustness
High High Low
High Low High
Low High High
Low Low High

77
Greenhouse gas emissions and fossil energy use from small ruminant supply chains
12.2.2 Sensitivity analysisChoice-related uncertainties arise from a number of methodologies, including modelling principles, system boundaries and cut-off criteria, choice of footprint impact assessment methods and other assumptions related to time, technology and, geography Unlike the LCI and characterization factors, they are not amenable to statistical description. However, the sensitivity of the results to these choice-related uncertainties can be characterized through scenario assessments (e.g. comparing the footprint derived from different allocation choices) and/or uncertainty analysis (e.g. Monte Carlo simulations).
In addition to choice-related sensitivity evaluation, the relative sensitivity of spe-cific activities (LCI datasets) measures the percentage change in impact arising from a known change in an input parameter (Hong et al., 2010).
12.2.3 NormalizationAccording to ISO 14044:2006, normalization is an optional step in impact assess-ment. Normalization is a process in which an impact associated with the functional unit is compared against an estimate of the entire regional impacts in that category (Sleeswijk et al., 2008). For example, livestock supply chains have been estimated to contribute 14.5 percent of global anthropogenic GHG emissions (Gerber et al., 2013). Similar assessments can be made at regional or national scales, provided that there exists a reasonably complete inventory of all emissions in that region that contribute to the impact category. Normalization provides an additional degree of insight into those areas in which significant improvement would result in notable advances for the region in question, and can help decision makers to focus on sup-ply chain hotspots whose improvement will bring about the greatest relative envi-ronmental benefit.
12.3 CONCLUSIONS, RECOMMENDATIONS AND LIMITATIONSThe final part of interpretation is to draw conclusions derived from the results, pose answers to the questions raised in the goal and scope definition stage, and recom-mend appropriate actions to the intended audience, within the context of the goal and scope, and explicitly accounting for limitations to robustness, uncertainty and applicability.
Conclusions derived from the study should summarize supply chain hotspots derived from the contribution analysis and the improvement potential associated with possible management interventions. Conclusions should be given in the strict context of the stated goal and scope of the study, and any limitation of the goal and scope can be discussed a posteriori in the conclusions.
As required under ISO 14044:2006, if the study is intended to support compara-tive assertions, i.e. claims asserting difference in the merits of products based the study results, then it is necessary to fully consider whether differences in method or data quality used in the model of the compared products impair the comparison. Any inconsistencies in functional units, system boundaries, data quality or impact assessment shall be evaluated and communicated.
Recommendations are based on the final conclusion of the LCA study. They shall be logical, reasonable, plausibly founded and strictly relate to the goal of the study. Recommendations shall be given jointly with limitations to avoid their mis-interpretation beyond the scope of the study.

78
Greenhouse gas emissions and fossil energy use from small ruminant supply chains
12.4 USE AND COMPARABILITY OF RESULTSIt is important to note that these guidelines refer only to a partial LCA. Where results are required for products throughout the whole life cycle, it is necessary to link this analysis with relevant methods for secondary processing through to consumption and waste stages (e.g. EPD 2012; PAS 2395:2014). Results from the application of these guidelines cannot be used to represent the whole life cycle of small ruminant products. However, they can be used to identify hotspots in the cra-dle-to-primary-processing stages, which are major contributors to emissions across the whole life cycle, and assess potential GHG reduction strategies. In addition, the functional units recommended are intermediary points in the supply chains for vir-tually all small ruminant sector products and therefore will not be suitable for a full LCA. However, they can provide valuable guidance to practitioners to the point of divergence from the system into different types of products.
12.5 GOOD PRACTICE IN REPORTING LCA RESULTSThe LCA results and interpretation shall be fully and accurately reported, without bias and consistent with the goal and scope of the study. The type and format of the report should be appropriate to the scale and objectives of the study and the language should be accurate and understandable by the intended user so as to mini-mize the risk of misinterpretation.
The description of the data and method shall be included in the report in suffi-cient detail and transparency to clearly show the scope, limitations and complexity of the analysis. The selected allocation method used shall be documented, and any variation from the recommendations in these guidelines shall be justified.
The report should include an extensive discussion of the limitations related to accounting for a small numbers of impact categories and outputs. This discussion should address:
•possible positive or negative impacts on other (non-GHG) environmental criteria;
•possible positive or negative environmental impacts (e.g. on biodiversity, land-scape, carbon sequestration); and
•multi-functional outputs other than production (e.g. economic, social, nutri-tional).
If intended for the public domain, a communication plan shall be developed to establish accurate communication that is adapted to the target audience and defen-sible.
12.6 REPORT ELEMENTS AND STRUCTUREThe following elements should be included in the LCA report:
•executive summary typically targeting a non-technical audience (e.g. decision makers) and including key elements of goal and scope of the system studied and the main results and recommendations, while clearly presenting assump-tions and limitations;
• identification of the LCA study, including name, date, responsible organiza-tion or researchers, objectives and reasons for the study and intended users;
•goal of the study, its intended applications, targeted audience and methodol-ogy, including consistency with these guidelines;

79
Greenhouse gas emissions and fossil energy use from small ruminant supply chains
• functional unit and reference flows, including overview of species, geographi-cal location and regional relevance of the study;
•system boundary and unit stages (e.g. to farm gate and farm gate to primary processing gate);
•materiality criteria and cut-off thresholds;•allocation method(s) and justification, if different from the recommendations
in these guidelines;•description of inventory data, its representativeness, averaging periods (if
used) and assessment of quality of data;•description of assumptions or value choices made for the production and pro-
cessing systems, with justification;• feed intake and application of LEAP Animal Feed Guidelines, including
description of emissions and removals (if estimated) for land-use change;•LCI modelling and calculating LCI results;•results and interpretation of the study and conclusions;•description of the limitations and any trade-offs; and• if intended for the public domain, a statement as to whether or not the study
was subject to independent third-party verification.
12.7 CRITICAL REVIEWInternal review and iterative improvement should be carried out for any LCA study. In addition, if the results are intended to be released to the public, third-party verification and/or external critical review shall be undertaken (and should be undertaken for internal studies) to ensure that:
• the methods used to carry out the LCA are consistent with these guidelines and are scientifically and technically valid;
• the data and assumptions used are appropriate and reasonable;• interpretations take into account the complexities and limitations inherent in
LCA studies for on-farm and primary processing; and• the report is transparent, free from bias and sufficient for the intended user(s).The critical review shall be undertaken by an individual or panel with appropri-
ate expertise, for example, qualified reviewers from agricultural industry or govern-ment or non-government officers with experience in the assessed supply chains and LCA. Independent reviewers are highly preferable.
The panel report and critical review statement and recommendations shall be included in the study report if publicly available.

80
Greenhouse gas emissions and fossil energy use from small ruminant supply chains
References
AFNOR. 2011, BPX-30-323-0 General principles for an environmental communi-cation on mass market products - Part 0: General principles and methodological framework. Saint-Denis, France, ADEME-AFNOR.
Alexandratos N. & Bruinsma, J. 2012. World agriculture towards 2030/2050: the 2012 revision. ESA Working paper No. 12-3, Rome, FAO.
Benoit, M. & Laignel, G. 2011, Analyse sur le long terme de systèmes d’élevage ovins allaitants en France. Quelles trajectoires et quels facteurs de réussite éco-nomique? L’Institut national de la recherche agronomique (INRA) Productions Animales, 24 (3): 211-220.
Besier, B., Jacobson. C., Woodgate, R. & Bell, K. 2010. Sheep health. In D.J. Cot-tie, ed. International sheep and wool handbook, pp. 471–488. Nottingham, UK, Nottingham University Press.
Bett, R.C., Kosgey, I.S., Bebe, B.O. & Kahi, A.K. 2007. Breeding goals for the Kenya Dual Purpose goat: I. Model development and application to smallholder production systems. Tropical Animal Health and Production, 39: 477-492.
Bier, J.M., Verbeek, J.R. & Lay, M.C. 2012. An eco-profile of thermoplastic protein derived from blood meal. Part 1: allocation issues. International Journal of Life Cycle Assessment, 17: 208–219.
Boeri, F. 2013. Product category rules: Meat of mammals, UN CPC 2111 and 2113. Environmental Product Declaration. Stockholm..
BSI. 2011. PAS 2050-2011 Specification for the measurement of the embodied green-house gas emissions in products and services. London.
BSI. 2014. PAS 2395:2014 Specification for the assessment of greenhouse gas (GHG) emissions from the whole life cycle of textile products. London.
CSIRO (Commonwealth Scientific and Industrial Research Organisation). 2007. Nutrient requirements of domesticated ruminants. M. Freer, H. Dove & J.V. Nolan, eds. Clayton South, Australia, CSIRO Publishing.
DairyCo. 2010. Guidelines for the carbon footprinting of dairy products in the UK. Kenilworth, UK, DairyCo,
DairyNZ. 2012. Facts and figures for New Zealand dairy farmers: Version 2. New-stead, New Zealand, DairyNZ (available at www.dairynz.co.nz/page/page-id/2145866931/Facts_and_Figures).
Devendra, C., Morton, J.F. & Rischkovsky, B. 2005. Livestock systems. In E. Owen, A. Kitalyi, N. Jayasuria & T. Smith, eds. Livestock and wealth creation, pp. 28–52. Nottingham, UK, Nottingham University Press.
EBLEX. 2012. Down to Earth, the beef and sheep roadmap: Phase three. Ke-nilworth, UK, EBLEX.
EBLEX. 2013. A summary of UK carbon footprint calculators for beef and sheep enterprises. Kenilworth, UK, EBLEX.
EPD (Environmental Product Declaration). 2011. Draft product category rule on woven fabrics of combed wool or of combed fine animal hair, containing 85% or more by weight of wool or fine animal hair. UN CPC 2653 Version 0.2. Stock-holm, Environmental Product Declaration.

81
Greenhouse gas emissions and fossil energy use from small ruminant supply chains
EPD (Environmental Product Declaration). 2012. Product category rule on textile yarn and thread of natural fibres and man-made filaments or staple fibres, UN CPC 263-264. Draft VI. Stockholm, Environmental Product Declaration.
Emmans, G. C. 1994. Effective energy: a concept of energy utilization across species. British Journal of Nutrition, 71: 801-821.
European Commission. 2010a. Communication from the European Commission 2010/C 160/02.
European Commission. 2010b. International Reference Life Cycle Data System (ILCD) Handbook: General guide for Life Cycle Assessment - Detailed guid-ance. European Commission Joint Research Centre. Luxembourg, Publications office of the European Union.
European Commission. 2011. ILCD Handbook- Recommendations for Life Cycle Impact Assessment in the European context. European Commission Joint Re-search Centre. Luxemburg. Publications Office of the European Union.
European Commission. 2013. Product Environmental Footprint (PEF) Guide. An-nex II to the Recommendations of the Commission on the use of common meth-ods to measure and communicate the life cycle environmental performance of products and organizations. European Commission Joint Research Centre. Lux-emburg, Publications Office of the European Union.
FAO. 2013. FAOSTAT. Online statistical database (available at http://faostat.fao.org).
FAO/WHO Codex Alimentarius Commission. 2008. Codex Alimentarius Code of Practice on Good Animal feeding. CAC/RCP 54-2004, adopted in 2004, amended in 2008. Rome, FAO/WHO.
Finnveden, G., Hauschild, M.Z., Ekvall, T., Guinée, J.B., Heijungs, R., Hell-weg, S., Koehler, A., Pennington, D. & Suh, S. 2009. Recent developments in Life Cycle Assessment. Journal of Environmental Management, 91:1–21. doi: 10.1016/j.jenvman.2009.06.018
Flysjö, A., Henriksson, M., Cederberg, C., Ledgard, S. & Englund, J-E. 2011. The impact of various parameters on the carbon footprint of milk production in New Zealand and Sweden. Agricultural Systems, 104: 459–469.
Flysjö, A., Cederberg, C., Henriksson, M. & Ledgard, S. 2012. The interaction between milk and beef production and emissions from land use change – critical considerations in life cycle assessment and carbon footprint studies of milk. Jour-nal of Cleaner Production, 28: 134–142.
Food SCP RT. 2013. ENVIFOOD Protocol, Environmental Assessment of Food and Drink Protocol. European Food Sustainable Consumption and Production Round Table (SCP RT), Working Group 1, Brussels, Belgium. Forster, P., Ra-maswamy, V., Artaxo, P., Berntsen, T., Betts, R., Fahey, D.W., Haywood, J., Lean, J., Lowe, D.C., Myhre, G., Nganga, J., Prinn, R., Raga, G., Schulz, M. & Van Dorland, R. 2007. Changes in atmospheric constituents and in radiative forcing. In S. Solomon, D. Qin, M. Manning, Z. Chen, M. Marquis, K.B., Av-eryt, M. Tignor & H.L. Miller, eds. Climate Change 2007: The Physical Science Basis. Contribution of Working Group I to the Fourth Assessment Report of the Intergovernmental Panel on Climate Change. Cambridge, United Kingdom and New York, Cambridge University Press.
Frischknecht, R., Heijungs, R. & Hofstetter, P. 1998. Einstein’s lessons for energy accounting in LCA. International Journal of Life Cycle Assessment, 3(5):266 – 272.

82
Greenhouse gas emissions and fossil energy use from small ruminant supply chains
Frischknecht, R. & Rebitzer, G. 2005. The ecoinvent database system: a comprehen-sive web-based LCA database. Journal of Cleaner Production, 13: 1 337–1 343.
Gac, A., Ledgard, S., Lorinquer, E., Boyes, M. & Le Gall, A. 2012. Carbon foot-print of sheep farms in France and New Zealand and methodology analysis. In M.S. Corson & H.M.G. der Werf, eds. Proceedings of the 8th International Conference on Life Cycle Assessment in the Agri-Food Sector (LCA Food 2012), 1–4 October 2012, Saint Malo, France, pp. 310–314. Rennes, France, INRA.
Gerber, P. J., Steinfeld, H., Henderson, B., Mottet, A., Opio, C., Dijkman, J., Falcucci, A. and Tempio, G. 2013. Tackling climate change through livestock – A global assessment of emissions and mitigation opportunities. Rome, FAO.
Goedkoop, M.J., Heijungs, R., Huijbregts, M., De Schryver, A., Struijs, J. & Van Zelm, R. 2009. ReCiPe 2008 A life cycle impact assessment method which com-prises harmonised category indicators at the midpoint and the endpoint level; First edition Report I: Characterisation. The Hague, Ministerie van VROM (available at www.lcia-recipe.net).
Guinée, J.B., Gorrée, M., Heijungs, R., Huppes, G., Kleijn, R., de Koning, A., van Oers, L., Wegener Sleeswijk, A., Suh, S., Udo de Haes, H.A., de Bruijn, H., van Duin, R., Huijbregts, M.A.J., Lindeijer, E., Roorda, A.A.H., van der Ven, B.L. & Weidema, B.P. 2002. Handbook on life cycle assessment: Opera-tional guide to the ISO standards. Leiden, the Netherlands, Kluwer Academic Publishers.
Hong, J., Shaked, S., Rosenbaum, R.K. & Jolliet, O. 2010. Analytical uncertainty propagation in life cycle inventory and impact assessment: Application to an auto-mobile front panel. International Journal of Life Cycle Assessment, 15: 499–510.
Huijbregts, M.A.J, Norris, G., Bretz, R., Ciroth, A., Maurice, B., von Bahr, B., Weidema, B. & de Beaufort, A. S. H. 2001. Framework for modelling data un-certainty in life cycle inventories. International Journal of Life Cycle Analysis, 6: 127-132.
IDF. 2010. A common carbon footprint approach for dairy: the IDF guide to stan-dard lifecycle assessment methodology for the dairy sector. Bulletin of the In-ternational Dairy Federation, 445/2010. IPCC. 2006. 2006 IPCC Guidelines for National Greenhouse Gas Inventories. Volume 4 Agriculture, Forestry and Other Land Use. Prepared by the National Greenhouse Gas Inventories Pro-gramme, Eggleston H.S., Buendia L., Miwa K., Ngara T. and Tanabe K. (eds). Institute for Global Environmental Strategies, Japan (available at: www.ipcc-nggip.iges.or.jp/public/2006gl/vol4.htm).
ISO. 1999. ISO 14024:1999 Environmental labels and declarations -- Type I envi-ronmental labelling -- Principles and procedures. Geneva, Switzerland.
ISO. 2000. ISO 14020:2000 Environmental labels and declarations -- General prin-ciples. Geneva, Switzerland.
ISO. 2002. ISO/TR 14062:2002 Environmental management -- Integrating envi-ronmental aspects into product design and development. Geneva, Switzerland.
ISO. 2006a. ISO 14025:2006 Environmental labels and declarations -- Type III en-vironmental declarations - Principles and procedures. Geneva, Switzerland.
ISO. 2006b. ISO 14040:2006 Environmental Management -- Life Cycle Assessment - Principles and Framework. Geneva, Switzerland.
ISO. 2006c. ISO 14044:2006 Environmental management -- Life cycle assessment - Requirements and Guidelines. Geneva, Switzerland.

83
Greenhouse gas emissions and fossil energy use from small ruminant supply chains
ISO. 2006d. ISO 14064-1: Greenhouse gases -- Part 1: Specification with guidance at the organization level for quantification and reporting of greenhouse gas emis-sions and removals. Geneva, Switzerland.
ISO. 2013a. ISO/TS 14067:2013 Greenhouse gases: Carbon footprint of products -- Requirements and guidelines for quantification and communication. Geneva, Switzerland.
ISO. 2013b. ISO 16759:2013 Graphic technology -- Quantification and commu-nication for calculating the carbon footprint of print media products. Geneva, Switzerland.
ISO. 2014. ISO 14046: 2014 Environmental management -- Water footprint - Prin-ciples, requirements and guidelines. Geneva, Switzerland.
Joseph, K. & Nithya, N. 2009. Material flows in the life cycle of leather. Journal of Cleaner Production, 17: 676–682.
Kaseloo, P.A. & Lovvorn, J.R. 2003. Heat increment of feeding and thermal sub-stitution in mallard ducks feeding voluntarily on grain. Journal of Comparative Physiology B,173: 207–213.
Ledgard, S. F., McDevitt, J., Boyes, M., Lieffering, M. & Kemp R. 2009. Green-house gas footprint of lamb meat: Methodology report. Report for MAF. Hamil-ton, New Zealand, AgResearch.
Ledgard, S.F., Lieffering, M., Coup, D. & O’Brien, B. 2011. Carbon footprinting of New Zealand lamb from an exporting nations perspective. Animal Frontiers, 1: 27–32.
Lovatt, S.J. & Kemp, R.M. 1995. Survey of utility use in the New Zealand meat industry for the 1993/94 season. Technical report No. 952. Wellington, Meat In-dustry Research Institute of New Zealand (MIRINZ).
Mila i Canals, L., Domenech, X., Rieradevall, J., Fullana, P. & Puig, R. 1998. Ap-plication of life cycle assessment to footwear. International Journal of Life Cycle Assessment, 3: 203–208.
Mila i Canals, L., Domenech, X., Rieradevall, J., Puig, R. & Fullana, P. 2002. Use of life cycle assessment in the procedure for the establishment of environmental criteria in the Catalan eco-label of leather. International Journal of Life Cycle Assessment, 7: 39–46.
Mila i Canals, L., Sim, S., Azapagic, A., Doka, G., Frischknecht, R., Jefferies, D., King, H., Mutel, C., Nemecek, T., Roches, A., Stichnothe, H., Thoma, G. & Williams, A. 2011. Approaches for Addressing Life Cycle Assessment Data Gaps for 22 Bio-based Products. Journal of Industrial Ecology, 15: 707–725.
NRC (National Research Council). 2007. Nutrient requirements of small rumi-nants: Sheep, goats, cervids, and new world camelids. National Research Council. Washington DC, National Academies Press (available at http://www.nap.edu/catalog/11654/nutrient-requirements-of-small-ruminants-sheep-goats-cervids-and-new).
Opio, C., Gerber, P., MacLeod, B., Falcucci, A., Henderson, B., Mottet, A. Tem-pio, G., & Steinfeld, H. 2013. Greenhouse gas emissions from ruminant supply chains: A global life cycle assessment. Rome, FAO.
Park, Y.W. & Haenlein, G.F.W. 2006. Handbook of milk of non-bovine mammals. Oxford, Blackwell Publishing.
Petersen, A.K. & Solberg, B. 2004. Greenhouse gas emissions and costs over the life cycle of wood and alternative flooring materials. Climate Change, 64: 143–167.

84
Greenhouse gas emissions and fossil energy use from small ruminant supply chains
Pickering, A. 2011. Detailed methodologies for agricultural greenhouse gas emission calculation. MAF Technical Paper No. 2011/40. Wellington, Ministry of Agricul-ture and Forestry.
Potting, J. & Blok, K. 1995. Life-cycle assessment of four types of floor covering. Journal of Cleaner Production, 3: 201–213.
Pulina, G., Macciotta, N. & Nudda, A. 2005. Milk composition and feeding in the Italian dairy sheep. Italian Journal of Animal Science, 4 (Suppl. 1): 5-14.
Ramirez, A.D., Humphries, A.C., Woodgate, S.L. & Wilkinson, R.G. 2011. Greenhouse gas life cycle assessment of products arising from the rendering of mammalian animal byproducts in the UK. Environmental Science and Technol-ogy, 46: 447–453.
Reap, J., Roman, F., Duncan, S. & Bras, B. 2008. A survey of unresolved prob-lems in life cycle assessment. The International Journal of Life Cycle Assessment, 13(5): 374-388.
Ridoutt, B.G. & Pfister, S. 2010. A revised approach to water footprinting to make transparent the impacts of consumption and production on global freshwater scarcity. Global Environmental Change, 20: 113–120.
Rossi, S. 2012. Product category rule: Textile yarn and thread of natural fibres and man-made filaments or staple fibres. Draft VI CPC 263-264. Environmental Product Declaration. Stockholm, EPD.
Sessa, F. 2013a. Product category rule: Processed liquid milk and cream. CPC 221. Environmental Product Declaration. Stockholm, EPD.
Sessa, F. 2013b. Product category rules: Yoghurt, butter and cheese. CPC 2223, 2224 and 2225. Environmental Product Declaration. Stockholm, EPD.
Sleeswijk, A. W., van Oers, L. F., Guinée, J. B., Struijs, J. & Huijbregts, M. A. 2008. Normalisation in product life cycle assessment: An LCA of the global and European economic systems in the year 2000. Science of the total environment, 390(1): 227-240.
Thamsiriroj, T. & Murphy, J.D. 2011. The impact of the life cycle analysis methodol-ogy on whether biodiesel produced from residues can meet the EU sustainability criteria for biofuel facilities constructed after 2017. Renewable Energy, 36: 50–63.
Thoma, G., Jolliet, O. & Wang, Y. 2013a. A biophysical approach to allocation of life cycle environmental burdens for fluid milk supply chain analysis. Interna-tional Dairy Journal, 31: S41–S49.
Thoma, G., Popp, J., Nutter, D., Shonnard, D., Ulrich, R., Matlock, M., Kim, D.S., Neiderman, Z., Kemper, N., East, C. & Adom, F. 2013b. Greenhouse gas emissions from milk production and consumption in the United States: A cradle-to-grave life cycle assessment circa 2008. International Dairy Journal, 31: S3–S14.
UNEP/SETAC Life Cycle Initiative. 2011. Global Guidance Principles for Life Cy-cle Assessment Databases. A basis for greener processes and products. Paris, UNEP.
UNFCCC. n.d. GHG data definitions (available at http://unfccc.int/ghg_data/on-line_help/definitions/items/3817.php, accessed March 2015.
Wiedemann, S., McGahan, E., Murphy, C., Yan, M-J., Henry, B., Thoma, G., & Ledgard, S. 2015. Environmental impacts and resource use of Australian beef and lamb exported to the USA determined using life cycle assessment. Journal of Cleaner Production. In press.
Witney, B. 1988. Choosing and using farm machinery. Harlow, UK, Longman Sci-entific and Technical.

85
Greenhouse gas emissions and fossil energy use from small ruminant supply chains
WRI and WBCSD. 2011a. Product Life Cycle Accounting and Reporting Standard. Washington DC, World Resources Institute and World Business Council for Sus-tainable Development.
WRI and WBCSD. 2011b. Technical Guidance for Calculating Scope 3 Emissions. Supplement to the Corporate Value Chain (Scope 3) Accounting and Reporting Standard. Washington DC, World Resources Institute and World Business Coun-cil for Sustainable Development.


87
Greenhouse gas emissions and fossil energy use from small ruminant supply chains
APPENDICES


89
Greenhouse gas emissions and fossil energy use from small ruminant supply chains
Appendix 1
Greenhouse gas emissions from small ruminants: a review of existing methodologies and guidelines
GHG emissions from livestock systems have been identified as a significant con-tributor to total global emissions (e.g. Steinfeld et al., 2006). This was defined as being of particular significance for ruminant animals because of their high enteric methane emissions.
There have been many published studies of GHG emissions from livestock sys-tems globally. However, the methodologies used for estimating GHG emissions have varied widely. Various authors have highlighted the difficulties in making comparisons across published studies because of the large differences in method-ologies used (e.g. Edwards-Jones et al., 2009; Flysjö et al., 2011). Consequently, there has been interest in trying to agree on a common methodology for estimating GHG emissions both between and within sectors. In 2010, the International Dairy Federation (IDF, 2010) developed a common methodology for estimating the car-bon footprint (total GHG emissions) for dairy products. Estimates of total GHG emissions are now often been based on use of LCA to account for all GHG sources and to determine the extent of emissions on a product basis.
The purpose of this brief review is to summarize existing methodologies and guidelines for calculating GHG emissions from small ruminants.
GHG METHODOLOGY GUIDELINES FOR SMALL RUMINANTSThere have been two international methodology reports relating to small ruminants or sheep specifically. Gerber et al. (2013) published a report on the carbon footprint of livestock that included beef, sheep and goats for a range of agro-ecological zones and production systems around the world. This was based on methodology developed by staff in the FAO and covered the cradle-to-farm-gate, meat-processing and transpor-tation-to-retailer stages of the life cycle. Beef + Lamb New Zealand and the Interna-tional Meat Secretariat initiated development of a ‘straw-man’ document entitled A common carbon footprint methodology for the lamb meat sector (Ledgard, 2011) that involved contributions from various international industry and sheep LCA research groups, including the English Beef and Lamb Executive (EBLEX), Adrian Williams (Cranfield University, UK), Ronald Annett (Agri-food and Biosciences Institute, Northern Ireland), the Institut de l’Elevage (France), Hybu Cig Cymru (HCC Wales) and Quality Meats Scotland. This document was confined to the cradle-to-farm-gate stage of the lamb life cycle. It followed a similar approach to that of the IDF (2010) common methodology for milk production, with the intention of including a number of recommendations on methodology aspects where specific methodology choices are required (e.g. system boundary, functional unit and allocation methods). The French AGRIBALYSE® database provides life cycle inventory and LCIA data about sheep meat and milk, and goat milk (for the methodology report, see Koch and Salou, 2014).
90
Greenhouse gas emissions and fossil energy use from small ruminant supply chains
Only a few publications or reports have estimated the total GHG emissions from sheep production, and only one study for deer (Lieffering et al., 2011) and one for goats (Gerber et al., 2013) could be found through a detailed literature search. Table A1.1 provides a summary of the published sheep studies with carbon foot-print estimates for lamb and the variation in components of the methodology used. Studies varied in the extent of their system boundary and therefore in the relevant functional unit.
The study of Eady et al. (2012) was for a case farm with mixed cropping and livestock. The authors used system expansion to allocate between crop and live-stock and compared biophysical and economic allocation for lamb/mutton/wool. Similarly, the New Zealand system (Ledgard et al., 2011) included mixed sheep and cattle farming and used biophysical allocation to allocate between each animal type, i.e. apportioning according to the amount of feed dry matter consumed, and then used economic allocation for lamb/mutton/wool. Enteric methane was a significant contributor to the carbon footprint and therefore most studies used a Tier-2 meth-odology, whereby feed intake was estimated from a number of animal productivity parameters (e.g. live weight, growth rate, lambing percentage and replacement rate). However, two studies used a Tier-1 methodology where each sheep class had a con-stant methane emission per animal. In view of the large contribution from enteric methane, it is desirable to use a Tier-2 methodology since there can be large differ-ences in animal productivity, feed conversion efficiency and methane emissions per kg animal production, including from sheep (e.g. Ledgard et al., 2011; Benoit and Dakpo, 2012).
There is only one published carbon footprint study for goats, which showed simi-lar or slightly lower values than from lamb or sheep meat (Gerber et al., 2013). The principles for estimating the carbon footprint for goat products are likely to be simi-lar to those for sheep. Indeed, a specific study on enteric methane emissions by goats in respiration chambers on different diets showed an average of 6.6 percent of energy loss as methane (Bhatta et al., 2008). This is similar to that from other animal studies and to the IPCC default value of 6.5 percent. Nevertheless, comparative animal stud-ies on enteric methane emissions indicated significant differences between sheep and deer fed the same diet, with average values of 18.4 and 16.5 g methane/kg dry matter intake, respectively (Swainson et al., 2008).
In conclusion, the estimates of the carbon footprint of lamb shown in Table A1.1 showed wide variability and much of this variability can be attributed to differenc-es in methodology used. This highlights the importance of developing a common methodology to be able to identify real differences in GHG emissions between farm systems and products, and to identify GHG reduction opportunities.
PRODUCT CATEGORY RULESThe generic GHG methodology guidelines refer to PCRs and recommend that these are used where they have been produced. A detailed search revealed that there are no specific PCRs for sheep or goat products. However, there are generic PCRs on ‘Meat of mammals’ (Boeri, 2013), ‘Processed liquid milk’ (Sessa, 2013a) and a draft PCR on ‘Textile yarn and thread from natural fibres, man-made filaments or staple fibres’ (Rossi, 2012), which can be used to assist in developing methodology guidelines for small ruminants.

91
Greenhouse gas emissions and fossil energy use from small ruminant supply chains
Table A1.1: Summary of the carbon footprint of lamb from published studies and methodologies used
Reference Data sourceSystem boundary
Functional unit (FU)
Allocation method(s)
Enteric methane
Carbon footprint
(kg CO2-eq/FU)
International:
Ruminants: Gerber et al. (2013)
FAO country data
RDC1 1 kg CW2,1 kg FPCM3
Economic, protein content
Tier 2 15-314
(4.7-9.05)
Lamb: Ledgard (2011)
Representative data
Farm gate 1 kg LW Biophysical/economic
Tier 2 n.a.6
Country-specific:
Australia: Peters et al. (2010)
1 case farm Farm gate 1 kg CW Mass Tier 2 10.5
Australia: Eady et al. (2012)
1 case farm Farm gate 1 kg CW System expansion/ biophysical/economic
Tier 2 12.6
England: EBLEX (2012)
57 case farms Farm gate 1 kg LW Economic Tier 2 6-207
France: Gac et al. (2012)
Farm survey (104)8/model
Farm gate 1 kg LW Mass Tier 1 12.9
France: Benoit and Dakpo (2012)
Farm survey (1180)
Farm gate 1 kg CW Mass Tiers 1 and 2
11.9 (15-82)9
NZ: Ledgard et al. (2011)
Farm survey (437)/model
Life cycle10
1 kg meat Biophysical/economic
Tier 2 19
Spain: Ripoll-Bosch et al. (2013)
Farm survey (3) Farm gate 1 kg LW Economic Tier 2 19-26
Sweden: Wallman et al. (2012)
10 case farms RDC 1 kg CW Mass/economic
Tier 2 16
UK: Williams et al. (2008)
UK model RDC 1 kg CW Economic Tier 2 14.1
Wales: Edwards-Jones et al.(2009)
2 case farms Farm gate 1 kg LW Economic Tier 1 8-14411
Note: 1 to retail distribution centre; 2 carcass weight; 3 fat and protein corrected milk; 4 range for small ruminant CW across regions globally; 5 range for small ruminant FPCM across regions globally; 6 generic methodology only (no specific analyses included); 7 average and range across 57 case farms; 8 bracketed values refer to number of farms in surveys; 9 range across 1 180 farms (or -7 to 62 if carbon sequestration was included); 10 whole life cycle (i.e. cradle-to-grave); and 11 high on peat soils.
GHG FOOTPRINTING TOOLS COVERING SMALL RUMINANTSThere are a number of GHG footprinting tools that are being used or available for use on farms for the evaluation of the GHG footprint of small ruminants and miti-gation options. Ten carbon calculators available within the United Kingdom were recently reviewed by EBLEX (2013). Many of these use an LCA approach and ac-count for UK-specific management practices, but in most cases the methodology and algorithms are not published and therefore specific methodological details are unavailable. This makes it difficult to assess these models, but it gives an indication of the potential for practical use on farm. It also highlights the importance in having a commonly agreed methodology for estimating GHG emissions from small ru-minants and their products for comparison of production and processing systems.
92
Greenhouse gas emissions and fossil energy use from small ruminant supply chains
REFERENCESBenoit, M. & Dakpo, H. 2012. Greenhouse gas emissions on French meat sheep
farms; Analysis over the period 1987-2010. Proceedings of the conference on emission of gas and dust from livestock, 10–13 June 2012, Saint Malo, France. Rennes, France, INRA.
Bhatta, R., Enishi, O., Takusari, N., Higuchi, K., Nonaka, L. & Kurihara, M. 2008. Diet effects on methane production by goats and a comparison between measurement methodologies. Journal of Agricultural Science, 146(6): 705–715.
BSI. 2011. PAS 2050-2011 Specification for the measurement of the embodied green-house gas emissions in products and services. London.
Eady, S., Carre, A. & Grant, T. 2012. Life cycle assessment modeling of complex agricultural systems with multiple food and fibre co-products. Journal of Cleaner Production, 28: 143–149.
EBLEX. 2012. Down to Earth, the beef and sheep roadmap: Phase three. Ke-nilworth, UK, EBLEX.
EBLEX. 2013. A summary of UK carbon footprint calculators for beef and sheep enterprises. Kenilworth, UK, EBLEX.
Edwards-Jones, G., Plassmann, K. & Harris, I.M. 2009. Carbon footprinting of lamb and beef production systems: Insights from an empirical analysis of farms in Wales. Journal of Agricultural Science, 147: 707–719.
Flysjö, A., Henriksson, M., Cederberg, C., Ledgard, S. & Englund, J-E. 2011. The impact of various parameters on the carbon footprint of milk production in New Zealand and Sweden. Agricultural Systems, 104: 459–469.
Gac, A., Ledgard, S., Lorinquer, E., Boyes, M. & Le Gall, A. 2012. Carbon foot-print of sheep farms in France and New Zealand and methodology analysis. In M.S. Corson & H.M.G. der Werf, eds. Proceedings of the 8th International Conference on Life Cycle Assessment in the Agri-Food Sector (LCA Food 2012), 1–4 October 2012, Saint Malo, France, pp. 310–314. Rennes, France, INRA.
Gerber, P.J., Steinfeld, H., Henderson, B., Mottet, A., Opio, C., Dijkman, J., Fal-cucci, A. and Tempio, G. 2013. Tackling climate change through livestock – A global assessment of emissions and mitigation opportunities. FAO, Rome
IDF. 2010. IDF guide to life cycle assessment and life cycle management: A common carbon footprint methodology for the global dairy sector. Brussels, International Dairy Federation (available at www.idf-lca-guide.org/Public/en/LCA+Guide/LCA+Guidelines+overview).
Koch, P. & Salou, T. 2014. AGRIBALYSE®: METHODOLOGY, Version 1.1, March 2014. Ed ADEME. Angers. France (available at: www.ademe.fr/agribalyse-en).
Ledgard, S.F. 2011. A common carbon footprinting methodology for the lamb meat sector. (With contributions from England, France, Northern Ireland, Scotland and Wales). Wellington, Beef + LambNZ / International Meat Secretariat.
Ledgard, S.F., Lieffering, M., Coup, D. & O’Brien, B. 2011. Carbon footprinting of New Zealand lamb from an exporting nations perspective. Animal Frontiers, 1: 27–32.
Lieffering, M., Ledgard, S., Boyes, M. & Kemp, R. 2011. Venison greenhouse gas footprint: Final report. Report for MAF. Hamilton, New Zealand, AgResearch.
Peters, G.M., Rowley, H.V., Wiedemann, S., Tucker, R., Short, M.D. & Schulz, M. 2010. Red meat production in Australia: Life cycle assessment and comparison with overseas studies. Environmental Science and Technology, 44: 1327–1332.

93
Greenhouse gas emissions and fossil energy use from small ruminant supply chains
Ripoll-Bosch, R., de Boer, I.J.M., Bernués, A. & Vellinga, T.V. 2013. Accounting for multi-functionality of sheep farming in the carbon footprint of lamb: A com-parison of three contrasting Mediterranean systems. Agricultural Systems, 116: 60–68.
Rossi, S. 2012. Product category rule: Textile yarn and thread of natural fibres and man-made filaments or staple fibres. Draft VI CPC 263-264. Environmental Product Declaration. Stockholm, EPD.
Steinfeld, H., Gerber, P., Wassenaar, T., Castel, V., Rosales, M. & de Haan, C. 2006. Livestock’s long shadow: Environmental issues and options. Rome, FAO.
Swainson, N.M, Hoskin, S.O., Clark, H., Pinares-Patino, C.S. & Brooks, I.M. 2008. Comparative methane production and yields from adult cattle, red deer and sheep. Australian Journal of Experimental Agriculture, 48(1-2): 74-80.
Wallman, M., Cederberg, C. & Sonesson, U. 2012. Life cycle assessment of Swedish lamb production. Göteborg, Sweden, Swedish Institute for Food and Biotechnol-ogy (SIK).
Williams, A., Pell, E., Webb, J., Moorhouse, E. & Audsley, E. 2008. Comparative life cycle assessment of food commodities procured for UK consumption through a diversity of supply chains. DEFRA Project FO0103. London, Department for Environment, Food and Rural Affairs.

94
Greenhouse gas emissions and fossil energy use from small ruminant supply chains
Table A2.1: Relative number of goats (in grassland vs. mixed production systems) and of goat meat and milk production, 2011
Country
Goats (thousand head)Goat meat (thousand
tonnes)
Goat milk (thousand
tonnes)Grassland-
based systemsMixed
systems
Top 20 countries (for herd)
China 22178 129036 1890 277
India 2232 121298 599 4760
Pakistan 13404 42590 286 759
Nigeria 2159 47788 289 -
Bangladesh 0 44208 199 2496
Sudan (former) 20411 22113 97 1072
Iran (Islamic Republic of) 18447 7061 163 306
Ethiopia 2081 14283 68 53
Somalia 12820 1751 65 501
Kenya 6363 7510 47 197
Indonesia 320 12997 71 281
Mongolia 11133 2114 48 71
United Republic of Tanzania 2112 10424 35 108
Niger 7381 3857 66 278
Burkina Faso 1470 9239 35 106
Brazil 3637 6620 29 148
Mexico 1985 6884 44 162
Mali 3742 4963 75 703
Yemen 2232 5630 42 56
Uganda 161 7638 33 -
Remaining countries 66412 108655 1045 4758
Sources: Gerber et al. (2013) for grassland vs. mixed production systems and FAO (2013) for goat meat and milk production.
Appendix 2
Small ruminants - main producing countries

95
Greenhouse gas emissions and fossil energy use from small ruminant supply chains
Table A2.2: Relative number of sheep (in grassland vs. mixed production systems) and sheep meat, milk and wool production, 2011
Country
Sheep (thousand head)
Sheep meat (thousand
tonnes)
Sheep milk (thousand
tonnes)
Greasy wool (thousand
tonnes)
Grassland-based
systemsMixed
systems
Top 20 countries (for herd)
China 68590 83025 2050 1529 393
Australia 47434 53667 564 - 368
India 2138 60330 293 - 43
Iran (Islamic Republic of) 36090 17648 96 449 60
Sudan (former) 23865 25929 215 390 55
New Zealand 12015 27864 465 - 166
United Kingdom 4894 30066 301 - 67
Nigeria 1235 30304 168 - -
South Africa 16850 8291 124 - 41
Turkey 5534 19536 230 893 47
Pakistan 6228 18522 158 36 42
Spain 1287 21230 135 520 22
Ethiopia 1635 19099 88 58 8
Syrian Arab Republic 11702 7882 183 706 21
Algeria 10268 8641 253 320 26
Morocco 4076 12793 144 38 55
Brazil 5847 9659 84 - 12
Russian Federation 5233 10063 171 1 53
Peru 4858 9950 35 - 10
Somalia 13117 1577 70 590 -
Remaining countries 127899 190774 2402 4241 553
Sources: Gerber et al. (2013) for grassland vs. mixed production systems and FAO (2013) for sheep meat, milk and wool production.
REFERENCESFAO. 2013. FAOSTAT. Online statistical database (available at http://faostat.fao.org). Gerber, P.J., Steinfeld, H., Henderson, B., Mottet, A., Opio, C., Dijkman, J., Falcucci, A. and Tempio, G. 2013. Tackling climate change through livestock – A global assessment of emissions and mitigation opportunities. Rome, FAO.

96
Greenhouse gas emissions and fossil energy use from small ruminant supply chains
Table A3.1: Average ratios of carcass weight to live weight for goats and sheep for different global regions
Region Goats Sheep
North America 52 52
Russian Federation 43 45
Near East and North Africa 43 48
Western Europe 43 45
Eastern Europe 44 45
East and South East Asia 48 49
Oceania 45 50
South Asia 43 48
Latin American countries 44 49
Sub-Saharan Africa 48 45
Source: Based on a summary by Gerber et al. (2013).
Appendix 3 Summary of carcass weight: live weight ratios (as percentages) for goats and sheep for different regions
Carcass weight, sometimes called dead weight, generally refers to the weight of the carcass after removal of the skin, head, feet and internal organs including the diges-tive tract (and sometimes some surplus fat). The ‘hot carcass weight’ may be re-corded after slaughter and refers to the unit by which farmers in some countries are paid. In practice, the carcass loses a small amount of moisture as it cools (e.g. about 1-2 percent) to the cold carcass weight.
The variation in these average default carcass weight values of 43-52 percent for goats and 45-52 percent for sheep probably reflects differences in method of cal-culation from the literature that it was derived from (e.g. hot versus cold carcass weight), as well as differences associated with key factors of age, breed, weight, gen-der and diet. For example, in a review of New Zealand data, the hot carcass weight: live weight ratio averaged 44 percent (range 40-48 percent) for lambs and 39 percent for ewes/rams (Muir, Thomson and Askin, 2008), while for Northern Ireland it was 46 percent for lambs reared on pasture and 49 percent for lambs reared on concen-trates (Annett and Carson, 2011)
REFERENCESAnnett, R.W. & Carson, A.F. 2011. A comparison of growth and carcass character-
istics of hill lambs finished on a selection of forage-based diets. Proceedings of the British Society of Animal Science Annual Meeting, Nottingham, UK.

97
Greenhouse gas emissions and fossil energy use from small ruminant supply chains
Gerber, P.J., Steinfeld, H., Henderson, B., Mottet, A., Opio, C., Dijkman, J., Fal-cucci, A. and Tempio, G. 2013. Tackling climate change through livestock – A global assessment of emissions and mitigation opportunities. Rome, FAO.
Muir, P.D., Thomson, B.C. & Askin, D.C. 2008. A review of dressing out percent-age in New Zealand livestock. Report for MAF. Wellington, Ministry of Agricul-ture and Forestry.

98
Greenhouse gas emissions and fossil energy use from small ruminant supply chains
Appendix 4 Average sheep flock and goat herd parameters for different regions of the world
Table A4.1: Average sheep flock and goat herd parameters for different regions of the world
ParametersNorth
AmericaRussian
FederationWestern Europe
Eastern Europe
North Africa and Near East
East and South
East Asia OceaniaSouth Asia
Latin America and the
Caribbean
Sub-Saharan
Africa
Sheep: weights (kg)
Adult female 80 49 62 44 41 47 70 35 59 38
Adult male 108 101 82 85 55 65 98 45 81 51
Lambs at birth 4 3 4 3 3 4 4 3 3 3
Slaughter female 27 21 29 21 26 26 35 24 29 24
Slaughter male 27 21 29 21 26 26 35 24 29 24
Rates (%)
Replacement female 21 23 29 22 21 16 24 18 20 17
Fertility 92 95 91 90 83 77 100 81 91 76
Death rate - lambs 19 17 18 18 25 31 9 24 18 33
Death rate - other 8 2 3 5 12 14 4 12 12 13
Age at first lambing (years) 2.1 1.9 1.6 1.8 1.4 1.6 1.8 1.6 2 1.5
Goats: weights (kg)
Adult female 64 55 59 (61)* 50 37 (40) 44 (34) 50 32 (31) 35 (37) 29 (31)
Adult male 83 100 88 (91) 100 53 (56) 53 (43) 81 42 (39) 50 (60) 36 (40)
Kids at birth 6.4 2.2 4.0 (4.6) 5 2.7 (3.2) 3.9 (2.1) 3.6 2.7 (2.4) 3.5 (3.7) 2.2 (2.3)
Slaughter female 36 30 26 30 32 27 38 25 27 19
Slaughter male 36 30 26 30 32 27 38 25 28 19
Rates (%)
Replacement female 30 18 17 18 19 24 21 19 24 16
Fertility 85 90 87 90 87 88 87 81 80 87
Death rate - kids 18 5 4 5 31 37 12 15 14 27
Death rate - other 9 2 2 2 7 16 6 5 5 7
Age at first kidding (years) 1.4 1.3 1.3 1.3 1.6 1.1 1.4 1.8 1.5 2
Note: * Numbers in brackets refer to the parameters for meat animals.
Source: Gerber et al. (2013).
REFERENCESGerber, P.J., Steinfeld, H., Henderson, B., Mottet, A., Opio, C., Dijkman, J., Fal-
cucci, A. and Tempio, G. 2013. Tackling climate change through livestock – A global assessment of emissions and mitigation opportunities. Rome, FAO.

99
Greenhouse gas emissions and fossil energy use from small ruminant supply chains
Appendix 5 Calculation of enteric methane emissions from animal energy requirements
BACKGROUNDSection 11.2.2.b outlines the procedure for calculating the energy requirements for animal class (e.g. lambs, hoggets, ewes, rams for sheep) according to metabolic re-quirements for the relevant categories of growth, maintenance, activity (walking), reproduction, wool production and milk production. These calculations are based on net energy as used in IPCC (2006) or metabolizable energy (ME) intake.
However, the procedures for calculating enteric methane are usually described as a percentage of gross energy intake. Thus, there is a need to convert net energy or ME to gross energy intake. Figure A5.1 shows the relationship between these, where GE can be partitioned to manure energy and enteric methane energy and net energy.
CALCULATION OF GROSS ENERGYThe main additional data needed are the percentage of the digestibility of the feed. A summary of the range of values for different feed types is given later in this Appendix.
Figure A5.1Diagram showing the flow of the different sources of energy for ruminants, based
on a high-quality feed with a digestibility of 75%
100% GROSS ENERGY INTAKE
75% DIGESTIBLE ENERGY
63% METABOLISABLE ENERGY
58% NET ENERGY
available for maintenance and production
~ 25% excreted faeces (indigestible energy)
~ 6% eructated as CH4
~ 5% excreted as urine
~ 5% radiated as heat
Source: Lassey (2007).

100
Greenhouse gas emissions and fossil energy use from small ruminant supply chains
IPCC (2006) uses net energy and gives the following equation for the ratio of net energy for growth to the digestible energy consumed (REG):
REG = (1.164 – (5.160 x 10³ x DE%) + (1.038 x 10⁻⁵ x DE%2) - (37.4/DE%))where DE% is digestible energy as a % of gross energy in the feed.
Similarly, the following equation is used for the ratio of net energy for mainte-nance to the digestible energy consumed (REM):
REM = (1.123 – (4.092 x 10³ x DE%) + (1.126 x 10⁻⁵ x DE%2) - (25.4/DE%)).
From these, the gross energy (GE in MJ/day) is calculated using:
GE ={ (NEm +NEa +NEl + NEr) + (NEg + New) }÷ (DE%/100)
REM REG
where the subscripts m, a, l, p, g and w refer to maintenance, activity (walking), lactation, pregnancy, growth and wool, respectively.
From GE, the methane emissions can be calculated from the GE intake using:
kg methane/mature animal/year = gross energy intake (MJ/year) x 0.065/55.65, or kg methane/animal(<1 year-old)/year = gross energy intake (MJ/year) x 0.045/55.65
where the values of 0.065 and 0.045 refer to the 6.5 percent and 4.5 percent loss factors for methane of gross energy intake, and 55.65 is the energy content of meth-ane in MJ/kg.
Typical ranges for values of DE percentages are: concentrates: (75-85 percent), pasture (65-75 percent) and low-quality forage (45-65 percent).
In practice, DE percentages will vary during the year and an example of this from the New Zealand GHG Inventory for average sheep pasture in New Zealand in winter, spring, summer and autumn at 73.8 percent, 77.7 percent, 68.1 percent and 66.1 percent, respectively (Pickering, 2011). Corresponding ME concentrations are 10.8 percent, 11.4 percent, 9.9 percent and 9.6 MJ ME/kg DM, respectively.
REFERENCESIPCC. 2006. 2006 IPCC Guidelines for National Greenhouse Gas Inventories.
Volume 4 Agriculture, Forestry and Other Land Use. Prepared by the National Greenhouse Gas Inventories Programme, Eggleston H.S., Buendia L., Miwa K., Ngara T. and Tanabe K. (eds). Institute for Global Environmental Strategies, Japan (available at: www.ipcc-nggip.iges.or.jp/public/2006gl/vol4.htm).
Lassey, K.R. 2007. Livestock methane emission: From the individual grazing animal through national inventories to the global methane cycle. Agricultural and Forest Meteorology, 142:120–132.
Pickering, A. 2011. Detailed methodologies for agricultural greenhouse gas emission calculation. MAF Technical Paper No. 2011/40. Wellington, Ministry of Agricul-ture and Forestry.


Greenhouse gas emissions and fossil energy use from small ruminant supply chains
Guidelines for assessment
http://www.fao.org/partnerships/leap
VERSION 1
I6434EN/1/11.16