greenland ice sheet - american chemical society€¦ · greenland ice sheet: dynamic response to...
TRANSCRIPT

Greenland Ice Sheet:Greenland Ice Sheet:Dynamic Response to Climate WarmingDynamic Response to Climate Warming
Global sea level rise Ice sheet melt Global sea level rise Ice sheet melt Ice sheet melt Possible causes of rapid ice lossIce sheet melt Possible causes of rapid ice loss
Konrad Steffen Cooperative Institute for Research in Environmental Sciences
University of Colorado at Boulder
Konrad Steffen Cooperative Institute for Research in Environmental Sciences
University of Colorado at Boulder
ine
knes
s
knes
s
ilibr
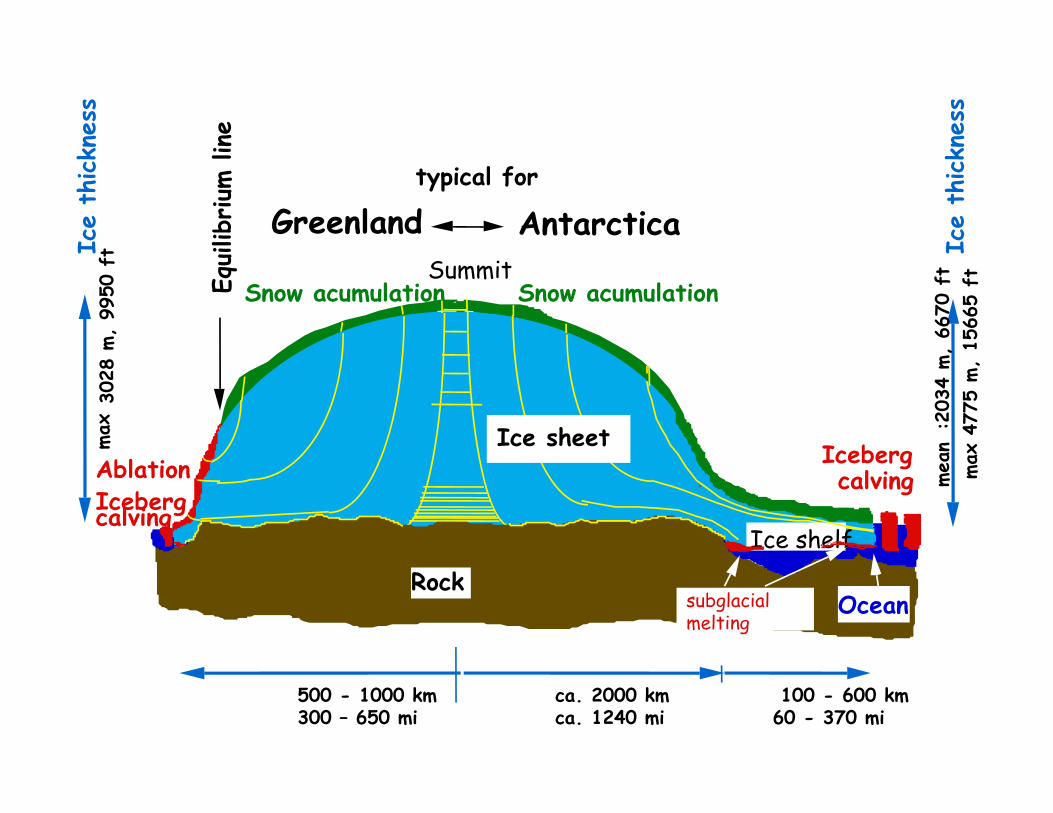
ium li typical for
Greenland Antarctica
Ice
thick
tIce
thick
SummitSnow acumulation Snow acumulationEq
u
m,
6670
ft
1566
5 ft
I
m,
9950
ftI
Iceberg Ice sheet
an: 2
034
max
477
5 m,
max
3028
Ablation Iceberg calving
Ice shelf
mea ma
Iceberg calving
RockOceansubglacial
melting
100 - 600 km60 - 370 mi
ca. 2000 kmca. 1240 mi
500 - 1000 km300 – 650 mi

Global Mean Sea Level from Satellite AltimetryGlobal Mean Sea Level from Satellite AltimetryGlobal Mean Sea Level from Satellite AltimetryGlobal Mean Sea Level from Satellite Altimetry
Average Rate = 3.5 mm/year(1993-2006)( )
Th l E i (0 5) 1 2 1 6 /
SLR IPCC 2001: 1.8 mm/year
Thermal Expansion: (0.5) 1.2 - 1.6 mm/year
Mountain Glaciers: (0.3) ~0.9 mm/year
Greenland Ice Melt (0.05) ~0.5 mm/year( ) y
Antarctic Ice Melt: (0) ~0.4 mm/year
Land Water Storage: ?
[Mitchum and Nerem, 2007]
CryosphericCryospheric Sea Level RiseSea Level RiseCryosphericCryospheric Sea Level RiseSea Level RiseCryosphericCryospheric Sea Level RiseSea Level RiseCryosphericCryospheric Sea Level RiseSea Level RiseVolume (%)
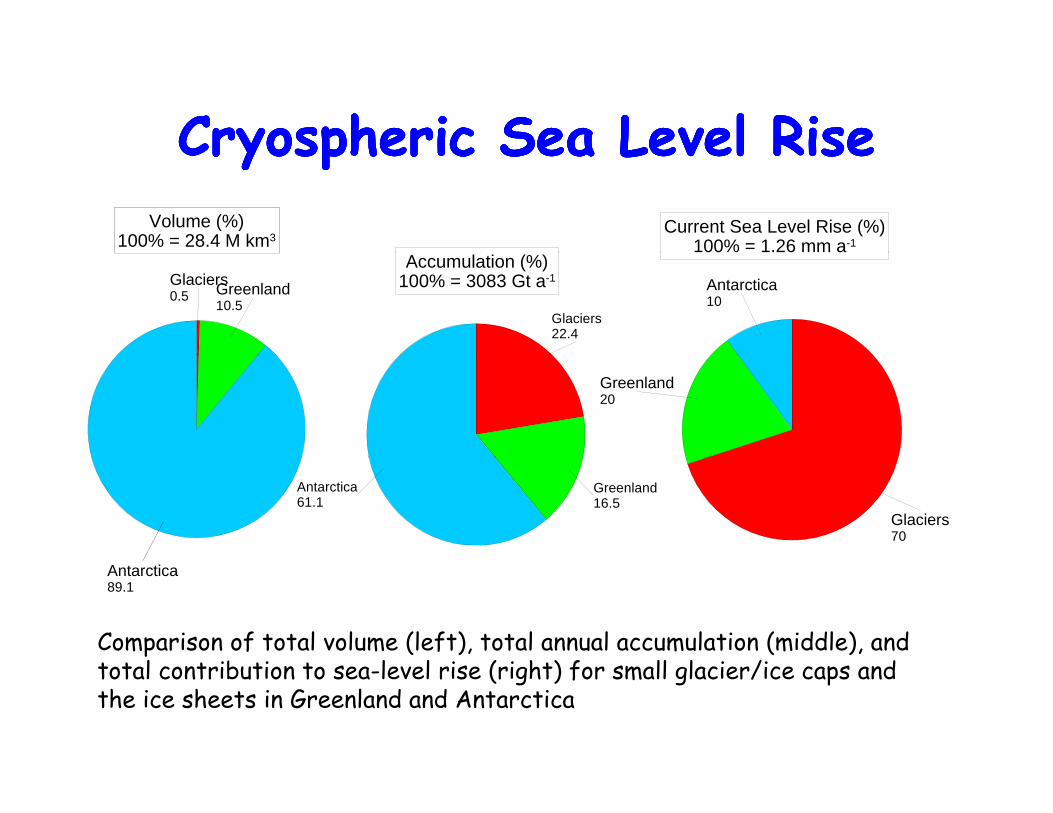
100% = 28.4 M km3Current Sea Level Rise (%)
100% = 1.26 mm a-1
Glaciers0.5 Greenland
10.5Antarctica10
Glaciers22.4
Accumulation (%)100% = 3083 Gt a-1
Greenland20
Glaciers70
Greenland16.5
Antarctica61.1
Comparison of total volume (left), total annual accumulation (middle), and t t l t ib ti t l l i ( i ht) f ll l i /i d
Antarctica89.1
total contribution to sea-level rise (right) for small glacier/ice caps and the ice sheets in Greenland and Antarctica
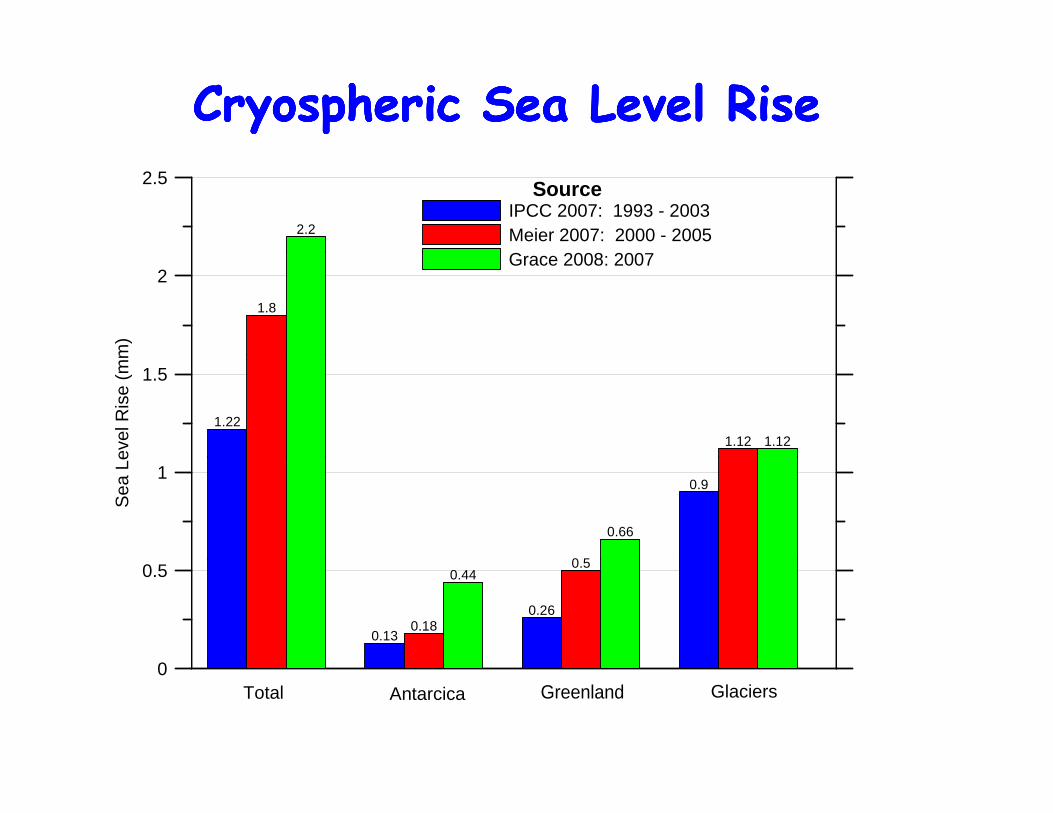
CryosphericCryospheric Sea Level RiseSea Level RiseCryosphericCryospheric Sea Level RiseSea Level Rise2.5
2.2
SourceIPCC 2007: 1993 - 2003Meier 2007: 2000 - 2005G 2008 2007
2
m)
1.8
Grace 2008: 2007
1.5
evel
Ris
e (m
m
1.221.12 1.12
1
Sea
Le
0.9
0 5
0.66
0
0.5
0.13
0.260.18
0.50.44
0Total Antarcica Greenland Glaciers
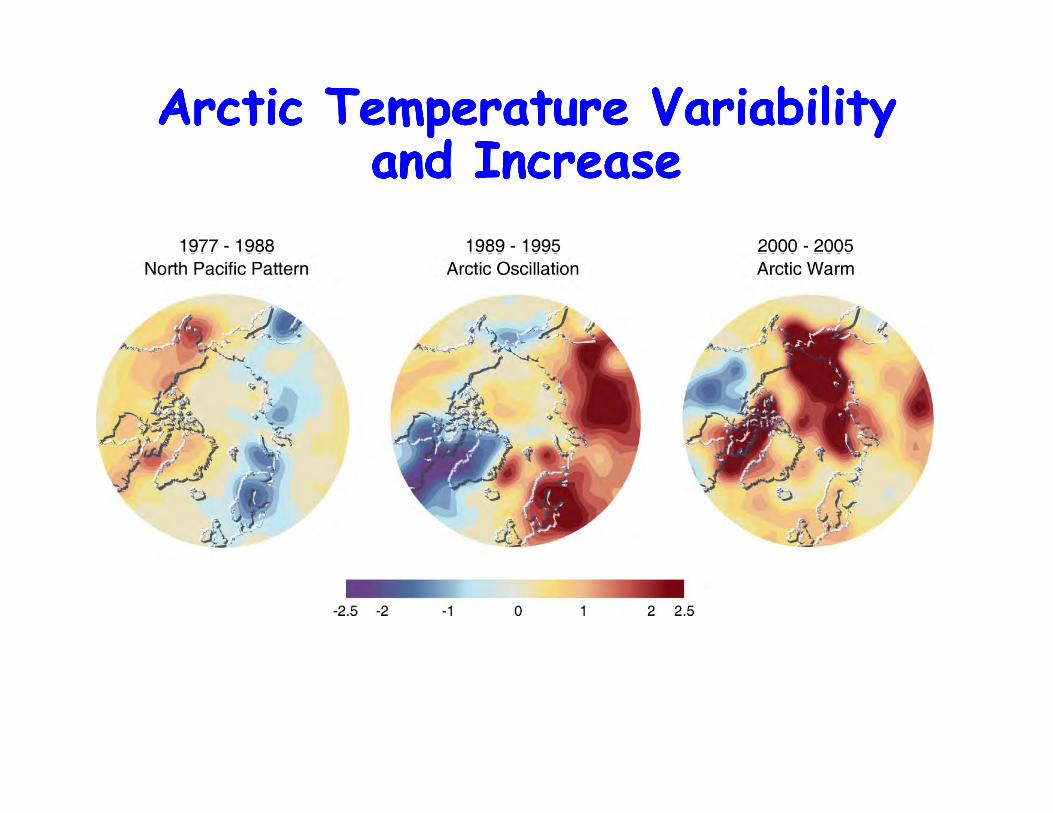
ArcticArctic Temperature Temperature Variability Variability d Id I
ArcticArctic Temperature Temperature Variability Variability d Id Iand Increaseand Increaseand Increaseand Increase

Air Temp. Air Temp. S i C 1991 S i C 1991 20082008
Air Temp. Air Temp. S i C 1991 S i C 1991 20082008Swiss Camp 1991 Swiss Camp 1991 -- 20082008Swiss Camp 1991 Swiss Camp 1991 -- 20082008
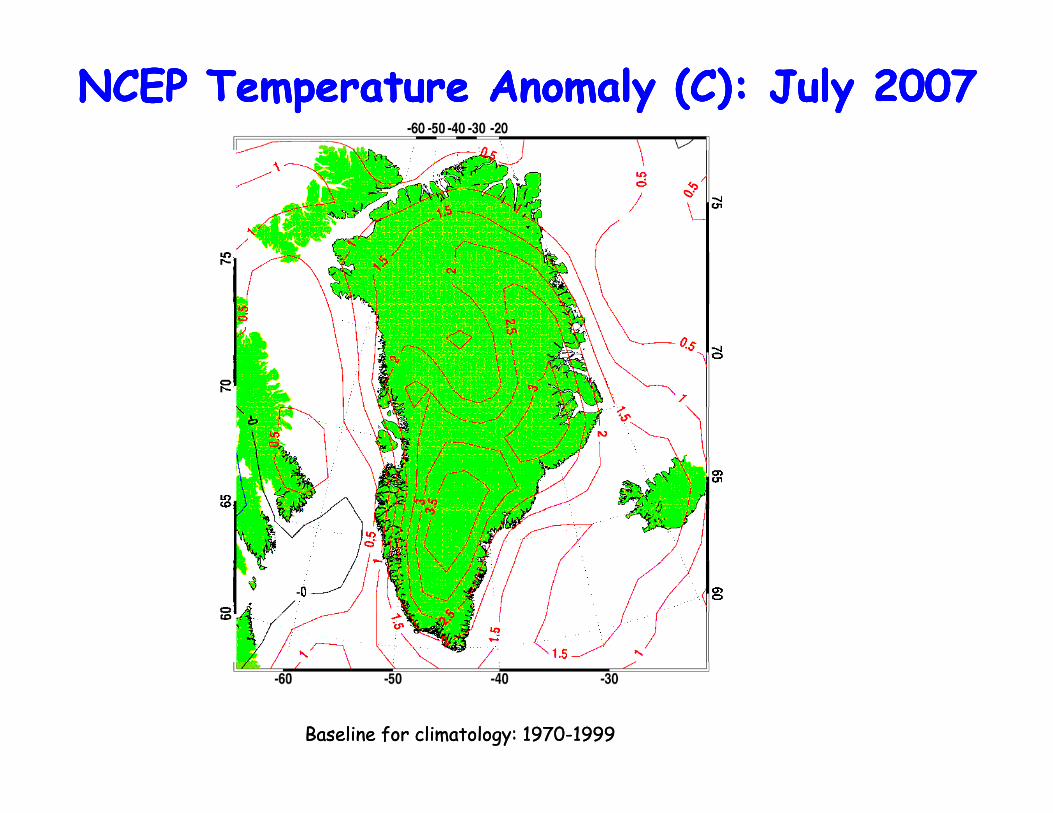
NCEP Temperature Anomaly (C): July 2007NCEP Temperature Anomaly (C): July 2007NCEP Temperature Anomaly (C): July 2007NCEP Temperature Anomaly (C): July 2007
Baseline for climatology: 1970Baseline for climatology: 1970--19991999
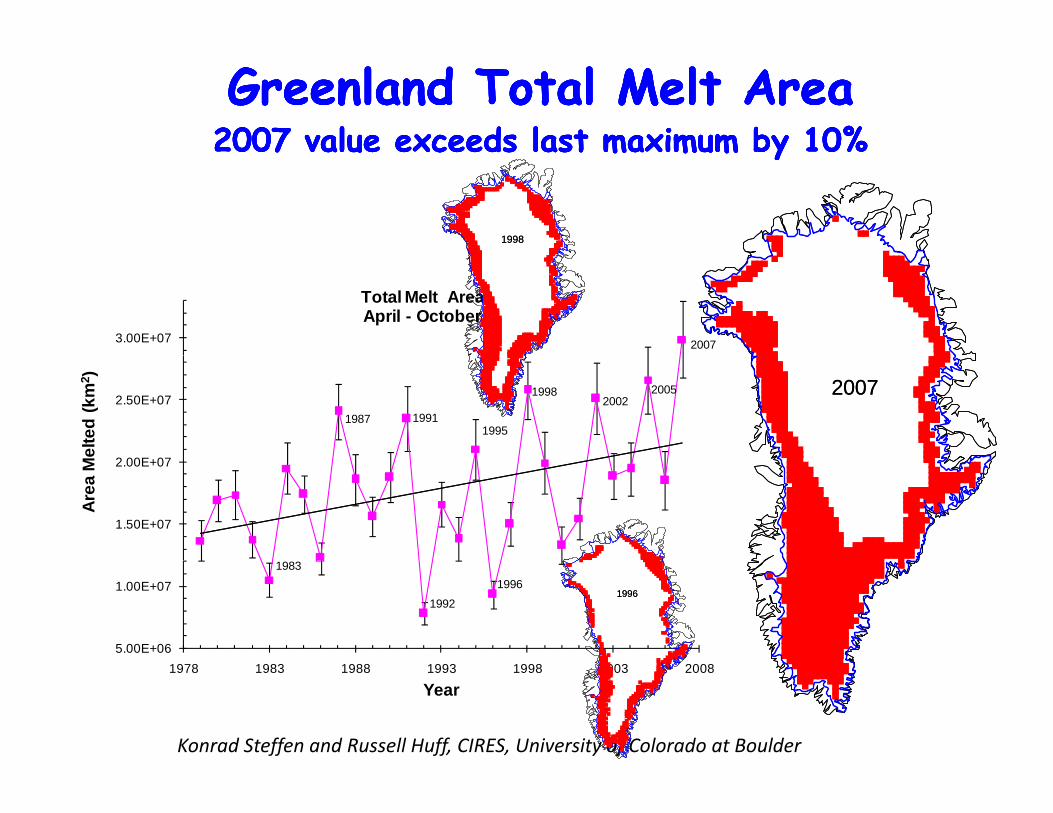
Greenland Total Melt AreaGreenland Total Melt Area2007 value exceeds last maximum by 10%2007 value exceeds last maximum by 10%Greenland Total Melt AreaGreenland Total Melt Area
2007 value exceeds last maximum by 10%2007 value exceeds last maximum by 10%
19981998
2007 value exceeds last maximum by 10%2007 value exceeds last maximum by 10%2007 value exceeds last maximum by 10%2007 value exceeds last maximum by 10%
3.00E+07
Total Melt AreaApril - October
2007
2 00E 07
2.50E+07
elte
d (k
m2 )
20021998
19951991
2005
1987
20072007
1.50E+07
2.00E+07
Area
M
5.00E+06
1.00E+071992
19961983
19961996
Konrad Steffen and Russell Huff, CIRES, University of Colorado at Boulder
1978 1983 1988 1993 1998 2003 2008
Year
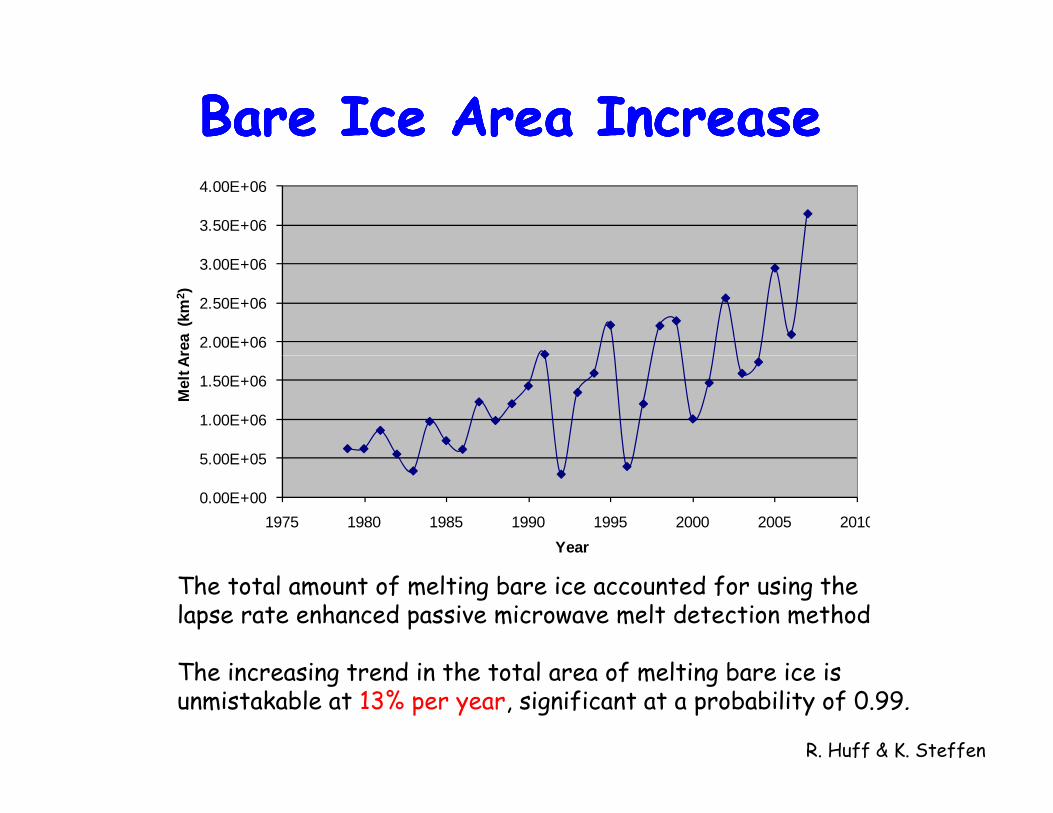
Bare Ice Area IncreaseBare Ice Area IncreaseBare Ice Area IncreaseBare Ice Area Increase
3.50E+06
4.00E+06
2.00E+06
2.50E+06
3.00E+06
rea
(km
2 )
5 00E+05
1.00E+06
1.50E+06
Mel
t Ar
0.00E+00
5.00E+05
1975 1980 1985 1990 1995 2000 2005 2010Year
The total amount of melting bare ice accounted for using thelapse rate enhanced passive microwave melt detection method
Th i i d i h l f l i b i i
R. Huff & K. Steffen
The increasing trend in the total area of melting bare ice is unmistakable at 13% per year, significant at a probability of 0.99.
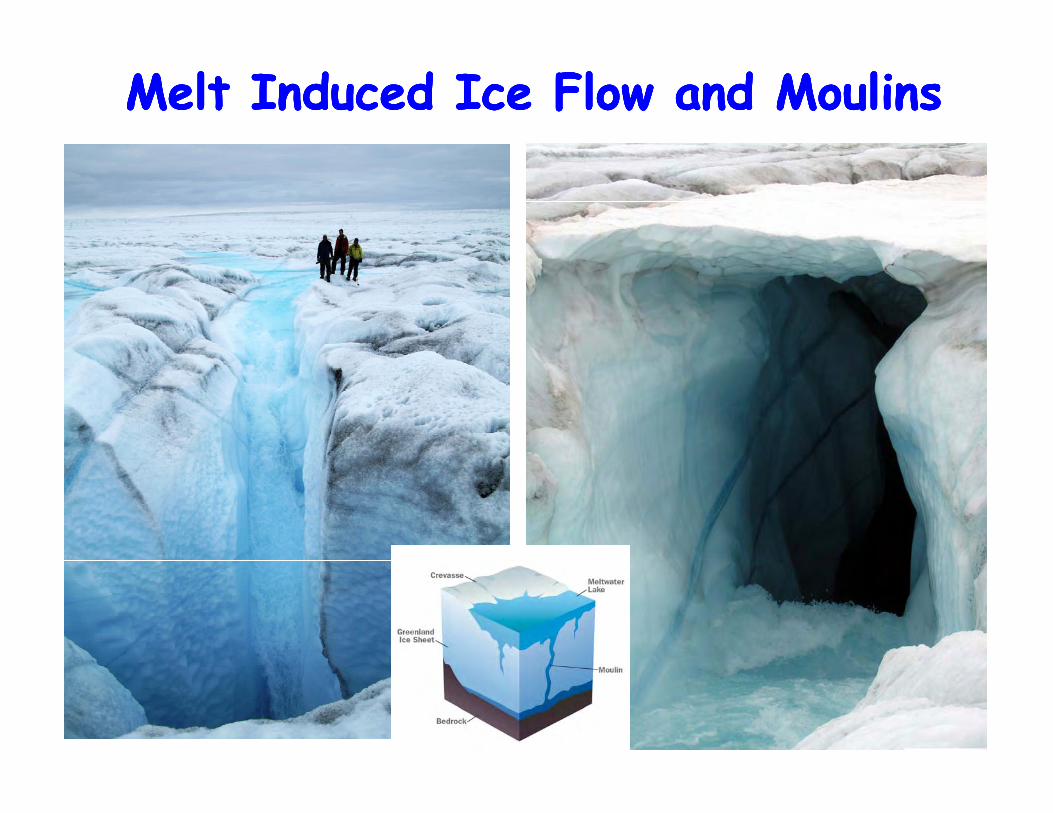
Melt Induced Ice Flow and MoulinsMelt Induced Ice Flow and MoulinsMelt Induced Ice Flow and MoulinsMelt Induced Ice Flow and Moulins

Surface MeltSurface Melt--Induced Acceleration Induced Acceleration of Greenland Iceof Greenland Ice--Sheet FlowSheet Flow
Surface MeltSurface Melt--Induced Acceleration Induced Acceleration of Greenland Iceof Greenland Ice--Sheet FlowSheet Flowof Greenland Iceof Greenland Ice Sheet FlowSheet Flowof Greenland Iceof Greenland Ice Sheet FlowSheet Flow
H. Jay Zwally, Waleed Abdalati, Tom Herring, Kristine Larson, Jack Saba, and Konrad Steffen, Science 297, 2002.
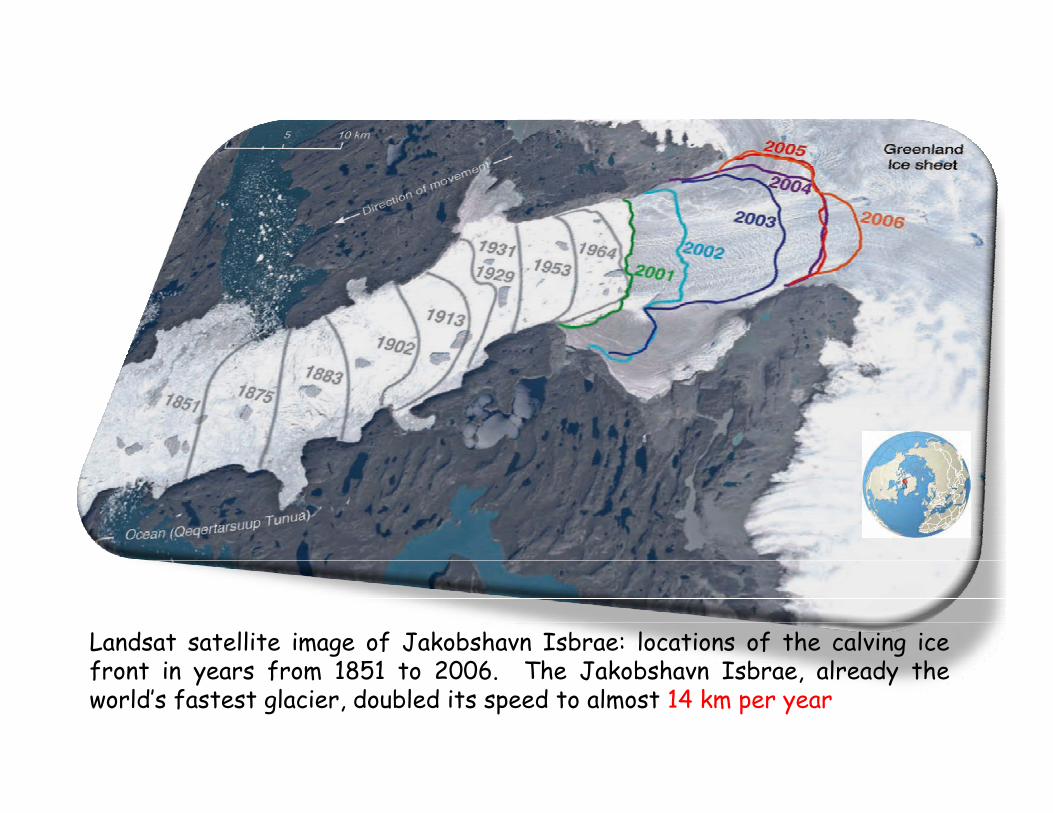
Landsat satellite image of Jakobshavn Isbrae: locations of the calving icef t i f 1851 t 2006 Th J k b h I b l d thfront in years from 1851 to 2006. The Jakobshavn Isbrae, already theworld’s fastest glacier, doubled its speed to almost 14 km per year
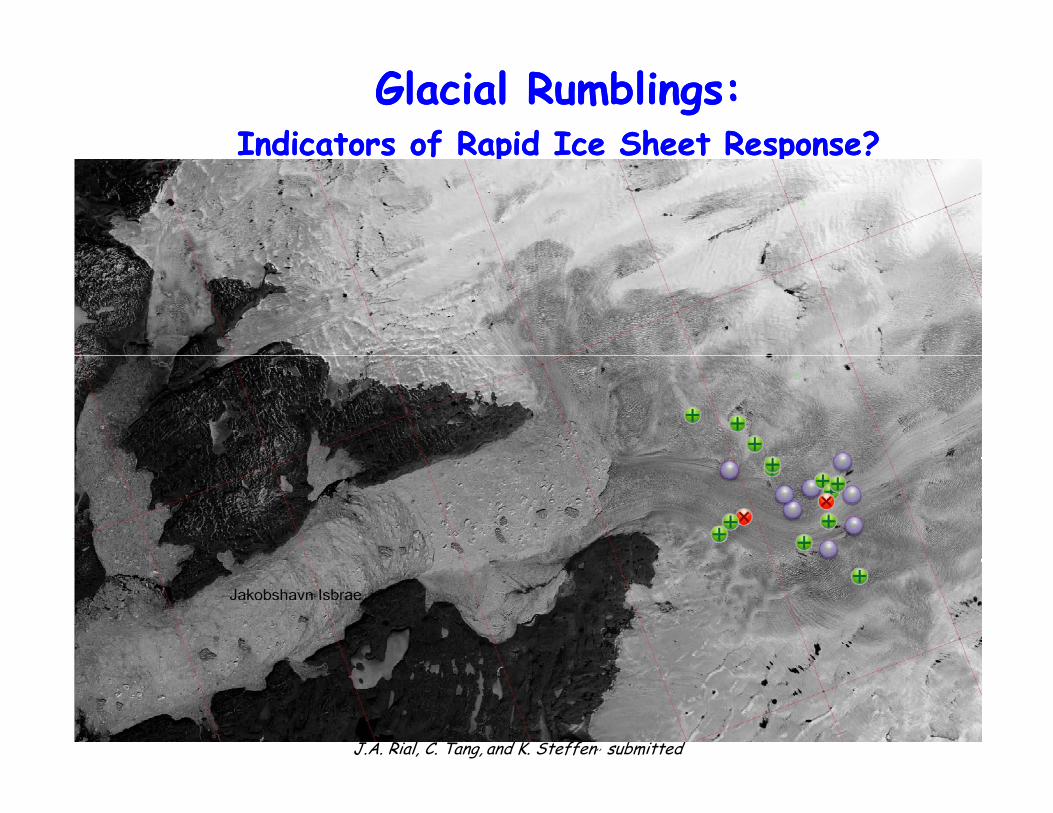
Glacial Rumblings: Glacial Rumblings: Indicators of Rapid Ice Sheet Response?Indicators of Rapid Ice Sheet Response?Indicators of Rapid Ice Sheet Response?Indicators of Rapid Ice Sheet Response?
J.A. Rial, C. Tang, and K. Steffen,, submitted
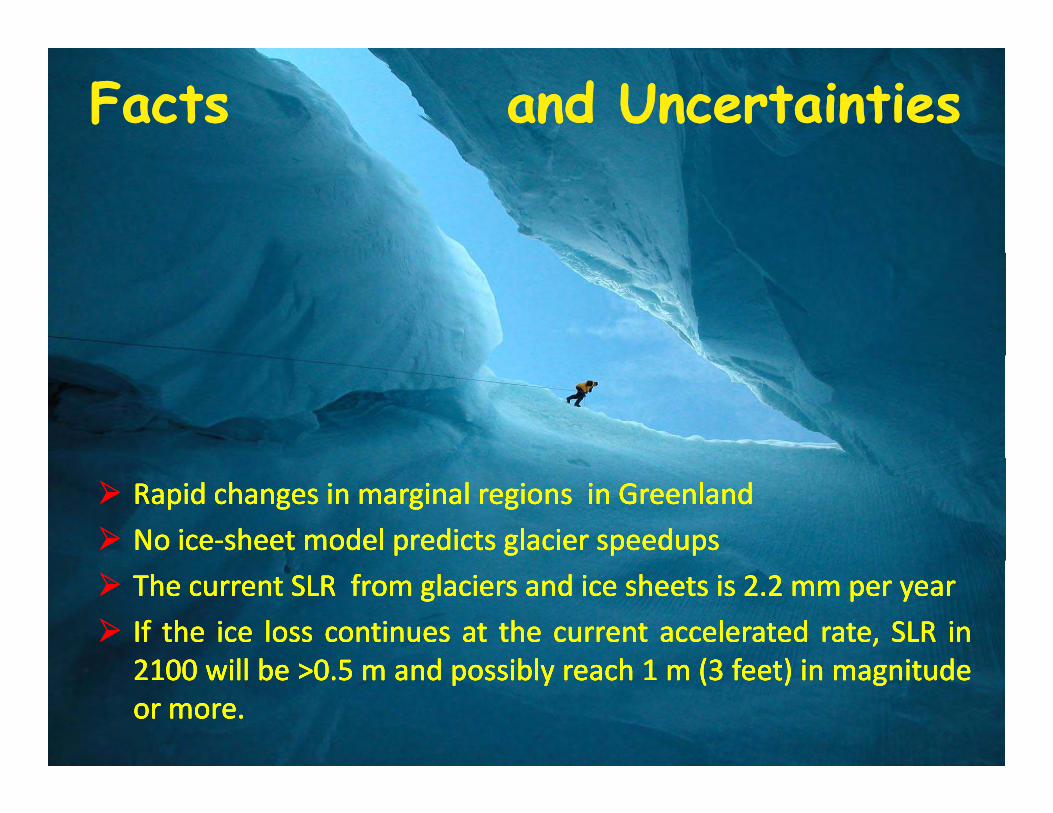
Facts and UncertaintiesFacts and Uncertainties
RapidRapid changeschanges inin marginalmarginal regionsregions inin GreenlandGreenland
NoNo iceice‐‐sheetsheet modelmodel predictspredicts glacierglacier speedupsspeedups
RapidRapid changeschanges inin marginalmarginal regionsregions inin GreenlandGreenland
NoNo iceice‐‐sheetsheet modelmodel predictspredicts glacierglacier speedupsspeedups
TheThe currentcurrent SLRSLR fromfrom glaciersglaciers andand iceice sheetssheets isis 22..22 mmmm perper yearyear
IfIf thethe iceice lossloss continuescontinues atat thethe currentcurrent acceleratedaccelerated rate,rate, SLRSLR inin21002100 illill bb 00 55 dd iblibl hh 11 ((33 f t)f t) ii it dit d
TheThe currentcurrent SLRSLR fromfrom glaciersglaciers andand iceice sheetssheets isis 22..22 mmmm perper yearyear
IfIf thethe iceice lossloss continuescontinues atat thethe currentcurrent acceleratedaccelerated rate,rate, SLRSLR inin21002100 illill bb 00 55 dd iblibl hh 11 ((33 f t)f t) ii it dit d21002100 willwill bebe >>00..55 mm andand possiblypossibly reachreach 11 mm ((33 feet)feet) inin magnitudemagnitudeoror moremore..21002100 willwill bebe >>00..55 mm andand possiblypossibly reachreach 11 mm ((33 feet)feet) inin magnitudemagnitudeoror moremore..