greenworks - wordpress.com
TRANSCRIPT

G R E E N WO R K SP H I L A D E L P H I A
2009 2010 2012 2013 2014 20152011
U P D A T E+
2 0 1 2 P r o g r e s s r e P o r t

CONTENTS
Summary of Greenworks Targets & Initiatives 2
SECTIoN 1 Energy 6
SECTIoN 2 Environment 20
SECTIoN 3 Equity 29
SECTIoN 4 Economy 42
SECTIoN 5 Engagement 54
[PHOTOS]: All photography by Peter Tobia, unless otherwise noted
[DESIGN]: WFGD Studio
[PRIMARY AUTHORS]: Alex Dews and Sarah Wu, Mayor’s Office of Sustainability

Michael A. Nutter Mayor
Katherine Gajewski
Director of SuStainability
IN sPrING of 2009, wE rElEAsED Greenworks PhiladelPhia and announced
our ambitious plan to make Philadelphia the greenest city in the country. We’re well on our way to
achieving many of the Greenworks goals. We’ve reduced our municipal energy use by 5%; more than
tripled our curbside residential recycling rates; increased access to healthy, affordable food for more
than 200,000 Philadelphians; and completed 428 miles of bike lanes. Halfway through our implementa-
tion timeline, we’ve completed or started work on 148 of 167, or 89% of the Greenworks initiatives.
We’re proud of the significant progress we’ve made toward the measurable goals outlined in
Greenworks and of Philadelphia’s growing reputation as a leader in urban sustainability. With three
years of work on Greenworks behind us, we’re taking an in-depth look at the plan, cataloging oppor-
tunities and hurdles, and updating goals to accommodate changes in context that have occurred since
its release. We’re adding new commitments and initiatives and updating baselines where we have new
and improved information to guide our decision-making. as we promised in 2009, we’re sharing both
our successes and our challenges so that others can learn from our experiences.
Greenworks is and always was an expression of Philadelphians’ commitment to sustainability, and busi-
nesses, institutions, nonprofits, and residents have proven their dedication to making Greenworks suc-
ceed. one of many examples is the energy efficiency work booming across all sectors of Philadelphia,
from companies developing cutting-edge technologies, to builders prioritizing efficiency in new
projects, to homeowners retrofitting their houses. local technology company bulogics, with funding
from the Greenworks Pilot energy technology Program, developed energy-efficient light and meter-
ing controls, which they first installed at a commercial scale at the inn at Penn. Habitat for Humanity
Philadelphia and other nonprofit housing developers are committed to building green affordable hous-
ing, and neighborhoods from Queen Village to West oak lane are working together to drive energy
efficiency at the community level.
We’re proud that Greenworks has become a model for other organizations around the city, including
SePta, the Philadelphia Housing authority, and the university city District, to create their own sustain-
ability plans, and we’re pleased that the Greenworks goals and brand have been useful to efforts out-
side of city government. together we’ve integrated sustainability not only into the city of Philadelphia’s
everyday work, but also into our residents’ routines, our businesses’ plans, and our partners’ priorities,
and everyone’s efforts have begun to pay off in just three short years. We’re committed to sustain-
ing our sustainability work well beyond the 2015 timeline of Greenworks, and we look forward to
Philadelphians reaping the benefits for many years to come.
Sincerely,
1
[ABOVE]: Mayor Nutter joins Mayor’s Office of Sustainability and EnergyWorks staff members
Fredda Lippes, Alex Dews, Xenio Yearwood, Theresa Driscol, Sarah Wu, Adam Agalloco, Nancy Hohns, and Katherine Gajewski on a windy day to
celebrate the re-opening of Sister Cities Park.
Dear Friends,
Phot
o b
y M
itch
ell L
eff

BAsElINE BAsElINE YEAr
CUrrENT 2015 GoAl
TargeT 1 lower City Government Energy Consumption by 30 Percent
3.77 Trillion BTus 2008 3.58 Trillion BTus 2.64 Trillion BTus
TargeT 2 reduce Citywide Building Energy Consumption by 10 Percent
111.82 Trillion BTus 2006 126.79 Trillion BTus 100.64 Trillion BTus
TargeT 3 retrofit 15 Percent of Housing stock with Insulation, Air sealing, and Cool roofs
3,500 Homes retrofitted 2008 7,877 Homes retrofitted 84,400 Homes retrofitted
TargeT 4 Purchase and Generate 20 Percent of Electricity Used in Philadelphia from Alternative Energy sources
2.3% alternative Energy 2008 12.2% alternative Energy 20% alternative Energy
TargeT 5 reduce Greenhouse Gas Emissions by 20 Percent
MUNICIPAl
587,899 t Co2e 1990 524,865 t Co2e 470,319 t Co2e
CoMMUNITY
21.21 million t Co2e 1990 22.37 million t Co2e 19.09 million t Co2e
TargeT 6 Improve Air Quality toward Attainment of federal standards
20 unhealthy aQI Days 2008 17 unhealthy aQI Days 10 unhealthy aQI Days
TargeT 7 Divert 70 Percent of solid waste from landfill
53% Diversion rate 2008 72% Diversion rate 70% Diversion rate
TargeT 8 Manage stormwater to Meet federal standards
0 New Greened acres 2011 13.9 New Greened acres 450 New Greened acres
TargeT 9 Provide walkable Access to Park and recreation resources for All Philadelphians
10,300 acres of open Space 2008 10,400 acres of open Space 10,800 acres of open Space
TargeT 10 Provide walkable Access to Affordable, Healthy food for All Philadelphians
230 markets, Gardens, and farms 2008 283 markets, Gardens, and farms 316 markets, Gardens, and farms
TargeT 11 Increase Tree Coverage Toward 30 Percent in All Neighborhoods by 2025
0 New Trees 2008 63,126 New Trees 300,000 New Trees
TargeT 12 reduce Vehicle Miles Traveled by 10 Percent
5.96 Billion Vehicle miles Traveled
2005 5.52 Billion Vehicle miles Traveled 5.36 Billion Vehicle miles Traveled
TargeT 13 Increase the state of Good repair in resilient Infrastructure
73% in State of Good repair 2008 77% in State of Good repair 80% in State of Good repair
TargeT 14 Increase the size of the regional Clean Economy by 25 Percent
2% Clean Sector Share of regional Economy
2010 2010 Data most recent available 2.5% Clean Sector Share of regional Economy
S u m m a r y o f T a r G E T S
2

3
TARGET 1 Lower City Government Energy Consumption by 30 Percent
TARGET 2 Reduce Citywide Building Energy Consumption by 10 Percent
TARGET 3 Retrofit 15 Percent of Housing Stock with Insulation, Air Sealing, and Cool Roofs
TARGET 4 Purchase and Generate 20 Percent of Electricity Used in Philadelphia from Alternative Energy Sources
TARGET 5 Reduce Greenhouse Gas Emissions by 20 Percent
TARGET 7 Divert 70 Percent of Solid Waste from Landfill
TARGET 6 Improve Air Quality toward Attainment of Federal Standards
38 Complete Initiatives19 FutureInitiatives110 Initiatives in Progress
TOTALS
23% 66% 11%
TARGET 9 Provide Walkable Access to Park and Recreation Resources for All Philadelphians
TARGET 10 Provide Walkable Access to Affordable, Healthy Food for All Philadelphians
TARGET 11 Increase Tree Coverage Toward 30 Percent in All Neighborhoods by 2025
TARGET 12 Reduce Vehicle Miles Traveled by 10 Percent
TARGET 13 Increase the State of Good Repair in Resilient Infrastructure
TARGET 14 Increase the Size of the Regional Clean Economy by 25 Percent
TARGET 15 Philadelphians Unite to Build a Sustainable Future
TARGET 8 Manage Stormwater to Meet Federal Standards
I N I T I a T I V E P r o G r E S S B y T a r G E T
WiTh This 2012 reporT, we are midway through the Greenworks implemen-tation timeline of 2009 to 2015. Since we released the plan in 2009, we have built data tracking systems which are allowing us to provide metric progress at the target level for the first time. Working with internal partners and external advocates we identified updates to targets that respond to changes in context, and found new strategies to help meet our goals. We added 28 new initiatives and removed 12 that we chose not to pursue or are no longer relevant. The updated Greenworks plan is made up of five goal areas, fifteen measurable targets, and 167 initiatives. The table below is a snapshot of progress to date, and reflects the number of initiatives that are complete, underway, or under consideration for the future.

4
Philadelphia2035 Comprehensive and District Plans
The Philadelphia City Planning Commission (PCPC) adopted the new comprehensive plan, Philadelphia2035 – Citywide Vision, in June 2011. fulfilling PCPC’s Charter-mandated responsibility to prepare a physical development plan for the city, Philadelphia2035 provides overall policy and location guidance for future private and
public investment. The plan makes recommendations organized under the themes of Thrive, Connect, and renew.
of the nine high-level goals set by Philadelphia2035, seven directly relate to Greenworks priorities. Thanks to the comprehensive plan, Philadelphia will continue over the next 20 years to: improve neighborhood livability; make Philadelphia more economically competitive; capitalize on land assets; improve transportation safety, efficiency, and convenience; adapt utility services to changing technology and consumption patterns; increase equitable access to open-space resources; and fulfill City obligations to meet ambitious federal environmental standards.
over the next five years, PCPC will prepare 18 District Plans covering every neighborhood of Philadelphia to focus the comprehensive plan’s broad rec-ommendations more specifically and geographically. The district planning process will engage residents in helping to guide zoning remapping, open space and transportation improvements, and food access planning, among other topics that will advance Greenworks goals in every neighborhood around the city. for more information on the comprehensive and district plans, visit www.phila2035.org.
PLANNING AND ZONING SUPPORT Greenworks GOALS
reducing Vehicle Miles Traveled/promoting Walking and Community health
• Chapter 14-400 creates and consolidates more mixed-use districts that allow residents to live closer to their work
• Section 14-705 requires project compliance with transit oriented Development (toD) standards in areas surrounding transit stations and nodes
• Tables 14-602-1 and 14-602-2 allow conve-nience retail uses to be provided closer to where residents live, and allow more shop-ping trips to be completed by foot or bicycle instead of automobile
• Section 14-604(8) allows a wide variety of home occupations subject to standards to address impacts on surrounding properties
• Chapter 14-800 limits the amount of off-site parking that can be provided and allows commercial and institutional buildings to be located closer to each other in more walkable patterns
• Tables 14-802-1 and 14-802-2 limit curb cuts that interrupt sidewalks and discourage walking
• Section 14-802(8) allows off-street parking to be reduced if development is designed to share parking (encouraging mixed use); if development is located close to transit facili-ties; or if the builder provides bicycle parking
S U S T A I N A B I L I T Y E L E M E N T S I N T H E N E W Z O N I N G C O D E
Philadelphia achieved two major milestones for planning and zoning in 2011. Employing integrated,
multi-year processes that involved hundreds of residents and stakeholders, the City adopted both a new
citywide comprehensive plan as well as a new zoning code. The goals set in Greenworks helped shape the
sustainability principles and strategies included in both efforts, and both the zoning code and comprehen-
sive plan will help ensure that the City of Philadelphia continues to strive toward sustainability goals well
beyond the 2015 Greenworks timeline.

PLANNING AND ZONING SUPPORT Greenworks GOALS
encouraging renewable energy and energy Conservation
• Section 14-604(5) allows small wind energy systems as an accessory use in all districts subject to standards for compatibility
• Section 14-604(6) allows solar collectors as an accessory use in all districts subject to standards for compatibility
• Section 14-701(6) allows solar and wind energy equipment to encroach limited distances into side and rear setback areas and through build-ing height limits
• Section 14-702(10) establishes floor area bonuses for development and redevelop- ment that achieves leeD Gold or Platinum certification
encouraging Water Conservation
• Section 14-701(6) allows water conservation equipment to encroach limited distances into side and rear setback areas
• Section 14-702(10) establishes floor area bonuses for development and redevelopment that achieves leeD Platinum certification
• Section 14-705(3) requires that develop-ment and redevelopment comply with Water Department regulations regarding stormwater management
• Section 14-706(2) requires that landscaping in multi-family and non-residential development use water-conserving landscaping and irriga-tion equipment
encouraging Urban Food production
• Tables 14-602-1, 14-602-2, 14-602-3 and 14-602-4 allow farmers markets, fresh food markets, community gardens, market farms, community supported agriculture farms, ani-mal husbandry, and horticultural nurseries and greenhouses in a variety of zone districts
• Section 14-603(8) provides incentives for fresh food markets to locate in a variety of zoning districts
New Zoning Code Encourages Sustainable Development
City Council adopted the new zoning code in November 2011, and mayor Nutter signed it into law in December. Shepherded by a Zoning Code Commission created spe-cifically to address the outdated structure
and provisions of the previous, 1960s-era code, the new zoning code aims to make Philadelphia’s development process more predictable as well as sustainable.
When the updated zoning code goes into effect in august 2012, it will permit and promote more sustainable development and redevelopment by encouraging reduced vehicle miles traveled (VmT), energy conservation and use of renewable energy, water conservation, and urban food production. for more information on the new zoning code, visit www.zoningmatters.org.
Philadelphia City Planning Commission Districts
UPPER FAR NORTHEAST
LOWER FARNORTHEAST
CENTRAL NORTHEAST
NORTHDELAWARELOWER
NORTHEAST
UPPERNORTH
UPPERNORTHWEST
LOWERNORTHWEST
RIVERWARDS
NORTH
LOWER NORTH
CENTRAL
SOUTH
WESTPARK
WEST
UNIVERSITY/SOUTHWEST
LOWERSOUTH
LOWERSOUTHWEST
Fall Year 1
Year 2
Year 3
Year 4
Year 5
Spring Year 6
DISTRICT PLANNING SCHEDULE
5
[LEFT]: Zoning Code Executive Director Eva Gladstein, former Councilman Frank DiCicco, and Deputy Mayor for Economic Development and Director of Commerce Alan Greenberger
look on as Mayor Nutter signs the new zoning code into law.
Phot
o b
y M
itch
ell L
eff

E N E R G YGoAl: PHILADELPHIA REDUCES ITS VULNERABILITY TO RISING ENERGY PRICES
T A R G E T 1 : Lower City Government Energy Consumption by 30 Percent
CiTy oF philadelphia redUCes energy ConsUMpTion by 4.9%
Since the release of Greenworks in 2009, the City of Philadelphia has reduced municipal energy use by 4.9%. The largest portion of this reduction stems from reduced vehicle fuel use, while the next largest contributor was the replacement of 85,000 incandescent traffic signals with LED bulbs. Other completed projects that led to energy use reduction include solar thermal hot water heating at correctional facilities, on-site solar generation at a wastewater treatment plant, and upgrading the efficiency of the cooling system at one of the City’s four large downtown office buildings. Between 2009 and 2011, this reduction in energy use helped the City avoid nearly $4 million in energy costs.
energy efficiency Fund
To continue the trend of reducing energy use, the Mayor’s Office of Sustainability (MOS) created the Energy Efficiency Fund (EEF), which offers funding to departments on a competitive basis to support the implementation of energy efficiency projects within existing City-owned facilities. The first round of EEF supported 10 projects, which are all underway or completed as of spring 2012. MOS anticipates measurable energy sav-ings resulting from the projects beginning in 2012. MOS selected another 15 projects for the second round of EEF in spring 2012 and plans to make funding available for future rounds of projects.
Utility Bill Management Database
In partnership with the Mayor’s Office of Transportation and Utilities (MOTU), MOS continues to make the utility bill management database more robust. Each month
• Adjusted Greenworks baseline (Fy08)
3.77 trillion btus
• Current (FY11)
3.58 trillion btus
• Adjusted 2015 Target
2.64 trillion btus
M E T R I C S
City Government Energy Use reductions
Achieved Reduction
Actual Use
Targeted Reduction
Targeted Use
Future Commitments
Future Energy Efficiency Projects at Large Facilities (Guaranteed Energy Savings or similar)
Future Small Scale Energy Efficiency Projects
Planned Small Scale Energy Efficiency Projects
Preventative Maintenance Pilot
Triplex and City Hall Guaranteed Energy Savings Project
Northeast Water Treatment Plant Biogas Combined Heat and Power
Completed Small Scale Energy Efficiency Projects
LED Traffic Light Replacement
Vehicle Reduction
Note: Coloring indicates phase: Completed, In Progress, Future
0
1,000,000
500,000
1,500,000
2,000,000
2,500,000
3,000,000
3,500,000
4,000,000
0%
5%
10%
15%
20%
25%
30%
MM
BTU
s
FY08 FY09 FY10 FY11 FY15 Completed In Progress Future
6
2008 baseline energy consumption adjusted to reflect updated usage data
E N E R G Y
MOTU provides energy use reports to City departments, and more than 70 employees have received training on how to track energy use through the database. Armed with this information, departments and agencies better understand the opportunities and benefits of energy efficiency.
guaranteed energy savings Project
The Mayor’s Office of Sustainability is implementing the City’s first guaranteed ener-gy savings project at the City’s four largest downtown office buildings which are heavy energy users with high energy savings potential. In 2011, an energy service company determined the feasibility of energy conservation measures (ECMs) at each of the four facilities, and the City selected nine ECMs to implement. The City will use the guar-anteed energy savings from the ECMs to fund the upgrades, which will result in City facilities that are easier to operate, more comfortable, and less costly to maintain.
Preventative Maintenance Program
In 2012, the Department of Public Property received approval to hire 16 employees to begin a preventive maintenance program that will help the City complete scheduled projects and move from a reactive maintenance approach to a proactive one. New York City recently implemented a similar program and has seen a resulting 17% decrease in energy use. The City anticipates that along with decreased energy use, the program will also yield better-quality facilities and lengthen the useful life of equipment. Another effort that will help the City manage facilities proactively is the Facilities Task Force, which Mayor Nutter created by Executive Order in summer 2011. One of the Task Force’s responsibilities is to recommend how the City can incorporate best practices of sustainability and energy efficiency into City building use decisions.
supporting Innovative and emerging technologies
The City is committed to testing emerging energy efficiency technologies at munici-pal sites. In April 2012, the Philadelphia Water Department (PWD) installed the first commercial-scale geothermal system in the country that provides heating and cooling using domestic wastewater at the Southeast Wastewater Treatment Plant. Partnering with NovaThermal Energy, a Philadelphia-based company, PWD is saving money and energy while also commercializing a new technology.
In October 2012, Philadelphia Gas Works (PGW) installed a 200-kilowatt natural gas-fired combined heat and power microturbine system that generates approximately 40 percent of the electricity required for PGW’s headquarters on-site and uses waste heat to cool the facility in the summer and supplement heating in the winter. The microtur-bine system reduces the facility’s carbon footprint by more than 50 percent.
City Completes First LEED Project
Streets Department engineering Supervisor Mark Draber is putting the finishing touches on the city’s first leeD project, the area 6 training center in northeast Philadelphia. the new center, which replaces an existing training facility, includes two classrooms and increased office capacity in a building that showcases energy efficiency and sustainable design practices. newly planted cherry trees provided by Philadelphia Parks & recreation and concrete pavers from the city’s community life improvement Program line the entrance, underscoring the interagency col-laboration that made the project possible.
“i’ve been on site every day since this project broke ground, and it’s been exciting for everyone involved to see the building come together,” said Draber. the build-ing materials were all sourced within 500 miles of Philadelphia, and are high in recycled content. the cool roof and advanced mechanical systems complement an innovative design that provides daylighting throughout the building.
7
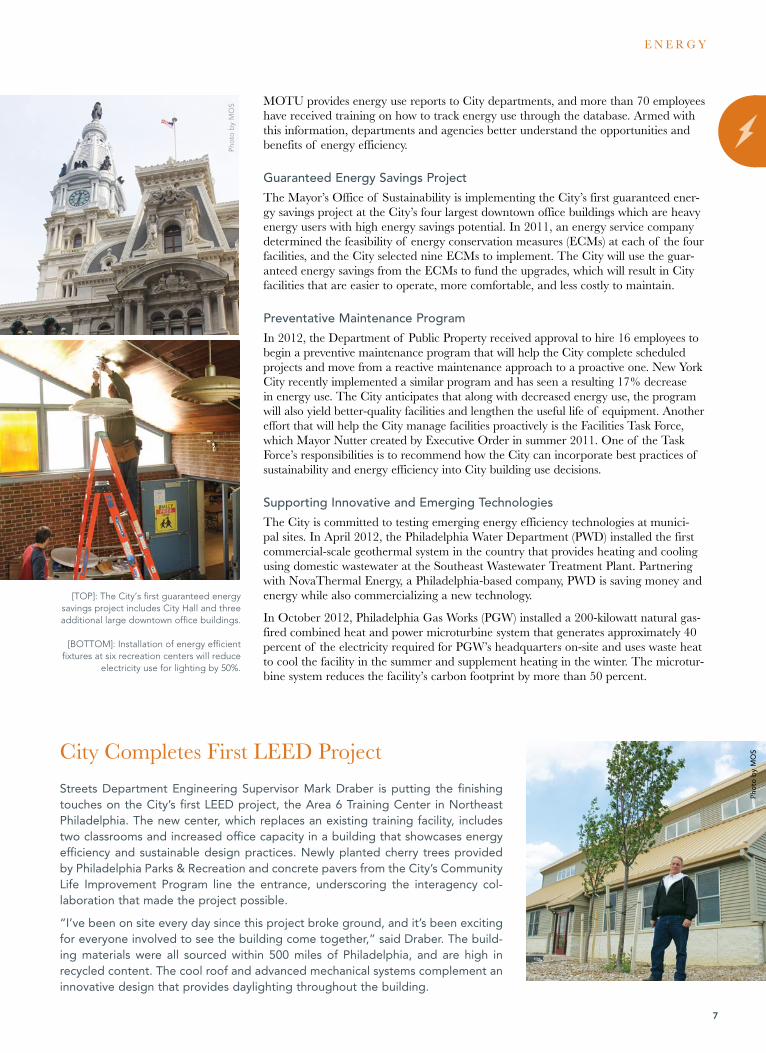
[TOP]: The City’s first guaranteed energy savings project includes City Hall and three additional large downtown office buildings.
[BOTTOM]: Installation of energy efficient fixtures at six recreation centers will reduce
electricity use for lighting by 50%.
Phot
o b
y m
oS
Phot
o b
y M
os

T A R G E T 1
install new lightingrePlaceD 85,000 leD traffic SiGnalS
• 4,924 GHG Reduced (MT CO2e)• 9,274 MWh Reduced• 31,641 MMBTU Reduced
(electricity only)
liGHtinG uPGraDeS at Six recre-ation centerS
• 263 GHG Reduced (MT CO2e)• 347 MWh Reduced• 1,184 MMBTU Reduced
(electricity only)
develop energy load/demand Management practices
• 83 GHG Reduced (MT CO2e)• 109 MWh Reduced• 373 MMBTU Reduced
(electricity only)
City Car Management plan reDuceD city fleet by 542 carS SinCe 2003
• 10,780 GHG Reduced (MT CO2e)• 136,393 MMBTU Reduced
(not including electricity)
energy efficiency Capital improvements
• 531 GHG Reduced (MT CO2e)• 1,000 MWh Reduced• 3,412 MMBTU Reduced
(electricity only) • 6,715 MMBTU Reduced
(not including electricity)
B Y T H E N U M B E R S
8
Mayor Nutter congratulates Department of Public Property staff members
Christian Holland, Joseph Palantino, Kevin McKinney, and Carmen Diaz-
Rosario for their work making the City’s participation in PJM’s Demand
Response program a success.
i n i t i at i V e P r o G r e S S 2 0 1 2
neW | Apply for All Available Utility rebates
city seeks all available rebates from the Peco Smart ideas pro-gram.
neW | Establish Energy Efficiency fund
in 2010, the city established an energy efficiency fund to support energy efficiency projects in city-owned buildings. city depart-ment projects compete for funding and are chosen by an interde-partmental selection committee based on their potential energy savings.
neW | Establish facilities Task force
in summer 2011, the Mayor signed an executive order creating a facilities task force.
neW | re-establish Municipal Energy office
under the nutter administration, a high-functioning energy office has been incorporated into the Mayor’s office of transportation and utilities.
neW | Upgrade Energy Efficiency of Vending Machines
Vending machines at triplex buildings, city Hall, recreation centers, and other city facilities have been either retrofitted or replaced for energy efficiency. updated machines have setbacks to shut down during the night to save energy.
Adopt Integrated Utility Bill Management system
the city continues to make improvements to the utility bill man-agement database that monitors and tracks energy usage in all city facilities.
City Car Management Plan Successful first phase of vehicle reduction and car-sharing pro-gram complete. Working with support from the World business council, city will assess current fleet operations.
Develop Energy load/Demand Management Practices
in summer 2011, the city’s participation in PJM’s Demand response program resulted in a 8.6MW reduction. in summer 2012, city participation will expand from 17 facilities to 24.
lEED legislation for City Buildings
Section 17-111 of the Philadelphia code effective since January 2010. as of spring 2012, five city-owned leeD projects are in design; four are under construction. built in 2011, the Streets Department training center is the first complete city-owned leeD project.
I n I t I a t I v e P R O G R e S S
co
MP
lete
D
Phot
o b
y M
itch
ell L
eff

9
E N E R G Y
i n i t i at i V e P r o G r e S S 2 0 1 2
neW | Benchmark large City facilities
the city is using energyStar Portfolio Manager to benchmark all facilities of more than 10,000 square feet in 2012.
neW | Create Green Information Technology Plan
as a first step, office of innovation technology is drafting a power management policy which will be communicated to all city employees.
neW | Green Building Training for City Employees
l&i and Department of Public Property staff received green build-ing training in 2011. city continues to offer educational opportu-nities for building inspectors, code officials, and design staff.
neW | Implement Preventive Maintenance Plan
the Department of Public Property received funding to hire 16 new employees to support a Preventive Maintenance pilot in city facilities. city anticipates this pilot will improve facility conditions, extend equipment life, reduce overall maintenance costs, and conserve energy.
Encourage Conservation Among Employees
as energy efficiency fund and guaranteed energy savings projects are completed, employees in updated buildings receive education about energy efficiency. employees at 24 facilities will participate in demand response events in 2012.
Energy-Efficient Capital Investments
construction on the city’s first guaranteed energy savings proj-ect at triplex buildings and city Hall to begin summer 2012. feasibility of additional projects being evaluated. first round of energy efficiency fund projects are completed or underway. another round of projects was selected in spring 2012, and fund-ing is available for future projects.
five-year strategic Energy Plan (water Department)
PWD utility Wide Strategic energy Plan is in place. Project-specific plans are updated annually.
Identify less-Expensive and Alternative Energy sources
city is purchasing electricity and natural gas with a strategic wholesale approach. 20% of electricity purchased by the city is generated from renewable resources.
Implement Capital Budget Energy Guidelines
Mayor’s office of Sustainability is offering energy efficiency technical support to capital projects upon request.
Install New outdoor lighting
Streets Department completed installation of 85,000 leD traffic signals and is conducting an leD street light pilot with u.S. Department of energy that installed 55 leD luminaires from 13 manufacturers in three locations. Using grant funds from the State, the Mayor’s office of Sustainability and Philadelphia Parks & recreation are installing efficient lighting at six recreation cen-ters and considering expansion to additional sites. construction will be complete late spring 2012, and improvements will reduce electricity use for lighting by 50%.
Investigate Conversion of City Buildings from steam loop to Natural Gas
based on cost estimates and payback scenarios for all major steam accounts, the city has identified potential conversion projects and is currently exploring the feasibility of a natural gas combined heat and power project at the Philadelphia Museum of art.
Use future Energy Costs to Help Inform Building Acquisition/Expansion Decisions
the facilities task force is working with city staff to make recom-mendations on how to incorporate best practices of sustainability and energy efficiency into city building use decisions.
neW | Pilot AMI with City Buildings
city will participate in Peco Smart future Greater Philadelphia project and will pilot advanced meters at several city buildings.
neW | Pilot an Integrated Design Project
future initiative.
neW | Use City Buildings to Test Emerging Energy Efficiency Technologies where feasible
future initiative.
Include Energy Conservation in future Building Maintenance Contracts
through guaranteed energy savings projects, maintenance contracts at triplex buildings will be updated to include energy-efficient practices.
Pilot Department Energy Conservation Incentives
Monthly energy use reports are generated from the utility bill management database and delivered to departments. More than 70 city employees have received training on how to track energy use through the database. evaluating feasibility of piloting target energy budget and incentive programs with departments.
I n I t I a t I v e P R O G R e S S C O n t I n U e D
in P
ro
Gr
eSS
futu
re

11
energy eFFiCienCy iMproVes While oVerall Use rises
Energy-efficient building construction and renovation have expanded significantly in Philadelphia since Greenworks was released in 2009. The number of EnergyStar-certified commercial buildings has increased 70%; the School District of Philadelphia has achieved LEED certification on five schools; and the residential energy efficiency market continues to expand under EnergyWorks and other weatherization programs. The collective results of efforts like these and market transformations further embrac-ing high performance buildings are impressive, but have not been enough to offset an overall increase in citywide energy use between the Greenworks baseline year of 2006 and 2010.
The recent trend of rising building energy use is not unique to Philadelphia, but is occurring across the country. The three primary drivers are extreme weather, a slow economy, and historically low energy prices. Since Greenworks began tracking citywide energy use in 2009, Philadelphia set new records for annual snowfall and the hottest summer since records were first kept in 1872. These weather extremes had a major impact on how much energy Philadelphians used to heat and cool their homes and businesses. The global financial crisis that began in fall 2008 has had a surprising impact on energy use. With constrained budgets, building owners postponed equip-ment upgrades and repairs, and these delays ultimately result in less efficient systems. Understanding and tracking these energy use trends helps identify opportunities to drive energy reduction. The Mayor’s Office of Sustainability is committed to tracking and reporting citywide energy use on a bi-annual basis.
Building energy use increased slightly in the residential sector during this period, but rose significantly in commercial buildings. The table below breaks down all building energy use by source.
energy Use by sector
Buildings in Philadelphia use twice as much energy as the transportation sector, and 30% of this energy is wasted due to inefficient operations, deferred maintenance, and poor construction quality. Last year, the Energy Efficient Buildings Hub at the Navy Yard published a report indicating that 77% of Philadelphia’s commercial building stock is in need of energy upgrades based on age, size, and construction type. Most of the city’s residential properties are more than 30 years old and also good candidates for retrofits to improve energy performance.
City and Utility Programs support Building energy efficiency
To meet the needs of both commercial and residential building owners, the City’s EnergyWorks program provides technical guidance, low-interest financing, and quality assurance to improve building energy efficiency. In addition, PECO’s Smart Ideas program and PGW’s EnergySense programs, available to residents and businesses, offer a variety rebates and incentives to conserve energy.
existing Buildings Cut energy Use
Cutting energy use in existing buildings is essential to reaching the reduction goals set in Greenworks, and several Philadelphia properties have shown their commitment to this goal in the past year. The 27-story office tower 10 Penn Center, in the heart of Center City, became the first building in Philadelphia to earn LEED Gold for Existing Buildings certification in the summer of 2011. The 30-year-old building was renovated
T A R G E T 2 : Reduce Citywide Building Energy Consumption by 10 Percent
• Adjusted Greenworks baseline (2006)
111.82 trillion btus
• Current (2010)
126.79 trillion btus
• Adjusted 2015 Target
100.64 trillion btus
M E T R I C S
Electricity–Residential
Electricity–Commercial and Industrial
Natural Gas–Residential
Natural Gas–Commercial and Industrial
On Site Combustion–Residential
11%
3%
31%
29%
26%
10
2006 baseline energy consumption adjusted to reflect updated usage data
Energy Use by source
2010

11
E N E R G YE N E R G Y
to maximize energy and water efficiency and improve indoor environmental quality for its 1,700 tenants. In North Philadelphia, 1260 Housing Development Corp.’s Temple II project received recognition under the Enterprise Green Communities affordable green building program and achieved Platinum certification in the LEED for Homes category. The adaptive reuse project is an integral piece of neighborhood revitalization efforts and consists of 40 apartments in 29 historic townhomes, providing affordable, accessible homes that meet the highest standards of sustainable design.
Innovation in Industrial Construction
In the industrial building sector, Penn Jersey Paper’s new corporate headquarters and distribution center in Northeast Philadelphia received LEED Silver certification in November 2011. The project was developed by Dermody Properties, which has com-pleted more than 2 million square feet of LEED-certified properties to date and is com-mitted to developing sustainable, high-performance industrial buildings.
lEED and Energystar Projects in Philadelphia
0
10
20
30
40
50
60
70
2008 2012
LEED Certified Projects
EnergyStar Buildings
28
6156
15
Integrated Energy Management at Thomas Jefferson University and Hospital
Thomas Jefferson University and Hospital (TJU) consists of over 5 million square feet of property and more than 13,000 employees in five counties. Randy Haines, energy Manager at tJu, oversees a large and complex building portfolio that uses a tremen-dous amount of energy. in order to maximize energy efficiency and reduce operation-al costs, Haines and his team have implemented procurement, conservation, building automation, and communication strategies that have resulted in impressive savings.
Some highlights of the tJu’s plan include recommendations to design energy effi-ciency into all building renovations and new construction projects, and retro-commis-sioning every three to five years to ensure operational efficiency. tJu also supports local renewable energy production by purchasing 35% of its electricity from Locust ridge Wind farm, located in eastern central Pennsylvania.
While the building footprint and plug load of tJu have grown over the past sev-eral years, Haines and his team have managed to reduce electricity consumption. efficiency measures have helped tJu avoid $15 million in energy costs since 2009. in february 2012, tJu opened the Health Professions academic building at 901 Walnut Street., the first leeD-certified building in its portfolio.
In the fall of 2011, Asociación Puertorriqueños en Marcha completed 13 new LEED Gold homes that use solar hot water systems to
help residents reduce the cost of hot water.
11

T A R G E T 2
Greenworks loan Fund energy Efficiency Projects
• 197 GHG Reduced (MT CO2e)• 324 MWh Reduced• 1,104 MMBTU Reduced
(electricity only)• 472 MMBTU Reduced
(not including electricity)
B Y T H E N U M B E R S
i n i t i at i V e P r o G r e S S 2 0 1 2
Create a revolving loan fund for Commercial and Industrial Energy Efficiency retrofits
in 2011, the energyWorks commercial program lent more than $12 million, leveraged more than $142 million, and upgraded more than 660,000 square feet of space. Projects funded to date will save a projected $311,400 in energy costs per year.
Develop Cool roof Code Bill no. 090023 signed into law May 2010 requiring all new construction and major renovation projects with low-sloped roofs to install energyStar-certified cool roofs. l&i now distributes energyStar cool roof information to contractors during the permit process.
Establish Power Purchase Pools for small Businesses
Philly buying Power (PbP), a city-endorsed program, aggregates small- and medium-size businesses into large electricity-buying pools that can attract lower rates than businesses can find on their own. PbP purchased over 46 million kilowatt hours for more than 400 properties in 2012, and the businesses received 100% green energy for less than the default market price.
Pursue Competitive Energy Efficiency and Conservation Block Grant through U.s. Department of Energy
the city of Philadelphia, in coordination with the Metropolitan caucus and program partners, received $25 million in funding through the u.S. Department of energy’s competitive better buildings program to develop energyWorks. energyWorks is a comprehensive energy solutions program for home and com-mercial or industrial building owners, helping owners find ways to reduce their building’s energy use and providing low-interest loans to help them pay for upgrades. in its first year and a half, energyWorks has proven to be a strong and successful model.
Consider Adoption of Green Building Code
the city integrated additional green building practices into its new zoning code and its regulations for solar installations. city efforts continue to promote timely statewide adoption of 2012 icc codes necessary to maintain progress toward city goals for reduced energy consumption, energy cost savings, and improved air quality.
Create an Energy Authority the Philadelphia energy authority was established in 2011 and meets regularly to discuss current and future city projects. the city anticipates using the assistance of the authority to enter into future long-term energy projects.
Develop a Citywide Energy-Efficiency Marketing Campaign
energyWorks developed a simple, compelling campaign tying multiple value, comfort, health, and savings messages together and using real-life examples to communicate energy efficiency. the program’s website received more than 20,000 visitors in its first year.
Explore Energy Benchmarking and reporting for large Commercial Buildings
city will benchmark large facilities using Portfolio Manager in summer 2012. Legislation requiring energy benchmarking for large commercial facilities introduced in city council in spring 2012 by councilwoman blondell reynolds brown.
Grant floor-Area ratio Bonuses
Zoning code passed in December 2011 offers density bonuses on a sliding scale for development projects that meet leeD Platinum or Gold standards.
Install Advanced Metering Infrastructure
through the Smart future Greater Philadelphia project, funded by the u.S. Department of energy and Peco, Peco will install 600,000 smart meters and a meter data management system in 2012 and 2013.
neW | recapitalize Energyworks loan program with private funds
the federal arra dollars supporting the energyWorks program expire in 2013. The Mayor’s Office of Sustainability, PiDC and the reinvestment fund will work together to raise private capital to continue commercial energy efficiency lending.
Develop Energy-Efficiency Building Guidelines
to provide internal capacity, the city continues to provide green building training for building inspectors and city planning staff. the Mayor’s office of Sustainability has also worked with the Philadelphia redevelopment authority and the office of Housing and community Development to develop rfP guidelines that promote energy efficiency and sustainable design.
I n I t I a t I v e P R O G R e S S
in P
ro
Gr
eSS
co
MP
lete
Dfu
tur
e
12
[TOP]: The Temple II project on North Gratz Street includes 40 LEED Platinum homes.
[BOTTOM]: An advertisement from the EnergyWorks regional marketing campaign,
launched in 2011.

More Than 7,800 hoMes reTroFiTTed in philadelphia
Since Greenworks launched in 2009, publicly funded programs have supported the weatherization of more than 7,800 homes in Philadelphia. This work represents approximately 10 percent of the Greenworks goal to weatherize 15 percent of occupied housing units with insulation, air sealing, and cool roofs. The 7,877 homes are only a portion of the weatherization work that took place over the past three years because this data does not include private market housing retrofits which are often performed by homeowners and are therefore difficult to track.
Funding sources shift
The funding landscape for residential retrofits is rapidly changing. As American Recovery and Reinvestment Act (ARRA) funds expire and the longstanding Weatherization Assistance Program (WAP) experiences significant cuts at the federal and state levels, stakeholders in Philadelphia recognize that new and creative means of supporting retrofit work are required. Public dollars alone will not be sufficient to reach the Greenworks goal of retrofitting 15 percent of the city’s housing stock. In Philadelphia, residential retrofit activity is taking place through government and utility programs as well as through expanding private market activity. Continued outreach and consistency in educational messaging are essential to help homeowners understand the savings and comfort benefits of energy efficiency upgrades.
energyWorks encourages Private Market energy efficiency Upgrades
EnergyWorks, a collaborative program of the Metropolitan Caucus, is a comprehensive energy solutions program for home and com-mercial building owners in the five-county region. To administer residential projects, EnergyWorks partners with the Energy Coordinating Agency (ECA), the Keystone HELP Program, and AFC Financial to offer
a one-stop-shop approach. Funded for three years through a grant from the U.S. Department of Energy’s Better Buildings initia-tive, EnergyWorks is developing a scalable and sus-tainable model for streamlining the
residential retrofit process. The Mayor’s Office of Sustainability is committed to developing a strategy for extending components of the program beyond the ARRA dollars that sup-ported its initial development.
T A R G E T 3 : Retrofit 15 Percent of Housing Stock with Insulation, Air Sealing, and Cool Roofs
• Greenworks baseline (2008)
3,500
• Current (2011)
7,877
• Adjusted 2015 Target
84,400
M E T R I C S
Energyworks residential loans
E N E R G Y
13
$0 – $5,000
$5,001 – $10,000
$10,001 – $20,000
$20,001 – $35,000
Homes retrofitted
Homes retrofitted
Homes retrofitted
2015 Target adjusted to 15% of occupied housing

Local Utility Programs support Conservation
Utilities remain an important piece of the energy efficiency puzzle. In Philadelphia, both Philadelphia Gas Works (PGW) and PECO have strong programs in place. In 2011, PGW launched EnergySense, a portfolio of six energy efficiency programs available to help all PGW residential, commer-cial, and industrial customers conserve energy and save money. The heart of EnergySense is a significantly expanded low-income weatherization program that provides whole-home retrofits to select customers enrolled in the company’s Customer Responsibility Program. The newly redesigned program will allow PGW to continue treating several thousand homes a year and to improve work within each home to maximize cost-effectiveness and savings. As of March 2012, PGW EnergySense programs have weath-erized approximately 1,800 homes in Philadelphia. Additionally, through a partnership with PA Careerlink Philadelphia, PGW has helped place local, unemployed Philadelphians in entry-level weatherization jobs created by EnergySense. PGW plans to launch additional EnergySense programs, including incentives to encourage all PGW residential customers to under-take whole-home weatherization projects. The Pennsylvania Public Utilities Commission has approved EnergySense through 2015.
Pennsylvania Act 129 requires electric utilities to reduce their overall elec-tricity load 1% by 2011 and 3% by 2013, and to reduce peak demand by 4.5% by 2013. In the Philadelphia area, PECO Smart Ideas is offering customers a suite of energy efficiency and conservation programs. PECO is on track to meet the 2013 reduction goal, and the Pennsylvania Utility Commission is currently considering how to structure a second phase of Act 129.
green and Healthy Homes Initiative
The City of Philadelphia is one of fifteen sites in the country participat-ing in the Green and Healthy Homes Initiative (GHHI). Expanding on the City’s longstanding lead and mold abatement work, the Philadelphia Department of Public Health is developing a whole house strategy for environmental health, safety, and energy efficiency assessments and inter-ventions. The City’s GHHI program effectively aligns funding streams and efficiently integrates weatherization, energy efficiency, healthy homes, and lead reduction efforts to maximize improvements resulting from program-matic investments. The initial pilot round of the program updated 25 homes throughout Philadelphia.
green Building standards for City Funded Projects
Every year, the City of Philadelphia supports thousands of square feet of new development and rehabilitation projects through the Philadelphia Redevelopment Authority, the Office of Housing and Community Development, and in partnership with the Philadelphia Housing Authority. Each of these agencies has worked hard to support green building, energy efficiency, and sus-tainable design in its projects over the past several years, with impres-sive results. These projects are a great start, but the City can do more. As a new Greenworks commit-ment, City agencies will collaborate to develop a green building stan-dard for all residential and mixed-use projects receiving City funding.
EnergyWorks Helps Resident Improve Efficiency and Comfort of Home
Sade olanipekun-lewis’ house in Mt. airy was built over 100 years ago. like most homes in the area, it is full of historic character and original crafts-manship, but has little or no insulation. Heating costs during the winter would often run as high as $500 per month, and even still some parts of the house were uncomfortably cold.
olanipekun-lewis heard about the energyWorks program, a one-stop-shop solution for her leaky house, and signed up for a home energy assess-ment, conducted by alternegy building analyst Jamie Horan. after completing a blower-door test and other diagnostic checks, Horan provided olanipekun-lewis with a list of measures that would help her reduce energy consumption. “Jamie explained everything as we went along so i learned a lot. Some areas of my home had no insulation at all. i also found out that even though my house was cold, the heater was actu-ally larger than needed and was wasting energy.” olanipekun-lewis chose from the menu of possible options, hired an energyWorks-approved contractor, and took out a low-interest energyWorks loan to finance the work. She is looking forward to energy savings and a warmer home this winter.
14
Phot
o b
y N
iem
an g
roup

15
energyWorks residential retrofits (140 HouSeS in PHilaDelPHia)
• 303 GHG Reduced (MT CO2e)• 361 MWh Reduced• 1,233 MMBTU Reduced (electricity Only)• 2,099 MMBTU Reduced (not including
electricity)
eCa residential retrofits (1,439 HOUSeS)• 3,117 GHG Reduced (MT CO2e)• 3,715 MWh Reduced• 12,676 MMBTU Reduced (electricity Only)• 21,577 MMBTU Reduced (not including
electricity)
phdC residential retrofits (2,198 HouSeS)• 4,760 GHG Reduced (MT CO2e)• 5,675 MWh Reduced• 19,362 MMBTU Reduced (electricity Only)• 32,957 MMBTU Reduced (not including
electricity)
pgW energysense (3,800 HOUSeS)• 8,230 GHG Reduced (MT CO2e)• 9,811 MWh Reduced• 33,474 MMBTU Reduced (electricity Only)• 56,978 MMBTU Reduced (not including
electricity)
pha (300 HOUSeS)• 650 GHG Reduced (MT CO2e)• 775 MWh Reduced• 2,643 MMBTU Reduced (electricity Only)• 4,498 MMBTU Reduced (not including
electricity)
B Y T H E N U M B E R S
i n i t i at i V e P r o G r e S S 2 0 1 2
Explore financing options to further Help residents Access Capital for retrofits
energyWorks, through its lending partners afc first and Keystone HelP, makes low-interest loans available to homeowners for residential energy efficiency retrofit projects.
neW | Promote Green and Healthy Homes
Philadelphia was selected as one of 15 sites in the Green and Healthy Homes initiative (GHHi), a partnership among the federal government, national, and local phi-lanthropy, and the national coalition to end childhood lead Poisoning. GHHi combines energy efficiency with lead abatement and indoor air-quality improvements to enhance well-being in economically challenged neighbor-hoods.
Build Energy Efficiency Guidelines/requirements into Public and low-Income Housing
Philadelphia redevelopment authority and the office of Housing and community Development encourage energy efficient design and construction through rfP process. in 2012, city will establish a single green building standard for all affordable development projects.
Expand Current low-Income Housing weatherization Efforts
funding for programs that existed when Greenworks was released in 2009 has been cut. the city is committed to supporting continued low-income weatherization work.
Expand scope of PGw’s weatherization Program and Increase size
in 2011, PGW launched energySense, a portfolio of six energy efficiency programs available to residential, commercial and industrial customers. as of March 2012, energySense has weatherized 1,800 homes and provided 160 rebates for new, high efficiency furnaces and boilers and another 100 rebates to encourage customers to buy programmable thermostats.
I n I t I a t I v e P R O G R e S S
in P
ro
Gr
eSS
co
MP
lete
D
T A R G E T 3
P R O F I L E : The Philadelphia Housing Authority Embraces Sustainability
The Philadelphia Housing Authority (PHA) provides homes to more than 80,000 peo-ple in Philadelphia. PHA acts as both a property manager and a developer on projects ranging from single-family homes to neighborhood-scale redevelopments. With such a large portfolio of buildings, PHA can create a significant impact by integrating sus-tainability into its operations. In 2012, PHA will publish its first sustainability plan to establish a comprehensive framework of goals and strategies across the agency and to formalize reporting on initiatives that are already under way.
energy efficiency and green Building at PHA
In 2008, PHA received $126 million in federal funds to support energy efficiency proj-ects. Over the past four years, PHA has completed construction on 533 new EnergyStar-rated homes and renovated an additional 300 homes to the EnergyStar standard.
In May 2012, PHA opened Norris Apartments in North Philadelphia, the first LEED-certified project in its portfolio. The new development replaces a 1950s high-rise building and features 51 units, and a pilot project that will use the park to manage stormwater from the newly constructed townhomes as well as surrounding streets. Norris Apartments is one of several new transit-oriented developments in the area, all of which are adjacent to both Temple University and the North Broad Street commercial corridor.
PHA and Drexel Partner on Healthy Homes Initiative
To improve the health and safety of its residents, PHA partnered with Drexel University to participate in the Asthma Intervention and Reduction (AIR) program funded by a U.S. Department of Housing and Urban Development Healthy Homes Demonstration Grant. The AIR program provides families with young children who suffer from asthma with indoor air quality assessments and help mitigating environmental hazards. As of March 2012, PHA and Drexel have completed 985 home visits across the city.
E N E R G Y
[ABOVE]: The Philadelphia Housing Authority’s Norris Apartments, built to the LEED Gold for Homes standard, was completed in May 2012.
[OPPOSITE PAGE]: White roofs cover the entire block of 1200 Wolf Street, winner of the 2010
Retrofit Philly Coolest Block Contest.
Phot
o b
y PH
A

16
• Greenworks baseline (2008)
2.3%alternative energy
• Current (2011)
12.2% alternative energy
• 2015 Target
20% alternative energy
M E T R I C SalTernaTiVe energy Usage inCreases To 12 perCenT
In 2011, 12.2% of the electricity used in Philadelphia was purchased or generated from alternative energy sources, up from 2.5% in 2008. About a quarter of the alter-native energy used citywide is procured by voluntary purchases of alternative energy credits. Nearly three-quarters of the alternative energy used in Philadelphia comes from alternative energy purchases made by energy suppliers under the requirements of the Pennsylvania Alternative Energy Portfolio Standard. The remaining small portion of alternative energy used in Philadelphia is from on-site generation.
green Power Purchasing
The City of Philadelphia is leading by example and purchasing 20% of its total energy usage through renewable energy credits generated by wind, making it the sixth-largest user of green power among local governments in the United States. Other institutions throughout Philadelphia—including the Academy of Natural Sciences, Drexel University, the Eagles, Kennett Restaurant, New Kensington Community Development Corp., Philadelphia University, the Philadelphia Macaroni Co., the Phillies, the University of Pennsylvania, and Yards Brewing Co.—also voluntarily pur-chase renewable energy credits to help reduce the environmental costs of generating the electricity they use.
Philadelphia residents and businesses can purchase green energy through their electric-ity providers. To see which companies offer renewable energy service to your home or business, visit www.PApowerswitch.com. Small businesses can also join Philly Buying Power, a City-endorsed program that aggregates small- and medium-size Philadelphia-area businesses to form large electricity-buying pools that can attract lower rates than businesses can find on their own. Philly Buying Power purchased over 46 million kilo-watt hours for more than 400 properties in 2012, and the businesses received 100% green energy for less than the default market price.
T A R G E T 4 : Purchase and Generate 20 Percent of Electricity Used in Philadelphia from Alternative Energy Sources
Alternative Energy Purchases and Generation in Philadelphia
0%
5%
10%
15%
20%
0
3,000,000
6,000,000
9,000,000
12,000,000
15,000,000
MW
h
Targeted Alternative Energy Used
Targeted Conventional Energy Used
Alternative Energy Used
Conventional Energy Used
Future Voluntary Alternative Energy Purchases or On-Site Generation
Additional-2015 AEPS Mandate
Philadelphia Water Department Biogas Combined Heat and Power
Additional 2012 City of Philadelphia Voluntary Alternative Energy Purchases
Philly Buying Power Purchase
2011 City of Philadelphia Alternative Energy Purchases
On Site Generation
Current Citywide Voluntary Alternative Energy Purchases
Current AEPS Mandate
Note: Coloring indicates phase: Completed, In Progress, Future
Completed In Progress Future
2008 2009 2010 2011 2015
16

16 17
E N E R G Y
solar Production
To generate as much of the electricity used in Philadelphia as possible from alternative energy sources, the City is encouraging safe, reliable, and cost-effective solar energy installations. The Alternative Energy Portfolio Standard issued by the Commonwealth of Pennsylvania in 2004 requires all electric utilities to purchase or generate 0.0203% of their electricity from solar power by 2011, and 0.5% by 2021. To contribute its pro-
portional share of the Commonwealth’s goal, Philadelphia needed to install a minimum of 2.3 MW by 2011 and 57.8 MW by 2021. As of 2012, at least 153 solar instal-lations with a total capacity of 3.8 MW are operating citywide. Philadelphia boasts the most solar installations of any county in the Commonwealth of Pennsylvania, and the city surpassed the goal of 2.3 MW by 2011.
With the help of a Solar America Cities grant from the U.S. Department of Energy, the City of Philadelphia is working to support the local solar marketplace. The City provided a clear path for contractors and residents inter-ested in installing solar by releasing the Philadelphia Solar
PV Installation Second Edition Guidebook in March 2011 and the Guidebook for Solar Water Heating Projects in Philadelphia in December 2011. With the sponsor-ship of Councilman James Kenney, City Council passed Bills 110533 and 110829 to exclude the costs of solar panels and inverters in calculating electrical and building permit fees when a photovoltaic system is installed. The updated zoning code passed in December 2011 allows solar collectors as an accessory use in all districts, and allows solar and wind energy equipment to encroach limited distances into side and rear set-back areas and through building height limits.
Despite strong support of the solar market at the local level, the statewide solar alter-native energy credit (SAEC) market is weak. SAECs represent the value of the renew-able generation, such as avoided emissions, and are sold separately from the electricity. The Pennsylvania Alternative Energy Portfolio Act of 2004 set regulations requiring electricity suppliers to purchase 18% renewable energy by 2021, with the requirements phasing in over time. Only 0.5% of energy purchased must be solar. In 2011, as the supply of solar in Pennsylvania began to far outstrip the amount suppliers are required to purchase, the price of SAECs plummeted. Without SAECs as a critical source of financing, most large solar installation projects in the state are on hold. Pennsylvania House Bill 1580 would accelerate the increase in renewable energy purchase require-ments in 2012, 2014 and 2015, and reduce the increase in required purchases in later years. The City supports House Bill 1580 as a tool to maintain Pennsylvania’s robust solar market.
50 to 80%Amount that SOLAR HOT WATER SYSTEMS can reduce water
heating bills.

10
15
5
0
20
25
30
35
40
MW
h
MAY
JUNJUL
AUGSEPT
OCT
NOV
DECJAN
FEBM
AR
2011 2012
Electricity Generated At southeast wastewater Treatment Plant
Since coMPletion
City generates Alternative energy
The City of Philadelphia is also committed to piloting renewable and alternative energy generation technologies at City sites. The Philadelphia Water Department (PWD) installed a 250-kilowatt solar array at its Southeast Wastewater Treatment Plant in May 2011. Since then, the sys-tem has produced enough electricity each month to power an average of 32 typical Pennsylvania homes. Also, in February 2012, PWD announced an agreement with Ameresco to design, build, and maintain an innova-tive wastewater biogas-to-energy facility at the Northeast Water Pollution Control Plant. The project will use biogas from the wastewater digesters to generate thermal energy and 5.6 MW of electricity for on-site use.
Neighborhood Organization Reaps Benefits of Solar
the Passyunk avenue revitalization corp. (Parc) is both a nonprofit real estate development and management company and a public space mainte-nance and enhancement organization. With the income from its properties, Parc provides supplementary pub-lic space maintenance and improve-ment services from broad Street to ninth Street, federal Street to Snyder avenue.
in January 2012, Parc began the instal-lation of eight roof-mounted photovol-taic systems on residential and com-mercial properties. the 40-kilowatt solar arrays will provide approximately 80 percent of the electricity required by seven apartments, two commercial units, and five electric vehicle char-gers. the co2 emissions reductions will be the equivalent of driving 100,000 fewer miles per year, or 18 round-trips between Philadelphia and los angeles. Parc worked with the Mark Group, a leading global provider of energy saving solutions with north american head-quarters in the Philadelphia navy yard, to finance the project.
In 2011, Arthur Ashe Youth Tennis and Education installed 1,200 solar photovoltaic panels at their location in East Falls. They expect to save 50% on electricity costs in 2012.
18

T A R G E T 4
250 KW solar array installed at se pollution Control plant
• 164 GHG Reduced (MT CO2e)• 309 Renewable MWh Generated
Citywide on-site generation• 2,651 GHG Reduced (MT CO2e)• 4,993 Renewable MWh Generated
renewable energy Credits (City of philadelphia) – 19,500 MWh
• 10,353 GHG Reduced (MT CO2e)• 19,500 Renewable MWh Generated
renewable energy Credits (rest of City) – 441,123 MWh
• 236,861 GHG Reduced (MT CO2e)• 446,116 Renewable MWh Generated
B Y T H E N U M B E R S
i n i t i at i V e P r o G r e S S 2 0 1 2
neW | Purchase Alternative Energy Credits for at least 20 Percent of Municipal Electricity Use
the city has voluntary purchased wind renewable energy certifi-cates covering 20 percent of its energy use through the end of 2013. By meeting Greenworks target 4 internally, the municipal government is setting an example for the rest of the city.
recycle Deicing fluid Philadelphia international airport sends deicing fluid directly to anaerobic digesters at the Philadelphia Water Department’s Southeast Water Pollution control plant. Program reduces aviation operating expenses, generates revenue for PWD, and produces useful biogenic methane.
report solar financing options
Solar financing information included in both Solar Photovoltaic Guidebook and Guidebook for Solar Water Heating.
write a Guide for solar Development
Solar Photovoltaic Guidebook updated in March 2011. Guidebook for Solar Water Heating Projects in Philadelphia released December 2011.
neW | support Passage of state House Bill 1580 to revitalize sAEC Market
Pennsylvania House bill 1580 would accelerate the increase in renewable energy purchase requirements for utilities in 2012, 2014, and 2015, and reduce the increase in required purchases in later years. the city supports House bill 1580 as a tool to maintain Pennsylvania’s robust solar market.
Create Biogas Cogeneration facility at Northeast wastewater Treatment Plant
construction of cogeneration facility at northeast treatment plant is under way. Upon completion in 2013, the project will provide 85% of the facility’s electricity needs from biogas (a renewable source).
Explore Vertical Axis wind Turbines
Zoning code passed in December 2011 allows small wind ener-gy systems as an accessory use in all districts and allows wind energy equipment to encroach limited distances above building height limits.
Install Geothermal system at sewer Maintenance facility
the new West Philadelphia Maintenance facility design is complete and includes a geothermal heat exchange system. construction contingent on funding.
reduce regulatory Barriers to solar Installation
Zoning code passed in December 2011 eases the permit process for large-scale solar installations. in June 2011 bill 110533, and in november 2011 Bill 110829, both sponsored by councilman Kenney, which exclude the costs of solar panels and inverters in calculating electrical permit and building permit fees, passed.
neW | Educate Energy Purchases on Benefits of local Alternative Energy Credits
Supporting local renewable energy has several ancillary ben-efits, such as creating local jobs, reducing air pollution in the region, and decreasing electricity costs through reduced capacity charges in the Peco zone. local renewable energy can also put vacant land back to work and serve to educate Philadelphians about renewable energy. the more local our residents’ and businesses’ renewable energy purchases are, the more the benefits accrue directly to the community.
neW | Join EPA Green Power Communities Program
Building on successful efforts in more than 30 cities and towns across the country Philadelphia will become the largest u.S. city to pursue designation as an ePa Green Power community. Green Power communities are towns and cities that meet or exceed ePA’s program requirements for purchasing green power. through this designation, the city of Philadelphia, local Green Power Partners, and green power providers will embark on a campaign to dramatically increase voluntary use of renew-able energy within Philadelphia.
Develop solar land Use Plan future initiative.
Explore ways to Capture water at fairmount Park and flat rock Dams
new design of flat rock Dam is underway and includes space to accommodate a potential hydroelectric project.
Promote renewable Power Purchase Agreements for Public Buildings
City issued RFP in May 2011 for 3MW solar Power Purchase agreement (PPa) at baxter Water treatment facility but received no proposals responsive to the rfP due to declining market values of Pennsylvania solar alternative energy credits (Saec). PPa projects on hold due to decline in Saec market.
I n I t I a t I v e P R O G R e S S
in P
ro
Gr
eSS
co
MP
lete
Dfu
tur
e
PWD’s Southeast Wastewater Treatment Plant solar array.
19
E N E R G Y
Phot
o b
y m
oS

E N V I R O N M E N TGoAl: PHILADELPHIA REDUCES ITS ENVIRONMENTAL FOOTPRINT
T A R G E T 5 : Reduce Greenhouse Gas Emissions by 20 Percent
UpdaTing greenhoUse gas eMission baselines
As the global population becomes increas-ingly urban, cities and local governments have emerged as leaders in the effort to reduce greenhouse gas (GHG) emissions. More than half of the world’s popula-tion lives in cities, and in 2012 82% of Americans lived in or close to an urban center. Not surprisingly, 70% of global GHG emissions can be attributed to cities. Philadelphia has made some progress in reducing GHG emissions since Greenworks was released in 2009, especially within municipal government, but the increased energy use outlined in Target 2 challenges mitigation efforts.
As more cities strive to reduce their carbon footprints, the tools and methods used to measure GHG emissions continue to evolve. The Kyoto Protocol baseline year of 1990, which Greenworks shares, is an imperfect benchmark. Because much of the data used in current GHG protocols must be estimated for dates so far in the past, regular updates to past inventories are necessary for GHG tracking and reporting to reflect progress accu-rately. With this report, Greenworks is using improved data to adjust previously reported 1990 and 2006 inventories for municipal government and citywide emissions, as well as establish new benchmarks for 2010.
20
• 1990 Baseline
587,899 t co2e
• 2006 Baseline
554,842 t co2e
• Current (2010)
524,865 t co2e
• 2015 Target
470,319 t co2e
M E T R I C SMunicipal
• Adjusted Greenworks baseline (1990)
21.21 Million t co2e
• 2006 Baseline
23.22 Million t co2e
• Current (2010)
22.37 Million t co2e
• Adjusted 2015 Target
19.09 Million t co2e
Citywide
GHG Emissions t Co2e per Capita 20100
5
10
15
20
0
5
10
15
20
New
Yo
rk
Los
Ang
eles
Bo
sto
n
Chi
cag
o
Phi
lad
elp
hia
Ho
usto
n
Was
hing
ton
DC
6.5
9.6
12.013.0
14.715.5
18.1United States Average
19.0
Phot
o b
y m
oS

21
E N V I R O N M E N T
City government reduces emissions by 11% while Citywide emissions Increase
Municipal GHG emissions decreased by 11% between 1990 and 2010, with more than half of this reduction coming between 2006 and 2010. Citywide, GHG emis-sions have increased 5.4% since 1990. This number is well below the national increase of 10% for the same period, and citywide emissions have decreased 3.7% since 2006. Philadelphia saw the warmest summer and the snowiest winter on record in 2010, both of which drove unusually high energy use. Despite these extremes, municipal gov-ernment registered a 6% decrease in GHG emissions between 2006 and 2010.
How Greenworks targets Contribute to gHg emissions reductions
Nearly all of the sustainability work described in Greenworks helps reduce GHG emis-sions. Reducing building energy and vehicle fuel use are the biggest contributors, though improved transit and bicycle access, enhanced waste diversion, and increased tree planting and open space efforts also play an important role.
GHG Emissions by sector
(cityWiDe)
Buildings
Transportation
Street Lights
Fugitive
7.8%
.4%
5.2%
17.7%
6.8%
Industrial
Waste
Wastewater Treatment
61.9%
.2%
10%
19%8%
14%
30%19%
Buildings
Street Lighting
Vehicle Fleet
Water Treatment
Wastewater Treatment
Airport
GHG Emissions by source
(MuniciPal)
Municipal Emissions 2010
Co2e: Carbon dioxide equivalent, or Co2e, is the internationally recognized measure of greenhouse gas emissions. each greenhouse gas (GHG) has a different capacity to impact the climate. Co2e is the amount of Co2 that would create the
equivalent climate impact of a given volume of any greenhouse gas. Using Co2e as a measure of GHG emissions allows the comparison of the climate impact of a variety of emissions sources.
scope: scope 1 includes all direct GHG emissions. scope 2 includes indirect GHG emissions from consumption of purchased electricity, heat, or steam. scope 3 includes other indirect emissions, such as the extraction and production
of purchased materials and fuels, transport-related activities in vehicles not owned or controlled by the reporting entity, outsourced activities, waste disposal, etc.
TyPE SCoPE amouNT uNIT tCo2e
Buildingselectricity 2 218,133,018 kWh 112,684natural Gas 1 701,572 Mcf 38,014Fuel Oil 1 206,337 gal 2,119Steam 2 97,843 Mlbs 5,417
street lightingelectricity 2 78,518,462 kWh 40,561
water Treatmentelectricity 2 136,797,860 kWh 70,667natural Gas 1 36,384 Mcf 1,960Fuel Oil 2 264 gal 3
water Treatmentelectricity 2 130,106,273 kWh 67,211natural Gas 1 14,325 Mcf 782fuel oil 1 598 gal 6Process emissions-cH4 1 3,403Process emissions-n20 1 26,574
Airport facilitieselectricity 2 171,567,278 kWh 88,629natural Gas 1 135,16 Mcf 13,516
Vehicle fleetGasoline 1 3,389,889 gal 30,154Diesel 1 880,589 gal 9,009Diesel (biodiesel blend) 1 1,455,572 gal 14,141Zipcar 1 45,519 VMt 16
Total 524,865
Buildings account for 61.9% of citywide green-house gas emissions and 30% of municipal greenhouse gas emissions in Philadelphia.
Phot
o b
y m
oS

T A R G E T 5
22
i n i t i at i V e P r o G r e S S 2 0 1 2
Conduct Greenhouse Gas Inventory for Philadelphia International Airport
inventory completed in 2009. Monitoring continues.
neW | Annually report GHG emissions and climate adap-tation/mitigation strategies through Carbon Disclosure Project
in 2012, the Mayor’s office of Sustainability (MoS) participated in the carbon Disclosure Project for the second year in a row.
neW | Conduct Community Greenhouse Gas Inventory Every Two Years
MoS worked with the Philadelphia city Planning commission, air Management Services, and the Delaware Valley regional Planning commission to update the citywide greenhouse gas inventory which will be published in 2012.
Advocate for federal Climate Action
Philadelphia continues to engage in national policymaking efforts via Mayor nutter’s service on the Department of energy advisory committee and as President of the u.S. conference of Mayors beginning in summer 2012.
Maintain Greenhouse Gas Emissions Inventory for Municipal Government
MoS completed an update to the municipal government green-house gas inventory in 2012. MoS will update this inventory annually.
I n I t I a t I v e P R O G R e S S
in P
ro
Gr
eSS
co
MP
lete
D
Understanding Greenhouse Gas Emissions
Greenhouse gases trap heat in the atmosphere, altering the balance of the global climate. While GHGs occur naturally, a steep, man-made increase in GHG levels—from 280 to 370 parts per million—has been observed over the past century. the three primary GHGs are car-bon dioxide (co2), emitted from burning fossil fuels such as oil and coal; methane (cH4), emitted from landfills and the use of natural gas; and nitrous oxide (n2o), emitted by agricultural processes, livestock, and fossil fuel use. co2 makes up 85% of GHG emissions, though cH4 and n20 both have a significantly higher potential to cause global warming.
Many Greenworks initiatives, such as improving bicycle parking to promote active commuting,
help reduce greenhouse gas emissions.
Citywide Emissions 2010
SCoPE amouNT uNIT tCo2e
Buildings and stationary Energy Useelectricity-Residential 2 4,071,170,786 kWh 2,103,098electricity-Commercial and industrial 2 9,736,788,848 kWh 5,029,862natural Gas-Residential 1 35,879,719 Mcf 1,959,149natural Gas-Commercial and industrial 1 37,910,453 Mcf 2,067,768on Site combustion-residential 1 varies 276,092combustion-commercial and industrial 1 varies 2,141,822Steam loop 1 288,957
TransportationOn-Road Vehicles 1 5,517,486,000 VMT 3,203,748Public transit-electric trains and trolleys 2 791,666,549 kWh 408,962Off-Road Vehicles 1 342,692
streetlights and Traffic signalselectricity 2 78,518,462 kWh 40,561
fugitive EmissionsHfcs & refrigerants 1 varies 669,889natural Gas-losses 1 n/a 495,584
Industrial Processesindustrial Processes-non itemized 1 varies 1,514,290
land UseLand Use 1 n/A -11,394
wasteWaste emissions 3 n/A 1,738,116
wastewater Treatmentelectricity 2 130,106,273 kWh 67,211natural Gas 1 14,325 Mcf 782fuel oil 1 598 gal 6Process emissions-cH4 1 3,403Process emissions-n20 1 26,574
Total 22,367,170

T A R G E T 6 : Improve Air Quality Toward Attainment of Federal Standards
23
E N V I R O N M E N T
• Greenworks baseline (2008)
20 unhealthy aQi Days
• Current (2011)
17 unhealthy aQi Days
• 2015 Target
10 unhealthy aQi Days
M E T R I C Sphiladelphia has FeWer air QUaliTy index UnhealThy days
In 2008, according to the U.S. Environmental Protection Agency’s (EPA) Air Quality Index (AQI), Philadelphia’s air quality was unhealthy on 20 days. In 2011, Philadelphia’s air quality was unhealthy on 17 days. The AQI is a local, daily measure of how clean or unhealthy the air is and what associated health effects might be a con-cern. The EPA calculates AQI for four major air pollutants regulated by the Clean Air Act: ground level ozone, particle pollution, carbon monoxide, and sulfur dioxide. On unhealthy days, residents—especially people with heart or lung disease, children, older adults, and people who are active outdoors—may experience health effects from air pollutants.
Elevated levels of ozone caused the majority of unhealthy days in Philadelphia in 2011, while elevated levels of fine particulate matter caused the remainder. Common sources of fine particulate matter include motor vehicles, power plants, and other com-bustion processes. Exposure to particle pollution may exacerbate existing heart disease symptoms, increase susceptibility to respiratory infections, and aggravate chronic lung diseases including asthma.
Ground-level ozone forms when emissions from sources including cars, power plants, and refineries react chemically in sunlight. Because ground-level ozone requires sun to form, it is more common during warm weather. Ozone can irritate the respiratory system, reduce lung function, make lungs more susceptible to infection, and aggravate asthma and other chronic lung diseases. Although weather patterns beyond the control of regulators are the single largest influence on the number of unhealthy AQI days per year in Philadelphia, the City continues to lead by example with innovative approaches to reducing air pollution emissions.
Air quality in Philadelphia has visibly improved over the last fifty years as seen
from South Broad Street in 1962 and 2011.
Phot
o b
y PD
PH

24
reducing emissions from Vehicles
In 2010 and 2011, the City of Philadelphia installed new parking kiosks on major commercial corridors. The kiosks allow the Philadelphia Parking Authority to set different prices for parking depending on the day of the week and time of day. The selected prices and time limits aim to maintain approximately 80 percent parking occupancy, which reduces circling by vehicles searching for parking and in turn reduc-es congestion and emissions from automobiles.
In 2011, the Streets Department re-timed traffic signals on five major corridors to optimize traffic flow, and as of spring 2012 re-timing of a total of 10 corridors is com-plete or under way. In 2012, the City announced it will create a Traffics Operations Center where Streets Department engineers will monitor many of the City’s key travel corridors and modify traffic signal timing to respond to real-time traffic conditions. Fiber-optic cable wired to 800 traffic signals will send information to operators who can adjust signal timing in response. The City will also install 50 new traffic cameras at key intersections to provide information to the center. Reducing traffic congestion will help lower pollution emissions from vehicles.
In 2011, SEPTA purchased another 100 hybrid-electric buses, bringing its total to 472 —approximately one-third of its entire bus fleet. These hybrid-electric buses are up to 40 percent more fuel efficient than their standard diesel counterpart and emit signifi-cantly less particulate matter and nitrogen oxides. SEPTA is also retrofitting its diesel vehicles with LED lighting and electric engine cooling systems to achieve additional reductions in fuel consumption by removing parasitic loads from diesel engines. In fall 2011, SEPTA received a total of $20 million from the Federal Transit Administration’s State of Good Repair and Clean Fuels programs to extend its investment in hybrid buses through 2013.
Clean Energy Fuels Corp. is planning to install a compressed natural gas (CNG) fuel-ing station at the Philadelphia International Airport on property owned by Wallypark, a parking shuttle operator. The station will be open to the public and provide CNG fueling services to airport shuttle vehicles, CNG taxis, and the Wallypark fleet.
SEPTA’s bus fleet emissions dropped dramatically as the age of the bus fleet
decreased and the percentage of hybrid buses increased.
sEPTA Bus fleet Emissions
0%
20%
40%
60%
80%
100%
0
20
40
60
80
100
120
19992000
20012002
20032004
20052006
20072008
20092010
2011
JULY
Nitrous Oxide (NOx)
Particulate Matter (PM)

T A R G E T 6
25
purchase biodiesel for Use in City Fleet• 441 GHG Reduced (MT CO2e)
purchase hybrid buses (sepTa purchased 472)
• 12,798 GHG Reduced (MT CO2e)• 173,046 MMBTU Reduced
(not including electricity)
B Y T H E N U M B E R S
Bicycle infrastructure supports alternative transportation which reduces vehicle use
and the resultant air pollution.
i n i t i at i V e P r o G r e S S 2 0 1 2
Develop Green Ports Plan in 2010 the Delaware river Port authority completed the Green Ports initiative report, which establishes energy efficiency, environ-mental management, procurement, waste, and water recommen-dations and metrics for the agency.
Purchase Hybrid Diesel Buses
in addition to the 472 hybrid-electric buses already in its fleet, SePta has committed to purchasing another 160 hybrids in 2012 and 2013 to replace aging 40- and 60-foot diesel buses.
Airport Green Plan Philadelphia international airport (PHl) launched its Green Plan in 2010. in 2011 PHl completed an organic Waste Pilot Program that determined an airport-wide composting program is feasible.
Congestion reduction in 2011, traffic signals on five major corridors were re-timed to optimize traffic flow, and a total of 10 corridors are complete or currently underway.
facilitate Use of Electric Vehicles
Mayor’s office of Sustainability received $140,000 grant from Pa Department of environmental Protection to install 20 electric vehi-cle chargers as part of an early adoption program. PhillycarShare fleet vehicles use 18 of these chargers, and two are available for public use. MoS is working with licenses & inspections to create an eV permitting guide.
Increase Parking options for Bicycles and Motor scooters
The City is in the process of installing 350 new bike racks in 2012. the Philadelphia Parking authority established new parking zones to accommodate motorcycles and scooters in the area between arch and locust, and broad and the Schuylkill river.
Increase the City fleet’s Gas Mileage
70% of Police fleet replaced with better MPG vehicles between 2009 and 2010. Vehicle replacements slowed due to budget con-straints.
Increase the Number of Hybrid or Compressed Natural Gas Taxis
Major medallion owners continue to add alternative fuel vehicles to their fleets.
Increase the Use of Biodiesel fuel in the City fleet
all diesel vehicles in city fleet are currently running on biodiesel. Office of Fleet Management purchased 2,837,564 gallons of biod-iesel fuel in 2011.
retrofit Diesel Vehicles Office of Fleet Management replaced filters on 434 diesel vehicles.
Consider the creation of demand pricing schemes for Parking
future initiative.
Develop a Compressed Natural Gas facility
clean energy fuels corp. is planning to install a compressed natural Gas (cnG) fueling station at Philadelphia international airport on property owned by Wallypark. the station will be open to the public and provide cnG fueling services to airport shuttle vehicles, cnG taxis, and the Wallypark fleet.
I n I t I a t I v e P R O G R e S S
in P
ro
Gr
eSS
co
MP
lete
Dfu
tur
e
Philly Car Share Adds Electric Vehicles to Fleet
in 2012, Philly car Share added 18 chevrolet Volts to its fleet. The electric vehicles, which average 100 miles per gallon equiva-lent and produce zero tailpipe emissions, are available for use by Philly car Share members. the vehicles are located at nine sites around Philadelphia, where a grant awarded to the city of Philadelphia by the Pennsylvania Department of environmental Protection funded the installation of electric vehicle chargers.

diVersion oF solid WasTe FroM landFill inCreases
In 2008, approximately 37% of Philadelphia’s solid waste was recycled, and another 16% was used to produce energy, totaling 53% of solid waste diverted from landfill. In 2010, approximately 46% of Philadelphia’s solid waste was recycled, and another 26% was used to produce energy. The 72% total rate of solid waste diversion from landfill exceeds the Greenworks goal of 70% diversion. Between 2008 and 2010, the volume of curbside recycling collected by the City increased more than 75%. In May 2012, City Council proposed legislation to allow the Philadelphia Streets Department to enter into a solid-waste contract that will divert nearly 100% of residential municipal solid waste from landfills beginning in 2014.
City expands recycling services
In 2011 and 2012, the City took numerous steps to expand residential recycling ser-vices. In December 2011, the City’s curbside recycling program began accepting liquid food and beverage carton packages such as milk, juice, soup, and broth cartons. In spring 2012, more than 185,000 households were enrolled in Philadelphia Recycling Rewards, representing a 45% increase in enrollment over one year.
In November 2011, the Streets Department launched a pilot foam #6 recycling pro-gram. All Philadelphia residents and businesses can now recycle foam materials, com-monly called Styrofoam, by taking them to the Northeast Drop-Off Center. Materials that can now be recycled include cups, food service containers, plates, egg cartons, and large molded blocks used to package electronics.
In April 2012, the Philadelphia Streets Department and Philadelphia Parks & Recreation (PPR) launched a pilot program that expands recycling to outdoor spaces throughout PPR properties in Northwest Philadelphia. Each outdoor trash can at six recreation centers and three parks now has an adjacent recycling bin. The Streets Department and PPR aim to expand the program to other parks and recreation cen-ters in the next several years.
T A R G E T 7 : Divert 70 Percent of Solid Waste From Landfill
26
• Greenworks baseline (2008)
53% Waste Diverted from landfill
• Current (2010)
72% Waste Diverted from landfill
• 2015 Target
70% Waste Diverted from landfill
M E T R I C S
3.4%
Organics
C&D
Paper
Other Wastes
Plastic
Metal
Glass
34.%
24%
14.7%
11%10.1%
2%
The City provides weekly single stream recycling collection in all neighborhoods of Philadelphia
Philadelphia waste Composition
2010

E N V I R O N M E N T
special event Waste Management
In 2011, the Mayor’s Office of Sustainability and the Mayor’s Office of Civic Engagement launched Waste Watchers, a volunteer program that partners with public events such as races, concerts, parades, and festivals to help them send less waste to landfills. At the Philadelphia Marathon in November 2011, the Waste Watchers inaugural event, hundreds of enthusiastic volunteers helped event-goers sort their recycling, compost, and trash into the proper con-tainers, and even helped the runners recycle their heat sheets.
Food Waste Diversion Pilot
In May 2012, the City launched a pilot program called “Clean Kitchen, Green Community” to assess how food waste disposers can help the City reach its sustainability goals. In addition to a citywide campaign about the benefits of using a food waste dis-poser, residents along garbage collection routes in West Oak Lane and Point Breeze will participate in a targeted installation and education initiative to examine how much food waste can be diverted from landfills by using a disposer. The Streets Department will assess the volume and composition of waste generated before, during, and after the pilot, evaluating reductions and changes that result from the targeted installation campaign.
City responsibly Disposes of e-Waste
On Earth Day 2012, the City of Philadelphia partnered with the General Services Administration (GSA) to recycle thousands of pieces of electronic equipment. Participating agencies included the Office of Innovation and Technology, Department of Public Property, Procurement, Revenue, Finance, Department of Human Services, Licenses & Inspections, and Department of Health. Collectively, the agencies disposed of approximately four tractor trailer loads of e-cycling. The initiative was part of a state program facilitated by GSA, which ensured that environmentally and fiscally sound practices were used to dispose of the equipment.
Revolution Recovery’s Construction & Demolition Recycling Business Booms
revolution recovery provides a complete range of recycling ser-vices and Dumpster rentals to construction, manufacturing, com-mercial, and residential customers. their mission is to keep materi-als out of landfills while providing sustainable services at a cost less than traditional landfill disposal.
founded in Philadelphia in 2004, revolution recovery has grown from a small start-up business without a client or a truck into a robust company employing more than 50 people at two locations. Serving greater Philadelphia and northern Delaware, the two facili-ties process more than 300 tons of wood, drywall, metal, rubble, cardboard, plastics, ceiling tile, mixed paper, carpet, and other materials each day.
in 2005, revolution recovery received the first General Permit in the commonwealth of Pennsylvania to beneficially use spent dry-wall as a soil amendment. two years later, they received the first General Permit in the commonwealth for a facility specifically designed to recycle construction and demolition materials.
“With its Greenworks goal to be the greenest city in america, Philadelphia is the perfect place for a business like ours,” said fern Gookin, Director of Sustainability for revolution recovery. “to stay competitive and be true to our mission and our customers, we need to be at the forefront of new technology, and to be in a place where recycling is valued as a busi-ness model.”
Waste Watcher volunteers at the 2011 Philadelphia Marathon helped racers and spectators sort their waste into compost, recycling, and refuse.
27

T A R G E T 7
28
City Collected Curbside recycling(90,475 tonS)
• 207,245 GHG Reduced (MT CO2e)• 54,285 Waste Diverted from
landfills (tons)
privately Collected recycling(90,120 tonS)
• 206,432 GHG Reduced (MT CO2e)• 54,072 Waste Diverted from
landfills (tons)
electronic Waste recycling(204 tonS)
• 470 GHG Reduced (MT CO2e)• 204 Waste Diverted from
landfills (tons)
C&d recycling(1,185,555 tonS)
• 796,844 GHG Reduced (MT CO2e)• 1,126,277 Waste Diverted from
landfills (tons)
B Y T H E N U M B E R S
i n i t i at i V e P r o G r e S S 2 0 1 2
Develop an Incentive-based recycling Plan
as of spring 2012, recycling rewards has more than 185,000 households enrolled.
Expand Plastics recycling city expanded to plastics #1-7 in august 2010. in 2011, the city began accepting food and beverage cartons curbside and #6 sty-rofoam plastic at the northeast Sanitation convenience center.
Anti littering Campaign Streets Department launched unlitter us campaign in 2010. fifth annual Philly Spring clean up in april 2012 removed more than 1 million pounds of trash and 40,340 pounds of recycling.
Construction and Demolition (C&D) waste Management Program
c&D recycling market continues to expand in Philadelphia. 1,185,555 tons of c&D recycling were collected citywide in 2010.
Continue Event recycling Mayor’s office of Sustainability established Waste Watchers volunteer program to sort trash, recycling, and compost at large events. Program piloted at 2011 Philadelphia Marathon.
Continue/Expand Public space recycling
city installed 110 additional big belly solar compactors outfitted with recycling kiosks in 2011, for a total of 420 public bins.
Enhance Electronic recycling
the city accepts residential e-waste at its three convenience Centers. 138 tons of e-waste collected in 2011. in April 2012, the city partnered with the General Services administration to e-cycle thousands of pieces of electronic equipment. in 2012, City awarded e-waste contract for responsible recycling and disposal of electronic equipment.
Expand recycling at Transit stations
SePta has implemented a comprehensive source-separated, sin-gle-stream recycling program at broad Street, Market–frankford, and trolley line stations as well as center city regional rail sta-tions. roll-out at additional locations is planned for 2012 and 2013.
Include sustainability Criteria in solid waste Contracts
Spring 2012 solid waste contract will divert nearly 100% of resi-dential municipal solid waste from landfills beginning in 2014.
Increase oversight of recycling in Commercial Buildings
SWeeP officers continue to enforce commercial recycling regulations.
Increase recycling at City facilities
in april 2012, the Streets Department and Parks & recreation launched a pilot program that expands recycling to outdoor spaces throughout park and recreation facilities in northwest Philadelphia.
Place more public records, plans and documents online
in 2011, 50% of the submissions received by the records Department were recorded electronically, and 87% of employees filed financial disclosure Statements electronically.
Promote Composting Waste Watchers program introduced composting at large events. fairmount Park continues to compost leaves. city encouraging backyard and small-scale neighborhood composting.
study Energy-from-waste Alternatives
Philadelphia Water Department exploring feasibility of food waste digesters at wastewater treatment plants.
Institute sustainable Procurement Policy
future initiative.
I n I t I a t I v e P R O G R e S S
in P
ro
Gr
eSS
futu
re
co
MP
lete
D
[TOP]: The City has installed 880 Big Belly solar trash compactors and 420 attached
recyclers.
[BOTTOM]: Philadelphia-based companies process construction and demolition waste,
which makes up a quarter of the city’s refuse stream, for recycling and reuse.

E Q U I T YGoAl: PHILADELPHIA DELIVERS MORE EQUITABLE ACCESS TO HEALTHY NEIGHBORHOODS
T A R G E T 8 : Manage Stormwater to Meet Federal Standards
29
green inFrasTrUCTUre Manages sTorMWaTer
Since 2008, the Philadelphia Water Department (PWD) has been building green stormwater infrastructure demonstration projects that signal a new approach to managing stormwater in Philadelphia. In that time, PWD has constructed 27 dem-onstration projects and 32 green street blocks city-wide. PWD will start construction on approximately 215 green street blocks in 2012. PWD aims to add 9,564 greened acres in Philadelphia over the next 25 years, 744 of those during the next five years.
Green City, Clean Waters Approved by DeP and ePA
On April 10, 2012, the City of Philadelphia signed the Green City, Clean Waters Partnership Agreement with the U.S. Environmental Protection Agency (EPA). The historic agreement recognizes PWD’s innovative approach to using green stormwater infrastructure to reduce pollution from combined sewer overflows and establishes a unique federal–municipal partnership to oversee and implement the Green City, Clean Waters plan. Green stormwater infrastructure intercepts rain water at the source, retaining and allowing it to flow into the ground, where soil and plants recycle it back to the atmosphere. Without green stormwater infrastructure, rain water drains into sewers and causes overflows that pollute Philadelphia’s waterways. Green City, Clean Waters and the agreement between the EPA and City of Philadelphia will serve
as a national model for cities embracing green stormwater infrastructure to control urban wet weather pollution.
The City of Philadelphia’s agreement with EPA, along with the Consent Order and Agreement signed with the Pennsylvania Department of Environmental Protection on June 1, 2011, will allow Philadelphia to make a broad multi-decade investment of nearly $2 billion in green stormwater management practices that reduce sewer overflows to Philadelphia’s waterways, while enhancing communities and the overall urban environment. These wise investments in stormwater management
tools will avoid the higher cost of constructing additional traditional infrastructure to manage stormwater and reduce combined sewer overflows while also providing ben-efits to residents and neighborhoods not only when it rains, but every day of the year.
To align the Greenworks goal of managing stormwater with the Green City, Clean Waters plan, Greenworks will measure Philadelphia’s progress toward managing stormwater to comply with the Clean Water Act by tracking greened acres created instead of pervious acres. To be on track to meet the PWD goal of creating 744 greened acres during the first five years of Green City, Clean Waters implementation, Greenworks aims to add 450 greened acres by 2015.
• Adjusted Greenworks baseline (2011)
0 new Greened acres
• Current (2012)
13.9 new Greened acres
• 2015 Target
450 new Greened acres
M E T R I C S
What is a “Greened Acre”?
the Philadelphia Water Department (PWD) is measuring stormwater management progress by the num-ber of greened acres created. each greened acre represents an acre within the combined sewer system, or parts of the city where the same pipes collect sewage and stormwa-ter, served by stormwater infrastruc-ture that manages at least the first inch of runoff. the area counted as greened includes both the area of the stormwater management fea-ture itself and the area that drains to it. in Philadelphia, an acre receives an average of 1 million gallons of rainfall each year. today, if the land is impervious, all 1 million gallons run off into the sewer and become pol-luted. a greened acre will prevent 80 to 90 percent of this pollution.
1 Acre
Greened Acres
Green Stormwater Infrastructure

green Infrastructure in a Neighborhood Near You
New green infrastructure projects around Philadelphia include Madison Memorial Park in Northern Liberties, where an infiltration bed manages runoff from the park as well as an adjacent street; stormwater bump-outs on Queen Lane in East Falls, which divert runoff from the street into landscaped curb extensions where stormwater infiltrates into the soil instead of entering storm sewers; and rain gardens installed in an underutilized parking lot in Bridesburg that reduce the amount of impervious coverage in the parking lot while also managing runoff from the remaining impervious areas. These projects are examples of the types of projects that PWD will install over the next 25 years as it imple-ments Green City, Clean Waters.
PWD offers stormwater Management Incentives
The Philadelphia Water Department is offering incentives for both residential and commercial customers to manage stormwater where it falls. In partnership with the Philadelphia Industrial Development Corporation (PIDC), PWD created the Stormwater Management Incentives Program (SMIP), which offers both grants and loans to non-residential PWD customers to stimulate their investment in and utilization of stormwater
best management practices. PWD is also running Rain Check, a pilot program in select neighborhoods, in which PWD and homeowners share the cost of special residential land-scape improvements that help man-age stormwater runoff and beautify homes. Rain Check participants can install rain gardens, downspout planters, yard trees, or porous pavers at a fraction of the full cost.
Philadelphia Home to roofmeadow, National green roof Leader
In 1997, Charlie Miller, a geolo-gist and civil engineer, founded Roofmeadow in the Mount Airy neighborhood of Philadelphia. Miller single-handedly built Roofmeadow’s first green roof on the Philadelphia Fencing Academy in 1998 and, during rainstorms, monitored its stormwater performance. Data from that project are still widely quoted today. Two years later, he engineered the landmark Chicago City Hall green roof design and oversaw its construction. Today, Roofmeadow
boasts seven additional employees and manages an elite national network of licensed green roof contractors that have built nearly 160 green roofs totaling almost 2 million square feet.
Roofmeadow’s best business development opportunities have been historically concentrated in cities with progressive stormwater policies. In the early years of Roofmeadow’s existence, much of its work was away from home, but the imple-mentation of PWD’s 2006 stormwater regulations changed everything. The 2007 Green Roof Tax Credit, the 2011 parcel-based stormwater fee, and the adoption of the Green City, Clean Waters plan further accelerated interest in green infrastructure in Philadelphia. Roofmeadow has installed 27 green roofs in Philadelphia and has another 15 local green roofs in design.
Because Philadelphia has become a hub of green infrastructure, Roofmeadow now hap-pily focuses much of its attention on its hometown and has engaged three independent representatives to help foster growth in green roof markets in the rest of the country.
stormwater Tree Trench
Rainfall
Stormwater Runoff
Evapotranspiration
Infiltration
NEW TREES
STORMWATER INLET
DISTRIBUTION PIPE
STONE BEDIMPERMEABLE LINER
Stormwater is distributed through Tree Trench, then slow
released into existing storm sewer, if necessary
Uptake By Roots
NEW TREES
Street View
NEW STORMWATER INLET
[ABOVE]: Left to right: PWD Commissioner Howard Neukrug, Mayor Michael Nutter, Congresswoman Allyson Schwartz, EPA Administrator Lisa Jackson,
Deputy Mayor Rina Cutler, and EPA Region III Administrator Shawn Garvin sign the Green City,
Clean waters Partnership Agreement in April 2012.
[OPPOSITE PAGE]: Roofmeadow employees install a green roof on the bus shelter at 15th and Market.
30
Phot
o b
y M
itch
ell L
eff
Dia
gra
m C
ourt
esy
of P
hila
del
phi
a W
ater
Dep
artm
ent
Volunteers with Rebuilding Together Philadelphia and residents in Mantua
install a flow-through planter.
Phot
o b
y M
os

T A R G E T 8
i n i t i at i V e P r o G r e S S 2 0 1 2
Develop sustainable stormwater Management Plan
the Green City, Clean Waters plan was formally accepted by PaDeP in June 2011 and the u.S. environmental Protection agency in april 2012. PWD has 25 years to implement the plan, which is the first green infrastructure cSo control plan in the country.
neW | offer Incentives to Property owners who Build Green stormwater Infrastructure
non-residential PWD customers, business improvement Districts, neighborhood improvement Districts, and Special Services Districts are eligible for the Stormwater Management incentives Program, which offers both grant and loan incentives. residents in pilot neighborhoods are eligible for PWD’s rain check program, which shares costs of special residential landscape improvements that help manage stormwater runoff and beautify homes.
Create new tidal/non-tidal wetlands along Delaware and schuylkill rivers
construction was completed on the Wises Mill and cathedral run wetlands in 2012. PWD has initiated monitoring of these two stormwater management facilities to assure long-term functionality.
Control Pollution and Trash on the rivers PWD continues to aggressively skim trash and remove heavy debris from waterways. PWD removed 34.7 tons of trash from the Lower Schuylkill and Delaware rivers in 2011 and 2012.
Create Green streets PWD continued to advance green street projects that were part of the $30 million funding approved in 2010. Construction of Phases 1 and 2 is complete; Phase 3 is under construction; and design of Phases 4 and 5 is complete. in total this will result in more than 200 blocks of green streets. PWD, the Streets Department, and Philadelphia Parks & recreation collaborated on the design of several green street projects and the development of the Green Streets Design Manual, which will be complete in 2013.
Expand the rain Barrel Programs Since last year, approximately 480 rain barrels have been distributed by PWD, bringing the current total to 2,200 rain barrels distributed through the free rain barrel program.
Green surface Parking lots As of spring 2012, PWD has approved 135 porous pavement projects, totaling 59.4 acres.
Implement New stormwater fees & Credits PWD customers are currently halfway through the transition to parcel-based billing, and 75% parcel-based fees will take effect July 2012. in response to the recently convened customer advisory council, PWD has launched a 10% cap program for impacted customers and is offering loans and grants for stormwater projects.
Improve stormwater Management at City Airport facilities
construction has begun on the PHl terminal f baggage claim improvements project, which will incorporate three bioretention facilities, as well as a green roof and porous pavement. in 2012, PWD, Division of aviation (Doa), and the Pennsylvania Department of environmental Protection will investigate how to creatively integrate stormwater management solutions into upcoming Doa projects.
Increase the Number of Green roofs fifteen additional green roofs have been constructed, bringing the current total to 67 (12.7 acres). An additional 13.7 acres are either under construction or planned at 43 sites around the city.
Maintain recent stormwater regulatory Changes
Since 2006, PWD approved more than 1,600 acres of development under the new stormwater regulations, including 185 acres as part of 68 approvals to date in 2012.
restore waterways PWD completed construction of Wises Mill, bells Mill, and St. Martin’s stream restoration proj-ects in 2012. PWD is designing comprehensive stream restoration on Georges Run and 3 miles of stream corridor restoration in the tacony and cobbs creek watersheds.
I n I t I a t I v e P R O G R e S S
in P
ro
Gr
eSS
co
MP
lete
D
31
Planned and Constructed Green roofs in Philadelphia
Square Feet0 0.5M 1.0M 1.5M
0 500000 1000000 1500000 2000000
2011
2009
2010
125
0
100
75
50
25
110
TOTAL SITES TOTAL SQUARE FEET
826,924
921,186
1,609,542
86
64
Number of Sites Planned and Constructed
Phot
o b
y r
oofm
ead
ow

expanding open spaCe goals
The Fairmount Park system consists of 9,200 acres of open space including forest, trails, streams, and 75 neighborhood playgrounds spread across Philadelphia. Despite Philadelphia’s robust park system, not all residents can easily access open space. Greenworks set out to provide park and recreation resources within 10 minutes of 75 percent of residents. Green2015, released by Philadelphia Parks & Recreation (PPR) in collaboration with PennPraxis, found that in 2010, 80% of Philadelphians enjoyed walkable access to open space. Exceeding the Greenworks goal shows that Philadelphia’s park system is providing a high level of service, but with approximately 202,000 resi-dents still outside a 10-minute walk to open space, PPR and the Mayor’s Office of Sustainability are committed to expanding the goal to provide open space access to all residents. To meet this expanded goal, the City will continue to work toward adding an additional 500 acres of open space by 2015, particularly in the priority areas identi-fied in Green2015: South Philadelphia, West Philadelphia, North Philadelphia, Lower Northeast Philadelphia, and East and West Oak Lane. Since Greenworks launched, PPR and its partners have completed 100 acres of new park space, and have identified and designed 105 more for completion.
T A R G E T 9 : Provide Walkable Access to Park and Recreation Resources for All Philadelphians
32
• Greenworks baseline (2008)
10,300 acres of open Space
• Current (2012)
10,400 acres of open Space
• 2015 Target
10,800 acres of open Space
M E T R I C S
Existing Public Green Space
Green 2015 Priority Areas
Zero
Half-Mile
WALKING DISTANCE TO PUBLIC GREEN SPACE
EAST ANDWEST OAK LANE
LOWER NORTHEAST PHILADELPHIA
NORTHPHILADELPHIA
SOUTH PHILADELPHIA
WEST PHILADELPHIA[THIS PAGE]: Race Street Pier, completed
in May 2011, is one of the first public spaces completed as part of the Delaware
River Waterfront Corporation’s master plan for the Central Delaware Riverfront.
.[OPPOSITE PAGE]: Penn Park combines open space, athletic fields, walking trails,
and stormwater cisterns on 24 acres in University City.
walking Distance to Public Green space
Map
Cou
rtes
y of
Phi
lad
elp
hia
Park
s &
rec
reat
ion
and
Pen
nPra
xis

33
E Q U I T Y
Innovative Partnerships Drive targeted open space Development
In 2011, PPR partnered with the Trust for Public Land (TPL), a non-profit land conservation organization and a national leader in creating urban parks. TPL raised significant external funds to support a green play spaces pilot that works with Philadelphia community members to identify and redevelop open space where it is most needed. The William Penn Foundation and Pennsylvania Department of Conservation and Natural Resources are both providing resources to support this pilot initiative. PPR is continuing to work with the Philadelphia Water Department (PWD), the School District of Philadelphia (SDP), and the Mural Arts Program to green schoolyards that are currently paved. This effort, which is part of SDP’s facilities master planning process, establishes new open space while providing additional stormwater management capacity.
New Parks Contribute to open space goals
In the fall of 2011, The University of Pennsylvania opened Penn Park, an expansive new public green space directly across the Schuylkill River from Center City. One of the largest new open spaces in the city at 24 acres, Penn Park is home to more than 500 newly planted trees, which are irrigated with on-site underground rainwater harvesting cisterns. The park offers panoramic views of the Philadelphia skyline and an enhanced con-nection between Center City and the University City neighborhood. At 12th and Catharine Streets in South Philadelphia, Hawthorne Park will open in the summer of 2012. In three-quarters of an acre, Hawthorne Park features community gathering spaces, a stage for events and perfor-mances, and innovative strategies to manage stormwater on-site. PPR col-laborated with the Hawthorne Empowerment Coalition; the Philadelphia Housing Authority, which owns the site; the Pennsylvania Horticultural Society; and PWD to design and complete Hawthorne Park, the first new neighborhood park since Green2015 was released in 2010.
Improving open space Access with Connections and Corridors
In addition to constructing new parks to improve access for all Philadelphia residents, PPR and its partners are focused on increasing the number and quality of connections between neighborhoods and existing parks and trails. These connections can take many different forms, ranging from improved on-street bicycle and pedestrian signage to historic stream cor-ridor walks and converted out-of-use rail corridors.
One corridor project under way is a wetlands park stretching from Pier 70 at Mifflin Street down to Pier 53 at Washington Avenue, where the Delaware River Waterfront Corporation (DRWC) recently completed Washington Green Park. In March 2011, DRWC, in partnership with the Natural Lands Trust, acquired five acres of land in South Philadelphia
along the Delaware River to create the new linear park.
In 2011 and 2012, the Philadelphia City Planning Commission and the Streets Department installed 400 bicycle wayfinding signs throughout Philadelphia indicating dis-tance and direction to and from parks, trails, and other destinations, reinforcing the City’s ongoing investments in bicycle infrastructure and open space. The signs also promote bicy-cle safety by serving as a visual reminder for motorists and pedestrians to share the road, while encouraging cyclists to use those streets that can safely and appropriately accommo-date multiple modes of traffic.
Hunting Park, a historic 87-acre park in north Philadelphia, is undergoing an impressive transformation thanks to a neighborhood-led revitalization effort in partnership with the fairmount Park conservancy and Philadelphia Parks & recreation. the revitalization plan, based on input from a series of community meetings in 2009, proposes design and program recommendations in six phases. completed Phase i improvements include two new playgrounds, the park system’s premier baseball field, a 60-plot commu-nity garden, a new farmers market, and improved lighting throughout the park. the Hunting Park revitalization Project is a great example of how improving open space can provide healthy recreation opportunities for children and families and bring residents together to invest in their neighborhoods.
Revitalizing Hunting Park
Mayor Nutter celebrates the opening of the Hunting Park Community Garden with Councilwoman Maria Quiñones-Sánchez; Fairmount Park Conservancy Executive Director Kathryn Ott Lovell; Representative Tony Payton, Jr.; Deputy Mayor Michael DiBerardinis, and friends.
Phot
o b
y Fa
irm
ount
Par
k C
onse
rvan
cy

T A R G E T 9
34
i n i t i at i V e P r o G r e S S 2 0 1 2
neW | Create a Corridor Network Connecting Parks, Neighborhoods, and Trails Citywide
in fall 2011, the race Street connector, a combination of improve-ments in bicycle and pedestrian infrastructure and public art that enhance the quality and the ease of access from Old City to the race Street Pier and the Delaware riverfront, opened. in 2011 and 2012, the Philadelphia city Planning commission and the Streets Department installed 400 bicycle directional signs indicat-ing distance and direction to and from parks, trails, and other destinations.
Develop Parkland and open space Connections Along the City's Creeks and rivers
PPr and the Philadelphia industrial Development corporation are making approximately 5 acres of new open space available for outdoor recreation activities along the lower Schuylkill river adja-cent to PPr’s bartam’s Garden. the Delaware river Waterfront Corporation, in partnership with the natural Lands Trust, acquired five acres of land in South Philadelphia along the Delaware river to create the new linear park.
Explore the Use of Innovative financing for open space Development
Philadelphia Parks & recreation (PPr) is partnering with the Philadelphia Water Department (PWD) and the trust for Public land (tPl) on a pilot which will work with residents to create new green play spaces in underserved neighborhoods. residents will be actively engaged in the design, development, and stewardship of the new green spaces. to date, tPl has raised $2.4 million to support this work.
Increase stability of fairmount Park Ecosystem
PPr is collaborating with several partners to develop a city-wide ecosystem plan addressing environmental, social, and economic indicators of ecosystem health.
Prioritize New Green space Creation within low-served Neighborhoods
the PPr, PWD, and tPl pilot is focused in areas of need identified by Green2015. as part of their facilities master planning process, the School District of Philadelphia is considering greening schoolyards.
I n I t I a t I v e P R O G R e S S
in P
ro
Gr
eSS
[LEFT]: Cyclists and rowers enjoy the Schuylkill River in Fairmount Park.
[RIGHT]: Hawthorne Park in South Philadelphia provides residents
access to open space in one of the Green2015 priority areas.
Phot
o b
y M
os

35
P R O F I L E : Philadelphia School District
Green schools cost less to operate, freeing up resources to improve edu-cation. They also provide environments that make learning easier and more comfortable. Clean indoor air cuts down on sick days, and inno-
vative design provides hands-on learning opportunities. as the movement for green schools picks up momentum around the country, the School District of Philadelphia (SDP) has emerged as a national leader. The SDP has adopted a goal that new construction meet LEED Silver certification or higher. With the leadership of staff in the Capital Programs office, the SDP built five LEED schools, retrofitted one school to achieve LEED for Existing Buildings certification, and is developing an additional LEED school. The projects are helping the SDP develop strategies to implement on a district-wide scale. as the SDP drafts its facilities master Plan, the City of Philadelphia is committed to assisting them with energy management and sustainability initiatives.
District Certifies First LeeD existing Building
The School District was one of only 12 districts nationwide selected to participate in the U.S. Green Building Council’s (USGBC) LEED in Existing Schools Pilot Project. Working with the Delaware Valley Green Building Council (DVGBC), the SDP identi-fied Thurgood Marshall Elementary in North Philadelphia as its pilot project to imple-ment LEED in Existing Schools. Personnel from the SDP worked with support from USGBC, green building consultants, and volunteers from DVGBC to develop significant operations and maintenance improvements, including upgraded plumbing, efficient light-ing, and optimized heating and cooling units. The school received its LEED certification in 2012 and is a model for how schools can be upgraded for enhanced performance.
Communities support school greening Projects
In addition to the SDP’s capital investments, principals, teachers, parents, students, and community members at a number of schools around the city are taking the initiative to green schoolyards and spearhead other sustainability projects. In 2012, Nebinger Elementary School, located at Sixth and Carpenter streets in South Philadelphia, was awarded a green grant. Members of the school community who wanted to transform the asphalt play yard and concrete perimeter into more inviting and active spaces worked with a design team from the Community Design Collaborative to develop a conceptual open space plan for the school site. The grant will fund green infrastructure tools such as porous play surfaces, rain gardens, or stormwater planters in the school-yard and on nearby streets. The improvements will serve as an outdoor classroom and laboratory for the school’s students. The project is a collaboration among the Philadelphia Water Department (PWD), the U.S. Environmental Protection Agency, the Partnership for the Delaware Estuary, and the SDP.
Green2015 Pilot Program to green schools and recreation Centers
In May 2012, Mayor Nutter announced that the City and the Trust for Public Land are partnering with the SDP to green as many as 10 schoolyards and recreation cen-ters in support of Green2015 and the Greenworks Target 9 goal to provide 500 acres of additional green space in Philadelphia.
The partnership’s initial project is redesigning and redeveloping the William Dick Elementary Schoolyard, Hank Gathers Recreation Center, and Collazo Park in North Philadelphia. One major advantage of the partnership is that it allows the City and the SDP to pool limited public resources to green public schools and recreation centers locat-ed near each other. The partnership also leverages federally mandated stormwater man-agement funds through the PWD, committed state funding through the Pennsylvania Department of Conversation and Natural Resources, and private funds raised by The Trust for Public Land from the William Penn Foundation, MetLife Foundation, National Recreation Foundation, and others. The TPS Foundation is also providing support to incorporate public art at various sites as part of the overall initiative.
[TOP AND CENTER]: Commodore John Barry Elementary School in West Philadelphia
harvests rainwater to reduce potable water use by 50% and has abundant daylighting to
reduce electricity use for lighting.
[BOTTOM]: Deputy Mayor Michael DiBerardinis celebrates the first green school-
yard project with students at William Dick Elementary School in North Philadelphia.
Phot
o b
y M
os
Phot
o b
y Ps
DPh
oto
by
PsD

philadelphia hoMe To 53 neW MarKeTs and gardens
To increase Philadelphians’ access to local food, Greenworks sets a goal of adding 86 new gardens, farms, and farmers markets by 2015. Since 2009, the city boasts 24 new farmers markets and 29 new farms or gardens, which together represent over 60 per-cent progress toward meeting the initial goal. Ten of the new farmers markets were opened between 2010 and 2012 by the Philadelphia Department of Public Health and The Food Trust in low-income communities as part of the Get Healthy Philly initiative.
T A R G E T 1 0 : Provide Walkable Access to Affordable, Healthy Food for All Philadelphians
36
• Greenworks baseline (2008)
230 Markets, Gardens, and farms
• Current (2012)
283 Markets, Gardens, and farms
• 2015 Target
316 Markets, Gardens, and farms
M E T R I C S
Planning Districts
High Poverty Areas with improved walkable access to healthy food between 2010 and 2012
[THIS PAGE]: The West Philadelphia Fresh Food Hub sold produce to residents at the
Mantua Green Block Build in March 2012.
[OPPOSITE PAGE]: Marathon Farm in Brewerytown supplies produce to the
neighborhood and Marathon Restaurants.
Improved walkable Access to Healthy food from 2010 to 2012
Phot
o b
y M
os
Map
Cou
rtes
y of
Phi
lad
elp
hia
Dep
artm
ent
of P
ublic
Hea
lth
Areas with improved walkable healthy food access are home to more than 219,000 Philadelphians.

37
E Q U I T Y
expanding Food Access goals
In 2011, Mayor Nutter appointed the Philadelphia Food Policy Advisory Council (FPAC). Over the past year FPAC members, City government agencies working on food policy, and external partners have encour-aged the Mayor’s Office of Sustainability (MOS) to expand the original Greenworks goal of bringing local food within 10 minutes of 75 percent of residents. Recognizing that in addition to physical proximity, affordability plays a strong role in access, and also acknowledging that Philadelphia communities can be sustainable only if residents have access to healthy food that is local when possible, MOS is committed to expanding the Greenworks food goal to providing walkable access to affordable, healthy food for all Philadelphians. The FPAC recommends that MOS adopt new Greenworks initiatives outlined at left to help meet this expanded goal.
Increasing Affordability of Healthy, Local Food
Since 2009, the number of farmers markets that accept Supplemental Nutrition Assistance Program (SNAP) food benefits in Philadelphia increased by 40. Over the same period of time, at the 26 farmers markets run by the Food Trust that accept SNAP, the amount of benefits redeemed increased from approximately $13,000 to more than $56,000. In addition, from July 2010 to March 2012, the Philadelphia Department of Public Health’s Philly Food Bucks program, which allows SNAP beneficiaries to get $2 of free produce for every $5 of food stamp benefits spent at par-ticipating farmers market and farm stands, provided $50,000 worth of healthy, local produce to Philadelphians.
supporting Food Businesses
The City of Philadelphia recognizes that its role in creating a sustainable regional food system includes supporting the establishment of food busi-nesses such as fresh food processing and packaging facilities, shared com-mercial kitchens, and retail markets offering fresh produce in Philadelphia. The Department of Public Health’s Office of Food Protection is work-ing with the Commerce Department’s Office of Business Services and the Department of Licenses & Inspections to create a Guide for Food Businesses to document and improve the start-up process for food entre-preneurs. Also, the new zoning code passed in December 2011 allows farmers markets, fresh food markets, community gardens, market farms, community-supported agriculture farms, and horticultural nurseries and greenhouses in a variety of zone districts, and provides incentives for fresh food markets to locate in a variety of zoning districts.
Food Policy Advisory Council Recommen-dations
During its first year of meeting, the Philadelphia fPac organized itself into four subcommittees addressing hunger, vacant land, workforce devel-opment, and fPac governance. the fPac recommends that MoS adopt the following new initiatives:
• Leverage existing City resources to raise awareness about the breadth of food resources available, includ-ing SnaP enrollment, benefit uti-lization at farmers markets, and food cupboards. for example, 311 services could be enhanced through operator training and updated scripts.
• Work with the Mayor’s Office of transportation and utilities and SePta to examine opportunities for alignment between the food system and the public transporta-tion system.
• Conduct a comprehensive needs assessment regarding urban agri-culture and other local fresh food production, looking particularly at the intersection between food access and vacant land.
• institute a pilot project that pro-vides mid- and long-term leases to nonprofit and entrepreneurial organizations and individuals to create market farms on vacant public land.
• Create an interagency commit-tee to establish clear standards for formation and licensing that lower barriers to entry and stimu-late growth of food growing and processing businesses, including cooperatives and shared commer-cial kitchens.
• implement City food procurement standards to encourage the pur-chase of nutritious, ethical, sustain-ably produced, regionally sourced and/or fair-trade products.

T A R G E T 1 0
38
i n i t i at i V e P r o G r e S S 2 0 1 2
neW | Include fresh food Market Incentives in Zoning Code
Zoning code passed in December 2011 provides floor area, building height, and parking requirement reduction incentives for fresh food markets to locate in a variety of zoning districts.
Establish food Policy Advisory Council
Mayor nutter appointed food Policy advisory council (fPac) in 2011. in its first year, fPac met every other month, formed sub-committees, and provided recommendations on hunger allevia-tion, vacant land, and workforce development.
neW | Update food Business Guide
the Department of commerce, Department of Public Health, and licenses & inspections collaborated to draft an update for the Guide for food businesses.
Encourage Distribution of Healthy food in Neighborhood stores
through a partnership between the Philadelphia Department of Public Health and the food trust, more than 600 corner stores have been recruited into the Healthy Corner Store initiative; 83% of enrolled stores introduced four or more new healthy products and marketing materials; and 100 corner stores received mini-conversions that include shelving and refrigeration to store pro-duce and other perishables.
Expand the Number of Neighborhood farmers Markets
from 2010 to 2012, the Department of Public Health’s Get Healthy Philly program established 10 new farmers markets in underserved areas. SePta also worked with a variety of partners to create of new farmers markets at the olney and frankford transportation centers and the 46th Street el Station.
foster Commercial farming Zoning code passed in December 2011 allows market or commu-nity-supported farms, horticulture nurseries, and greenhouses as principal or accessory uses in a variety of zone districts.
foster school-Based Efforts During the 2011-2012 school year, fair food’s farm to School program served 50 schools. as part of Get Healthy Philly, 160 public schools created School Wellness councils focused on physical activity and nutrition, 25 of which banned junk food, and seven of which started school gardens.
Integrate Anti-Hunger Efforts into food and Urban Agriculture Goals
Department of Public Health created Philly food bucks to pro-mote spending food stamp benefits at farmers markets. between 2010 and 2012, $50,000 of coupons have been redeemed. fair food also offers a coupon called Double Dollars.
leverage Vacant land landholding agencies collaborated to draft uniform vacant land policies, including policies regarding growing food on city-owned vacant land.
Provide Technical Assistance to Community Gardeners and Urban farmers
the city Harvest Growers alliance, run by the Pennsylvania Horticultural Society and funded by the USDA, helped 300 new individuals begin growing during the 2010 and 2011 seasons. in 2012, the program opened the community farm and food resource center at bartram’s Garden on Philadelphia Parks & recreation land.
Publicize local food-source Efforts
fair food Philly and the Pennsylvania association for Sustainable agriculture hosted the first Philly farm & food fest, a day of eating and hands-on learning about our region’s food system, in april 2012. the Greater Philadelphia tourism and Marketing corporation continues to publicize local food through the Philly Homegrown campaign.
support Expansion of food Co-ops
the Philadelphia industrial Development corporation provided 19% of the capital for the expansion of Mariposa food co-op, which opened its new location in March 2012. South Philly food co-op and Kensington community food co-op continue to increase membership.
support Green Kitchen Development
the Departments of Public Health and commerce are collaborat-ing to produce a guide for food businesses that will clarify licensing requirements. The City is supporting the creation of the enterprise center cDc’s center for culinary enterprises, a shared-use culinary business center.
Create an Urban Agriculture workforce strategy to Grow Green Jobs
future initiative.
I n I t I a t I v e P R O G R e S S
in P
ro
Gr
eSS
co
MP
lete
Dfu
tur
e
Growing Home
located on emily and Mercy streets in South Philadelphia, the four gar-dens that collectively make up the Growing Home Garden are no ordi-nary urban agriculture endeavor. in these beautiful and productive gar-dens, you are likely to stumble upon a row of mustard greens or a hanging bitter melon plant, two crop favorites of the 84 burmese and bhutanese refugee families who maintain the plots. the project, started by an ambi-tious urban gardener with a desire to create a place for the refugees to work, connect with their neighbors, and produce healthy food for their families, has become an effort of the nationalities Service center to continue to acclimate the new resi-dents to their land and community in South Philadelphia. by allowing this community access to nutritious food and outdoor recreation, while also creating infrastructure for local food production in what were once vacant city-owned lots, community projects like the Growing Home Garden help Philadelphia move closer to reaching its equity, food access, and sustain-ability goals.
Phot
o b
y M
os

E Q U I T Y
T A R G E T 1 1 : Increase Tree Coverage toward 30 Percent in All Neighborhoods by 2025
philadelphia’s Tree Canopy iMproVes
Prior to the release of Greenworks in 2009, the City had been losing tree canopy for decades, but innovative planting and maintenance programs have recently reversed that trend. In 2010, Philadelphia Parks & Recreation (PPR) released an assessment conducted by the University of Vermont Spatial Analysis Lab, in partnership with the U.S. Forest Service, titled A Report on the City of Philadelphia’s Existing and Possible Tree Canopy. The report established that Philadelphia’s tree canopy covers 20 percent of total land in the city, 4 percent higher than the 2008 baseline reported in the original Greenworks plan. Over the past three years, PPR has formed a number of tree-planting partnerships, on both public and private land, that have resulted in planting more than 63,000 new trees, or approximately 21 percent of Greenworks’ goal to plant 300,000 trees by 2015.
the Importance of Urban tree Canopy
Urban trees require careful maintenance to thrive, but provide numerous benefits to city dwellers. Trees play an integral part in achieving several Greenworks targets, includ-ing reducing energy use and greenhouse gas emissions, improving air quality, and man-aging stormwater. Trees make the air we breathe cleaner and reduce air-related illnesses such as asthma. Trees lower summer temperatures by providing shade and reducing the urban heat island effect. Street trees and stormwater tree trenches play an important role in managing stormwater runoff and reducing noise pollution, while increasing habitat for urban wildlife. Finally, a healthy tree canopy increases the economic stability of neighborhoods.
Public–Private Planting Partnerships
In 2012, PPR launched TreePhilly, a new greening initiative that directly engages all Philadelphians in improving their communities by planting and maintaining trees and enabling others to do the same. TreePhilly supports the Pennsylvania Horticultural Society’s regional Plant One Million Campaign. As a first project, with support from Wells Fargo, TreePhilly partnered with the Fairmount Park Conservancy to sponsor a
• Greenworks baseline (2008)
0 new trees
• Current (2012)
63,126 new trees
• 2015 Target
300,000 new trees
M E T R I C S
39
4,000Number of FREE YARD TREES
TreePhilly will provide
to residents in 2012.

40
free yard tree giveaway program for Philadelphia residents. The tree canopy study released by PPR in 2010 noted that private yards rep-resent the best opportunity for tree planting in Philadelphia. In April of 2012, PPR held 16 free yard tree giveaway events and provided residents with on-site workshops and take-home resources to properly plant and care for trees on their property. During the spring giveaway, TreePhilly provided more than 1,500 new yard trees to Philadelphia residents, and the program will provide a total of 4,000 new yard trees in 2012.
In 2011, the Center City District (CCD) and PPR established a new partnership to plant street trees in 99 empty tree pits along Center City sidewalks. The partnership marks the first time CCD and PPR have collaborated to fill empty tree pits in Center City. CCD surveyed all the sidewalks in the district and documented empty tree pits. PPR provided labor and 60 new trees for plantings in fall 2011, with an additional 39 planned for spring 2012. PPR will maintain the trees for the first year, and the CCD will continue their care for the following three years.
Improved tree Maintenance Program
Maintaining newly planted trees until they are established is an important part of creat-ing a healthy tree canopy. In 2011, PPR partnered with the Pennsylvania Horticultural Society to develop the Seasonal Tree Maintenance Associate (STMA) Program to improve tree maintenance on PPR land. Two team leaders and 10 crew members worked from July through November in 15 parks across Philadelphia. Program associ-ates learned valuable landscaping, tree identification, and tree maintenance skills on the job and in a series of workshops. STMA will continue to provide tree maintenance and job training opportunities in 2012.
[TOP]: Drexel University’s 2012 Earth Day Block Party included tree planting
demonstrations.
[BOTTOM]: TreePhilly distributed free yard trees at the Oak Lane Library in April 2012.
Dispelling Tree Myths
“TREES INTERFERE WITH UTILITY LINES”
* Philadelphia Parks & Recreation’s trained arborists select trees based on growth rate and maximum height for streets with overhead wires. They also work year round to prune trees and remove dead trees that may interfere with power and utility lines.
“TREE ROOTS INVADE SEWER PIPES”
* Roots do not crack or damage sewer lines on their own. Tree roots can only enter sewer pipes if the sewer pipe is already broken.
“A NEW TREE WILL CRACK MY SIDEWALK”
* Only if it is not planted or cared for properly. Philadelphia Parks & Recreation inspects every street tree location, selects appropriate tree species, and plants trees in a way that minimizes the chance of sidewalk damage.
“TREES ARE EXPENSIVE”
* Not if you request your tree from TreePhilly! Visit TreePhilly.org or call 215-683-0217 to learn how you can request a free tree for your property. “TREES CREATE MESS”
* Philadelphia Parks & Recreation selects appropriate tree varieties for street planting that reduce the volume of falling leaves and do not drop messy waste.
FALSE
FALSE
FALSE
FALSE
FALSE

T A R G E T 1 1
41
E Q U I T Y
i n i t i at i V e P r o G r e S S 2 0 1 2
neW | Establish seasonal Tree Maintenance Associate Program
in 2011, PPr partnered with the Pennsylvania Horticultural Society to develop the Seasonal tree Maintenance associate (StMa) Program to improve tree maintenance on PPr land. twelve associates worked from July through november in 15 parks. StMa will continue to provide tree maintenance and job training opportunities in 2012.
neW | Provide Incentives for Preserving large Caliper Trees
Zoning code adopted December 2011 provides credits for preserving existing trees in §14-705(1).
Change street Tree rules Involving Property-owner Permission
Philadelphia Parks & recreation (PPr) established a notification and opt-out process for owners of property abutting planned street tree plantings. PPr is sending opt-out letters to both home and business owners.
launch local Carbon offset Market through a partnership among the city, the u.S. forest Service, and fairmount Park conservancy, the Erase Your Trace website launched spring 2009. allows for the purchase of carbon offsets that benefit local tree planting efforts.
revise the Zoning Code regarding Trees for surface Parking lots
The new zoning code, passed in December 2011, requires any surface parking area located within 20 feet of any public street to include trees.
Create Urban Tree forest Management Program
PPr is working with the u.S. forest Service and other partners to develop an urban forest plan for the park system’s natural areas. Draft to be complete by December 2012.
Decrease the Cost of Tree Planting in 2012, as part of the treePhilly campaign, PPr will purchase and distribute 4,000 container trees for planting by homeowners in yards and volunteers in public spaces.
Establish City-wide Public Tree Planting Campaign
Green Philly, Grow Philly campaign renamed treePhilly in february 2012. in spring 2012, treePhilly distributed 1,500 yard trees to Philadelphia homeowners.
fully stock street Trees Adjacent to All City facilities
PPR is planting more than 1,000 trees on the streets surrounding 43 recreation sites in north Philadelphia.
Green the schools trust for Public land is leading a partnership among PPr, Philadelphia Water Department, and the School District of Philadelphia to green school yards.
Initiate City-Based Growing PPr’s Greenland nursery has expanded to 12 acres of growing area, including a new pot-in-pot nursery.
Prioritize Tree Planting in low-Canopy, High-Crime Districts
PPr used data from the urban tree canopy assessment to prioritize eight focus areas with low canopy and high potential for public space and yard tree plantings.
strengthen and Increase Public-Private Maintenance Partnerships
PPr is working with Pennsylvania Horticultural Society tree tenders and community groups.
Target Empty Tree Pits PPr is attempting to replant in all pits as soon as a tree is removed. citizen surveys of empty pits are helping PPr target areas for inspection and planting.
I n I t I a t I v e P R O G R e S S
in P
ro
Gr
eSS
co
MP
lete
D
Philly Tree People Plants More Than 750 Trees
Philly tree People is a group of community volunteers with a mission to beautify their neighborhood in northeast Philadelphia by improving and maintaining the area tree canopy. the founders, three women who took advantage of the Pennsylvania Horticultural Society’s tree tenders training, have worked in partnership with public and private organizations to organize biannual tree plantings and workshops for resi-dents in Kensington, east Kensington, and fishtown. Since its founding in 2007, the organization has held nine community tree planting events, pruned more than 100 trees, and planted 773 trees in the neighborhood. in addition to the large-scale com-munity plantings, they also provide local homeowners with easily accessible informa-tion about proper tree care and maintenance.
Phot
o b
y Ph
illy
tree
Peo
ple

E C O N O M YGoAl: PHILADELPHIA CREATES A COMPETITIVE ADVANTAGE FROM SUSTAINABILITY
T A R G E T 1 2 : Reduce Vehicle Miles Traveled by 10 Percent
• Adjusted Greenworks baseline (2005)
5.96billion Vehicle Miles traveled
• Current (2012)
5.52billion Vehicle Miles traveled
• 2015 Target
5.36billion Vehicle Miles traveled
M E T R I C S
Baseline adjusted from allocated to unallocated vehicle miles traveled.
philadelphia redUCes VehiCle Miles TraVeled by 7.4%
Greenworks seeks to reduce automobile use in Philadelphia to improve air quality, lower energy use and greenhouse gas emissions, and promote active transportation meth-ods. Between 2005 and 2010, the average daily vehicle miles traveled in Philadelphia decreased 7.4% from 5.9 to 5.5 billion miles. Greenworks aims to maintain this down-ward trend, even as Philadelphia adds new residents, by investing in amenities and infrastructure that promote walking, biking, and public transit.
Public transit ridership Increases
SEPTA registered a 22-year high in transit ridership, with 334 million passenger trips in 2012. Public transportation is vital to the health of the city, and is the primary alterna-tive to automobile use for most residents. SEPTA has attracted more passengers during a year that included fare increases and capital funding reductions, both of which can stunt ridership growth. SEPTA credits continued investment in improved safety, cus-tomer service, and infrastructure improvements for the steady stream of new riders in 2012 and seeks to maintain this trend as the economy improves.
off-road Bike trails Constructed
After receiving a total of $17.4 million in American Recovery and Reinvestment Act funding in 2010, Philadelphia’s off-road network of bicycle trails continued to expand in 2012. Several key projects are now complete and many more have moved from design to construction. The 58th Street Greenway project, coordinated by the Pennsylvania Environmental Council (PEC), is currently under construction and con-nects Cobbs Creek Park to Bartram’s Garden, passing through several neighborhoods in Southwest Philadelphia along the way. The 58th Street Greenway includes new lighting, sidewalks, and a multi-use path, and PEC will partner with local organization uGO to promote community physical fitness through use of the Greenway.
Two major bike trail projects were completed on the Schuylkill River Trail in 2012. In February the City and the Pennsylvania Department of Conservation and Natural Resources celebrated the completion of $645,000 in renovations to the Manayunk Canal Towpath, a crucial connection on the trail from Center City to Montgomery County to the west.
At Locust Street on the Schuylkill River, a new bridge over the CSX tracks was installed in May 2012. The one mile section of trail approaching the new bridge boasts 16,000 users per week. The bridge connects the Schuylkill River Trail with Schuylkill River Park and will ensure safe and con-venient passage for walkers, runners, and bikers when trains block the grade crossing.
Forbidden Drive in Fairmount Park provides 10 miles of off-road biking,
running, and equestrian trails.
42

43
Philadelphia City Planning Commission Promotes Bicycling in Philadelphia
the Philadelphia city Planning commission (PcPc) managed a variety of short- and long-term projects to make Philadelphia more bicycle-friendly in 2012. Working with toole Design Group, PcPc staff completed the second and final phase of the city’s Pedestrian and Bicycle Plan. the plan maps out a citywide bicycle network of lanes, cycletracks, sharrows, and trails; recommends policy and programmatic changes to support bicycling; and presents strategies for implementation over time. the plan will be complete in June 2012.
PcPc collaborated closely with other city agencies to implement several aspects of the plan. PcPc worked with the Streets Department, the Mayor’s office of transportation and utilities (Motu), and the Philadelphia Department of Public Health (PDPH) to plan, design, and install a citywide bicycle signage system. nearly 400 signs provide directions and distances to major destinations and bicycle facilities, while another 100 sidewalk decals promote safe bicycling practices by reminding rid-ers to “Walk your Wheels” on sidewalks. the signage system will grow as the bike network expands.
the four agencies also produced the new Philadelphia bicycle Map. the pocket-size guide contains safety tips, rules of the road, and tips for bike parking and bikes on transit. the bicycle coalition of Greater Philadelphia is helping to distribute an initial printing of 23,000 maps to bike shops, visitor centers, parks, and recreation centers throughout summer 2012.
Philadelphia Bicycle Map – Center City Inset
In 2012 PCPC, MOTU, and PDPH collaborated to produce an updated bicycle map of Philadelphia.
Download your copy at phila.gov/MOTU.
Phot
o b
y PC
PC

T A R G E T 1 2
44
i n i t i at i V e P r o G r e S S 2 0 1 2
Build an East-west Bicycle Corridor
bicycle counts increased over 100% on the Spruce and Pine Street east-West corridor. the corridor connects to other destinations via 13th and 10th Street buffered bike lanes and the South Street bridge.
Expand the Number of Bike racks
in spring 2012, the City is installing more than 350 bicycle racks at locations around the city.
Implement Airport Bicycle Access Plan
center city-to-airport bicycle access plan completed 2009.
Design and Implement Complete streets
the Mayor’s office of transportation and utilities (Motu) will release the complete Streets Handbook in 2012. Motu continues to advance other initiatives, such as the the north-South pilot bike lanes in center city, to better meet the needs of all road users.
Develop a Pedestrian and Bicycle Master Plan
Phase i of Pedestrian and Bicycle Plan released in fall 2011. Phase ii will be complete in 2012. together the two plans cover all of Philadelphia and include targeted recommendations for new bicy-cling and walking trails.
Develop More off-road Bike Trails
Projects funded through a $17.2 million u.S. Department of transportation grant, including the 58th Street Greenway in Southwest Philadelphia and Kensington and tacony rails to trails along the northern Delaware, are moving forward.
Develop New fare Card Technologies
in november 2011, the SePta board selected acS transport Solutions inc. to implement the new Payment technologies project.
Ensure sustained Transit funding
SePta continues to work with stakeholders to pursue a legislative agenda to replace lost act 44 funding.
Explore the Creation of a Bike-sharing Program
in 2012, Motu will draft an rfP for a bike-sharing program con-sistent with a feasibility study completed in 2009.
further Improve service and safety
SePta’s customer satisfaction rating increased from 7.2 out of 10 in 2008 to 7.9 out of 10 in 2010. the nearly 10 percent improve-ment reflected increased satisfaction across all modes and service territories, with some of the largest gains on the Market frankford line and trolley lines in West Philadelphia.
Invest in Current Transit Infrastructure
as of January 2012, SePta spent $179 million (94%) of its $191 million in american recovery and reinvestment act funds, substan-tially completing 27 of 32 projects.
Make Transit-oriented Development Investments
SePta improvements to the temple university regional rail Station, adjacent to the Asociacion Puertorriquenos en Marcha’s transit-oriented development at ninth and berks streets, will include an enhanced station entrance area, new signage, paint, ticket booth renovations, covered bicycle parking, and platform repairs.
Plan for an Expanded system
SePta is developing an alternatives analysis and Draft environmental impact Statement for the extension of the norristown High Speed line from 69th Street Station to King of Prussia.
reduce Parking ratios for Buildings with Designated Bike and Car share spots
Zoning code passed in December 2011 establishes new parking maximums to prevent oversupply of parking and requires dedi-cated vanpool, carpool, and hybrid vehicle parking in large com-mercial parking lots.
Upgrade Commercial Corridors
the city’s commerce Department’s reStore Streetscape enhancements and Storefront improvement Programs revitalize commercial corridors.
Create Bike Parking stations
future initiative.
I n I t I a t I v e P R O G R e S Sin
Pr
oG
re
SSc
oM
Ple
teD
futu
re
[TOP]: The bike lane on the South Street bridge is part of one of Philadelphia’s new
complete streets.
[BOTTOM]: The new Paseo Verde transit-oriented development will provide LEED
for Neighborhood Development certified amenities in North Philadelphia.

45
E C O N O M Y
P R O F I L E : SEP-TAINABLE Drives Sustainability
In 2012, the Southeastern Pennsylvania Transportation Authority (SEPTA) released the first progress report since the launch of SEP-TAINABLE, a sustainability plan that follows the Greenworks timeline and sets 12 measurable goals for the transit agency under the three broad categories of environmental, social, and economic sustain-ability. SEP-TAINABLE encourages the adoption of innovative technologies such as the regenerative braking systems on the new Silverliner V regional rail cars, as well as smart operational measures that reduce environmental impact across the SEPTA ser-vice territory.
By setting measurable goals and delivering a detailed report that highlights key per-formance indicators, SEPTA is at the forefront of sustainability management for large organizations, and transit agencies in particular. In addition to reducing energy inten-sity and recycling 621 tons of waste in 2011, SEPTA supported four new farmers mar-kets at transit stations. In December 2011, the Federal Transportation Administration’s Climate Change Adaptation Assessment Pilot Program provided grant funding to SEPTA and its partners IFC International and the Delaware Valley Regional Planning Commission to complete a vulnerability assessment of the Manayunk/Norristown regional rail line. The assessment will help SEPTA develop strategies to adapt physical infrastructure, maintenance schedules, and system operations based on recent weather events and current climate projections.
Sustainability Goal Target Indicator Baseline FY2010 FY2011 2015 Focus Area (Unit) FY2009 Result

47
T A R G E T 1 3 : Increase the State of Good Repair in Resilient Infrastructure
46
• Greenworks baseline (2008)
73%of assets in a State of Good repair
• Current (2012)
77%of assets in a State of Good repair
• 2015 Target
80%of assets in a State of Good repair
M E T R I C S perCenT oF inFrasTrUCTUre in sTaTe oF good repair inCreases
Greenworks aims to raise the portion of the City’s infrastructure in a state of good repair to 80% by 2015. This report considers infrastructure in good repair when “no backlog of needs exists and no component is beyond its useful life,” a definition equivalent to SEPTA’s. Greenworks estimates the value of the City’s infrastructure at more than $65 billion. An expansive network of streets, buildings, utility mains, and public transit lines requires constant monitoring. Maintaining existing infrastructure assets, many of which are decades beyond their intended lifespan, requires significant investments, but is essen-tial to the city’s vitality and far less costly than replacing these assets when they fail.
Greenworks acknowledges that in addition to requiring routine maintenance, existing infrastructure must adapt to the changing needs of residents and an increasingly vola-tile climate. This adaptation requires enhanced stormwater management capacity to cope with more extreme weather and careful vulnerability assessments of a wide range of infrastructure assets.
state of Good repair in resilient Infrastructure
The replacement of the 40th Street Bridge connecting Mantua to East Parkside will be complete in 2012.
Infrastructure Assets Capital Value Amount in soGr Equal to
sEPTA $25 billion x 67% SoGr $16.75 billion
Public Property $6.3 billion x 52% SOGR $3.28 billion
PwD $23.9 billion x 98% SOGR $23.42 billion
streets & Bridges $10 billion x 67% SoGr $6.7 billion
ToTAl = $65.2 BIllIoN ToTAl = $50.15 BIllIoN (77%)

47
E C O N O M Y
47
E C O N O M Y
CliMaTe VariabiliTy and Change: a FraMeWorK For a CliMaTe-resilienT philadelphia
Understanding the risk to Philadelphia
Developing an understanding of the specific risks that climate change poses to Philadelphia and the region is an important first step in making the city more resilient. Regional reports indicate that climate hazards such as increased heat, precipitation, and drought will become more frequent and intense in the Northeast.
Extreme heat is responsible for more deaths in Pennsylvania than all other natural disasters combined. Projections based on the low and high global greenhouse gas emis-sion scenarios published by the Union of Concerned Scientists estimate that by the end of this century, average summer temperatures in Pennsylvania will increase by 5-11 °F. Philadelphia has experienced an average of 25 to 30 days above 90 °F over the past 45 years, although 2010 was a record year with 55 days above 90 °F. By late this century under the high emissions scenario, the Union of Concerned Scientists projects that Philadelphia will face more than 80 days above 90 °F and nearly 25 days above 100 °F. Prolonged excessive heat poses particular health risks for Philadelphia’s vulnerable populations and may adversely affect the City’s infrastructure and opera-tions. Potential effects on infrastructure include power outages, weathering of vehicles, pavement buckling, and damage to roads and bridges, all of which can potentially dis-rupt important City services.
Flooding is another significant concern for Philadelphia. The 100-year floodplain covers 18.8 square miles within the city. The U.S. Global Change Research Program reports a 67% increase in the amount of heavy precipitation events from 1958 to 2007 for the Northeast region of the U.S. Pennsylvania’s Climate Change Action Plan pre-dicts that precipitation will become more extreme in the future, with longer periods of drought interspersed by an increased frequency of extreme precipitation events.
Sea level rise and the potential for storm surges because of extremely high winds that accompany a hurricane or Nor’easter pose additional challenges for a city nestled between two rivers and 60 miles from the Atlantic coast. Philadelphia2035, the City’s comprehensive plan, notes that a predicted rise in sea level of 1 meter by the year 2100 will place homes, businesses, and facilities in Philadelphia’s tidal areas at greater risk for regular tidal inundation and periodic flooding. Sea-level rise also poses chal-lenges to the ecologies of tidal wetlands and the salt line on the Delaware River. The damage caused by Hurricane Irene and Tropical Storm Lee in September 2011 pro-vide recent indicators of the damage that may result from periods of intense rain and high winds.
Why Prepare for Climate Change?
Climate change impacts pose significant social, economic, and environmental risks. The Government Accountability Office reports that 88% of all property losses paid by insurers between 1980 and 2005 were weather-related. According to the National Oceanic and Atmospheric Administration, in 2011 ten separate weather events in the U.S. resulted in over $1 billion in damage each.
The City is entrusted to guide physical development to manage risks from natural haz-ards, including long-term environmental risks associated with climate change. As noted in Philadelphia2035, increased susceptibility to flooding, sea-level rise, land subsidence, and higher temperatures requires the City to consider appropriate adaptive measures. Enhancing the resilience of key infrastructure and services in the face of a changing climate is essential as City departments strive to maintain, operate, design, and build infrastructure that will support and strengthen Philadelphia’s growing economy.
Coordinating greenhouse gas Mitigation efforts with Adaptation strategies
Mitigation strategies generally focus on reducing greenhouse gas emissions, while adap-tation strategies focus on adapting to climate change and resulting impacts. A successful climate change plan requires the City to develop and operationalize strategies for both mitigating emissions and increasing resilience to the impacts of climate change.
Hurricane Irene showed the impor-tance of climate resilience planning for
Philadelphia’s infrastructure.
Phot
o b
y se
PtA
Phot
o b
y M
os

48
Philadelphia’s Climate Mitigation and Adaptation Initiatives
Philadelphia is already taking steps to address climate change. Greenworks initiatives that reduce green-house gas emissions by lowering energy use and decreasing vehicle miles traveled are examples of efforts that mitigate climate change. Some mitigation initiatives also have adaptation benefits. Cool roofs, for example, mitigate climate change by reducing energy use and greenhouse gas emissions, while also allowing residents to adapt more comfortably to a warmer climate by reducing indoor air temperatures. Sometimes, however, mitigation and adaptation strategies contradict one another. For example, an adaptation strategy to increase the number of cooling centers to respond to more frequent heat waves may inadvertently increase greenhouse gas emissions unless existing facilities are retrofitted to minimize energy use.
Green City, Clean Waters
Rain Gardens
Heat Alert System
Heat Emergency Cooling Locations
Heat Education Campaign
Water Quality Standards
Emergency Plans
Percy Street Porous Pavement
Stream Restoration
Get Healthy Philly
Resilient Infrastructure:South Street and 40th
Street Bridge
Energy-Efficient Capital Investments
Energy Load Demand Management
Greenworks Loan Fund
GHG Working Group & Carbon Disclosure Project
Greenhouse Gas Inventories
Smart Meters
Energy Efficiency Fund
EnergySense and Smart Ideas
Recycling
Integrated Utility Bill Management System
MITIGATION ADAPTATIONEnergyWorks
City Car Management Plan
LED Traffic Lights
LEED Legislation
Greenworks Rebate Fund
Weatherization Assistance Program
Solar/PV Projects
Green2015
Green Streets, Alleys, Roofs, Parking
Air Management Services Smog Reduction Plan
Anti-idling ordinance
Reduce Vehicle Miles Traveled & BicycleCommuting
Hybrid Diesel Buses
EnergyWorks
City Car Management Plan
LED Traffic Lights
LEED Legislation
Greenworks Rebate Fund
Weatherization Assistance Program
Solar/PV Projects
Green2015
Cool Roofs Ordinance
Plant One Million, TreePhilly
Green Streets, Alleys, Roofs, Parking
Air Management Services Smog Reduction Plan
Anti-idling ordinance
Reduce Vehicle Miles Traveled & Bicycle Commuting
Hybrid Diesel Buses
MITIGATION
Energy-Efficient Capital Investments
Energy Load Demand Management
Greenworks Loan Fund
GHG Working Group & Carbon Disclosure Project
Greenhouse Gas Inventories
Smart Meters
Energy Efficiency Fund
EnergySense and Smart Ideas
Recycling
Integrated Utility Bill Management System
ADAPTATION
Green City, Clean Waters
Rain Gardens
Heat Alert System
Heat Emergency Cooling Locations
Heat Education Campaign
Water Quality Standards
Emergency Plans
Percy Street Porous Pavement
Stream Restoration
Get Healthy Philly
Resilient Infrastructure:South Street and
40th Street Bridge
nexT sTeps: planning For a More resilienT philadelphia
Nearly every initiative in Greenworks helps Philadelphia become more climate resilient. While additional research and studies will help us better understand climate risks, we know enough now to opportunisti-cally adapt as we simultaneously design plans and strategies for longer-term adaptation efforts. In 2012, the City will begin a comprehensive planning effort to leverage existing efforts to reduce Philadelphia’s vulnerability and to identify opportunities for adaptation across City departments. The City aims to publish a climate adaptation plan in 2013 and achieve progress in the key areas outlined below by 2015.
Key areas of philadelphia’s Climate adaptation process
• Review existing regional weather and climate-related vulnerabilities under various projected climate scenarios
• Review and screen current City department measures to reduce risks of climate and weather-related vulnerabilities
• Develop approaches for mainstreaming climate adaptation strategies into planning, design, operation, and maintenance activities of city departments
• Support climate resiliency through information sharing, partnership building, education, and outreach
• Work with stakeholders to effectively communicate climate-related information
• Develop recommendations for future measures deemed necessary
Dia
gra
m C
ourt
esy
of C
olum
bia
Uni
vers
ity
M.s
.
sust
aina
bili
ty M
anag
emen
t Pr
ogra
m, 2
011

T A R G E T 1 3
49
E C O N O M Y
i n i t i at i V e P r o G r e S S 2 0 1 2
neW | Develop Climate Adaptation Plan in 2011, MoS worked with students from columbia university’s earth institute to conduct base-line research on climate adaptation for Philadelphia. in 2012, MoS will work with city depart-ments to develop a comprehensive framework for climate adaptation that addresses specific vulnerabilities and adaptation strategies.
Acknowledge Climate Change in Infrastructure Planning
SePta, the Delaware Valley regional Planning commission, and icf international were awarded funding from the federal transit administration to conduct an infrastructure vulnerability and risk assessment of the Manayunk/norristown line, which is highly susceptible to increased fre-quency of flooding along the Schuylkill River.
Improve road Maintenance and Upgrade Bridges
the Streets Department repaved 64 miles of streets in fiscal years 2011 and 2012. the 40th Street bridge replacement will be complete by the end of 2012, along with improvements to the Walnut Street bridge. new bridges under construction include the Scuylkill river trail pedestrian bridge, to be complete in 2012, and the Schuylkill river boardwalk Project, slated for completion in 2014.
Invest in Public Property Management systems
future initiative.
I n I t I a t I v e P R O G R e S S
in P
ro
Gr
eSS
futu
re
P R O F I L E : Philadelphia Industrial Development Corp. Believes Sustainability is Smart Business
The Philadelphia Industrial Development Corp. (PIDC) has embraced the sustainability goals set by Greenworks. PIDC works closely with the City, primarily through the Commerce Department, to implement key economic
development priorities, including promoting the clean economy. Below is a sum-mary of some of PIDC’s sustainability work and future plans.
proViding FinanCing For sUsTainable aCTiViTies
Investing in sustainable Businesses
PIDC provides growth capital to sustainable local businesses to support investments such as building acquisition, renovations, and equipment purchases. For example, with financial support from PIDC, clothing and accessories brand SA VA is now manu-facturing 95% of its goods in downtown Philadelphia. PIDC also helped recycling services company Revolution Recovery acquire a new indoor conveyor belt system that allows it to move up to 250 tons of recyclable materials per day.
Financing energy efficiency retrofits and New Construction
PIDC has supported significant new green construction in Philadelphia through a vari-ety of low-interest financing programs and by acting as a conduit for tax-exempt debt for nonprofits. LEED-certified projects which PIDC has supported include Penn Jersey Paper’s 255,000-square-foot corporate headquarters and distribution center, Tasty Baking Company’s 350,000-square-foot baking and distribution center, and the Hotel Palomar by Kimpton.
PIDC co-manages the EnergyWorks Loan Fund (see page 13), providing low-interest capital for energy-efficient retrofits of commercial buildings. In partnership with the City and The Reinvestment Fund (TRF), PIDC plans to raise capital to continue com-mercial energy efficiency lending beyond American Recovery and Reinvestment Act funding and mainstream energy efficiency into the everyday capital market.
After acquiring a 30-acre site from PIDC, Penn Jersey Paper developed a 255,000-square-
foot corporate headquarters and distribution center that received LEED Silver certification.

50
Financing stormwater Management Practices
The Philadelphia Water Department (PWD) and PIDC created the Stormwater Management Incentives Loan and Grant Program (SMIP) in 2012 for non-residential PWD customers. SMIP stimulates investment in best management practices by provid-ing low-interest financing and grants for the design and construction of stormwater mitigation measures. The program launched with $10 million in funding, and has attracted high demand, receiving more than $20 million in requests. PWD and PIDC plan to continue the program in 2013 with additional financing.
Financing Access to Healthy and Local Food
PIDC provided loans for expansions of Weaver’s Way Co-op and Mariposa Co-op, and for the renovation of the Reading Terminal Market, which is widely used for the redemption of Supplemental Nutrition Assistance Program benefits. PIDC also pro-vided financing for grocery stores in underserved neighborhoods including the Fresh Grocer at Progress Plaza and the Superfresh in Northern Liberties.
Innovation in Industrial Parks
PIDC and PWD are exploring ways to support industrial businesses by using available vacant land at PIDC industrial parks to create smart and sustainable stormwater man-agement infrastructure.
the Navy Yard Clean energy Campus
The Navy Yard, a 1,200-acre mixed-use property located on the site of the former Naval Shipyard complex in South Philadelphia, is emerging as one of the country’s leading clean energy campuses. The Navy Yard is home to the national Energy Efficient Buildings Hub and nearly 20 organizations and 2,000 employees related to the clean energy sector. By bringing business, government, and academic institutions together, The Navy Yard Clean Energy Campus fosters collaborations that demon-strate and deploy energy efficiency and clean technology solutions. PIDC plans to expand availability of both early stage capital and small office space at The Navy Yard for clean technology companies.
Lower schuylkill river District Master Plan study
The Lower Schuylkill is a large, industrial district facing changes in site ownership and land use. The Philadelphia City Planning Commission, the Philadelphia Department of Commerce, and PIDC created the Master Plan Study, a blueprint for high-quality and sustainable redevelopment of the 4,100-acre corridor along the east and west banks of the Lower Schuylkill River to accommodate the next generation of commer-cial and industrial activity in Philadelphia.
EnergyWorks Projects• 8 Projects • Total energyWorks investment
$15,596,350 o PiDc inVeStMent $5,262,950 o TRF inVeSTMenT $10,333,400
SMIP Projects• Four approved projects with a total
investment of $663,590• 48 applications received
LEED projects • PiDC has supported 22 LeeD-
certified projects as of May 2012
P I D C B Y T H E N U M B E R S
[LEFT]: PIDC’s SMIP funding promotes installation of stormwater manage-
ment technologies such as the pervious pavement on Percy Street in South
Philadelphia. Pervious pavement diverts stormwater from the sewer by allowing it to infiltrate directly into the ground.
[RIGHT]: PIDC supported the renova-
tion of Reading Terminal Market, which provides access to fresh, healthy food
to more than one hundred thousand customers each week.

T A R G E T 1 4 : Increase the Size of the Regional Clean Economy by 25%
51
E C O N O M Y
Clean eConoMy groWs in The CiTy and The region
Greenworks recognizes the value of sustainability as a competitive advantage for Philadelphia and seeks to increase the number of workers and businesses in the clean economy. Data captured by the U.S. Bureau of Labor Statistics (BLS) and reported in 2011 by the Brookings Institution indicate that between 2003 and 2010, despite an overall decline in employment, Philadelphia’s regional clean economy grew. By 2010, the clean economy employed 54,325, or 2% of workers in the Philadelphia metropoli-tan statistical area (MSA), which includes parts of New Jersey and Delaware, making the region fifth among the 100 largest MSAs in overall size of the clean economy. The clean economy share of regional employment was slightly larger than the information services sector, and more than half of the construction and mining industry.
establishing a New Clean economy Baseline
In 2009, Greenworks set a goal to double the number of green jobs in the City of Philadelphia by the year 2015 from a 2005 baseline of 14,000 jobs. The methodol-ogy used to establish this baseline is now outdated, and the ambitious growth goal was set in a pre-recession context that assumed strong overall economic gains. Going forward, Greenworks seeks to sustain the recent growth of new and existing clean indus-tries and to increase the relative share of this sector in the local and regional economy, with the goal of the clean sector representing 2.5% of the overall regional economy by 2015. The Mayor’s Office of Sustainability (MOS) recognizes that to reach this goal, the City of Philadelphia must promote expansion of the clean economy within Philadelphia, as well as collaborate with partners to support regional growth strategies.
• Greenworks baseline (2010)
2%
• Current (2012)
[2010 Data Most recent available]
• 2015 Target
2.5%
M E T R I C S
clean Sector Share of regional economy
clean Sector Share of regional economy
What is the Clean Economy?
Greenworks defines sustainable businesses and the clean economy using the industry standard blS definition of green jobs to ensure consistency among regional, state, and national clean economy met-rics reporting. according to the inclusive blS definition, the clean economy is comprised of jobs and businesses that produce goods or provide services benefitting the environment or conserving natu-ral resources, and jobs in which workers’ duties involve making their establishment’s production pro-cesses more environmentally friend-ly or use fewer natural resources. occupations that fall into these categories range from renewable energy production, natural resource management, and weatherization, to recycling, sustainable design, and reporting and compliance.
Percentage of overall Philadelphia MsA Economy by selected sectors
2010
0%
2%
4%
6%
8%
10%
0
5
10
15
20
New
Yo
rk
Los
Ang
eles
Bo
sto
n
Chi
cag
o
Phi
lad
elp
hia
Ho
usto
n
Was
hing
ton
DC
6.5
9.6
12.013.0
14.715.5
18.1United States Average
19.0
0%
2%
4%
6%
8%
10%Information
ServicesClean
EconomyConstruction and Mining
Manufacturing Financial Activities
Leisure and Hospitality
SECTOR
1.9% 2.0%
3.7%
7.0%7.5%
8.1%

52
Benchmarking and Measuring growth
To support the local and regional clean economy, MOS and its partners need more cur-rent and detailed information about the existing blend and scale of industries in this sec-tor. To establish a 2012 baseline from which to measure growth over time, MOS worked with the Philadelphia Workforce Investment Board (PWIB) and the Reed Group to administer a regional clean economy workforce survey that used a transparent, replicable methodology to document the number of workers and types of businesses participating in the clean economy. The survey definitions and terms align with those used by the BLS and the Pennsylvania Department of Labor & Industry.
In spring 2012, MOS distributed the clean economy workforce survey to a sample group including thousands of businesses in Bucks, Chester, Delaware, Montgomery, and Philadelphia counties using stratification along industry lines and employer size. Analysis of survey responses will gauge the size and scale of clean economy activity in the region and identify the most common clean economy occupations and industries. MOS plans to issue a report summarizing survey results in fall 2012. The new information will allow MOS, PWIB, and other workforce partners to make informed decisions in collective efforts to sustain growth of businesses in the clean sector.
Bringing energy efficient technologies to Life
Using funds from the Energy Efficiency and Conservation Block Grant, the City of Philadelphia partnered with the Philadelphia Industrial Development Corporation (PIDC) and Ben Franklin Technology Partners of Southeastern Pennsylvania to develop the Greenworks Pilot Energy Technology (G-PET) program. G-PET grants funded five businesses to complete projects located in Philadelphia that accelerated the market intro-duction of new, energy efficient products and services. The goal of G-PET, the first pro-gram of its kind in the United States, was to support demonstration projects by relatively untested companies with technically sound products and strong business plans. G-PET helped companies find first users for new technologies by absorbing the cost and risk of initial adoption. By supporting these companies in the early stages of their business development, the City not only promoted commercialization of energy efficiency tech-nologies, but also encouraged businesses poised to grow in Philadelphia.
Though G-PET was made possible with one-time American Recovery and Reinvestment Act dollars, it allowed the City and its partners to administer and learn from an innova-tive, first-phase program model. The City is analyzing the program and considering funding sources for a second phase.
[TOP]: Waste Management’s advanced Philadelphia Material Recovery Facility processes
City collected single stream recycling.
[BOTTOM]: An EnergyWorks contractor per-forms a home energy audit using a thermal
imaging camera to detect air infiltration.
Metro Areas with the Most Clean Economy Jobs, 100 largest Metros
2010
CLEaN CLEaN SHarE mETro arEa ECoNomy JoBS of aLL JoBS (%)
new york/northern new Jersey/long island [ny-nJ-Pa] 152,034 1.8%
los angeles/long beach/Santa ana [ca] 89,592 1.7%
chicago/Joliet/naperville [il-in-Wi] 79,388 1.8%
Washington/arlington/alexandria [Dc-Va-MD-WV] 70,828 2.3%
Philadelphia/camden/Wilmington [Pa-nJ-De-MD] 54,325 2.0%
San francisco/oakland/freemont [ca] 51,811 2.7%
atlanta/Sandy Springs/Marietta [Ga] 43,060 1.9%
boston/cambridge/Quincy [Ma-nH] 41,825 1.7%
Houston/Sugar land/baytown [tx] 39,986 1.6%
Dallas/fort Worth/arlington [tx] 38,562 1.3%
source: Brookings-Battelle Clean economy Database and Moody’s Analytics
Phot
o b
y M
os
Phot
o b
y M
os

T A R G E T 1 4
E C O N O M Y
53
i n i t i at i V e P r o G r e S S 2 0 1 2
Conduct a Market Analysis the Mayor’s office of Sustainability, working with the Philadelphia Workforce investment board and the reed Group, conducted a regional clean economy and employment survey in spring 2012.
Create a Green Economy stakeholder Task force
the Mayor’s office of Sustainability continues to work with the Sustainable business network of Greater Philadelphia which convenes the Green economy task force, a coalition launched in 2008.
Create a regional Green Jobs Training Center the energy coordinating agency opened the John S. and James l. Knight Green Jobs training center in 2010.
Make strategic Programmatic Investments to Increase Market Demand
energyWorks increases demand in the energy efficiency sector by streamlining the process for customers, providing low-interest loans through Keystone HelP, and investing in effective mar-keting to raise awareness among homeowners. in 2012, the Mayor’s office of Sustainability and Sustainable business network published a study identifying key barriers to participation in the residential retrofit market.
raise Awareness About the Clean Economy Mayor nutter, city officials, and partners continue to highlight the economic and workforce development opportunities and the outcomes of initiatives and investments in the Philadelphia region.
re-brand Philadelphia for Business Development Efforts
Smart city, Smart choice, a joint initiative of the commerce Department and the Philadelphia industrial Development corporation, launched 2010. the campaign highlights Philadelphia’s assets that support the clean economy sector.
support and Connect Energy research and Academia
the energy efficient buildings Hub (eeb Hub), formerly called the Greater Philadelphia innovation cluster for energy-efficient buildings, is a consortium of academic institutions, federal laborato-ries, global industry partners, regional economic development agencies, and others located at the navy yard in Philadelphia. With funding from the u.S. Department of energy, the eeb Hub works to improve energy efficiency in buildings and promote regional economic growth and job creation.
neW | Conduct regional Clean Economy survey Every Two Years
MoS and partners will update the 2012 survey in 2014 to track trends and outcomes in the clean economy.
I n I t I a t I v e P R O G R e S S
in P
ro
Gr
eSS
co
MP
lete
Dfu
tur
e
NovaThermal Energy
novaThermal energy, a Philadelphia-headquarted company, holds an exclusive license for a wastewater geothermal energy efficiency technol-ogy used extensively in china but new to the u.S. market. the system combines a water source heat pump with a patented filtration device to transfer heat energy directly from sewage. novathermal’s technology taps into existing municipal sewer infrastructure, eliminating the land area requirements and cost of traditional geothermal piping or borefields, mak-ing the system feasible and affordable for large-scale urban applications.
novathermal sought to develop a project to prove the technology’s energy savings in the u.S. after receiving $150,000 in funding through G-Pet, novathermal was able to partner with the Philadelphia Water Department at the Southeast Wastewater treatment Plant to deploy the first commercial-scale wastewater geothermal system in the u.S. at the Southeast Plant, the system will demonstrate its ability to provide heat at approximately 50% of current cost. novathermal is participating in the residency program at Goodcompany, the region’s first incubator specifi-cally designed to cultivate environmental and social entrepreneurs.

E N G A G E M E N TGoAl: PHILADELPHIANS UNITE TO BUILD A SUSTAINABLE FUTURE
54
T A R G E T 1 5 : Philadelphians Unite to Build a Sustainable Future
Food Co-ops Flourish in PhiladelphiaPhiladelphia’s food co-ops are creating more resilient and healthy communities by working to provide several neighborhoods access to fresh and nutritious produce. In Northeastern Philadelphia, members of the Kensington food Co-op are raising funds to purchase equipment, buy a building, finance construction, and hire a general manager. With the help of its public outreach team, the South Philly food Co-op has acquired 250 founding member-owners who have invested in what will eventually be a community food store. food co-op development has also extended west of the Schuylkill river to Baltimore avenue, where mariposa food Co-op recently opened a larger storefront to better serve its 1,300 members and the greater West Philadelphia community. The three co-ops, along with others, formed the Philadelphia-area Cooperative alliance to improve the Philadelphia region by growing the cooperative economy.
Greenworks Rebates Help Save Energy Across PhiladelphiaThe Greenworks rebate fund assists small businesses across Philadelphia with energy retrofits by refunding up to 50% of the cost for qualifying projects. as of spring 2012, 32 projects have been approved that will reduce annual energy use in Philadelphia by nearly 260 megawatt hours.
Whipped Bakery, at the corner of Belgrade and Berks streets in fishtown, received a Greenworks rebate, funded by the mayor’s office of Sustainability’s Energy Efficiency and Conservation Block Grant, for the installation of solar photovoltaic arrays on two sides of their building. The solar panels will yield a 70% reduction in energy consump-tion totaling 2,786 kilowatt hours annually. The Ethical Humanist Society installed new radiator valve heating controls and windows in its facilities at 1906 rittenhouse Square. The investment will yield a 39% decrease in energy consumption with an annual cost savings of $5,487 and carbon dioxide emissions reductions of 24,810 pounds. PTr Baler installed energy-efficient exterior lighting on its plant at 2207 E. ontario Street. The new lighting will yield a 55% reduction in energy consumption with an annual sav-ings of $5,043 and carbon dioxide emissions reductions of 57,771 pounds.
The expanded Mariposa co-op opened in March 2012, increasing healthy food options
in West Philadelphia.
Greenworks sets ambitious but achievable goals. Thanks to the shared commitment and efforts of
dedicated Philadelphians working on the ground in the city’s neighborhoods, communities, schools,
and businesses, we’re on our way to becoming the greenest city in America. Here are a few great
examples.

55
E N G A G E M E N T
Sustainability WorkshopThe Sustainability Workshop opened in September 2011, serving 28 high school seniors from West and South Philadelphia. about two-thirds of every school day is spent working on projects addressing a complex, real-world problem related to sus-tainability, and resulting in products or solutions that can be assessed using real-world standards. for the Bright Ideas project, students developed a plan for a business that will replace incandescent light bulbs with high-efficiency LED bulbs at no cost to hom-eowners, generating revenue through energy cost savings. The Bright Ideas team was among five finalists in the Conrad foundation Spirit of Innovation awards, an interna-tional business plan competition for high school students.
Philadelphians Work to Green Their NeighborhoodsPhiladelphia boasts numerous community and neighborhood groups working hard to implement Greenworks goals. Great examples include, but are by no means limited to, neighborhood groups enrolling in EnergyWorks Select Partnerships. members of Queen Village Neighborhood association, Passyunk Square Civic association, Sustainable university City District, Weavers Way Co-op, and the Energy Co-op have joined the program to access EnergyWorks discounts on energy assessments and ener-gy efficiency upgrades. The university City District has established sustainability goals that mirror Greenworks and tracks and reports the neighborhood’s progress annually. members of the South of South Neighborhood association (SoSNa) were impressed by the City’s BigBelly solar-powered compacting litter baskets. When SoSNa dis-covered the City couldn’t fund installations outside major commercial corridors, they took matters into their own hands and raised money for three BigBelly receptacles in their neighborhood, which the City installed and now empties. The Passyunk avenue revitalization Corporation (ParC), in addition to installing solar panels on its properties (see page 18), plants trees, provides cleaning service for the neighborhood, revitalizes green space, and also provides funds to surrounding civic associations to support their greening efforts.
U.S. Forest Service Philadelphia Urban Field StationIn march 2011, the u.S. forest Service formalized a partnership with the Pennsylvania Horticultural Society to open the Philadelphia urban field Station. The goal of the field Station is to engage the greater Philadelphia region through science to promote ecological health and diversity. In march 2012, the field Station awarded the first round of Sustainability Science fellowships, $5,000 grants for Philadelphia-area students to complete research and science-delivery projects. research conducted at the facility and through the fellow-ships will contribute to a large landscape assess-ment of the ecological state of the Delaware river Basin. Study topics will include air and water qual-ity, soils and nutrient cycles, and forest conditions and structures.
The Sustainability Workshop, located at the Navy Yard in South Philadelphia, is an experien-
tial learning school aiming to unleash the cre-ative and intellectual potential of young people
to solve the world’s toughest problems.
The ecosystems in Fairmount Park are part of the urban ecological resources that the U.S. Forest Service Philadelphia Urban Field Station seeks to study and promote.
Phot
o b
y su
stai
nab
ility
Wor
ksho
p

“Without our Greenworks rebate, we would not have been able to switch over to high-efficiency gas units for our apart-ment building, which provides critical operating funds for our nonprofit organization. This project helped stabilize our budget during these rough economic times as well as save our organization and our tenants money!”
“The City’s Facebook posts are very informative in terms of ongoing projects, events, and success stories. Thank you for engaging the community!”
Survey Says Philadelphians Care about SustainabilityIn february 2102, the Pew Charitable Trusts released a public opinion poll of 1,600 random Philadelphia residents. Seventy-four percent of respondents reported that since mayor Nutter took office, there have been major or minor improvements in “making Philadelphia a greener city that is more environmentally friendly and energy efficient.”During the spring of 2012, the mayor’s office of Sustainability conducted a detailed survey to assess Philadelphians’ sustainability experiences and priorities. The more than 300 respondents identified alternative energy generation and energy con-servation, sustainability outreach and education, transportation, water quality, and the clean economy as their top priorities. We’re always interested in your feedback. Get in touch with us at [email protected].
Rebuilding Together Philadelphiarebuilding Together Philadelphia (rTP) has been working for 24 years to create safe, warm, and dry living spaces for homeowners. as of June 2011, rTP volunteers had served 1,033 homeowners, contributed 404,568 volunteer hours, and provided home-owners with $22,723,000 worth of repairs including projects that help low-income com-munities improve their indoor and outdoor environments and live more sustainably. rPT volunteers, along with public, private, and nonprofit partners including the Philadelphia Water Department, Local Initiatives Support Corporation, and others, have helped hom-eowners to plant trees, clean vacant lots, install stormwater planters, weatherize homes, and learn about energy efficiency and healthy food access. Since 2010, rTP has com-pleted greening projects in mantua, West Philadelphia, and Germantown.
Citizens Planning InstituteThe Citizens Planning Institute (CPI) is the official educa-tion and outreach arm of the Philadelphia City Planning Commission. The focus of CPI is to educate citizens about how good planning and implementation help to create communities of lasting value. Since graduating from CPI, Drew Kondylas has become significantly more involved in his francisville community. Kondylas joined the francisville Neighborhood Development Corporation (fNDC) Zoning and Branding Committees; formed friends of ogden Park with a group of neighbors to protect 12 parcels of land that offer much-needed green space within the neighborhood; and became a Neighborhood Liaison for the City’s 311 pro-gram. applying to CPI is a great way to become a sustain-ability champion in your neighborhood.
56
[ABOVE]: Respondents to the MOS spring 2012 survey were enthusiastic about engag-
ing in Philadelphia’s work to become the greenest city in America.
[TOP]: Volunteers prepare to plant trees, clean vacant lots, and install flow-through
planters during Rebuilding Together Philadelphia’s Green Block Build on
March 30, in Mantua.
[BOTTOM]: CPI graduate Drew Kondylas and Francisville Neighborhood
Development Corporation volunteers and staff install a new on-street recycling bin
during the 5th Annual Philly Spring Cleanup.
Phot
o b
y M
os
Phot
o b
y FN
DC

T A R G E T 1 5
Arthur Ashe Youth Tennis and Educationarthur ashe youth Tennis and Education (aayTE) offers a variety of athletic, education-al, and leadership programs for thousands of young people in Philadelphia each year. In 2011, aayTE partnered with uGI Performance Solutions to install 1,200 solar photo-voltaic panels on the roofs of its East falls facility. The $1.6 million project required per-sistence along with an innovative, multi-party financing model. The project succeeded, despite several setbacks with the state solar market, and went online in october 2011. aayTE expects to cut electricity consumption by 50 percent in 2012 and plans to spend the savings on expanded programs and services for the children it serves.
Grid Magazine alex mulcahy started Grid magazine in 2008 to fill what he saw as a critical gap in media coverage of sustainability issues in Philadelphia. four years later, with the release of issue No. 38 in may 2012, Grid has grown to a circulation of 30,000 in more than 400 locations. Grid has featured topics from worm composting to sustainable fashion, and every issue profiles local practitioners along with practical tips on topics like home energy efficiency and backyard gardening. With his latest venture, a partner-ship with Sustainable 19103 called Grid alive, mulcahy and co-host Nic Esposito fur-ther engage Grid’s audience by offering an evening of live entertainment each month featuring interviews with the people and businesses in the latest issue of Grid.
Climate & Urban Systems PartnershipLed by The franklin Institute, partners in the Climate & urban Systems Partnership (CuSP) are establishing local networks in four urban centers: Philadelphia; Pittsburgh; Queens, N.y.; and Washington, D.C. In Philadelphia, educators, community groups, City agencies, and policymakers are working together to create and disseminate learner-focused climate education programs and resources for residents in pilot neighbor-hoods. CuSP aims to communicate the science of climate change in language that is meaningful and relevant to urban communities. after completing pilot work, CuSP will apply lessons learned and expand the education campaign throughout Philadelphia.
i n i t i at i V e P r o G r e S S 2 0 1 2
Publish Annual report Greenworks Update and 2012 Progress Report released 2012.
Develop social Marketing and Public Education Campaigns
each month MoS sends an electronic newsletter to thousands of subscribers. MoS continues to disseminate Greenworks on the Ground information and to use twitter, facebook, Vimeo, youtube, and www.phila.gov/green as outreach tools.
reach out to stakeholders in 2012, MoS convened external stakeholder meetings on 10 topics and released a stakeholder survey to gather input on Greenworks progress to date and desirable additional goals.
regularly Update website MoS continues to add new resources to www.phila.gov/green.
Use Data to Measure results Greenworks Philadelphia Update and 2012 Progress Report includes data measurements for each target.
I n I t I a t I v e P R O G R e S S
in P
ro
Gr
eSS
co
MP
lete
D
57
[TOP]: In addition to tennis and leader-ship skills, youth can learn about alternative energy generation at AAYTE which recently
installed a 350 mWh solar array.
[BOTTOM]: Alex Mulcahy, publisher of Grid magazine, keeps Philadelphians up to
date on sustainability with informative issues and events.
Phot
o b
y G
rid

w w w . p h i l a . g o v / g r e e n