grid and market services from the edge
TRANSCRIPT

52 ieee power & energy magazine july/august 20211540-7977/21©2021IEEE
By Michael Z. Liu, Luis (Nando) Ochoa, Shariq Riaz, Pierluigi Mancarella, Tian Ting, Jack San, and John Theunissen
Grid and Market Services From the Edge
Using Operating Envelopes to Unlock Network-Aware Bottom-Up Flexibility
©SHUTTERSTOCK.COM/SIRA ANAMWONG
TTHE PROLIFERATION OF DISTRIBUTED ENERGYresources (DERs) at the edge of the grid, such as resi-dential solar photovoltaics and batteries, has created the opportunity for aggregators to manage multiple customers (hereafter referred to as active customers) and their DERs to participate in energy and ancillary service markets and provide various local and system-level grid services. These aggregators strive to create a large portfolio involving thousands of active customers and thus achieve the flex-
ibility to create a substantial aggregated response at the system level.
At the same time, if this aggregated response is not ade-quately managed, the simultaneous power exports (or imports) can result in voltages and currents well beyond the limits of the distribution network. As the volume of DERs participat-ing in system and market operation increases, the more nec-essary it is to ensure network integrity. But the big barrier for most distribution companies is that they cannot directly control DERs or aggregators because of the unbundling rules of deregulated electricity markets.
Digital Object Identifier 10.1109/MPE.2021.3072819
Date of current version: 21 June 2021
july/august 2021 ieee power & energy magazine 53
Currently, a common solution to mitigate excessive power flows is a region-wide, fixed export limit at customer connection points (e.g., the 5-kW limit for single-phase con-nections in Australia). However, such a fixed limit can be overly prohibitive (as it is determined based on worst-case scenarios) and/or inadequate (as it can become outdated when DER penetration grows). To this end, an alternative approach called operating envelopes can become a more effective and efficient way to facilitate bottom-up system-level market participation and provision of grid services from the edge of the grid.
In this concept, distribution companies first calculate, in real time or day ahead, operating envelopes (time-varying export or import limits) at the connection point of the customers’ premises (where the meter is located). This information is then given to aggregators to consider as a constraint when deciding how to manage their DER portfolio for energy and ancillary services participation. Furthermore, local market and pricing mechanisms are envisioned to be managed by the distribution company, which could price network-related constraints and services in an integrated manner with wholesale energy and ancil-lary services.
A key advantage of the operating envelope approach is that it allows the distribution companies to ensure network integrity without having direct control of the DERs or the aggregator. This also enables maximization of the capacity that can be allocated in near real time to different DERs, thus maximizing the volume of flexibility that can be provided upstream. Moreover, the development of network-aware local services that are integrated with wholesale markets can increase the overall market efficiency across differ-ent “products” and the electricity value chain. This allows aggregators to improve their business case by co-optimizing their bids across multiple markets and increase profits for their customers.
This article provides foundational insights on what operating envelopes are and how they can facilitate the provision of flexibility and grid services and relevant mar-ket participation for DER aggregations. We discuss how operating envelopes could be practically implemented by industry, including an overall architecture and an example methodology for determining operating envelopes. We also look at the role of reactive power to access network capacity for provision of flexibility, the impact of flex-ibility temporal aspects on market interaction, and the
potential challenges that need to be overcome to make operating envelopes a reality.
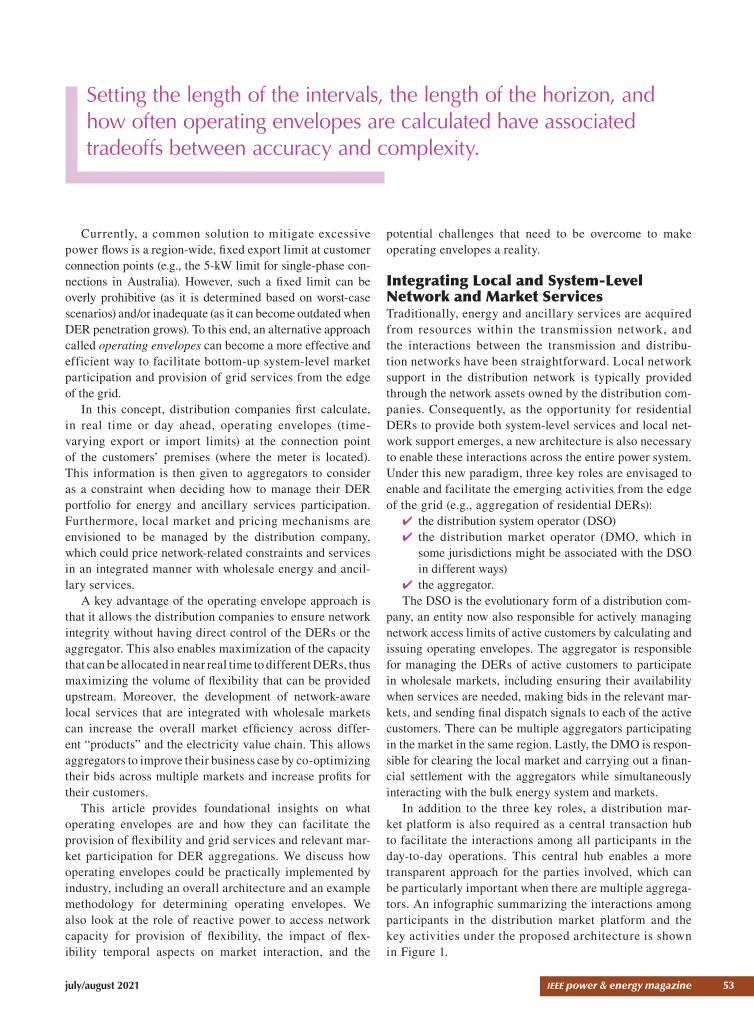
Integrating Local and System-Level Network and Market ServicesTraditionally, energy and ancillary services are acquired from resources within the transmission network, and the interactions between the transmission and distribu-tion networks have been straightforward. Local network support in the distribution network is typically provided through the network assets owned by the distribution com-panies. Consequently, as the opportunity for residential DERs to provide both system-level services and local net-work support emerges, a new architecture is also necessary to enable these interactions across the entire power system. Under this new paradigm, three key roles are envisaged to enable and facilitate the emerging activities from the edge of the grid (e.g., aggregation of residential DERs):
✔ the distribution system operator (DSO) ✔ the distribution market operator (DMO, which in some jurisdictions might be associated with the DSO in different ways)
✔ the aggregator.The DSO is the evolutionary form of a distribution com-
pany, an entity now also responsible for actively managing network access limits of active customers by calculating and issuing operating envelopes. The aggregator is responsible for managing the DERs of active customers to participate in wholesale markets, including ensuring their availability when services are needed, making bids in the relevant mar-kets, and sending final dispatch signals to each of the active customers. There can be multiple aggregators participating in the market in the same region. Lastly, the DMO is respon-sible for clearing the local market and carrying out a finan-cial settlement with the aggregators while simultaneously interacting with the bulk energy system and markets.
In addition to the three key roles, a distribution mar-ket platform is also required as a central transaction hub to facilitate the interactions among all participants in the day-to-day operations. This central hub enables a more transparent approach for the parties involved, which can be particularly important when there are multiple aggrega-tors. An infographic summarizing the interactions among participants in the distribution market platform and the key activities under the proposed architecture is shown in Figure 1.
Setting the length of the intervals, the length of the horizon, and how often operating envelopes are calculated have associated tradeoffs between accuracy and complexity.
54 ieee power & energy magazine july/august 2021
Sig
nal O
pera
ting
Env
elop
e
Act
ive
DE
RF
orec
ast
Pas
sive
DE
RF
orec
ast
Sub
mit
Who
lesa
le B
ids
Per
form
ance
Dat
aA
vaila
bilit
yF
orec
ast
Who
lesa
leD
ispa
tch
Sen
d S
tand
ing
Dat
a
Sen
d T
elem
etry
Dat
a
Def
ine
Ser
vice
Pos
t Ser
vice
Sel
ect
Agg
rega
tor
Dis
patc
hLo
cal S
ervi
ce
Sen
dV
erifi
catio
n
Sub
mit
Loca
lS
ervi
ce B
ids
Per
form
ance
Dat
aL
oca
l Ser
vice
s M
arke
t
Wh
ole
sale
Mar
ket
Inte
gra
tio
n
Por
tfolio
Dat
aE
nrol
lmen
t and
Reg
istra
tion
Rep
ortin
g an
dA
naly
tics
Who
lesa
le
Mar
ket
Leg
end D
MO
Inte
rfac
e
Agg
rega
tor
Inte
rfac
e
DS
O In
terf
ace
DM
O F
unct
ion
Agg
rega
tor
Fun
ctio
n
DS
O F
unct
ion
Dis
trib
uti
on
M
arke
tIn
terf
aces
Ag
gre
gat
or
Cus
tom
er R
esou
rce
Opt
imiz
atio
n
Ana
lyze
Cus
tom
erP
refe
renc
es
Ana
lyze
Who
lesa
le a
ndLo
cal S
ervi
ceO
ffers
For
ecas
tR
esou
rce
Ava
ilabi
lity
Opt
imiz
eC
usto
mer
Res
ourc
esan
d S
ubm
it B
ids
Mai
ntai
nR
esou
rce
Dat
aan
d S
end
Ser
vice
Ver
ifica
tion
Dis
patc
hC
usto
mer
Res
ourc
es
DS
O
Net
wor
k O
ptim
izat
ion
Ana
lyze
and
For
ecas
tN
etw
ork
Con
ditio
ns
Rec
onfig
ure
Net
wor
k
Opt
imiz
eN
etw
ork
Acc
ess
and
Cal
cula
teO
pera
ting
Env
elop
e
Def
ine
and
Pric
e Lo
cal
Ser
vice
Ver
ify a
nd S
ettle
Loca
l Ser
vice
Sel
ect
Agg
rega
tor
and
Dis
patc
h Lo
cal S
ervi
ce
DM
O
Mar
ket O
ptim
izat
ion
Ana
lyze
Who
lesa
le B
ids
and
Ope
ratin
gE
nvel
opes
Opt
imiz
eM
arke
t Val
ue o
fW
hole
sale
Bid
s
Coo
rdin
ate
With
Who
lesa
leM
arke
t Pric
ing
and
Req
uire
men
ts
Dis
patc
hW
hole
sale
Ser
vice
s
Mai
ntai
n S
ecur
eD
istr
ibut
ion
Mar
ket P
latfo
rm
Ass
ess
Com
plia
nce
and
Set
tleW
hole
sale
Bid
s
figu
re 1
. An
info
grap
hic
of th
e pr
opos
ed a
rchi
tect
ure.
july/august 2021 ieee power & energy magazine 55
From Fixed Import/Export Limits to Operating EnvelopesExisting aggregators typically control DERs without con-sidering the underlying constraints in distribution networks, such as voltage and thermal limits. This is justified because this is a systemic network issue that needs to be resolved in the presence of multiple competing parties. Also, aggrega-tors do not have access to the necessary data to model the network. Aggregators simply need to comply with the fixed export/import limits that are associated with the connection point of each DER customer in their portfolio.
For instance, in Australia, an aggregator can inject up to 5 kW per phase (a residential export limit used by many distribution companies today). However, given the variable nature of customer demand and local generation, such a fixed export limit can be too constraining at times when the network can deal with larger power flows (i.e., there is still available voltage headroom and thermal capacity). More-over, as DER penetration grows, fixed export limits might prove insufficient in ensuring network integrity since there will be more customers injecting power simultaneously.
Therefore, the use of operating envelopes—time-varying export/import limits—at the connection point of active cus-tomers can ensure network integrity while unlocking further flexibility, thus addressing the drawbacks of fixed limits.
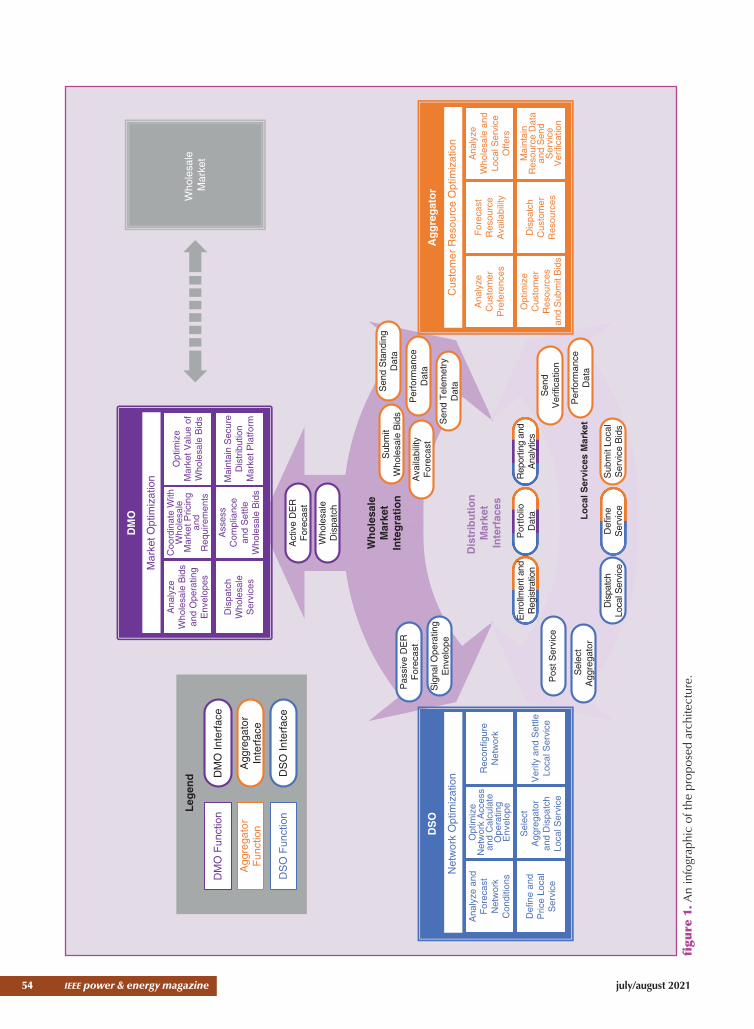
Operating Envelope Fundamental ConceptsThe concept of operating envelopes for active power and how they differ from the fixed export limits already employed by many distribution companies (in Australia and around the world) is illustrated by Figure 2. The low-voltage (LV) feeder shown in the figure has four single-phase customers, of which two are active customers, as denoted by 1 and 2 .
For each passive customer (i.e., nonaggregator-managed customer), the maximum permitted power exports/imports are fixed at all times, as per connection agreements with the distribution company and/or the local electricity regulations. These fixed limits for power imports/exports are shown as flat red lines.
On the other hand, for each active customer, the maxi-mum permitted power exports/imports are periodically (e.g., every 5 min) issued by the distribution company. Overall, this results in the time-varying red curves shown in Figure 2, which ultimately define the operating envelope for the corre-sponding active customer. The fixed limits of a passive cus-tomer are shown as gray lines to illustrate that the permitted range under the operating envelope can be larger or smaller than the fixed limits (as it depends on the available voltage headroom and thermal capacity throughout the day).
Given that the operating envelopes will be used by aggre-gators to determine the most profitable way of exploiting their DER portfolio, the values need to be made available in advance. This also means that certain information must be forecasted by the distribution company when calculating the operating envelopes for the horizon of interest.
Lastly, the operating envelope is defined by two limits, one for power imports and one for power exports. For illus-tration purposes, the focus of this article is on active power exports as it is expected to be a common service provided by aggregators to help the system balance demand and supply. The same principle also applies to power imports.
Calculating the Operating EnvelopesThe operating envelopes of active customers at a given time interval are calculated by assessing their maximum fea-sible exports. This can be achieved in different ways. For instance, the optimal power flow used at the transmission level could be adapted for three-phase LV feeders to deter-mine the maximum exports of each customer while still sat-isfying network constraints. Another, perhaps more practi-cal, approach is to run a series of power flow calculations that explore different combinations of the power exports from active customers.
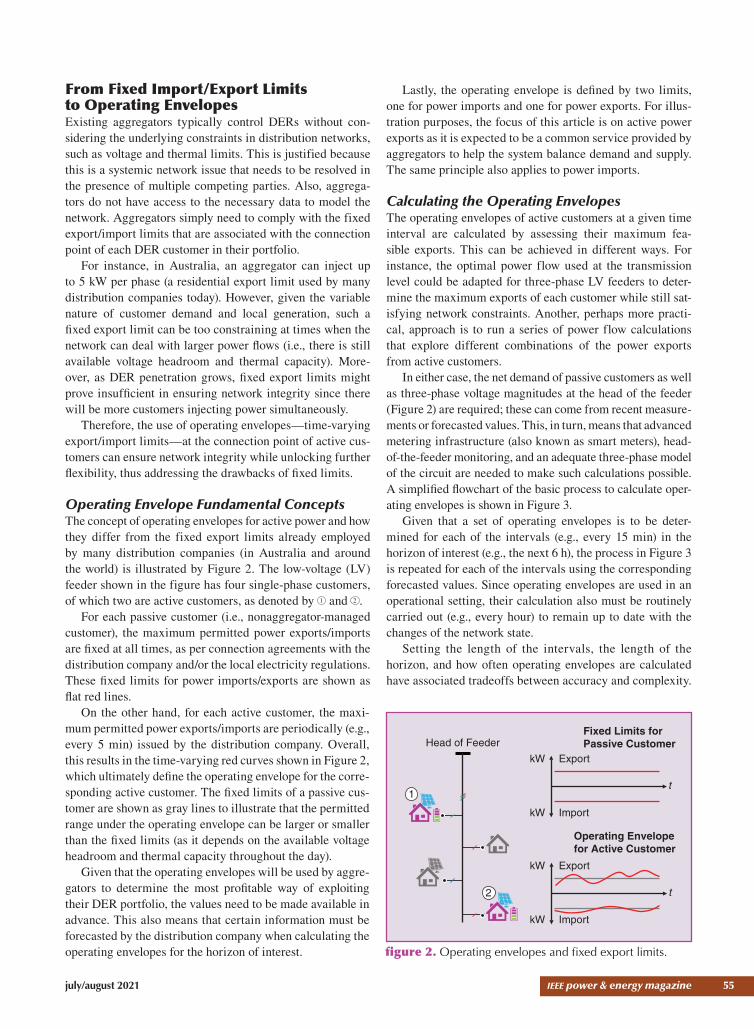
In either case, the net demand of passive customers as well as three-phase voltage magnitudes at the head of the feeder (Figure 2) are required; these can come from recent measure-ments or forecasted values. This, in turn, means that advanced metering infrastructure (also known as smart meters), head-of-the-feeder monitoring, and an adequate three-phase model of the circuit are needed to make such calculations possible. A simplified flowchart of the basic process to calculate oper-ating envelopes is shown in Figure 3.
Given that a set of operating envelopes is to be deter-mined for each of the intervals (e.g., every 15 min) in the horizon of interest (e.g., the next 6 h), the process in Figure 3 is repeated for each of the intervals using the corresponding forecasted values. Since operating envelopes are used in an operational setting, their calculation also must be routinely carried out (e.g., every hour) to remain up to date with the changes of the network state.
Setting the length of the intervals, the length of the horizon, and how often operating envelopes are calculated have associated tradeoffs between accuracy and complexity.
Operating Envelopefor Active Customer
t
Import
ExportkW
kW
Head of FeederFixed Limits forPassive Customer
kW
t
Import
Export
kW
1
2
figure 2. Operating envelopes and fixed export limits.
56 ieee power & energy magazine july/august 2021
For instance, the more frequently operating envelopes are calculated, the more accurate the forecasted values and, therefore, the more accurate the operating envelopes are expected to be. On the other hand, more frequent calculation of operating envelopes will require more frequent collection of the input data, which may not be feasible (or cost-effec-tive) for the existing supervisory control and data acquisition (SCADA) and advanced metering infrastructure of the dis-tribution companies.
Due to the radial and nonlinear nature of distribution networks, the exports of an active customer located at the end of a feeder will typically have a larger impact on volt-ages than those closer to the head of the feeder. This means that, depending on the objectives or principles adopted in the power flow-based algorithm (e.g., finding the largest power exports), the operating envelopes can be significantly differ-ent for certain active customers. This affects their potential
ability to participate in markets (and receive revenue), rais-ing fairness and equity concerns.
There is no generic answer to “what is the best objective function” as it depends on what matters to the stakehold-ers. It is extremely important to understand the implications of different objective functions on active customers and to make an informed decision on the choice of function.
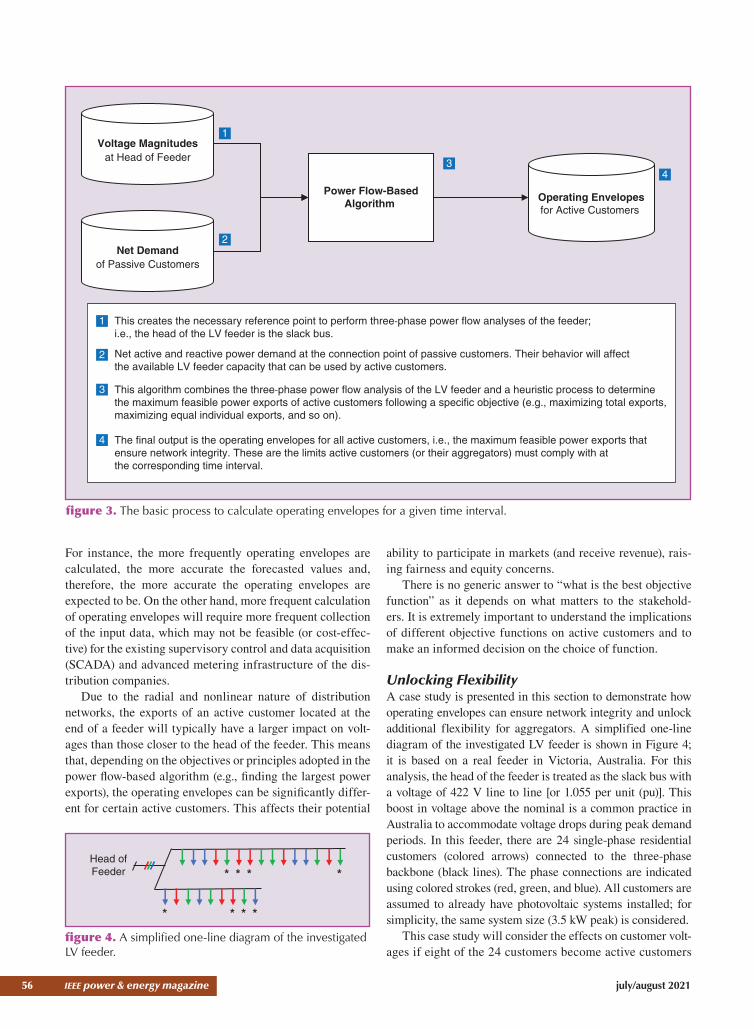
Unlocking FlexibilityA case study is presented in this section to demonstrate how operating envelopes can ensure network integrity and unlock additional flexibility for aggregators. A simplified one-line diagram of the investigated LV feeder is shown in Figure 4; it is based on a real feeder in Victoria, Australia. For this analysis, the head of the feeder is treated as the slack bus with a voltage of 422 V line to line [or 1.055 per unit (pu)]. This boost in voltage above the nominal is a common practice in Australia to accommodate voltage drops during peak demand periods. In this feeder, there are 24 single-phase residential customers (colored arrows) connected to the three-phase backbone (black lines). The phase connections are indicated using colored strokes (red, green, and blue). All customers are assumed to already have photovoltaic systems installed; for simplicity, the same system size (3.5 kW peak) is considered.
This case study will consider the effects on customer volt-ages if eight of the 24 customers become active customers
Net Demandof Passive Customers
Voltage Magnitudesat Head of Feeder
Operating Envelopesfor Active Customers
Power Flow-BasedAlgorithm
1
34
2
1
2
3
4
This creates the necessary reference point to perform three-phase power flow analyses of the feeder;i.e., the head of the LV feeder is the slack bus.
Net active and reactive power demand at the connection point of passive customers. Their behavior will affectthe available LV feeder capacity that can be used by active customers.
This algorithm combines the three-phase power flow analysis of the LV feeder and a heuristic process to determinethe maximum feasible power exports of active customers following a specific objective (e.g., maximizing total exports,maximizing equal individual exports, and so on).
The final output is the operating envelopes for all active customers, i.e., the maximum feasible power exports thatensure network integrity. These are the limits active customers (or their aggregators) must comply with atthe corresponding time interval.
figure 3. The basic process to calculate operating envelopes for a given time interval.
Head ofFeeder
figure 4. A simplified one-line diagram of the investigated LV feeder.

july/august 2021 ieee power & energy magazine 57
(i.e., purchase a battery system and engage with a DER aggre-gator). These active customers are denoted with an asterisk (*) in Figure 4. The considered battery system is rated at 7 kW/13.5 kWh, which is based on the options currently available in Australia. The effects on network voltages due to additional power exports by the aggregator (when providing local and/or system-level services) are analyzed for two dif-ferent scenarios:
1) adopting the existing fixed limit of 5 kW2) adopting operating envelopes.The comparison between these two scenarios is illus-
trated using Figure 5: the distribution of customer voltages at noon (during peak photovoltaic generation hours) is illus-trated in Figure 5(a), along with the statutory limit (red dot-ted line); the resulting operating envelope for the entire day is shown in Figure 5(b). Figure 5(a) shows that the existing export limit of 5 kW is unable to keep customer voltages within the statutory limit, while network integrity is ensured by adopting operating envelopes.
The maximum allowed export at noon is 3.5 kW. The necessary restrictions to ensure network integrity during peak photovoltaic generation hours are further illustrated in Figure 5(b). During solar hours, the operating envelope is below the 5-kW export limit. The figure also shows that the operating envelope can unlock further flexibility outside these hours for active customers and their aggregator (i.e., the operating envelope is above the 5-kW export limit).
Since the previous example considers the operat-ing envelopes to be the same for all active customers, the corresponding objective embeds elements of fairness. How-ever, different objectives can have different outcomes. For instance, consider an alternative objective: maximize the sum of power exports from active customers, disregarding fairness. Using this objective, Figure 6 shows the resulting operating envelopes. When the objective is to maximize the sum of power exports, it can result in a large disparity among active customers.
An active customer located at the far end of the feeder cannot export any power between noon and 3 p.m. How-ever, an analysis shows that the sum of power exports is larger than that obtained with the previous objective. For instance, at noon, the sum of exports is close to 56 kW, compared with only 28 kW (3.5 kW times eight) when the objective is to allocate the same operating envelope for all active customers.
Flexibility and Reactive Power Modeling
Active and Reactive Power Interaction in DER-Rich Distribution NetworksReactive power plays a key role in the voltage profile man-agement of distribution networks, which is currently man-aged through a combination of reactive power compensation devices and on-load tap changer-fitted transformers. In the wake of increasing DERs, voltage-rise issues are the main cause of concern for the DSO. They are the chief drivers for the establishment of the 5-kW static export limits in Aus-tralia. However, an inverter-based DER has the poten-tial to inject/absorb reactive power and thus enable the DSO to dynamically adjust the network voltage profile to
Vol
tage
(pu
)
1.06
1.07
1.08
1.09
1.1
1.11
1.12
FixedLimit
OperatingEnvelope
0
1
2
3
4
5
6
7
8
0:00 6:00 12:00 18:00 24:00
Max
imum
Exp
ort (
kW)
Time (hh:mm)
(b)(a)
Fixed Limit (5 kW)Operating Envelope
figure 5. A comparison between a fixed limit and an operating envelope.
121086420
Max
imum
Exp
ort (
kW)
0:00 6:00 12:00Time (hh:mm)
18:00 24:00
figure 6. The resulting operating envelopes to achieve maximum aggregated power exports. Colored lines: operat-ing envelopes of individual active customers. Dashed gray line: fixed limit (5 kW).
58 ieee power & energy magazine july/august 2021
facilitate maximum market participation of aggregators. In this regard and in the context of a distributed energy market-place, it becomes important to understand the potential eco-nomic value of reactive power, especially as reactive power support from inverter-based DERs could limit their active power market participation while enabling the participation of other DERs.
Modeling of the network constraints in the operating envelope concept is essential for their application to distrib-uted energy markets explicitly considering reactive power. Detailed distribution network modeling can demonstrate how additional network capacity can be accessed through proper management and control of reactive power. A DSO can expand its reactive power capability either through investing in reactive power infrastructure (e.g., capacitor banks) or acquiring reactive power from aggregators. In both cases, the key question is how to value reactive power from a network and then market perspectives. From an aggregator’s point of view, the provision of reactive power could poten-tially maximize their market revenues, for example, by pro-viding local network capacity support. However, this could also restrict active power participation from some DERs in other energy and ancillary service markets. Developing an understanding of these issues is pivotal to inform decision making, drive investment, establish relevant business cases, and bring different actors (DSO, aggregators, and active cus-tomers) to the negotiating table.
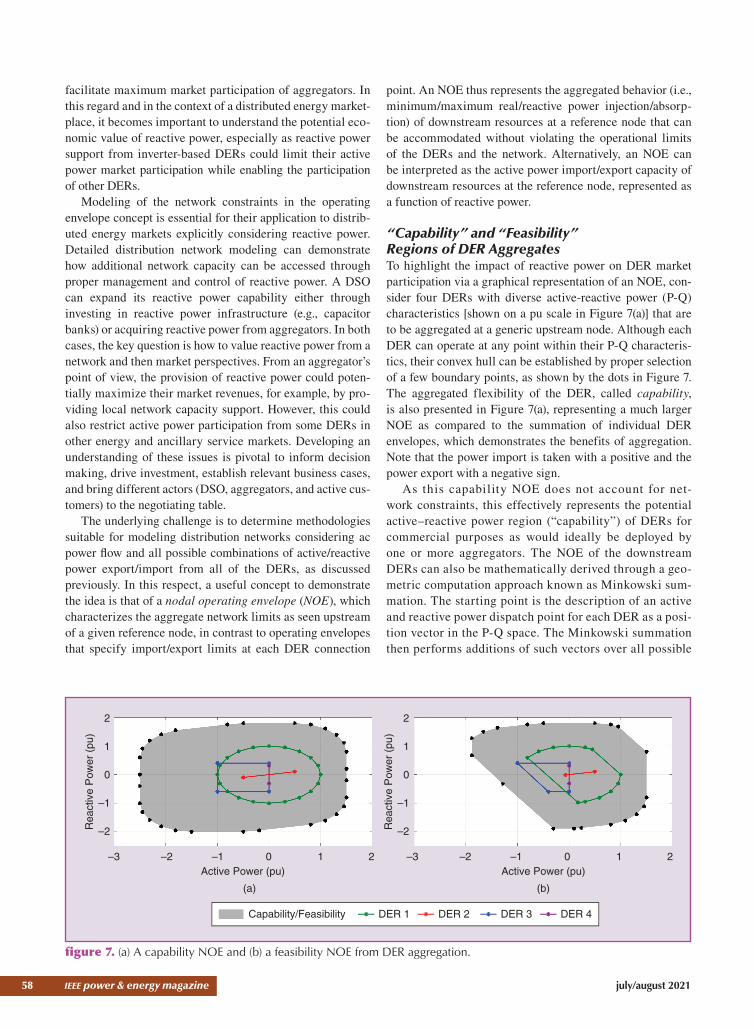
The underlying challenge is to determine methodologies suitable for modeling distribution networks considering ac power flow and all possible combinations of active/reactive power export/import from all of the DERs, as discussed previously. In this respect, a useful concept to demonstrate the idea is that of a nodal operating envelope (NOE), which characterizes the aggregate network limits as seen upstream of a given reference node, in contrast to operating envelopes that specify import/export limits at each DER connection
point. An NOE thus represents the aggregated behavior (i.e., minimum/maximum real/reactive power injection/absorp-tion) of downstream resources at a reference node that can be accommodated without violating the operational limits of the DERs and the network. Alternatively, an NOE can be interpreted as the active power import/export capacity of downstream resources at the reference node, represented as a function of reactive power.
“Capability” and “Feasibility” Regions of DER AggregatesTo highlight the impact of reactive power on DER market participation via a graphical representation of an NOE, con-sider four DERs with diverse active-reactive power (P-Q) characteristics [shown on a pu scale in Figure 7(a)] that are to be aggregated at a generic upstream node. Although each DER can operate at any point within their P-Q characteris-tics, their convex hull can be established by proper selection of a few boundary points, as shown by the dots in Figure 7. The aggregated flexibility of the DER, called capability, is also presented in Figure 7(a), representing a much larger NOE as compared to the summation of individual DER envelopes, which demonstrates the benefits of aggregation. Note that the power import is taken with a positive and the power export with a negative sign.
As this capability NOE does not account for net-work constraints, this effectively represents the potential active–reactive power region (“capability”) of DERs for commercial purposes as would ideally be deployed by one or more aggregators. The NOE of the downstream DERs can also be mathematically derived through a geo-metric computation approach known as Minkowski sum-mation. The starting point is the description of an active and reactive power dispatch point for each DER as a posi-tion vector in the P-Q space. The Minkowski summation then performs additions of such vectors over all possible
Capability/Feasibility DER 1 DER 2 DER 3 DER 4
2
1
0
–1
–2Rea
ctiv
e P
ower
(pu
)
2
1
0
–1
–2Rea
ctiv
e P
ower
(pu
)
–3 –2 –1 0 1 2 –3 –2 –1 0 1 2Active Power (pu)Active Power (pu)
(b)(a)
figure 7. (a) A capability NOE and (b) a feasibility NOE from DER aggregation.

july/august 2021 ieee power & energy magazine 59
dispatch combinations of the DERs considered in a given aggregation portfolio. This eventually results in the “capability” envelope.
The aggregated active–reactive power potential of the aggregated DERs subject to network constraints, indi-cated here as feasibility, is a smaller NOE and is illustrated in Figure 7(b), along with the DER-level operating envelopes assigned by the DSO, as discussed previously. To properly account for network constraints and potential active and reac-tive power management strategies, building the “feasibility” envelope requires power flow or optimal power flow studies.
A comparison between capability and feasibility NOEs (shown in Figure 8) reflects the significant reduction in aggre-gated operational space because of network constraints, with the red region denoting the operat-ing region that is infeasible either because of thermal or volt-age violations. However, voltage constraints can be alleviated by injecting/absorbing reactive power, as illustrated in the figure, so that network capacity and, therefore, upstream provision of active power can be unlocked through reactive power management.
Grid and Market Services: Temporal Aspects of Flexibility DeploymentA feasibility NOE reflects the P-Q potential of DERs considering net-work constraints; yet, it lacks the crucial information regarding the temporal aspects of flexibility provision, which is particularly relevant for the representation of specific grid services. For instance, several markets, e.g., frequency control ancillary ser-vices (FCASs), demand response, and others, require participants to respond within a predefined response time and expect them to deliver the response for at least a predefined duration of the service.
Given the diverse nature of DERs, physical constraints, such as ramp-rate restrictions of slower DERs (e.g., diesel generators) and energy-content limitations of the distributed storage (e.g., household batteries), must be considered to establish the actual DER aggre-gate potential to participate in a
particular market. A new class of “flexibility” NOEs can be defined, whose boundaries in the P-Q space delimit the pos-sible regions of operation for the DER aggregation while providing a certain service, subject to the relevant temporal constraints and starting from a given operating point.
For example, in the Australian National Electricity Mar-ket (NEM), “raise” and “lower” FCASs are used to provide “upward” and “downward” reserves, respectively. Figure 9 illustrates a generic DER aggregate where the fast, slow, and delayed FCASs must be delivered within 6 s, 60 s, and 5 min and last 60 s, 5 min, and 10 min, respectively, again accord-ing to the NEM FCAS market. The size of the NOE mono-tonically increases with the response time as more resources
2
1.5
1
0.5
0
–0.5
–1
–1.5
–2
–2.5
Rea
ctiv
e P
ower
(pu
)
–3 –2.5 –2 –1.5 –1 –0.5Active Power (pu)
Maximum Active Power Export PotentialWith Reactive Power Control
Reactive PowerRequired to
Achieve MaximumHosting Capacity
Maximum Active PowerExport Without Reactive
Power Control
Capacity UnlockedThrough Reactive
Power Management
0 0.5 1 1.5 2
Capability NOE Feasibility NOE
figure 8. A comparison of the capability and feasibility NOEs shown in Figure 9.
2
1.5
1
0.5
0
–0.5
–1
–1.5
–2
–2.5
Rea
ctiv
e P
ower
(pu
)
–3 –2.5 –2 –1.5 –1 –0.5Active Power (pu)
0 0.5 1 1.5 2
Raise FCAS Potential Lower FCAS Potential
Feasibility
Slow Lower
Fast Raise
Delayed Raise
Fast Lower
Delayed Lower
Slow Raise
Operating Point
figure 9. An example illustrating “flexibility” NOEs used to describe different FCASs against the “feasibility” NOE.

60 ieee power & energy magazine july/august 2021
can be deployed (started on and ramped up and down) to deliver the required response. Therefore, starting from a cer-tain operating point, the flexibility NOEs for the faster raise services are contained inside the envelopes for the slower services, as shown in Figure 9.
The smaller operating range of reactive power for fast FCASs (the blue line in Figure 9) reflects the fact that not all units could start up within the response time of service. Fur-thermore, the size of the NOE monotonically decreases with the expected duration of the service as energy-constrained resources cannot deliver a response for a longer time. For instance, in Figure 9 this can be seen in the fact that the “delayed lower” FCAS NOE is relatively smaller than the “fast and slow lower” FCAS NOEs.
From Concept to Reality: Challenges and Opportunities
Adopting Operating EnvelopesTraditionally, distribution networks are operated as passive circuits such that minimal interactions are necessary from the control rooms. Consequently, to make the transition from fixed limits to operating envelopes a reality, there are many challenges that distribution companies are expected to face, from the data required by the algorithms to the physical infrastructure into which these concepts will be integrated. This section explores some of these challenges (as well as potential avenues to address them) that are likely to be encountered by distribution companies hoping to make operating envelopes an integral part of the business-as-usual operation.
✔ Adequate network models: The databases of distri-bution companies often contain incomplete model-ing data for power flow analyses, particularly for LV feeders. For instance, key information, such as the phase connection of customers and the impedances of LV conductors, are rarely fully recorded. Fortunately, thanks to the increasing rollout of smart meters world-wide, as well as ongoing research into data-driven techniques, reconstructing these missing data is be-coming ever more plausible.
✔ Forecasting of passive customers at the head of a feed-er: The net demand of passive customers will affect the available capacity in the corresponding LV feeder. Similarly, as the head-of-feeder voltage sets a reference point for the entire LV feeder, it will also play an impor-tant role in determining the available capacity. There-fore, the accuracy of these forecasts will directly affect the validity of the calculated operating envelopes.
✔ Reactive power considerations: Undoubtedly, reactive power from modern inverter-based DERs is a valuable source of flexibility to provide services at the system level. However, the incorporation of reactive power into the operating envelopes algorithm is expected to significantly increase the complexity. This is largely
due to the combinatorial nature when considering both active and reactive power as sources of flexibil-ity for the aggregator. For instance, during periods of voltage-rise issues, absorbing reactive power (import-ing vars) can help with voltage issues, whereas inject-ing reactive power (exporting vars) will do the exact opposite. Therefore, this introduces an inherent trad-eoff between allowing more flexibility for aggregators and the complexity of the modeling behind the operat-ing envelopes algorithm for the distribution company.
✔ Speed and scalability: To ensure that operating enve-lopes can be used in an operational setting in the control room, the underlying algorithm needs to be sufficiently fast and able to handle large-scale dis-tribution networks, i.e., thousands of LV feeders at once. Consequently, ensuring the scalability of the operating envelope calculation algorithm is one of the key criteria to enable its successful adoption by industry.
✔ Monitoring infrastructure at the head of a feeder: As discussed earlier, head-of-feeder measurements are essential to the algorithm that calculates operating envelopes. However, the availability of this measure-ment depends on the infrastructure available to dis-tribution companies. Therefore, this may entail ad-ditional monitoring infrastructure to be installed by distribution companies.
✔ Operationalizing SCADA measurements: Real-world implementation requires operational data of the net-work (i.e., the inputs, as shown previously). As dis-cussed earlier, depending on the frequency of up-dating operating envelopes, this can have different implications on the frequency with which SCADA measurements of the networks are collected. For in-stance, in Australia, smart-meter data are typically collected in the control room twice a day. This means that additional upgrades to the communication infra-structure may be necessary if a higher data frequency is required. Nonetheless, the implementation of more frequent data collection provides a unique opportunity that allows the distribution company to exploit other ways of utilizing these data.
✔ Ease of implementation: A key factor to accelerate the industry adoption of advanced solutions is its ease of implementation. For instance, while specialized third-party software exists to perform power flow calculations, using such software requires develop-ing additional interfaces to the existing systems in the control rooms. Alternatively, a potentially more implementable approach is through rule-based algo-rithms using equations that can be implemented in any programming/scripting language already available in the control room. This eliminates the need for devel-oping additional interfaces to third-party software, thus reducing the integration risks.
july/august 2021 ieee power & energy magazine 61
✔ Commercial product availability: The current prod-uct market is relatively immature in terms of the of-ferings of commercial platforms to integrate operat-ing envelopes into the control room. For instance, data requirements, communication, and interoper-ability standards for this more-active environment are not yet well defined. They need to be agreed upon and developed further in consultation with the wider industry to ensure replicability. Ven-dor solutions often focus on managing large-scale DERs, typically within feeders at higher voltages (>1 kV), and are structured around a “command and control” approach. However, this is not suitable for the concept of operating envelopes as the integration challenges are within the LV feeders, and the DER of the active customers is not being directly con-trolled by the distribution company. Instead, a more promising mode of operation is a “publish and sub-scribe” approach, such that aggregators will comply with the issued operating envelopes by the distribu-tion company. Therefore, this may entail the devel-opment of bespoke solutions by distribution com-panies in initial trials. Implementation experiences will certainly help to inform and refine the technical requirements of such products from vendors.
✔ Liquidity: The day-to-day operation of a distribution-level market requires sufficient “liquidity,” which, in turn, relies on the willingness of DERs to participate in such markets. Therefore, apart from technological ad-vances, adequate engagement with the customers and the wider community is also key to make this a reality.
Reactive Power Management to Support Network and Market ServicesThe feasibility NOE bounds all possible grid service enve-lopes. By representing active power import/export limits as a function of reactive power, calculated from operating enve-lopes of individual DERs, the feasibility NOE can be used to quantify the additional network capacity that can be released through DER reactive power control. The DSO’s use of reac-tive power compensation devices, on-load tap changers, and other tools can also access (further) network capacity. Pres-ently, the voltage profile of the network through reactive power control is not actively managed by the DSO, and there are many open questions, from reactive power acquisition and dispatch to understanding DSO incentives and conflicts. Some of these challenges are described as follows:
✔ Business model: The main challenge lies in establishing a relevant business model for the acquisition of reactive power from the DER. For example, it must be decided if a reactive power market should be set up at the dis-tribution level or if reactive power support is contracted via periodic agreements (e.g., every three months). The market option might provide more flexibility to aggre-gators as they can change their reactive power support
for each market clearance interval, whereas contractual agreements would provide more certainty to the DSO in managing network constraints.
✔ Reactive power dispatch: A challenge for the DSO is to decide which resources should be utilized for reac-tive power dispatch. This is important, for example, in the case of multiple aggregators, where the market participation potential of one could be enhanced by reactive power injection or absorption from another and could result in some form of “free-riding” effect. On the other hand, an aggregator could also be pe-nalized by the reactive power control carried out by another aggregator. Therefore, the DSO must ensure a fair allocation of costs and benefits across differ-ent market stakeholders, such that they pay for added benefits they receive and are compensated for the lost opportunity they incur, as relevant.
✔ DSO incentives: Incentives need to be in place for the DSO to manage the network to ensure maximum mar-ket participation of aggregators, especially given the increased complexity of including reactive power in operating envelope calculation.
✔ DSO conflicts of interest: DSO control over reac-tive power dispatch may create potential conflicts; for example, the DSO could prioritize reactive power dispatch for minimizing network losses rather than increasing aggregator market participation. This high-lights the importance of transparency and the need to develop procedures for the DSO to identify and man-age its potential conflicts of interest.
Moving Forward With TrialsThe adoption of operating envelopes, coupled with the estab-lishment of a distribution marketplace, is expected to make it possible for DER owners and aggregators to continue par-ticipating in wholesale markets and grid services without dis-tribution companies worrying about poles and wires. This, in turn, could potentially lead to lower electricity costs, thanks to cheaper flexibility and fewer investments/augmentation on the distribution side. But for these concepts and their potential benefits to become a reality, we need trials that bring together the complete spectrum of key stakeholders: from DER own-ers to the aggregator, the distribution company, and, finally, the system operator. This is crucial in understanding the future complexity, interactions, and challenges that distribu-tion companies in Australia and around the world will face in the future to manage widespread DER adoption while mak-ing the most of the existing electricity infrastructure.
One notable example is the Energy Demand and Gen-eration Exchange (EDGE) project in Australia. The EDGE project (started in 2020) was funded for three years by the Australian Renewable Energy Agency and has as key par-ticipants Australian Energy Market Operator (system opera-tor), AusNet Services (distribution company), Mondo (DER aggregator), and the University of Melbourne (research and
62 ieee power & energy magazine july/august 2021
development). “EDGE Project Fact Sheet” presents key aspects of the project.
Within the EDGE project, the main task involves the research and development of a practical, end-to-end solu-tion that allows distribution companies, aggregators, and (transmission) system operators to trial operating envelopes. The project also aims to demonstrate and evaluate the role of reactive power in unlocking distribution network capacity for (active power) market participation and the provision of different grid services. Throughout the life of the project, several real-world demonstrators will be established across the Hume region of Victoria (the only state in Australia with full deployment of smart meters) to assess how operating envelopes can be used to unlock network-aware bottom-up flexibility. The knowledge gained throughout the EDGE and similar projects is expected to inform the wider community on how to adequately operate such markets, where services are originating from the edge of the grid.
For Further ReadingAustralian Renewable Energy Agency (ARENA), “Dynamic operating envelopes workstream.” Canberra, Australia. Ac-cessed May 2021. [Online]. Available: https://arena.gov.au/ knowledge-innovation/distributed-energy-integration -program/dynamic-operating-envelopes-workstream/
L.F. Ochoa, “DER and network integrity: Meter-level op-erating envelopes,” IEEE Smart Grid Webinar, Dec. 2020. [Online]. Available: https://resourcecenter.smartgrid.ieee.org/education/webinar-videos/SGWEB0144.html
K. Petrou, M.Z. Liu, A.T. Procopiou, L.F. Ochoa, J. Theunissen, and J. Harding, “Operating envelopes for pro-sumers in LV networks: A weighted proportional fairness approach,” in Proc. IEEE/PES Innovative Smart Grid Tech-nol. (ISGT Europe 2020), Oct. 26–28, 2020, p. 579–583.
K. Petrou, A.T. Procopiou, L. Gutierrez-Lagos, M. Z. Liu, L. F. Ochoa, T. Langstaff, and J. Theunissen, “Ensuring dis-tribution network integrity using dynamic operating limits for prosumers,” IEEE Trans. Smart Grid., to be published.
H. Wang, S. Riaz, and P. Mancarella, “Integrated techno-economic modeling, flexibility analysis, and business case assessment of an urban virtual power plant with multi-mar-ket co-optimization,” Appl. Energy, vol. 259, p. 114142, Feb. 2020. doi: 10.1016/j.apenergy.2019.114142.
G. Chicco, S. Riaz, A. Mazza, and P. Mancarella, “Flexibility from distributed multi-energy systems,” Proc. IEEE, vol. 108, no. 9, pp. 1496–1517, 2020. doi: 10.1109/JPROC.2020.2986378.
P. D. Martini, “Operational coordination architecture: New models and approaches,” IEEE Power Energy Mag., vol. 17, no. 5, pp. 29–39, 2019.
G. Strbac et al., “Cost-effective decarbonization in a de-centralized market: The benefits of using flexible technolo-gies and resources,” IEEE Power Energy Mag., vol. 17, no. 2, pp. 25–36, 2019. doi: 10.1109/MPE.2018.2885390.
BiographiesMichael Z. Liu is with the University of Melbourne, Mel-bourne, 3010, Australia.
Luis (Nando) Ochoa is with the University of Mel-bourne, Melbourne, 3010, Australia, and the University of Manchester, Manchester, M13 9PL, UK.
Shariq Riaz is with the University of Melbourne, Mel-bourne, 3010, Australia.
Pierluigi Mancarella is with the University of Melbourne, Melbourne, 3010, Australia, and the University of Manches-ter, Manchester, M13 9PL, UK.
Tian Ting is with AusNet Services, Melbourne, 3006, Australia.
Jack San is with AusNet Services, Melbourne, 3006, Australia.
John Theunissen is with AusNet Services, Melbourne, 3006, Australia.
p&e
EDGE Project Fact SheetKey details of project EDGE are presented. All dol-
lar values are reported adopting the conversion rate of
AU$1→US$0.77.
• Total cost: US$21.6 million.
• Project length: Three years.
• Project website: www.arena.gov.au/projects/victor
ian-distributed-energy-resources-marketplace-trial/.
• Customers involved: From ~50 (initial stage) to ~1,000
(final stage).
• Customer types: Residential, commercial, and industrial.
• Infrastructure
˚ distribution network analytics platform
˚ bottom-up services and market platform
˚ distributed energy resource (DER) aggregation
platform
˚ central communication and data-exchange hub.
• Services explored
˚ peak demand relief
˚ feeder capital expenditure deferral
˚ quality of supply management
˚ customer impact reduction from planned outages
˚ feeder automation enhancement during unplanned
outages.
• Key partners and participants
˚ leader: Australian Energy Market Operator
˚ industry: AusNet Services, Mondo Power
˚ academia: University of Melbourne, Deakin University
˚ management: Nous Group.
• Areas of study: Engineering, economics, and social
sciences.