ground water quality assessment of dhankawadi … water quality assessment of dhankawadi ward of...
TRANSCRIPT
INTERNATIONAL JOURNAL OF GEOMATICS AND GEOSCIENCES
Volume 2, No 2, 2011
© Copyright 2010 All rights reserved Integrated Publishing services
Case study ISSN 0976 – 4380
Submitted on September 2011 published on November 2011 688
Ground water quality assessment of Dhankawadi ward of Pune by using
GIS Priti Singh
1, I.A. Khan
2
1- Institute of Environment Education and Research, Bharti Vidyapeeth, Pune – 411 043,
Maharashtra, India
2- Department of Geology Nowrosjee Wadia College, Pune- 411 001, Maharashtra, India
ABSTRACT
This paper aims to assess and map the spatial distribution of ground water quality of the
Dhankawadi ward of Pune by using the Geographical Information System (GIS).
Dhankawadi is experiencing rapid urbanization, this made people to depend on groundwater
resources. APHA’s standard laboratory procedure has been adopted to assess the quality of
ground water at each sampling location. Garmin GPS has been used to collect the sampling
point location. Inverse Distance Weighed (IDW) spatial interpolation technique has been
used to estimate the spatial distribution of the ground water parameters and WQI. A potable
index map has been prepared with help of WQI map. Google earth has been used for
preparation of Land use and Land class (LULC) image. Results of WQI are interpreted with
respect to the LULC. The potable Index map shows that, the groundwater in the study area is
good enough for drinking and domestic purposes except in the places of Upper Katraj nagar
and north part of Bharati Vidyapeeth University campus.
Keywords: Spatial distribution, Urbanization, GIS, Inverse distance weighted, Water quality
index, Potable index, Land use and Land class.
1. Introduction
Water is the elixir of life (Vidvan Vishvam, 2003) and plays a vital role in the earth’s
ecosystem. It is one of the most critical, scarce, precious and replenishable natural resource
which cannot be created (Prasad, 2008). The utilizable water resources of India are estimated
to be 1123 BCM, out of which, 690 BCM are surface water resources and 433 BCM occur as
ground water resources (Kumar, 2009). Groundwater serves as the main sources of water in
the urban environment, which is used for drinking, industrial and domestic purposes and
often, it is over exploited. Rapid industrialization, improper solid and toxic waste
management practices in urban areas often lead to the degradation of groundwater, which
then turns un-potable for future use. Ground water pollution not only affects the water quality
but also threats human health, economic development and social prosperity (Milovanovic,
2007). The quality of water generally is defined in terms of its physical, chemical and
biological parameters (Ketata Mouna, et al., 2011) and measured as Water Quality Index
(WQI) to assess whether water is potable or not. WQI provides a single number that
expresses overall water quality at certain location, based on several water quality parameters
(Yogendra and Puttaiah, 2008). Hence, for any city, a groundwater quality map becomes a
valuable parameter for evaluating potability and also as a precautionary indication of
potential environmental health problems (Challerjee, et al., 2009). GIS and remote sensing
has been used extensively to assess the water quality all over the world (Shomar et al., 2010;
Asadi et al., 2007; Ketata Mouna et al., 2011; Mitra, 1998; Liou sm et al., 2004). The

Ground water quality assessment of Dhankawadi ward of Pune by using GIS
Priti Singh, I A Khan
International Journal of Geomatics and Geosciences
Volume 2 Issue 2, 2011 689
Advancement of Geographical Information System (GIS) and Spatial Analysis help to
integrate the laboratory analysis data with the geographic data and to model the spatial
distributions of water quality parameters, most robustly and accurately. The objective of the
study is to assess and map the groundwater quality of Dhankawadi ward of Pune. For this
purpose, Inverse Distance Weighed (IDW) spatial interpolation technique has been used to
estimate the spatial distribution of the water quality parameters and WQI.
2. Study Area
The study area is Dhankawadi ward (Figure 1), which is the southern part of Pune
metropolitan Area. It is one of the fastest developing areas as the suburbs of the Pune city, the
population of the study area is more than 5 lakhs. The latitude of study area ranges from
18°25'30" N to 18°28'30" N and longitude ranges from 73°50' E to 73°53' E, with area of
coverage 1160 hectares. Mean daily maximum and minimum temperatures of the study area
range from the 37°C to 12°C. The relative humidity ranges from 36% in March to 81% in
August with annual rainfall is at about 70 cm. As the development of Dhankawadi is taking
place at much rapid pace, the housing colonies have started utilizing groundwater as a means
of water supply for domestic purpose.
Figure 1: Study area
3. Methodology
3.1 Input Datasets
The boundary of the Dhankawadi ward is digitized from the Pune Municipal corporation
ward map. The location of the groundwater samples collected with the help of 12 channel
Garmin hand held GPS, while collection of groundwater samples, interviews were performed
with the local people to understand why they are utilizing the groundwater. It was noticed
that the utilization of groundwater is observed mainly in the places where there is a shortage
or no supply of municipal corporation water. Very less number of households is using

Ground water quality assessment of Dhankawadi ward of Pune by using GIS
Priti Singh, I A Khan
International Journal of Geomatics and Geosciences
Volume 2 Issue 2, 2011 690
groundwater in the NE part of the study area (i.e. Balajinagar). A shape file of sampling
locations is prepared with the help GPS data and the attribute information i.e., water quality
parameters such as pH, alkalinity, TDS, Total hardness etc., joined to the respective sampling
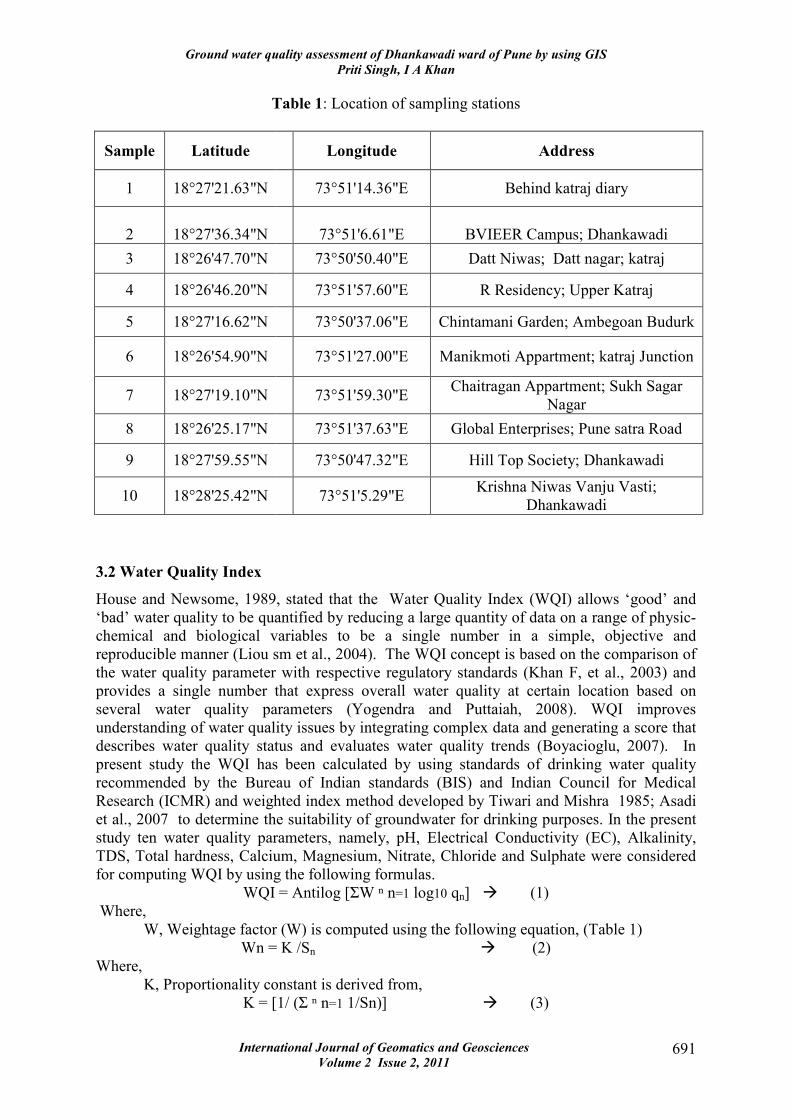
location after the laboratory Analysis. Figure 2 shows the locations map of the study area and
table 1 shows the latitude, longitude and address of each sampling location.
Figure 2: Location of sampling stations.
Ground water quality assessment of Dhankawadi ward of Pune by using GIS
Priti Singh, I A Khan
International Journal of Geomatics and Geosciences
Volume 2 Issue 2, 2011 691
Table 1: Location of sampling stations
3.2 Water Quality Index
House and Newsome, 1989, stated that the Water Quality Index (WQI) allows ‘good’ and
‘bad’ water quality to be quantified by reducing a large quantity of data on a range of physic-
chemical and biological variables to be a single number in a simple, objective and
reproducible manner (Liou sm et al., 2004). The WQI concept is based on the comparison of
the water quality parameter with respective regulatory standards (Khan F, et al., 2003) and
provides a single number that express overall water quality at certain location based on
several water quality parameters (Yogendra and Puttaiah, 2008). WQI improves
understanding of water quality issues by integrating complex data and generating a score that
describes water quality status and evaluates water quality trends (Boyacioglu, 2007). In
present study the WQI has been calculated by using standards of drinking water quality
recommended by the Bureau of Indian standards (BIS) and Indian Council for Medical
Research (ICMR) and weighted index method developed by Tiwari and Mishra 1985; Asadi
et al., 2007 to determine the suitability of groundwater for drinking purposes. In the present
study ten water quality parameters, namely, pH, Electrical Conductivity (EC), Alkalinity,
TDS, Total hardness, Calcium, Magnesium, Nitrate, Chloride and Sulphate were considered
for computing WQI by using the following formulas.
WQI = Antilog [ΣW ⁿ n=1 log10 qn] � (1)
Where,
W, Weightage factor (W) is computed using the following equation, (Table 1)
Wn = K /Sn � (2)
Where,
K, Proportionality constant is derived from,
K = [1/ (Σ ⁿ n=1 1/Sn)] � (3)
Sample Latitude Longitude Address
1 18°27'21.63"N 73°51'14.36"E Behind katraj diary
2 18°27'36.34"N 73°51'6.61"E BVIEER Campus; Dhankawadi
3 18°26'47.70"N 73°50'50.40"E Datt Niwas; Datt nagar; katraj
4 18°26'46.20"N 73°51'57.60"E R Residency; Upper Katraj
5 18°27'16.62"N 73°50'37.06"E Chintamani Garden; Ambegoan Budurk
6 18°26'54.90"N 73°51'27.00"E Manikmoti Appartment; katraj Junction
7 18°27'19.10"N 73°51'59.30"E Chaitragan Appartment; Sukh Sagar
Nagar
8 18°26'25.17"N 73°51'37.63"E Global Enterprises; Pune satra Road
9 18°27'59.55"N 73°50'47.32"E Hill Top Society; Dhankawadi
10 18°28'25.42"N 73°51'5.29"E Krishna Niwas Vanju Vasti;
Dhankawadi

Ground water quality assessment of Dhankawadi ward of Pune by using GIS
Priti Singh, I A Khan
International Journal of Geomatics and Geosciences
Volume 2 Issue 2, 2011 692
Where,
Sn and Sᵢ are the BIS/ICMR standards values of the water quality parameter.
And
Quality rating (q) is calculated using the formula,
qnᵢ = {[(Vactual- Videal)/(V standard – V ideal)]*100} �(4)
Where,
qnᵢ = Quality rating of ith
parameter for a total of n water quality parameters
Vactual = Value of the water quality parameter obtained from laboratory analysis
Videal = Value of that water quality parameter can be obtained from the standard tables
Videal for pH = 7 and for other parameters it is equivalent to zero
Vstandard = BIS / ICMR standard of the water quality parameter
The standard of the water quality parameter is given in Table 2. Table 3 shows values
of the all ten parameters that are experimented in the laboratory and values of WQI that is
computed by using above formulae and Table 4 shows the indexing of WQI into categories of
different types in order to assess the potability of groundwater in the study area.
Table 2: Water quality parameters, their ICMAR/BIS standards, and assigned unit weights
Parameter Standard(Sn & Si) 1/Sn K Weightage (Wn)
pH 8.5 0.117647 5.020014437 0.590589934
E.
conductivity
300 0.003333 5.020014437 0.016733381
TDS 500 0.002 5.020014437 0.010040029
T. Hardness 300 0.003333 5.020014437 0.016733381
Calcium 75 0.013333 5.020014437 0.066933526
magnesium 50 0.02 5.020014437 0.100400289
Alkalinity 120 0.008333 5.020014437 0.041833454
Chloride 250 0.004 5.020014437 0.020080058
Sulphate 200 0.005 5.020014437 0.025100072
Nitrate 45 0.022222 5.020014437 0.111555876
0.199203 1
Table 3: Water Quality Parameter
Sam
ple
pH EC Hardn
ess
Calci
um
Mag
nesiu
m
Alkal
inity
Chlo
ride
TD
S
Nitr
ate
Sulp
hate
WQI
1 7.2 700 347 92 12 300 115 50 84.4 55 24.05
2 7.8 670 320 84 11 280 85 48 10.9 30 52.49
3 7.2 668 423 95 18 300 71.7 53 8.9 35 25.25
4 7.8 552 350 68 17.5 260 80.1 16 7.0 37.5 55.62
5 7.7 498 96 28.6 16.3 300 81.8 160 14.4 28 43.08
6 7.1 726 216 47.6 41 300 181.9 140 14.4 30 23.75
7 7.3 968 202 49.2 37.3 346.7 148.5 560 30 55 35.16
8 7.2 750 217.3 48 37.2 280 106.8 420 26.7 50 25.64
9 7.2 747 217.3 53 40 306.7 135 380 22.2 38 27.68
10 7.6 158 74.7 16 14.2 193.3 68.4 40 2.22 6 32.91

Ground water quality assessment of Dhankawadi ward of Pune by using GIS
Priti Singh, I A Khan
International Journal of Geomatics and Geosciences
Volume 2 Issue 2, 2011 693
All units except pH and conductivity are in mg/l
Table 4: Water Quality Index (WQI) and status of water quality
Water quality Index Water quality status
0-25 Excellent
26-50 Good
51-75 Poor
76-100 Very Poor
>100 Unsuitable
3.3 Spatial Modelling and Surface Interpolation
GIS is a powerful tool to assess the water quality parameter, determining water availability of
water, preventing flooding, understanding the natural environment, and managing water
resources on a local regional scale (Collet, 1996). GIS techniques facilitate integrate and
conjunctive analysis of large volumes of multidisciplinary data both Spatial and non – spatial
within the same geo-reference (Saraf and Choudhury, 1998). Spatial analysis extension of
GIS allows interpolation of the water quality parameter at unknown location from know
values to create a continuous surface which will help us to understand the scenarios of water
quality parameter of the study area. There are various Interpolation Techniques such as
Inverse Distance weighted (IDW), Spline, Trend surface Analysis and Kriging available in
Arc GIS Spatial Analysis extension. In the present study IDW technique adopted to create
the spatial distribution maps of water quality parameters and WQI.
4. Result and Discussion
4.1 Spatial Distribution of Water quality parameters
4.1.1 pH
pH is important parameter, which determines the suitability of water for various purposes. In
the study area pH level of water varies from 7.15 and 7.8 and is in desirable limit ie., 6.5 to
8.5 as specified by the BIS/ ICMR. Figure 3 shows that spatial distribution of pH in the study
area, low concentration of pH was observed in southwest part of the study area, which comes
under Datt nagar.
4.1.2 Electrical Conductivity (EC)
Electrical conductivity is the capacity of electrical current that passes through the water. It is
directly related to concentration of ionized substances in water and may also be related to
problems of excessive hardness. In study area, electrical conductivity varies from 158.031 to
967.978 µm/cm. Figure 4 shows that spatial distribution of EC of water in the study area,
high concentration of EC has been observe in East part of the study area i.e. Sukh sagar nagar.
4.1.3 Hardness
The limit of total hardness value for drinking water is to be within 300 mg/l of CaCO3.
Figure 5 shows the Spatial distribution of the ground water hardness in the study area and it
varies from 74.676 to 423.323mg/l. Higher concentration of hardness was found in

Ground water quality assessment of Dhankawadi ward of Pune by using GIS
Priti Singh, I A Khan
International Journal of Geomatics and Geosciences
Volume 2 Issue 2, 2011 694
Dattanagar, Upper Katraj nagar and Bharti Vidyapeeth University (BVU) campus, this may
be due to natural accumulation of salt, or surface runoff, water enter from direct pollution by
human activities, low concentration of hardness was found in upper part of the study area i.e.,
Dhankawadi and Ambegaon Budurk which lies in west part of the area.
Figure 3: Spatial Distribution of pH Figure 4: Spatial Distribution of
Electric conductivity
4.1.4 Calcium
Calcium is one of the most abundant substances in the water. Dissolve calcium and
Magnesium in water are the two most common minerals that make water hard.
Figure 5: Spatial Distribution of Hardness Figure 6: Spatial Distribution of Calcium

Ground water quality assessment of Dhankawadi ward of Pune by using GIS
Priti Singh, I A Khan
International Journal of Geomatics and Geosciences
Volume 2 Issue 2, 2011 695
Figure 6 shows the spatial distribution of Calcium in the groundwater of the study area,
which ranges from 16.034 to 95.38 mg/l. The high concentration of calcium was found in
Datt nagar which lies in south western part, and in the Bharti Vidyapeeth University campus
of the study area, which is in the central part of the study area.
4.1.5 Magnesium
Figure 7 spatial distribution of Magnesium in the groundwater of the study area and it varies
in between 10.65 mg/l to 40.92 mg/l. High concentration of magnesium was found in NW
part of the study area i.e. Adrash nagar in Dhankawadi, East part of the study area i.e., Sukh
sagar nagar and in the Katraj Junction along with surrounding area of NH- 4 in the southern
part of the study area.
Figure 7: Spatial Distribution of Figure 8: Spatial Distribution of Total
Magnesium Alkalinity
4.1.6 Total Alkalinity
The standard desirable limit of alkalinity of potable water is 120 mg/l. The maximum
Permissible level is 600 mg/l. Figure 8 shows spatial distribution of Total Alkalinity in the
groundwater of the study area, it varies from 193.339 to 346.663 mg/l. High alkaline water
has been observed in Sukh sagar nagar . Excessive alkalinity may cause eye irritation in
human and chlrosis in plants (Sisodia and Moundiotiya, 2006). Low concentration of
alkalinity was observed in edges of the northern part of the study area i.e. Balaji nagar.
4.1.7 Chloride
Chloride is one of the most important parameter in assessing the water quality and higher
concentration of chloride indicates higher degree of organic pollution (Yogendra and Puttaiah,
2008). According to BIS/ICMR the permissible limit of chloride in drinking water is 250

Ground water quality assessment of Dhankawadi ward of Pune by using GIS
Priti Singh, I A Khan
International Journal of Geomatics and Geosciences
Volume 2 Issue 2, 2011 696
mg/l. Figure 9 Spatial distribution of Chloride in the study area and it is fluctuating in
between 68.411 to 181.859mg/l. High concentration of chloride was observed as 189.1 mg/l
near Katraj Junction and Sukh sagar nagar. This may be due to natural processes such as the
passage of water through natural salt formations in the earth or it may be an indication of
pollution from industrial or domestic use (Renn, 1970). In drinking water, high chloride
content may lead to laxative effects (Raviprakash and Rao, 1989; Dahiya and Kaur, 1999).
Low concentration of chloride was found in edges of the northern part of the study area.
Figure 9: Spatial Distribution of Chloride Figure 10: Spatial Distribution of TDS
4.8 Total dissolved solid(TDS)
TDS in groundwater can also be due to natural sources such as sewage, urban runoff and
industrial waste (Joseph, 2001; Swarna Latha, 2008). According to BIS and ICMR the
desirable limit of TDS is 500 mg/l. If TDS value is more than 500 mg/l, it may cause gastro
intestinal irritation. Figure 10 shows spatial distribution of TDS in the study area, which is
fluctuating between 16 to 559.97 mg/l. The high concentration of TDS was observed as
559.97 mg/l at Sukh sagar nagar which is residential area near the stream and Katraj Lake;
this indicates that Katraj Lake water is contaminated by sewage and surface runoff. In the
study two corners had high concentration of TDS in Dhankawadi and Katraj nagar which
covers north western part and southern part, which has highly dense residential area. High
TDS presence in the water decreases the quality and affects the taste of water (Guru Prasad,
2005).
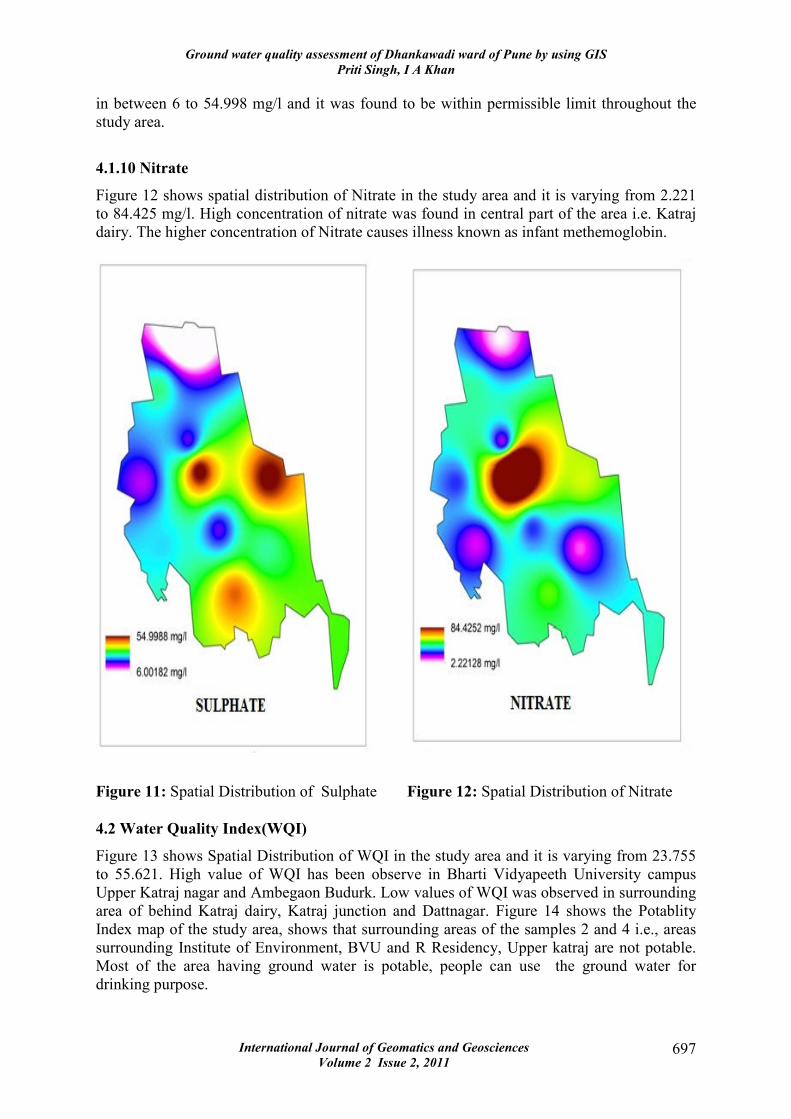
4.1.9 Sulphate
According to Minnesota's Department of Health, Soil and rock formations may naturally
contain sulphates. As water moves through these, sulphates are picked up and dissolve in the
groundwater, during infiltration of rainfall and groundwater recharge. Figure 11 spatial
distribution of sulphate in the groundwater of the study area, shows that Sulphate is varying
Ground water quality assessment of Dhankawadi ward of Pune by using GIS
Priti Singh, I A Khan
International Journal of Geomatics and Geosciences
Volume 2 Issue 2, 2011 697
in between 6 to 54.998 mg/l and it was found to be within permissible limit throughout the
study area.
4.1.10 Nitrate
Figure 12 shows spatial distribution of Nitrate in the study area and it is varying from 2.221
to 84.425 mg/l. High concentration of nitrate was found in central part of the area i.e. Katraj
dairy. The higher concentration of Nitrate causes illness known as infant methemoglobin.
Figure 11: Spatial Distribution of Sulphate Figure 12: Spatial Distribution of Nitrate
4.2 Water Quality Index(WQI)
Figure 13 shows Spatial Distribution of WQI in the study area and it is varying from 23.755
to 55.621. High value of WQI has been observe in Bharti Vidyapeeth University campus
Upper Katraj nagar and Ambegaon Budurk. Low values of WQI was observed in surrounding
area of behind Katraj dairy, Katraj junction and Dattnagar. Figure 14 shows the Potablity
Index map of the study area, shows that surrounding areas of the samples 2 and 4 i.e., areas
surrounding Institute of Environment, BVU and R Residency, Upper katraj are not potable.
Most of the area having ground water is potable, people can use the ground water for
drinking purpose.

Ground water quality assessment of Dhankawadi ward of Pune by using GIS
Priti Singh, I A Khan
International Journal of Geomatics and Geosciences
Volume 2 Issue 2, 2011 698
Figure 13: Spatial Distribution of Water Quality Index Map
Figure 14: Spatial Distribution of Potable Index Map

Ground water quality assessment of Dhankawadi ward of Pune by using GIS
Priti Singh, I A Khan
International Journal of Geomatics and Geosciences
Volume 2 Issue 2, 2011 699
4.3 Land use / Land cover Distribution
An analysis of the nature of land use is impartment to understand the groundwater quality
(Krishna et al., 2001). Google earth’s Digital globe Imagery of December 2010 has been used
to create the land use and land cover (LULC) map of the study area. In order to create the
LCLU map, each LCLU digitized manually on the Google earth and then saved into the
Keyhole Markup Language (KML) format. The KML files converted in to the shape files and
LCLU map of study area has been prepared by using open source GIS software Quantum GIS
(QGIS). Figure 15 shows the Land Use and Land Cover map of the study area. The total area
under study is 1160 hectares, contain total built up coverage at about 482.2593 hectares. High
concentration of settlement situated in Balajinagar and Dhankawdi which covers north side
of the study area. The water bodies that are present in the study area are Katraj Lake and
upper Katraj Lake which covers area 18.5253 hectares. Which is situated in east direction of
the map and streams covers 1.5998 hectares. Agricultural land occupies 32.9647 hectares,
barren land occupies 503.1623 hectares, green spaces areas is at about 76.1928 hectares and
road cover at about 45.2958 hectares. Figure 16 shows the pie chart of percentage of LULC
classes in the study area.
Figure 15: Land Use and Land Cover map

Ground water quality assessment of Dhankawadi ward of Pune by using GIS
Priti Singh, I A Khan
International Journal of Geomatics and Geosciences
Volume 2 Issue 2, 2011 700
Figure 16: Percentages of LULC
4.4 Statistical analysis of WQI with respect to LULC
Statistical analysis of Water Quality Index with respect to the Land Use / Land Cover shown
presented in the Figure 16 and Table 5. These results shows that barren land, built up and
roads classes have maximum variation of WQI values than the lakes and agriculture.
However mean WQI value of all Land Use/ Land Cover classes having approximately same
WQI value and standard deviation results shows that WQI is consistent throughout the LULC
classes in the study area.
Table 5: Statistical table of LULC
LCLU MIN MAX RANGE MEAN STD
Barren Land 23.755 55.5739 31.819 34.938 5.853169
Agriculture 25.6154 44.3824 18.767 32.0713 4.71152
Green Space 24.9979 53.9897 28.9918 34.0012 5.971439
Lake 31.0992 47.6944 16.5951 35.4926 3.576819
Built up 23.8605 55.6218 31.7613 35.1336 5.71537
Roads 23.7761 55.6137 31.8376 35.0695 6.250279
Streams 26.6938 44.5609 17.8672 35.0126 5.070109
Figure 17: Statistical Chart of LULC

Ground water quality assessment of Dhankawadi ward of Pune by using GIS
Priti Singh, I A Khan
International Journal of Geomatics and Geosciences
Volume 2 Issue 2, 2011 701
5. Conclusion
This study has demonstrated the utility of GIS combined with laboratory analysis to assess
and mapping of groundwater quality. The spatial distribution map of pH, Chloride,
Magnesium and Sulphate shows that, these parameters are within the permissible limit in the
study area. The interpreted water quality with respect to EC indicates that more than 90% of
the study area groundwater lies in bad range for drinking purposes except at sample 10. The
spatial distribution map of hardness concentrations illustrates that the majority of the samples
are within the permissible limit except four samples i.e. sampling point 1, 2, 3 and 4. Calcium
ion distribution is within the maximum permissible limits, except for three samples i.e.
sampling point1, 2 and 3 which show Calcium concentration exceeding the permissible limit.
The spatial distribution map of Alkalinity concentrations illustrates that all samples are
beyond the permissible limit. TDS and Nitrate concentration in groundwater of the study area
exceeds the maximum permissible limit in one location only i.e. sample 7 and sample 1
respectively. The overall view of the WQI of the present study showed that most of the area
having a WQI value less than 50 except in the surrounding areas of sample 2 and sample 4.
People can use the ground water for Drinking and Domestic purpose in the study area except
in Upper Katraj nagar and BVU. This study has shown that the use of GIS and remote
sensing is very useful tool for the assessment of ground water quality.
Acknowledgement
We wish to thank everyone who has contributed to the progress of our research project. We
gratefully thank Lakshmi KantaKumar N, M & G GDC, Survey of India for his extensive
help and guidance in completing this project. We gratefully acknowledge Prasant Kate,
BVIEER and my brother Anjesh singh for providing necessary help. The Authors are grateful
to the Editor for his invaluable suggestions to improve the manuscript.
6. References
1. APHA (1998), Standard methods for the examination of water and wastewater,
American Public Health Association, Washington D.C.
2. Asadi S. S., Vuppal P., and Reddy A. M. (2007), Remote sensing and GIS techniques
for evaluation of groundwater quality in municipal corporation of Hyderabad (Zone-V),
India, International Journal of Environmental Research and Public Health, 4(1), pp
45–52.
3. BIS (2003), Indian standards specifications for drinking water IS: 10500, Bureau of
Indian Standards, New Delhi.
4. Boyacioglu, (2007), Development of a water quality index based on a European
classification scheme, Water SA, 33(1), pp 101-106.
5. Challerjee R., Tarafder G., and Paul S. (2009), Groundwater quality assessment of
Dhanbad district, Jharkhand, India, Bulletin of Engineering Geology and Environment,
69(1), pp 137-141.
6. Collet C. (1996), Geographic Information System Needs and Software in :
Geographical Information Systems in Hydrology, 1st Edition, Kluwer Academic
Publishers, Boston, USA.
Ground water quality assessment of Dhankawadi ward of Pune by using GIS
Priti Singh, I A Khan
International Journal of Geomatics and Geosciences
Volume 2 Issue 2, 2011 702
7. Dahiya S., and Kaur A. (1999), Assessment of physical and chemical characteristics
of underground water in rural areas of Tosham subdivision, Bhiwani-Haryana,
International Journal of Environment and pollution, 6(4), pp 281-288.
8. GuruPrasad B. (2005), Assessment of water quality in canals of Krishna delta area of
Andhra Pradesh, Nature of Environment and Pollution Technology, 4(4), pp 521-523.
9. House M. A., and Newsome D. H. (1989), Water quality indices for the management
of surface water quality, Water Science Technology, 21, 1137-1148
10. Joseph K. (2001), An integrated approach for management of Total Dissolved Solids
in reactive dyeing effluents, International Conference on Industrial Pollution and
Control Technologies, Hyderabad.
11. Khan F., Husain T., and Lumb A. (2003), Water quality evaluation and trend analysis
in selected watersheds of the Atlantic Region of Canada, Environmental Monitoring
and Assessment, 88, pp 221-242.
12. Ketata Mouna R., Gueddari M., and Bouhlila R. (2011), Use of Geographical
Information System and Water Quality Index to Assess Groundwater Quality in El
Khairat Deep Aquifer (Enfidha, Tunisian Sahel), Iranica Journal of Energy &
Environment, 2 (2), pp 133-144.
13. Krishna N. D. R., Maji A.K., Krishna Y. V.N., and Rao B.P.S. (2001), Remote sensing
and Geographical Information System for canopy cover mapping, Journal of Indian
Society of Remote sensing, 29(3), pp 108-113.
14. Kumar C. P. (2009), Ground water assessment methodology, National Institute of
Hydrology, Roorkee, www.angelfire.com/nh/cpkumar/publication/Lgwa.pdf, Accessed
30 August 2011.
15. Liou Sm, Liens, and Wang Sh. (2004), Generalized water quality index for Taiwan,
Environmental Monitoring and Assessment, 96, pp 35-52.
16. Milovanovic M. (2007), Water quality assessment and determination of pollution
sources along the Axios/ Vardar River, South-eastern Europe. Desalination, 213, pp
159–173.
17. Mitra B. K. (1998), Spatial and temporal variation of ground water quality in sand
dune area of aomori prefecture in Japan, Paper number 062023, 2006 ASAE Annual
Meeting.
18. Prasad K. (2008), Institutional Framework for Regulating Use of Ground Water in
India, Central Ground Water Board, Ministry of Water Resources, Government of
India, http://cgwb.gov.in/INCGW/Kamta%20Prasad%20report.pdf, Accessed 28
September 2011.
19. Raviprakash S., and Rao G. K. (1989), The chemistry of ground water in Paravada
area with regard to their suitability for domestic and irrigational purposes, Indian
Journal of Geochemistry, 4, pp 39-54.
20. Renn C. E. (1970), Investigating water problems, A water analysis manual,
Chestertown.

Ground water quality assessment of Dhankawadi ward of Pune by using GIS
Priti Singh, I A Khan
International Journal of Geomatics and Geosciences
Volume 2 Issue 2, 2011 703
21. Saraf A.K., and Choudhury P.R. (1988), Integrated remote sensing and GIS for
goundwater exploration and identification of artificial recharge sites, International
Journal of Remote sensing, 10, pp 1825-1814.
22. Shomar B., Fakher S. A., and Yahya1 A. (2010), Assessment of Groundwater Quality
in the Gaza Strip, Palestine Using GIS Mapping, Journal Water Resource and
Protection, 2, pp 93-104.
23. Sisodia R., and Moundiotiya C. (2006), Assessment of the water quality index of
wetland Kalakho lake, Rajasthan, India, Journal of Environmental Hydrology, 14(23),
pp 1-11.
24. Swarna Latha P. (2008), Studies on spatial and temporal changes of land use and land
cover, groundwater quality and shoreline of Greater Visakhapatnam municipal
corporation, Andhra Pradesh, India using remote sensing and GIS techniques, Ph.D.
Thesis Andhra University, Visakhatapatnam.
25. Tiwari T. N., and Mishra M. (1985), A Preliminary assignment of water quality index
of major Indians rivers, Indian Journal of Environmental Protection, 5(4), pp 276-279.
26. Vidvan Vishvam (2003), Atharvaveda Samhita, Tirumala Triupati Devasthanams,
Triupati, 1(4), pp 16-17.
27. Yogendra K., and Puttaiah E.T. (2008), Determination of water Quality Index and
Suitability of urban water body in Shimoga Town, Karnataka. The 12th
world lake
conference, pp 342-346.