groundwater - cliwat an interreg iv project · 2012-04-16 · groundwater) highlighting the main...
TRANSCRIPT
GROUNDWATERin a future climate
The CLIWAT Handbook
GROUNDWATERin a future climate
The CLIWAT Handbook

Groundwater in a Future ClimateEdited by:Marianne Støvring Harbo, Jes Pedersen & Rolf Johnsen, Central Denmark Region and Klaus Petersen, Danish Ministry of the Environment Nature AgencyThe Cliwat Project Groupc/o Central Denmark Region
December 2011
Issue: 1,200
Graphic work and layout:Graphic Service,Central Denmark Region
The project is co-financed by Interreg IV B
North Sea Region Programme
ISBN: 87-7788-265-2
This edition is also available on www.cliwat.eu
Groundwater in a future climate
1 Introduction ................................................................................................ 6
2 Summary ....................................................................................................... 7
3 Challenges in the future climate – an overview ................ 11
3.1 The climate change scenario ......................................................... 12
3.2 Many sectors are affected ................................................................ 14
3.3 Surface water, sewage and drainage systems, and
wastewater treatment plants ......................................................... 14
3.4 Groundwater, water supplies and groundwater
protection ................................................................................................ 16
3.5 Open countryside ............................................................................... 17
3.6 Protecting infrastructure and technical installations ........ 19
3.7 Physical planning ................................................................................. 21
3.8 Multifunctional solutions ................................................................ 22
4 Climate and groundwater ................................................................. 23
4.1 Sea level changes with special focus on land
subsidence ............................................................................................... 24
4.2 Polder areas ............................................................................................ 27
4.3 Groundwater resources on islands ............................................. 32
4.4 Investigation methods ...................................................................... 35
4.5 Hydrological models as predictive tool .................................... 39
4.6 Geology and climate response ...................................................... 48
4.7 Pollution in urban areas .................................................................. 51
4.8 Thematic maps ..................................................................................... 56
5 Involving stakeholders ........................................................................ 60
5.1 Why participation? ............................................................................. 61
5.2 Establishing a Participatory Process ........................................... 62
5.3 Implementing and Managing a Participatory Process ...... 68
5.4 Assessing the Achievements of a Participatory Process ... 70

4 The CLIWAT Handbook
6 EU policy ........................................................................................................ 73
6.1 Introduction ........................................................................................... 73
6.2 Directives relevant for groundwater and river
basin management ............................................................................. 74
6.3 Groundwater and the EU White Paper on climate
change adaptation .............................................................................. 74
6.4 Guidances relevant for groundwater and river basin
management .......................................................................................... 76
6.5 CLIWAT and the EU directives and guidances..................... 79
6.6 Other sources of relevant information for climate
change adaptation .............................................................................. 80
6.7 The Blueprint to safeguard Europe’s Water. .......................... 81
6.8 Summary and outlook. ..................................................................... 83
7 Perspectives ................................................................................................. 84
8 References .................................................................................................... 85
9 Appendix: ...................................................................................................... 95
9.1 Pilot Area A, Belgische Middenkust (B) .................................... 96
9.2 Pilot Area B, Zeeland (B-NL) .......................................................... 105
9.3 Pilot Area C, Fryslân Mainland (NL) .......................................... 116
9.4 Pilot Area D, Borkum (D) ................................................................ 123
9.5 PilotArea E, Sønderjylland, Schleswig (DK/D) ...................... 133
9.6 Pilot Area F, Horsens Town. Egebjerg, (DK) ............................ 147
9.7 Pilot Area G, Aarhus River (DK) ................................................... 172
This handbook is a product of the CLIWAT project (CLImate change and
groundWATer) highlighting the main results and recommendations of the
project for planners and practitioners at local, regional and national levels.
CLIWAT is a transnational project in the North Sea region dealing with
groundwater mapping and adaptive planning and solutions for the coming
challenges caused by climate change. The project aims at bridging EU-sci-
ence and policy on climate change impact and adaptation in the North Sea
Region at a practical level. The research and analysis covers a broad spec-
trum of geoscience and focuses on gaining a better understanding of the
effects of climate change on the quantity and quality of groundwater. The
project started in September 2008 and ends in March 2012. The project
involves sixteen partners from Germany, The Netherlands, Belgium and
Denmark. The handbook is complimented by a number of scientific pa-
pers from all pilot areas in a special issue of the on-line journal “Hydrology
and Earth System Sciences” with the title “Assessing the impact of climate
change for adaptive water management in coastal regions”.
The CLIWAT Handbook 5

6 The CLIWAT Handbook
1 Introduction
The CLIWAT project is especially concerned with the effects of climate
change on groundwater systems. Most of its investigations have been per-
formed in coastal areas. Within the project, we have identified present
and future challenges caused by the changed groundwater levels and
developed climate scenarios focusing on shallow groundwater and deep
groundwater, as well as the impact on water management.
The quality changes of the groundwater resource caused by salt water in-
trusion, outwash from point and diffuse sources to groundwater, surface
water and ecosystems, and new demands for water use are some of the
issues which have been investigated. This enables the North Sea Region
to react and adapt more efficiently to the consequences of climate change.
A wide range of stakeholders, such as water management companies, the
construction industry, authorities and the agricultural sector have been
involved in the project, all putting forward recommendations on where
the work should focus. This cooperation has been on-going during the
project, where invited sectors were able to offer good ideas and evaluate
the research process with the investigating scientific parties.
If any of the scenarios forecast by the IPCC become reality, this handbook
can point the way forward as to what will happen to groundwater systems
and the subsequent consequences for society. Furthermore, it can be used
as input for development of climate proof regional river basin manage-
ment plans according to EU directives and guidelines.
The handbook contains special themes related to groundwater manage-
ment and the appendix contains results and experiences gained in the
pilot areas.
We hope that this handbook will provide inspiration to authorities’ and
planners in local, regional and national offices, civil engineers, water man-
The CLIWAT Handbook 7
agement companies and other professionals dealing with climate change
and groundwater.
Visit www.cliwat.eu and explore the CLIWAT interactive results map and
much more.
We would like to express our gratitude to the individuals and public,private
organisations and companies who contributed to the project and to the EU
Interreg IVB North Sea Region Programme for making it possible.
Sincerely,
The CLIWAT partners
The Netherlands
Deltares
Wetterskip Fryslân
Provincie Fryslân
Vitens
Belgium
Ghent University
Germany
LIAG (Leibniz Institute for Applied Geophysics)
BGR (Federal Institute for Geosciences and Natural Resources)
LLUR (State Agency for Agriculture, Environment and Rual Areas)
SeeConsult GmbH
Denmark
Aarhus University
GEUS (Geological Survey of Denmark and Greenland)
Danish Ministry of the Environment Nature Agency
Municipality of Horsens
Region of Southern Denmark
Central Denmark Region
December 2011

8 The CLIWAT Handbook
2 Summary
Chapter three provides an overview of the most widelyknown challenges
related to water in a future climate in the CLIWAT projectarea. The chal-
lenges vary between sectors due to different planning schedules.
Chapter four describes eight themes related to groundwater and climate
change. The themes highlight areas of special focus when dealing with
groundwater and climate change.
From a groundwater perspective, rising sea level has special significance in
low lying coastal areas and on islands. The amount of local sea level rise
is dependent on the predicted worldwide sea level response on climate
change and the local land subsidence/uplift (Section 4.1).
Polder areas are low-lying areas with a delicate management system in
order to keep the areas dry by transporting excess water to the sea. In view
of future climate this management and the amount of fresh water is under
pressure in these areas (Section 4.2).
Groundwater resources on islands are often under great pressure due to
the large amounts of extracted water during the summer season and spe-
cial care for management of land use and abstraction strategy (Section 4.3)
is needed.
During the CLIWAT project a number of geophysical, monitoring and geo-
chemical methods to describe the subsurface were tested and developed
further. Overviews of relevant methods are given in Section 4.4.
Groundwater and integrated hydrological models serve as the main pre-
dictive tools when we try to describe the effects of future climate condi-
tions, e.g. in river basin management plans as required by the EU Water
Framework and Groundwater Directives. Although models are presently
used as important tools for predicting climate change impacts, significant
challenges still remain with respect to accuracy and reliability of the mod-
The CLIWAT Handbook 9
els. Describing future shallow geological formations and groundwater res-
ervoirs in the countryside and in the cities with many manmade installa-
tions constitutes a major challenge. Read more in Section 4.5.
Groundwater reacts differently depending on the local geology, which
forms the basic settings for the hydrological systems. In clay-rich areas
much of the increased precipitation will runoff rapidly into the streams,
while the groundwater table in sandy areas will rise significantly due to
increased precipitation. Section 4.6 elaborates this theme.
Rising groundwater in urban areas is posing a special challenge. Section 4.7
describes the quality aspect of groundwater seen from an urban perspec-
tive and illustrates the importance of including climate change in con-
struction industry project planning.
From the many investigations predicting future conditions in the ground-
water reservoirs a number of thematic maps can be outlined, which can be
used in planning and management. Examples of thematic maps are given
in Section 4.8.
One of the important and challenging aspects of the adaptation process
when dealing with climate change and water is getting stakeholders in-
volved.
Chapter 5 deals with the process of understanding the importance of in-
volving stakeholders, establishing a participatory process and achieving
goals.
Through a stakeholder process such as the one implemented in the CLI-
WAT project, it is possible to raise local, regional and national awareness
of an issue. Moreover, the participatory process of this project has demon-
strated that there are numerous effective solutions that can be developed
and implemented when stakeholders work together to create win-win situ-
ations – both for individual sectors and society as a whole.
An overview of existing and future EU legislation and guidelines that have
special relevance to groundwater is given in Chapter 6. The chapter high-

10 The CLIWAT Handbook
lights some of the CLIWAT results in an EU policy perspective. Further-
more, Chapter 7 puts the CLIWAT project into perspective.
In the future we have to be able to create cost-effective methods for de-
scribing climatic effects on groundwater on a local scale, with accuracy and
detail that both planners and engineers can use in their daily planning
and construction projects.
This means that we have to develop:
Cost-effective methods (e.g. geophysical, effective drillings, geochem-
istry) to describe the nearsurface geology
Easy understandable and manageable groundwater models that de-
scribe groundwater flows and solute transport in the uppermost part
of the aquifer that is suitable for planning and engineering purposes
on a local scale
Well considered monitoring of the groundwater systems on a local
scale
A better understanding of future leaching from point sources and agri-
cultural areas in order to develop new standards for best practice
An integrated stakeholder approach
Efficient on-line data presentation and dissemination tools which can
be updated with new results and predictions
The CLIWAT project investigations have been carried out in seven pilot
areas, all situated in the North Sea Region. In the appendix you will find a
description of the challenges and results in each of the pilot areas.
The CLIWAT Handbook 11
3 Challenges in the future climate – an overview
The challenges related to adaptation to future climate change vary widely
from sector to sector. Some sectors may adapt gradually as climate changes
occurs, while others such as in the area of infrastructure planning may
have to make tough decisions that last for many years. Adaptation in one
sector may also influence adaptation requirements in other sectors, either
by presenting new opportunities or by creating new problems. Cross-or-
ganisational and sectoral cooperation is needed to produce viable solu-
tions.
This chapter can be used as an overview and checklist when working with
adaptations related to climate-change impact on water and water resourc-
es. The themes are grouped as follows:
Surface water, sewage and drainage systems, and wastewater treat-
ment plants
Groundwater, water supplies and groundwater protection
Open countryside
Protecting houses, roads, railway lines and other technical installa-
tions
Physical planning
Multifunctional solutions
Climate change adaptation is in its infancy but it is an area of growing focus.
The changes are forecasted to take place into the future, so it’s natural to ask
why should we work on the problem now? A short answer to that question
is: Prudent planning and adaptation saves a great deal of money (EEA report
no.4, 2008). An example from Denmark shows that climate change adaptation
costs approx. 20% of the costs of repairing damage in a situation where there
has been no adaptation (Central Denmark Region, 2010; Danish Ministry of
Environment, 2007).

12 The CLIWAT Handbook
3.1 The climate change scenario
CLIWAT has taken its point of departure from the Intergovernmental
Panel on Climate Change (IPCC) Assessment Reports and its respective
A2 climate scenario. The A2 scenario is a moderate scenario based on a
moderate growth in the global economy and slow reductions in the emis-
sion of greenhouse gasses.
Based on key climatic parameters in the A2 scenario, we can expect in
2100:
Temperature Higher Greater variation
Windspeed Higher Greater variation
Precipitation More Greater variation
Extreme events More Greater variation
Sea level Higher Continuously increasing
There are 20 climate models set up worldwide, and there are 11 climate
models for Europe. The climate scenarios are predominantly unequivocal
for the period 2010–2050. After 2050, model forecasts diverge and thus
post-2050 scenarios are subject to a great deal of uncertainty.
The CLIWAT Handbook 13
Scenario A2Country DK DE NL BELANDAnnual mean temperature
+3.1 °C +2.9 °C +2.0 °C - +4.0 °C +3.6 ºC
Winter temperature
+3.1 °C +3.6 °C +1.8°C - +4.6 °C +1.5 °C - +4 ºC
Summer temperature
+2.8 °C +2.7 °C +1.7°C - +5.6 °C +2.4 °C - +7.2 ºC
Annual precipitation
Winter precipitation
+43% +25% +7% - +28% 0 - +64%
Summer precipitation
-15% -5% -38% - +6% -76% - 0%
Maximum daily precipitation
+21% +8% - +54% +20%
SEAAverage wind +4% +5% -2% - +8% +15%
Max. water level at coast
+0.45 - +1.05 m(excl. land sub-
sidence)
+0.94 m (including
land subsid-ence)
+0.35 - +0.85 m(excl. land
subsidence)
+ 0.7 m
LAND AND SEAMax. storm strength
+10% +6% +10 %
Table 3.1.1 IPCC’s Climate scenario A2 (year 2100) is used in the pilot studies
as a common frame. In the table each country specific figure is listed. It should
be stressed that in all countries there are a number of scenarios which give rise
to different intervals for future climate conditions. The figures given above were
supplied either by Torben Sonnenborg, GEUS (DK), Hans Sultzbacher, LIAG (DE),
Gualbert Oude Essink, Deltares (NL) or from reference (BE) Willems, P et al, 2009.
The maximum water level at the coast predominantly depends on whether
the land is rising or subsiding in the areas. Read more details about this
issue in the section “Relative sea level rise in future” in section 4.1.

14 The CLIWAT Handbook
3.2 Many sectors are affected
Many sectors are affected by climate change. The urgency or demand for
adaptation depends on the decision times and lifetime of the installations,
crops, etc., in the individual sectors. Therefore, some of the sectors will
need to adapt before others.
Sector Years
Insurance-related aspects 0–1
Farming 1–5
Fisheries 2–10
Health 1–20
Emergency readiness 1–20
Water supplies 5–60
Energy supply 5–60
Countryside and countryside protection 2–100
Forestry 40–120
Land use planning 4–500
Buildings and facilities 10–500
Coasts & dikes 10–>1,000
Table 3.2.1 Some individual sectors and an assessment of their
planning schedules (Central Denmark Region, 2010)
3.3 Surface water, sewage and drainage systems, and wastewater treatment plants
We can distinguish between different types of water: waste water, lightly-
polluted water from overgrown areas and water drained from town areas
affected by rising groundwater, and pure water that overflows from water-
courses and groundwater.
Sewage systems are dimensioned to be able to deal with water from ordi-
nary daily use, so the challenge is to keep the other types of water out of
the sewage system. Thus the motto: “Keep water locally and use it in new
ways in production, urban spaces and in the countryside”.
The CLIWAT Handbook 15
Points for reviewing:
How do we lower water flow generated by heavy downpours to a level
that our systems can manage?
How do we handle floods from the sea or larger watercourses?
Should sensitive buildings or installations be pulled back from flood-
threatened areas (planning) or be made safe (adaptation)?
How do we create simple waste water plants to deal with lightly-pollut-
ed runoff from roads and drained groundwater?
How can we work with green solutions in construction (e.g. eco roofs
and walls) and parks and countryside management (e.g. local lakes or
moors) to strengthen evaporation and cooling and minimise runoff?
Where and how can we use infiltration to move excess water to the
groundwater?
Figure 3.3.1 In the open countryside. The image shows there was space
here which could take flood water from the river, which diminished
the risk of flooding further downstream in the town. Gesager Å, West
of Horsens. Photo Tony Bygballe, Horsens Municipality.

16 The CLIWAT Handbook
3.4 Groundwater, water supplies and groundwater protection
Depending on the geographical location, the changed precipitation pat-
terns, generally with more rainfall in winter and less in summer, are ex-
pected to result in diverse effects on groundwater. In many areas (e.g. Den-
mark, and border areas between Germany and Denmark) groundwater
levels are expected to rise. The impact of climate change is also expected to
be a function of catchment characteristics, where sandy areas will experi-
ence higher groundwater recharge than clayey areas. Higher winter pre-
cipitation is fundamentally positive with respect to groundwater resources
but it can also create problems in the form of increased runoff in rivers
and flooded fields and cellars in areas where extra water is being added to
the local groundwater reservoirs. Dryer summers may result in higher de-
mands for irrigation, which will increase pressure on the water resources.
We can see what the future means for deeper groundwater reservoirs with
a fair degree of confidence. When we examine potential local problems
that will arise from shallow groundwater reservoirs, the future is far more
difficult to predict.
It is unclear if the quality of the formed groundwater will remain the same.
Increased leaching of pesticides and nutrients from agricultural areas may
be a problem, which may only be remedied by using other kinds of crops
or agricultural management systems. The increased CO2 levels in the at-
mosphere will cause root systems to become stronger and this will result in
better uptake of nutrients. Contaminant leaching from polluted areas may
increase in total but it is unclear if concentration levels in the filtered water
will change. In coastal areas increasing sea water levels are expected to
result in problems with salinisation. This will adversely affect many good
groundwater reservoirs, leaving useless groundwater behind.
Points for reviewing:
Waterworks – examine facilities and wells to find out if they are at risk
from flooding
Assess if the catchment area of waterworks will change as a conse-
quence of changing groundwater levels
The CLIWAT Handbook 17
Identify potential waterlogged areas in the future
Consider a strategy to manage field irrigation in dry summers and
investigate if water reservoirs collecting winter precipitation can be
installed to irrigate fields
Consider the possibility of strengthening the capacity of the soil to
retain water by using a higher quantity of organic material
Consider the possibility of using targeted afforestation to reduce the
formation of groundwater in key areas
Ascertain if there are polluted sites that are especially exposed to
runoff, flooding or increased leaching
Carry out a study to identify where it is possible to infiltrate roof water
and street water
Outline groundwater bodies in risk of salinisation and consider new
extraction strategies in the well sites to minimise the problems
3.5 Open countryside
The altered precipitation pattern means that more areas in the open coun-
try will be waterlogged for most of the year due to rising groundwater. The
watercourses must be able to handle more powerful downpours and dry
summers must be dealt with.
The open countryside is characterised by the fact that there is more space
to accommodate large climate adaptation solutions, but the many small
solutions that can be found in the countryside (“hydro brakes”) could pro-
vide a high degree of multi-functionality (more attractive countryside, less
erosion, reduced nitrogen and pesticides, and function as reservoirs that
can be used in the dry summers) and be a valuable part of the solution.
Points for reviewing:
Analyse catchment watercourses and identify storage points and
watercourse constriction areas with the potential for retaining water in
extreme situations

18 The CLIWAT Handbook
Consider where waterlogged land in catchment areas will be, by using
groundwater models and interviews with local landowners
Consider catchment areas where wetlands can be established perma-
nently and area for temporary flooding in shorter periods
Consider which functions can be placed in any new wetlands (e.g.
countryside close to the city, new biotopes, nitrogen removal, sedi-
mentation areas, etc.)
Ascertain if infrastructure, such as road embankments can interact
with wetlands
Plan how and where protected areas for cultivation can exist
Examine the catchment area widely and find small areas that can be
used as hydro brakes and local reservoirs that perhaps have several
functions
Consider how to establish cooperation with landowners regarding
projects
Figure 3.5.1 Nature finds its own solutions. This corner of a wheat-field acted as a
temporary water storage area after heavy rainfalls saturated the soil and the local
groundwater reservoir. The farmer found that it was a problem. We should cooperate
with local farmers and other interested stakeholders to look for new multifunctional
solutions for small areas, like the one pictured above. A local water reservoir that
handles extreme weather events may also operate as a recreational area, for growing
willow as a biofuel resource or perhaps just a natural waterhole for local wildlife.
Hovedgaard, North of Horsens. Photo Jes Pedersen, Central Denmark Region.
The CLIWAT Handbook 19
3.6 Protecting infrastructure and technical installations
The most significant effects will come from rising sea levels and respec-
tive increased storm floods, from rising groundwater and from increased
precipitation, both from long-term winter precipitation and from more
extreme and intensive downpours in the summer and autumn months.
The essential problem is that many of our towns and transport routes,
forms of transport, manufacturing, residences and ways of living are
placed in locations that are appropriate for historic water levels and cli-
mate. These relationships have now changed so much that we must con-
sider if some of our towns, infrastructure, etc., are correctly located and the
technologies we are using are sustainable and future-proof.
On the positive side, climate change means greater utilisation of increased
solar energy, wind energy, temperature, and increased volumes of rainwa-
ter and groundwater.
Points for reviewing:
Map where there is a risk of damage from rising groundwater, storm
floods or watercourses
Carry out an analysis to ascertain if there are any facilities in risk areas
Consider if individual buildings/installations should be protected from
climate change or if there should be centralised solutions (like dykes)
for large areas, e.g. towns and cities
Consider if the establishment of climate change protection can provide
several functions and interplay with other functions in the area
Compile a catalogue of simple technical solutions that can be continu-
ally and successively implemented, e.g. in the case of maintenance
Establish a demonstration area, where specialists and the general
public can see examples of climate solutions

20 The CLIWAT Handbook
Roads and railways
The impact of raised groundwater level will affect existing roads and rail-
ways. In low-lying areas, groundwater will flow into underground road and
rail infrastructure, which will cause a change in structural stability. This
may lead to cavities, penetration damage or even a collapse of the struc-
ture.
For existing roads and railways, damage prevention measures can be in-
troduced during planned restoration or maintenance while new roads will
have to be built with a draining system adapted to the changed conditions.
In larger structures, the local hydrological system has to be understood
and local groundwater models are a useful tool for establishing a basis for
designing an appropriate draining system. For example, the Danish road
directorate is modelling the effects of changed groundwater conditions to
foresee the hydrological changes on the drainage of the road network. This
work is done in collaboration with partners in the CLIWAT project and has
been included in the Danish national board established in the CLIWAT
project.
Figure 3.6.1 A motorway in central Jutland where the bottom is situated 7 m beneath
terrain and below the present groundwater level. After Danish Road Directorate.
Ancorage
PresentGroundwater level
The CLIWAT Handbook 21
3.7 Physical planning
Climate change adaptation planning is not yet an area incorporated into
planning in many areas.
Planning for climate change adaptation requires a high degree of cross-
organisation work and total solutions. Everyone contributes and owns the
solutions. The optimum solution is one that integrates reductions in CO2
emissions and climate change adaptation in a concerted plan. The publica-
tion of climate change adaptation planning requires care, so that no single
landowner is unnecessarily disadvantaged when pointed out.
Points for reviewing:
If possible, make a factual theme map that shows flood-threatened
areas (from rising groundwater, watercourses, lakes and sea) and
flood-proof areas
If possible, make a map showing risks, where Risk = damage extent x
probability
Using the above-named maps, a long-term plan should be devised at
a regional and municipal level. In connection with this, consider how
interested parties can be involved in a debate about visions
Prepare a climate change adaptation plan with maps that show:
Dry areas
Flood-threatened areas with shared protection (dykes, etc.)
Flood-threatened areas with individual flood-proof buildings
Areas exempted from future construction
Areas where water can be stored
Areas laid out as future storage basins
Areas where local filtration of rainwater can take place
Consider whether contingency plans should be prepared for specially
threatened local areas.
Consider establishing beacon projects with examples of exciting inte-
grated planning.

22 The CLIWAT Handbook
3.8 Multifunctional solutions
Climate change adaptation is not necessarily rocket science. Solutions for
many of the described problems already exist today.
What is crucial is the ability to combine individual solutions from differ-
ent sectors and think about the positive aspects of climate change. A good
combination can actually create new values for society and make the com-
ing work considerably less expensive.
The key concept is good processes between different players involved in
climate change adaptation. With an open mind, participants can discover
together and search for the win-win situation; where individual sectors use
each other in useful ways.
All of the elements should provide multifunction in the future, in such a
way that they contribute to good climate change adaptation.
The CLIWAT Handbook 23
4 Climate and groundwater
In this chapter a number of themes of special interest to future challenges
in respect of groundwater are described.
From a groundwater perspective, rising sea level has special significance in
low lying coastal areas and on islands. The amount of local sea level rise
is dependent on the overall sea level rise and the local land subsidence/
uplift (Section 4.1).
Polder areas are areas with a delicate management system in order to keep
the areas dry by transporting excess water to the sea. In view of future
climate the amount of fresh water is under pressure in these areas (Sec-
tion 4.2).
Groundwater resources on islands are often under great pressure due to
the large amounts of extracted water during the summer season (section
4.3).
During the CLIWAT project a number of methods to describe the subsur-
face were tested and developed further. Overviews of relevant methods are
given in Section 4.4.
Groundwater and integrated hydrological models serve as the main pre-
dictive tools when we try to describe the effects of future climate condi-
tions, e.g. in river basin management plans as required by the EU Water
Framework and Groundwater Directives. Although models are presently
used as important tools for predicting climate change impacts, significant
challenges still remain with respect to accuracy and reliability of the mod-
els. Describing future shallow formations and groundwater reservoirs in
the countryside and in the cities with many man-made installations is a
major future challenge. Read more in Section 4.5.

24 The CLIWAT Handbook
Groundwater reacts differently depending on the local geology which
forms the basic settings for the hydrological systems. In clay-rich areas
much of the increased precipitation will runoff rapidly in the streams,
while the groundwater table in sandy areas will rise significantly due to
increased precipitation. Section 4.6 elaborates this theme.
Rising groundwater in urban areas is posing a special challenge. In sec-
tion 4.7 describes the quality aspect of groundwater seen from an urban
perspective and illustrates the importance of including climate change in
construction industry project planning.
From the many investigations predicting future conditions in the ground-
water reservoirs a number of thematic maps can be outlined, which can be
used in planning and management. Examples of thematic maps are given
in Section 4.8.
4.1 Sea level changes with special focus on land subsidence
Sea level rise is caused by several interacting factors, some may result in a
rise and others may result in fall. When we are dealing with the sea level
rise related to global warming, we can identify two main components: Sea
level rise is caused essentially by the expansion of sea water due to tem-
perature increase and the melting of glacier ice in the Arctic and Antarctic
regions. However, there are other factors which contribute to the relative
movement of sea level at a local level. In the following section land subsid-
ence at the “CLIWAT” North Sea Coast is evaluated.
Land subsidence varies in magnitude and form in a complex pattern along
the North Sea coast. This can be seen in Fig. 4.1.1, where the expected land
subsidence for the Netherlands after the first half of the current century
is displayed. The main consequence of land subsidence at the North Sea
Coast in combination with global warming is a significant rising sea level.
The CLIWAT Handbook 25
< -0,6-0,6 - -0,5-0,5 - -0,4-0,4 - -0,3-0,3 - -0,2-0,2 - -0,1-0,1 - 00 - 0,05 (rise)
LegendLand Subsidence
The reasons of this subsidence are different. Land subsidence is caused by
crustal movements which cannot be solely attributed to tectonic activities.
It clearly contains a non-linear, glacial- and/or hydro-isostatic component,
which is only small on the Belgian coastal plain but increases significantly
along the Dutch and the northwest German coast. The subsidence is at
least in part related to the post-glacial collapse of the so-called peripheral
fore bulge which developed around the Fennoscandian centre of ice load-
ing during the Last Glacial Maximum (a. Vink, et al, ) (A. Daschkeit and H.
Sterr 2003).
Fig. 4.1.1 Expected land subsidence for the Netherlands in meters after the first half
of the current century. The overall subsidence is 10–40 cm, locally up to 80 cm.

26 The CLIWAT Handbook
A further relevant process for land subsidence is caused by the compac-
tion of peat which occurs in wide areas of the North Sea coast. The peat
is compacted due to the pressure of the overlying sedimentary layers (H.
Streif, 2004), dewatering and oxidation. Clay shrinkage, peat oxidation,
deep salt mining and/or oil and gas extraction can also contribute to land
subsidence.
Land subsidence plays a subordinate role on the Belgium coast and on the
Dutch North Sea island but its impact on the German East Frisian islands
should be considered. For the pilot area of Borkum, a subsidence figure
of 15 cm was used as a best estimate extrapolation from regional values
described in the literature.
The amount of sea level rise for the German North Sea using the IPCC
emission scenarios (IPCC 2007) has been computed by S. Rahmstorf (2007).
Fig 4.1.2 illustrates the predicted sea level change for different IPCC emis-
sion scenarios. Using the IPCC-A2 scenario from 1995 until 2100, includ-
ing land subsidence, the sea will have changed its elevation by 1 m or 0.94
m from 2010 to the year 2100. This value will be used for the simulations
with the numerical model in Pilot Area D Borkum. Rahmstorf also esti-
mates the possible error in the computations for the sea level (marked
grey in Fig. 4.1.2).
Fig.4.1.2 Predicted sea level rise (without accounting for the subsidence) of the
German North Sea until 2100 using the IPCC-A2 scenario (after Rahmstorf 2007)
The CLIWAT Handbook 27
4.2 Polder areas
Polders are low-lying areas enclosed by dunes, dikes or more elevated sur-
rounding areas (fig 4.2.1). They are frequently found in The Netherlands,
Belgium and parts of Denmark and Germany. They have their own net-
work of artificial drainage channels, which are used to manually control
the water level. Good management of the water level is imperative for
those areas that are used for agriculture.
Coastal aquifers will become more saline due to salt water intrusion and
this could lead to a loss in fresh groundwater resources. In addition, low-
lying delta areas have another process called seepage, i.e. upward flow of
groundwater because a higher hydraulic head in the first aquifer, which is
situated just below the Holocene confining layer, exceeds the phreatic and
surface water levels. Seepage will lead to more saline groundwater and sur-
face water systems, mainly because the seepage will come from brackish to
saline groundwater from old marine deposits.
Sea level rise and climate change will have a measurable impact on ground-
water and surface water management in the polder areas. With long term sea
level rise:
The discharge opportunities into the sea will decrease. A possible
consequence of this is that water will have to be stored longer in the
polder areas; so the storage capacity of the polder areas will have to
increase. Another possibility, already used in the polders below sea
level in The Netherlands, is to use pumps to discharge the water at a
higher sea level.
Seepage and seepage salinity will increase in the polder areas. In
many areas this will lead to an increase in the salt load of the surface
water system which will adversely affect fresh water resources and
crop yield when the saline water is used for irrigation.
The small fresh water lenses on top of the saline groundwater are at
risk of getting brackish when the seepage increases. Those small fresh
water lenses in saline seepage areas make agriculture possible.
Fresh water lenses that are situated in the areas with a small dune belt
are at a much greater risk of diminishing. Dunes acting as important
reservoirs for freshwater are threatened by saltwater intrusion. In
Belgium, the dimensions of the dunes differ from location to location.

28 The CLIWAT Handbook
Figure 4.2.1.a Conceptualisation of the Dutch and Belgium
coastal groundwater system. Figure 4.2.1.b Land subsidence in the
Netherlands during the past 1,000 years [van de Ven, 1993]
The CLIWAT Handbook 29
It’s expected that periods of heavy rainfall and severe storms will occur
more frequently in the future. Due to inadequate drainage, flooding may
arise during such periods of heavy rainfall. Inundation of agricultural and
urban areas causes economical damage. In the polder area these periods
of heavy rainfall could result in infiltration of important amounts of fresh
water in the aquifer, whereas at the present moment this fresh water is
drained away as quickly as possible. Additionally, severe storms may re-
sult in flooding whereby sea water inundates parts of nature reserves. In
this case, salt water will enter the aquifer. Consequently, these floods will
significantly alter the groundwater flow and the freshwater – saltwater dis-
tribution.
The impact on recharge patterns and polder drainage will also affect ag-
riculture. The predicted increase of periods of drought will cause a re-
duction of the small fresh water resources. The coastal plain groundwater
resources need to be monitored and protected to meet current and future
demands for water. Smart new methods for drainage can help to protect
polder area agricultural land from salinisation, drought and inundation.
Focus should be placed on the following:
Optimisation of drainage of the polder areas for drought, salinisation
and inundation
Maintaining or increasing the fresh water lenses in the dune areas
Maintaining or increasing the small fresh water lenses in seepage
areas
Monitoring the groundwater resources
Determining effects of climate changes compared to other effects on
groundwater resources in polder areas

30 The CLIWAT Handbook
Figure 4.2.2.a The influence of see level rise on the groundwater head
in the first aquifer in the Netherlands. Figure 4.2.2.b The depth of the
fresh-brackish interface of the groundwater in the Netherlands.
The CLIWAT Handbook 31
Figure 4.2.3 Depth to the 1,500 mg/l
isosurface in the central Belgian coastal
plain (Vandenbohede et al,2010).
Figure 4.2.4 Management and related groundwater level and surface
water level in polder areas during winter and summer (WES, 2005).

32 The CLIWAT Handbook
4.3 Groundwater resources on islands
Several sandy islands are situated in front of the Dutch, German, and
Danish coasts. They are called the Wadden islands. Based on the Ghyben-
Herzberg principle, a fresh groundwater lens has been established under
these islands. The dunes are rising several meters above sea level. As a con-
sequence of the increasing rainfall, the groundwater in the dunes subsur-
face rises (swell) to above sea level. The resulting formed isostatic pressure
pushes the interface of salt/fresh water downwards.
On a small area of the islands we can find a complete water cycle with all of
the associated components. The water lenses are the “beating heart” of the
water system of the island and make them unique. Humans (inhabitants
and tourists), plants and animals depend on this fresh water. The CLIWAT
project selected the islands Terschelling and Borkum as pilot areas, with
the aim of investigating the impact of increasing salt water intrusion and
shrinkage of the fresh water lens (caused by sea level rise) on barrier island
fresh water resources.
Groundwater & coastal defence
The dunes of the islands form a natural barrier against flooding and pro-
tect the people who live there. Structural erosion and loss of sediment will
have an effect on the equilibrium based on the Ghyben-Herzberg princi-
ple. In this case, with smaller dunes the coastal defence function will de-
crease, the groundwater table will become lower and the fresh water lens
smaller. The total effect will be that the risk of salinisation will increase.
Groundwater & ecology
We can find dry and wet environments close to each other among the
dunes, each with a huge variation of, mostly rare, plant species. The plants
in these dune slacks are strongly related to the site-specific quantity and
quality of groundwater. Disturbance of this eco-system caused by ground-
The CLIWAT Handbook 33
water abstraction, coastal erosion or climate change can have an adverse
effect on these fragile ecological systems in the dunes.
Groundwater & drinking water
For the drinking-water facilities, a greater part of these islands are depend-
ent on the fresh groundwater that can be found in the freshwater lens
under these islands. Water supply companies placed the screens of pump-
ing wells in this lens. Several factors can affect the sustainability of the
drinking water supply in the future. Naturally, the level of domestic water
consumption is one factor – will there be enough fresh water in this water
lens to produce the domestic water without risks for saline up-coning?
Another important factor will be the effect of sea level rise and climate
change on the distribution of the salt/fresh interface and the ‘shape’ of
the fresh water lens.
Hydrological water circle Wadden islands
Dunes PolderInner Dune-area
Wadden-sea
North-sea
Dike
fresh groundwater
Salt groundwaterSalt groundwater
Abstraction wells
Forest – Evaporation
Drainage
Salination
Fresh groundwater
Fresh groundwater
DrainageDrainage
Precipitation Evaporation
Groundwater table
Interface salt/fresh groundwater – fresh w
ater
lens
Figure 4.3.1 Cross-section hydrological water cycle

34 The CLIWAT Handbook
Groundwater & agriculture
On the south sides of the islands there is (reclaimed) marshland and ag-
ricultural land, used by farmers to graze their cattle. Until now the fresh
water supply of these areas has been based on a very shallow fresh water
lens. Sea level rise and an increase of salt seepage may change fertile and
healthy grassland into less valuable grassland. Will ‘traditional’ farming on
the islands remain possible when the climate changes?
The effect of climate change on groundwater on the islands
The ‘quality of life’ on the islands is strongly related to fresh groundwater,
based on a small-scale water cycle. Tiny changes in this cycle can have
effect for this quality of life for humans, animals and plants. The equilib-
rium between fresh groundwater and salt groundwater is the driving force
behind the hydrological system. For the near future, the major question is
how to manage the groundwater resources on these islands. Any effective
utilisation of the groundwater resources means there has to be enhanced
knowledge of the island subsurface. This information is essential to coun-
teract the hazards of the increased salt water intrusion and it is far more
effcient if we find out at an early stage.. It is important that we understand
how the water cycle and the hydrological system, works.
By carrying out examinations using bore holes and by systematically using
hydrogeological and geophysical methods (such as those utilised at Bor-
kum and Terchelling), the fresh water lens can be analysed becoming pol-
luted by the surface. Using numerical models and monitoring systems, the
configuration of the water supply well fields can be optimised in order to
prevent excessive salinisation caused by up-coning or saltwater intrusion
from the sea due to sea level rise.
That is why investing in research into the effects of climate change is nec-
essary and useful. It ensures we can manage our groundwater recourses on
the islands in a sustainable way!
The CLIWAT Handbook 35
Figure 4.3.2 Borkum North East coast 29 January 2007. Ten days after hurricane
»Kyrill«. Seawater is covering a large part of the land behind the dunes.
4.4 Investigation methods
Hydrogeological modelling is »the engine« to produce valid climate predic-
tions in the groundwater systems. In order to set up the groundwater mod-
els it is essential to have a comprehensive understanding of the geological
subsurface of the earth in the areas being investigated. Geophysical meth-
ods greatly contribute to the geological understanding of the subsurface
area and can be obtained without using the direct method such as bore-
holes or coastal profiles. The CLIWAT project focused on the development
of these geophysical methods (new as older) so that basic climate modeling
could be refined.

36 The CLIWAT Handbook
Essential data for the database for hydrogeological modelling in the CLI-
WAT project were thus obtained from geophysical measurements (e.g., Kok
et al. 2010, Burschil et al. 2011, Sulzbacher et al. 2011). In Table 4.4.1 the
main characteristics of the geophysical methods used in the project are
listed.
Actual situationGeophysical surveys Property / parameter contribution to model 1-D 2-D 3-D
Seismic methods Seismic velocity, elastic properties
Layer boundaries and poros-ity indicator
- P-wave X (x)
- S-wave X (x)
- VSP (vertical seismic profile) X
Resistivity methods Resistivity or conductivity
Layer boundariesSalinity / clay contentPorosity / permeability indicator
- EM (electromagnetic) X X X
- TEM (EM in time domain) X X X
- IP and DC (induced polarisa-tion and direct current)
X X (x)
GPR (ground penetrating radar)
Permittivity / dielectric constant
Near surface structure and water content --> mapping water table
X (x)
MRS (magnetic resonance sounding)
NMR-Amplitude and relax-ation time
Water content, effective po-rosity, hydraulic conductivity
X X
Gravity Density Structural features, modelling X (x)
Borehole and well logging Diverse Layer boundaries, salinity, clay content, water content, lithology
X
Direct push, CPT (cone penetration test) + additional tools
Sleeve friction and tip resistanceadditionally, e.g. resistivity, water sampling
Lithology discrimination (clay, sand)
X
Pump tests Hydraulic conductivity X
Dating age of groundwater Residence time X
Change in timeMonitoring Resistivity via vertical elec-
trode chain, etc.X X
Change in time and spaceModelling Variable density groundwater
flow and coupled solute transportHydraulic conductivity, trans-missivity, heads, storage coefficient
Changes in groundwater flow X
Table 4.4.1 Geophysical methods relevant for
groundwater research (see also Kirsch 2009).
The CLIWAT Handbook 37
In several pilot areas, airborne electromagnetic (SkyTEM or HEM) and re-
flection seismic surveys were carried out. The electrical resistivity measure-
ments obtained from SkyTEM surveys (Fig. 4.4.1) were used to delineate
freshwater bodies, saltwater intrusions, groundwater protective clay layers
and contaminant plumes. It was found that the problems of interpreting
resistivity data (saline groundwater versus clay) could be solved by includ-
ing MRS data in the interpretation (Günther et al. 2011). A correlation
between hydraulic conductivity and electrical resistivity was found from
borehole data. This could be used for an interpretation of the resistivity
distribution inside the aquifer in terms of the distribution of hydraulic
conductivities (Kirsch et al. 2011).
Reflection seismic surveys, backed by vertical seismic profiles, illustrate the
layer sequence in the groundwater, relevant to the range of depth. The
“classical” application was the detection of buried valleys (e.g. BURVAL
Working Group 2009) which were also found in the CLIWAT pilot areas.
On the island of Föhr (Pilot Area E), intense glacial thrust faulting was de-
tected (Fig. 4.4.1). This could lead to pathways for infiltration of rainwater
as well as contaminants into the groundwater body.
High resolution reflection seismic data were used as a constraint for the
interpretation of SkyTEM results. Taking the depth to seismic reflectors
as depth of resistivity changes, a more reliable resistivity cross section is
obtained, which enables a better interpretation of the layer sequence in
terms of water bearing sands, clayey protecting layers and saltwater intru-
sions (Fig. 4.4.1).
Also of special interest from a climate perspective, is an automated electri-
cal resistivity tomography system that monitors changes in the transition
zone between the freshwater lenses and the underlying saltwater on the
North Sea island of Borkum (Grinat et al. 2010). The system will help the
waterworks in understanding the effects of pumping and warn them in
case of up coning of saline groundwater.
The CLIWAT project shows that in the future we have to have a stronger
focus on how to describe the uppermost layers of the earth in order to
predict where groundwater flooding can pose a risk to infrastructure, etc.
38 The CLIWAT Handbook
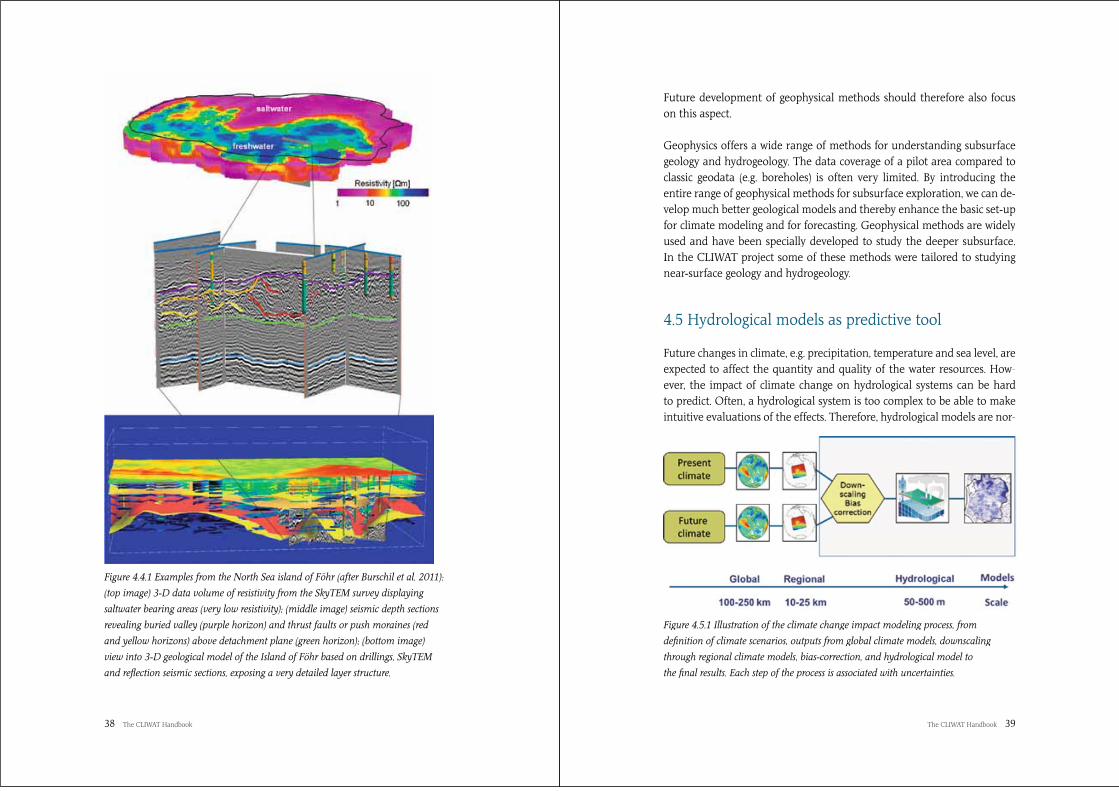
Figure 4.4.1 Examples from the North Sea island of Föhr (after Burschil et al. 2011):
(top image) 3-D data volume of resistivity from the SkyTEM survey displaying
saltwater bearing areas (very low resistivity); (middle image) seismic depth sections
revealing buried valley (purple horizon) and thrust faults or push moraines (red
and yellow horizons) above detachment plane (green horizon); (bottom image)
view into 3-D geological model of the Island of Föhr based on drillings, SkyTEM
and reflection seismic sections, exposing a very detailed layer structure.
The CLIWAT Handbook 39
Future development of geophysical methods should therefore also focus
on this aspect.
Geophysics offers a wide range of methods for understanding subsurface
geology and hydrogeology. The data coverage of a pilot area compared to
classic geodata (e.g. boreholes) is often very limited. By introducing the
entire range of geophysical methods for subsurface exploration, we can de-
velop much better geological models and thereby enhance the basic set-up
for climate modeling and for forecasting. Geophysical methods are widely
used and have been specially developed to study the deeper subsurface.
In the CLIWAT project some of these methods were tailored to studying
near-surface geology and hydrogeology.
4.5 Hydrological models as predictive tool
Future changes in climate, e.g. precipitation, temperature and sea level, are
expected to affect the quantity and quality of the water resources. How-
ever, the impact of climate change on hydrological systems can be hard
to predict. Often, a hydrological system is too complex to be able to make
intuitive evaluations of the effects. Therefore, hydrological models are nor-rr
Figure 4.5.1 Illustration of the climate change impact modeling process, from
definition of climate scenarios, outputs from global climate models, downscaling
through regional climate models, bias-correction, and hydrological model to
the final results. Each step of the process is associated with uncertainties.

40 The CLIWAT Handbook
mally used to evaluate the consequences of climate changes. Based on pro-
jections of the future climate and sea level, hydrological models are able to
quantify the temporal and spatial distribution of the consequences on wa-
ter resources and associated or dependent ecosystems. Hence, hydrological
models are important tools for adapting to future, e.g., river basin manage-
ment plans as required by the EU Water Framework and Groundwater
Directives. Although the models are currently used as important tools for
predicting climate change impacts, significant challenges still remain with
respect to their accuracy and reliability.
Types of hydrological models applied in CLIWAT
Different types of modelling tools have been used in the CLIWAT project,
including integrated hydrological models, Density dependent groundwa-
ter models and solute transport models. Integrated hydrological models
are typically used for problems that include the integrated assessment of
the evolution of both groundwater and surface water quantity and quality
such as the impact of groundwater abstraction on low flow in streams; the
effect of increasing precipitation and/or sea levels on flooding of coastal
areas and stream valleys, and discharge and nutrient loadings of associated
or dependent ecosystems. In CLIWAT, these types of models have been
used in Aarhus River (DK), Horsens (DK), and the trans-boundary Schleswig
area (DK/DE). Groundwater models are normally used for groundwater
protection and contamination problems, e.g., to delineate capture zones to
well fields or to predict the fate of contaminant leaching from deposits or
landfills. Groundwater models have been applied at Egebjerg (DK), Hoerlykke
(DK) and Föhr (DE). Density-dependent flow and solute transport models
have the ability to include the effects of density contrasts between seawa-
ter and freshwater, and are used to quantify the intrusion of saltwater into
coastal aquifers. Sea level rise will increase the risk of saltwater contami-
nation of the coastal aquifers that are presently used to supply domestic
and agricultural needs. In CLIWAT, such models have been applied at the
Belgische Middenkust (BE), the trans-boundary area of Zeeland (BE/NL),
and at the islands of Terschelling (NL) and Borkum (DE).
The CLIWAT Handbook 41
Figure 4.5.2: The effect of different grid sizes on the shape and volume of
shallow rainwater lenses, as well as the salt load to the surface water system.
Challenges
Although numerical models have been successfully applied in CLIWAT,
the work carried out during the project has also pinpointed several de-
ficiencies. Quantification of the impact of climate change on the hydro-
logical system is still facing several challenges. Below, the most important
shortcomings are briefly described.

42 The CLIWAT Handbook
Description of shallow formations
The CLIWAT project has demonstrated that in many places within the
North Sea Region, the description of the hydrological processes close to
the surface is challenging. First, the knowledge of the shallow geology is re-
stricted to information from boreholes. Geophysical methods such as air-
borne electromagnetic methods are presently not able to map the shallow
geology with sufficient accuracy and the construction of geological models
for this region is therefore exclusively based on sparse borehole informa-
tion. In addition, the amount of hydrogeological data describing shallow
formations is often relatively low since these aquifers are normally not
used as groundwater reservoirs and therefore not intensively monitored.
Hence, measurements of the groundwater levels, hydraulic parameters,
etc., are often sparse, which limits the reliability of the resulting model.
The description of the groundwater flow in near surface aquifers is also
complicated by the presence of artificial drains. Many areas in the North
Sea Region are characterised as lowlands. Both agricultural and urban
areas have been drained extensively during the last centuries to prevent
the soil surface from becoming inundated or saturated with water. How-
ever, the location and efficiency of the drainage systems are normally not
known. Additionally, the model description of the interaction between
groundwater flow and flow through drain pipes is not well established
when large scale models are considered. This lack of knowledge may result
in large uncertainties with respect to quantification of the risk of inunda-
tion in a future climate.
Urban areas
The study of the impact of climate change in urban areas has tradition-
ally focused solely on the risk of flooding due to the limited capacity of
sewage systems. Climate change will however put additionally pressure on
many cities which require that an integrated assessment of groundwater,
surface waters and the sewage system. These systems are expected to in-
teract more often in future situations, in response to extreme precipitation
events or in periods where large volumes of precipitation are expected,
The CLIWAT Handbook 43
particularly during winter. In such periods, the initial wetness of the urban
area is important and the interaction between the different zones is im-
portant. Software that describes the entire hydrological system, including
the sewage system, is not included in standard packages. Additionally, the
knowledge of and experience with working with such an application of
integrated model systems is required.
Describing groundwater flow in an urban area is complicated because the
shallow aquifers and soil are often highly disturbed due to various con-
struction activities, including the installation of sewage and water supply
systems, roads, buildings, etc. Hence, if accurate predictions of the flow
through shallow groundwater and the interaction with surface waters are
to be produced, knowledge of the “anthropogenic” geology has to be pro-
vided. Methods for investigating and interpreting the geology of these an-
thropogenic settings are required.
Scale and resolution of model and data
Computer technology and modelling have developed fast during the last
decade and it is now possible to describe large areas with a relatively high
resolution (small grid elements). In Table 1 a list of recommended resolu-
tions for different phenomena is provided. Modelling transient large-scale
flow and transport in 3D groundwater systems is technical possible, but
techniques to properly solve the advection-dispersion equation are often
very time consuming. Using the wrong scheme may result in many months
of calculation time and/or unacceptable mixing of fresh-brackish-saline
groundwater systems due to large numerical dispersion. For instance, the
grid Peclet number condition imposes that the dimension of the element
should be not greater than a few times the magnitude of the longitudi-
nal dispersivity that represents hydrodynamic dispersion. Some computer
codes base the solution of the advection-dispersion equation on standard
finite element or finite difference techniques and must satisfy this (Peclet)
condition of spatial discretisation. In practice, this means that many hun-
dreds of millions of elements are required to correctly model large-scale
coastal hydrogeologic systems, which is a time consuming task. However,
compared to the 1990s, memory capacity is no longer a problem.

44 The CLIWAT Handbook
Figure 4.5.3 Three 2D profiles of chloride concentration in the subsurface
and flow toward ditches. Cell-size is increasing downward. It shows that
the horizontal cell size determines whether the up-coning occurs or not,
effecting the salt load estimation towards the surface water system.
The CLIWAT Handbook 45
However, in order to obtain accurate predictions of the hydrological vari-
ables (groundwater level, salinity, etc.), fine discretisation of the numerical
model is not a sufficient requirement. High resolution data on the forma-
tion properties and the state of the present system, e.g. hydraulic head,
are also needed as input to the models. High resolution data on hydraulic
properties are often missing, which ultimately limits the potential accuracy
of the model results. Basically, frequently there is not enough hydrogeolog-
ical data available to carry out calibration and verification. Data collection
should be intensified, which is time and budget consuming, though new
innovative monitoring techniques are currently available (e.g., airborne
geophysics, online via satellite). However, we have to accept that the collec-
tion of data will always lag behind the developments in computer model-
ling, especially in data-poor areas.
Sufficient amounts of data are obviously important: for instance, with-
out knowing the initial salinity distribution, it would be unwise to take
expensive measures. In a variable-density flow system, the initial density
that should be implemented in the numerical model can highly determine
the velocities and thus the transport of fresh, brackish and saline ground-
water. An accurate 3D density matrix can be critical for the accuracy of
the model. Under certain hydrogeological conditions, the initial density
distribution for a numerical model can be derived by just simulating the
groundwater flow system under consideration for many (tens of) years un-
til a steady-state situation from a density point of view is achieved. For
instance, the initial (undisturbed) density distribution of a freshwater lens
in a dune area can be derived by implementing natural fresh groundwater
recharge in a completely saline aquifer system and simulate the system
long enough, e.g. 100 years. The obtained steady-state density distribu-
tion will probably be the original distribution without human activities
as groundwater extractions. Unfortunately, many coastal aquifer systems
are at present not in dynamic equilibrium, for instance due to long-term
sea level fluctuations or large-scale human activities with long-term ef-
fects on the groundwater system (e.g. the reclamation of low-lying areas in
the Dutch coastal zone during the seventeenth century). For these specific
cases, the best estimate of the ‘initial’ density distribution is probably the
present measured one. In general, data of the density distribution is often
46 The CLIWAT Handbook
scarce, and 3D modelling of variable-density groundwater flow in coastal
aquifers is often based on insufficient amounts of good quality data.
At a very large scale (national scale), the resolution of the hydrological
models are typically in the order of hundreds of metres (e.g., 250 m or 500
m). Models at this scale are useful for obtaining an overall assessment of
the water resources. However, they may be too coarse to accurately de-
scribe local phenomena such as capture zones or solute transport locally.
A solution to this problem may be to use nested models; a methodology
that combines global and regional climate models and which is routinely
used within the climate research community. Hydrology may to a large
extent take advantage of this methodology by developing standardised
methodologies for the coupling of e.g. national or regional models to local
models.
Quantification of modelling uncertainty
It is important to emphasise that the predictions generated by hydrologi-
cal models exhibit a wide degree of uncertainty. First, the climatic input
to the hydrological models is not known precisely. The emission of green-
house gasses, which is the driving force of climate changes, is based on
scenarios for the future which by definition are associated with significant
uncertainty. The projections of future climate are quantified using climate
models and comparison of the results from different climate models re-
veals that an additional and significant source of uncertainty is found
here. Secondly, the hydrological models represent simplifications of the
natural systems and can therefore not be expected to provide an exact
representation of the reality. Different types of hydrological models or dif-
ferent setups of the same modelling system will produce different results.
Hence, an additional degree of uncertainty can be related to the hydro-
logical model itself.
Hence, the predictions of future impacts on the hydrological systems are
associated with significant uncertainties which should be kept in mind
when used for water management decisions. However, it should not
prevent the use of model results when making plans for the future be-
The CLIWAT Handbook 47
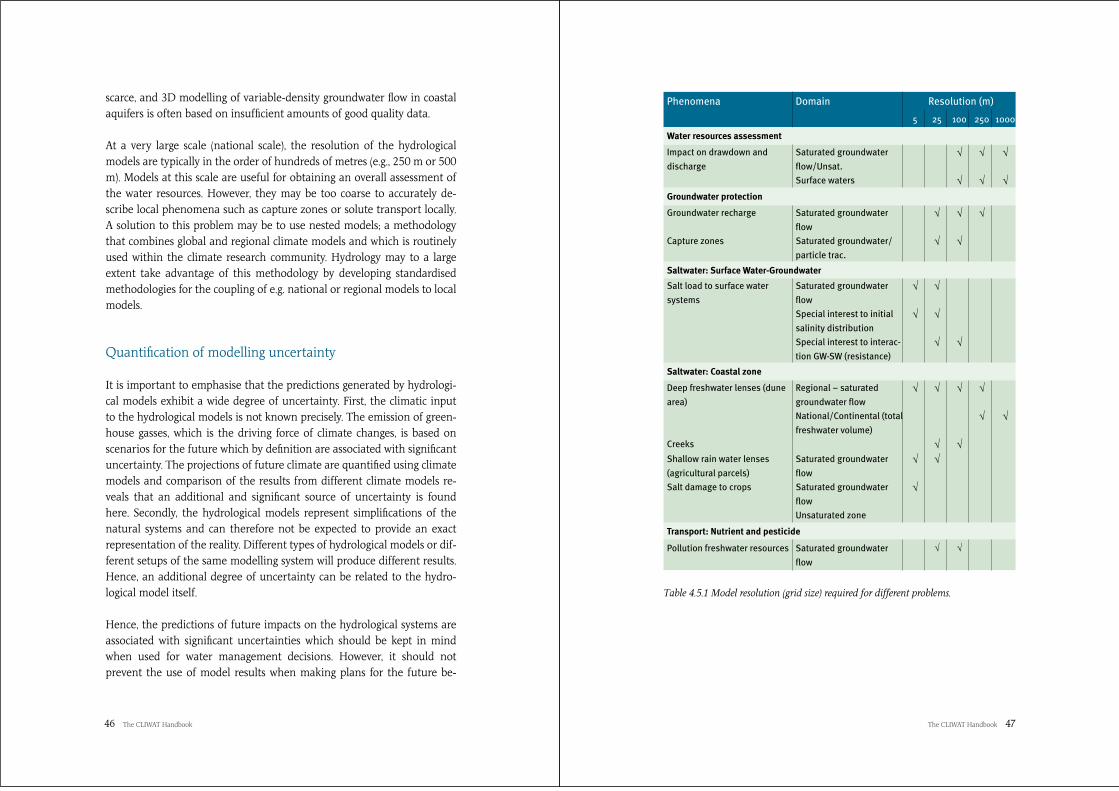
Phenomena Domain Resolution (m)
5 25 100 250 1000
Water resources assessment
Impact on drawdown and
discharge
Saturated groundwater
flow/Unsat.
Surface waters
Groundwater protection
Groundwater recharge Saturated groundwater
flow
Capture zones Saturated groundwater/
particle trac.
Saltwater: Surface Water-Groundwater
Salt load to surface water
systems
Saturated groundwater
flow
Special interest to initial
salinity distribution
Special interest to interac-
tion GW-SW (resistance)
Saltwater: Coastal zone Deep freshwater lenses (dune
area)
Regional – saturated
groundwater flow
National/Continental (total
freshwater volume)
Creeks
Shallow rain water lenses
(agricultural parcels)
Saturated groundwater
flow
Salt damage to crops Saturated groundwater
flow
Unsaturated zone Transport: Nutrient and pesticide
Pollution freshwater resources Saturated groundwater
flow
Table 4.5.1 Model resolution (grid size) required for different problems.

48 The CLIWAT Handbook
cause the models provide a unique possibility and the best possible way
to quantify the effects of climate change. Instead, the uncertainty should
be included in the decision-making process and used to make sustain-
able solutions to future challenges. However, this requires that operational
methods for quantifying the many uncertainties are developed, which is a
significant challenge.
4.6 Geology and climate response
This chapter illustrates the importance of geological settings in relation
to climate changes, with the exception of low lying delta areas. The pro-
jected change in precipitation varies regionally, and different hydrological
systems can react in various ways to the same introduced changes. Local
effects from climate changes vary, depending on the local geology which
forms the basic settings for the hydrological systems.
Groundwater resources located in areas at some distance from the sea
are almost unaffected by sea level rise. The magnitude of the hydrologi-
cal response to the simulated climate change is highly dependent on the
geological setting of the investigated model area (Roosmalen et al 2007).
To illustrate the matter, two overall geological settings are presented: Clay-
eyareas and Sandy areas.
Clayeyareas
In clayey areas the topsoil is dominated by low-permeability soils and the
aquifers are protected by thick clay layers of regional extent. Only minor
changes in groundwater levels are predicted. The groundwater models set-
up in the CLIWAT project shows a slight increase in groundwater head in
the clayey areas. However an increase in runoff is expected.
As the groundwater table will rise slightly, the amount of groundwater
available for extraction for domestic water supplies will likewise increase
slightly. As the soil cannot absorb water from heavy rainfalls fast enough,
the peak flow in the rivers will increase dramatically, new wetlands will
The CLIWAT Handbook 49
arise and many new areas will need drainage in order to continue to be
used for arable farming and forestry. In “normal years” irrigation will not
be needed in clay-dominated soils due to the high water storage capacity
of the soil. In very dry summers, many watercourses will dry out in longer
dry spells.
Groundwater systems in clayeyareas do however respond to climate chang-
es with a certain time delay. This means, for example, that the deeper aq-
uifers are likely to respond in a matter of years-decades, whereas shallow
aquifers have a response time within weeks-months.
In particular there should be focus on:
Management of the runoff from the river systems must be carefully planned in order to create an environment where the runoff is slowed (and thereby more will infiltrate instead of flooding). This can lead to areas that have to be reserved for temporary flooding, dams, and wet-lands
Identification of comming wet areas and planning of drainage where required (blue spot maps)
Evaluation of suitability of capture and protection zones for abstraction wells used for drinking and agricultural purposes in respect to periods with extreme conditions (dry or wet)
Prevention of flooding of abstraction wells and technical installations
50 The CLIWAT Handbook
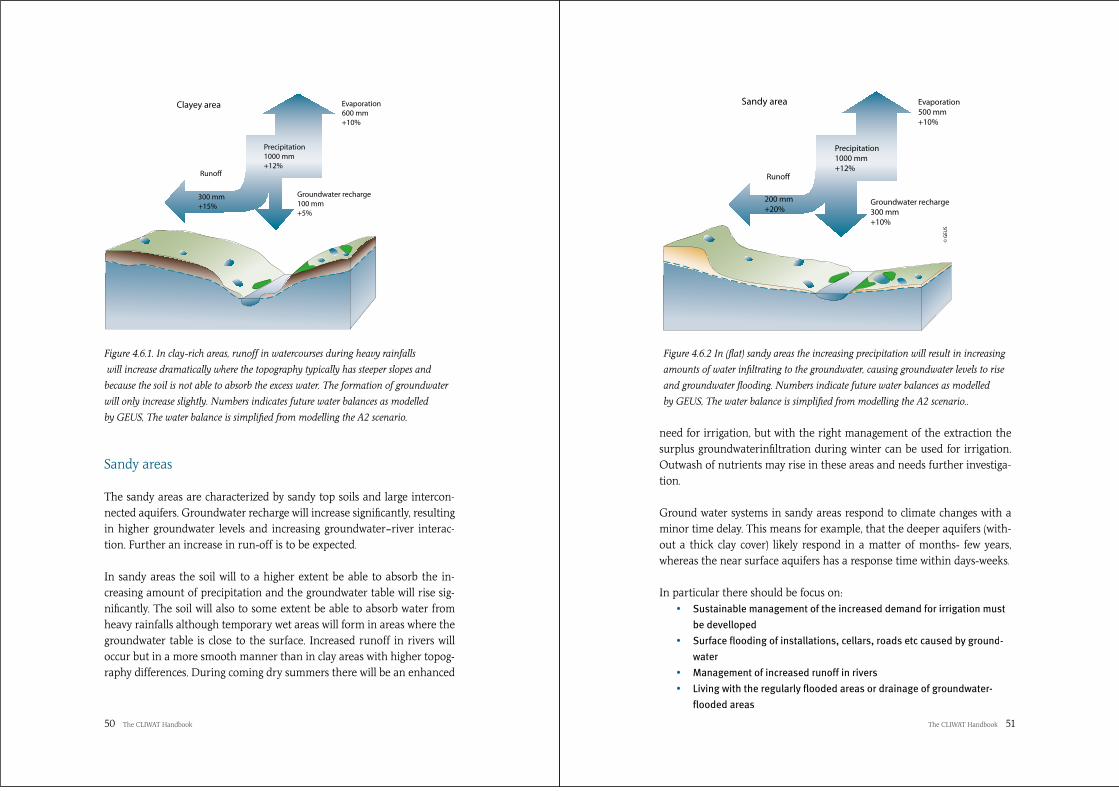
Figure 4.6.1. In clay-rich areas, runoff in watercourses during heavy rainfalls
will increase dramatically where the topography typically has steeper slopes and
because the soil is not able to absorb the excess water. The formation of groundwater
will only increase slightly. Numbers indicates future water balances as modelled
by GEUS, The water balance is simplified from modelling the A2 scenario.
Sandy areas
The sandy areas are characterized by sandy top soils and large intercon-
nected aquifers. Groundwater recharge will increase significantly, resulting
in higher groundwater levels and increasing groundwater–river interac-
tion. Further an increase in run-off is to be expected.
In sandy areas the soil will to a higher extent be able to absorb the in-
creasing amount of precipitation and the groundwater table will rise sig-
nificantly. The soil will also to some extent be able to absorb water from
heavy rainfalls although temporary wet areas will form in areas where the
groundwater table is close to the surface. Increased runoff in rivers will
occur but in a more smooth manner than in clay areas with higher topog-
raphy differences. During coming dry summers there will be an enhanced
Clayey area Evaporation600 mm+10%
Groundwater recharge100 mm+5%
Precipitation1000 mm+12%
Runoff
300 mm+15%
The CLIWAT Handbook 51
need for irrigation, but with the right management of the extraction the
surplus groundwaterinfiltration during winter can be used for irrigation.
Outwash of nutrients may rise in these areas and needs further investiga-
tion.
Ground water systems in sandy areas respond to climate changes with a
minor time delay. This means for example, that the deeper aquifers (with-
out a thick clay cover) likely respond in a matter of months- few years,
whereas the near surface aquifers has a response time within days-weeks.
In particular there should be focus on:
Sustainable management of the increased demand for irrigation must
be develloped
Surface flooding of installations, cellars, roads etc caused by ground-
water
Management of increased runoff in rivers
Living with the regularly flooded areas or drainage of groundwater-
flooded areas
Sandy area
© G
EUS
Evaporation500 mm+10%
Groundwater recharge300 mm+10%
Precipitation1000 mm+12%
Runoff
200 mm+20%
Figure 4.6.2 In (flat) sandy areas the increasing precipitation will result in increasing
amounts of water infiltrating to the groundwater, causing groundwater levels to rise
and groundwater flooding. Numbers indicate future water balances as modelled
by GEUS, The water balance is simplified from modelling the A2 scenario..

52 The CLIWAT Handbook
4.7 Pollution in urban areas
Figure 4.7.1: Aerial photo of the coastal city of Aarhus.
The CLIWAT Handbook 53
Cities and towns located in low-lying coastal areas are facing the chal-
lenges of rising groundwater caused by changed precipitation patterns and
rising sea levels.
This will affect the water quantity and quality in these towns and cities.
Low-lying cities have often been built on locations that were formerly wet-
lands or near rivers/estuaries and they face challenges of rising waters
today and in the future. Their urban infrastructures have been designed
to deal with former and present climate standards but the impact of “new”
climate changes may be significant and thereby introduce the need of
adapting to “new” climate standards, by raising dikes or building ports with
higher piers.
Surplus groundwater and excess rainwater must be drained to revent
groundwater flooding,; especially in areas where the terrain lies below the
groundwater level.
In the low-lying cities and towns, the rising groundwater will increase the
risk of flooding in cellars, underground parking areas and lowered roads. It
may also lead to more water entering the sewage system and thus increas-
ing the load on wastewater treatment plants. In addition, the impact of
changed climate includes increasing the contamination flux of the water
in and close to the city.
Groundwater quality
Xenobiotics (contaminants) are increasingly being considered as ecotoxico-
logically relevant for the aquatic environment and human health (Mussolf
et al, 2007).
The quality of groundwater located in aquifers below the cities and towns
is strongly variable. In some areas the groundwater is highly polluted, while
in others it is uncontaminated (Region Midtjylland, 2011, Ellis P.A. and Riv-
ett M.O. 2006 and Shepherd, K.A et al. 2006).). The source of pollution
is typically caused by former or present surface or sub surface activities,
e.g. contaminants from cars or sewage systems. Further contamination is

54 The CLIWAT Handbook
caused by present day or former industrial or landfill sites that are located
in the proximity of groundwater. The widely varying water quality means
there is a need for a strategy where water is purified before it is discharged
into any nearby river, lake or sea. Figure 4.7.2 illustrates a simplified ver-
sion of water flow in a town. The quality of the water is illustrated by four
different colours and illustrates the need for water purification. There is
a large degree of interference between surface water and groundwater.
The quality of the water in the city is generally unknown. But the studies
in CLIWAT have showed that the groundwater in the towns is affected by
sewage, former and present industry and other surface activities. To pre-
vent contamination of the surrounding environment, the contaminated
water should be treated before being discharged into the environment.
Figure 4.7.2 The flow of water in a city today
Rivers, lakes, sea
Rain Urban surfaceWater
Sewage System
Treated water
Legend
Clean water Polluted water Treated waternot 100 % clean
Heavy polluted water
Rivers, lakes, sea
Groundwater
The CLIWAT Handbook 55
Effects on landfills
In contaminated areas like landfill sites, the changed climate can have several
effects. The models in CLIWAT studies have shown that the direction of
flow of the contaminated plume can change. In some cases, this can cause
contamination of groundwater that was formerly considered to be with-
out any risk. The studies also show that the extension of the groundwater
plume is not significantly increased. This means that the changes in pre-
cipitation do not cause an increase in the spread of the contamination
from landfill sites in these two examples.
In areas where groundwater in the present climate is not in hydraulic con-
tact with the nearby rivers or lakes, the rising groundwater may have an
impact on surface ecosystems. This is the case of the landfill site in Pilot Area
E (Hørlykke), where the rising groundwater leads to a changed drainage
pattern in the local creek, which affects the water quality. In the Eskelund
landfill site in Pilot Area G, the nearby creek is affected by the landfill site
and the climate change will lead to an increase in the amount of contami-
nation /pollutants which enters the creek.
In the Eskelund case, it was evident that the local waterworks could stay
clear of contamination by maintaining the current abstraction level. This
Figure 4.7.3 Groundwater flow in aquifers near
the Eskelund landfill site, Pilot Area G

56 The CLIWAT Handbook
was evident because the dominant flow direction is from west to east, to-
wards the landfill site. In addition, it was outlined that the contamination
could be drawn towards the waterworks if the abstraction was increased.
Figure 4.7.3 indicates the hydrological system of the Eskelund landfill site.
For both systems, it is clear that the hydraulic system has to be evaluated
prior to any decisions being made. If remediation is planned, it is impor-
tant to design a facility that can deal with greater volumes of water in the
future. In many cases, groundwater models based on consistent geological
and hydrological data are powerful and useful tools that help to increase
our understanding of the hydrological system.
4.8 Thematic maps
The impact of climate change on the environment and society will have
different dimensions. The impact will reach from global processes down
to small-scale events in a very local setting. Research projects like CLIWAT
must effectively communicate the results of the investigations and their
recommendations for future adaptations. This means that technical sub-
jects with often very complex context have to be described and illustrated
in a form that is understandable to the general public. Text and thematic
maps offers the possibilities to do this. Whereas printed analogue maps
were used predominantly in the past, today digital maps combined with
GIS systems are the preferred choice. In particular, interactive maps give
the user the opportunity to display exactly the details and data he is inter-
ested in. Hardcopies of digital maps and printed analogue maps are still
of importance in situations where there is no digital media available, e.g.
at fieldworks.
The kind of subjects visualised in a map, as well as the scale of it, can vary
strongly, depending on the purpose it was made for. The appearance of
a map is determined by the specifications of topic, objects, size, date and
chosen layout.
The topics of thematic maps in the CLIWAT project are sea level rise,
changes in groundwater recharge, changes in groundwater tables, chang-
The CLIWAT Handbook 57
ing catchment areas of waterworks, changes in groundwater quality (salt
water intrusion, nutrients and pesticides), changes in need for irrigation,
etc. The objects shown in the maps can be spatial (e.g. areas with risk of
flooding), linear (e.g. risk for roads or railway tracks) or punctual (e.g. wells
with polluted groundwater). Depending on the spatial distribution of the
objects shown, the size of a map can vary from large scale (e.g. land use
map) to small scale (e.g. single buildings).
The CLIWAT project used various geological and hydrological models of
the pilot areas to predict regional and local developments. To illustrate the
potential climate change impacts, maps can show the development of the
groundwater systems in the future and highlight where adaptations are
needed.
Some examples of the numerous thematic maps that have been provided
in the CLIWAT project are shown here.
Fig: 4.8.1: The map shows the anticipated status of the phreatic
groundwater in 2050 on the island Schouwqen-Duiveland in the
Province Zeeland, in the south-western part of The Netherlands. The
map combines the effects of the currently occurring salinisation processes,
projected to continue until 2050 with the effects of climate change.
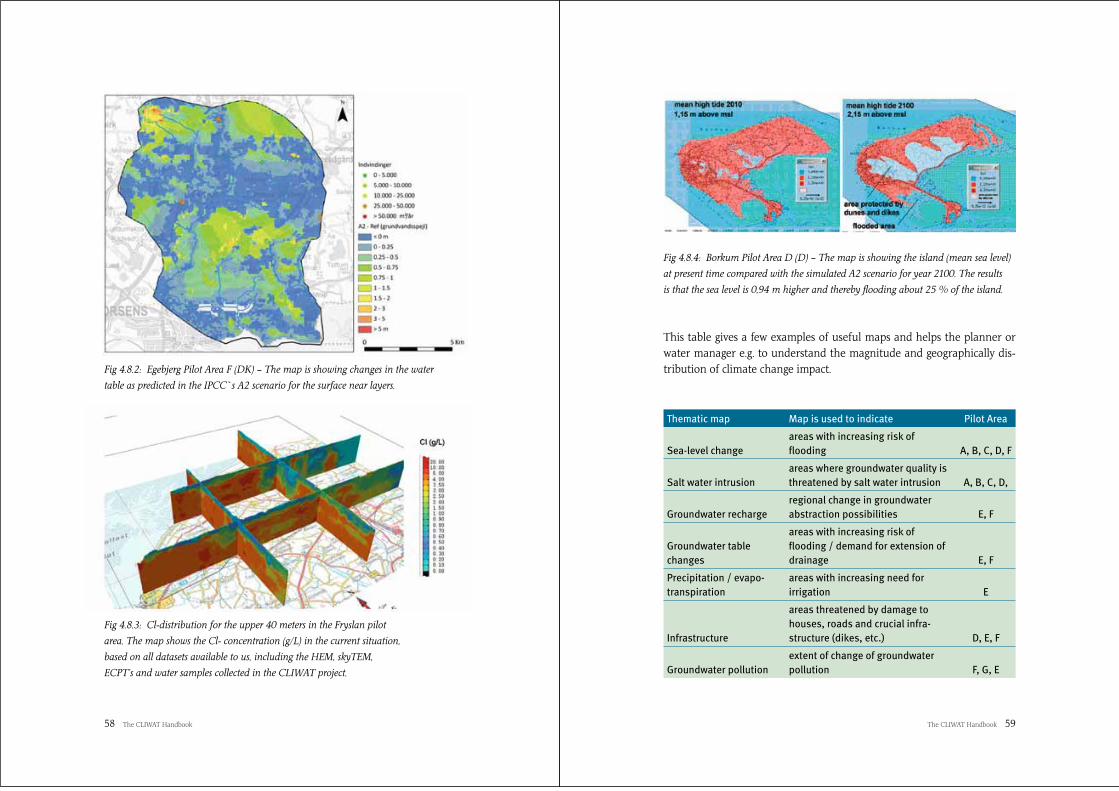
58 The CLIWAT Handbook
Fig 4.8.2: Egebjerg Pilot Area F (DK) – The map is showing changes in the water
table as predicted in the IPCC`s A2 scenario for the surface near layers.
Fig 4.8.3: Cl-distribution for the upper 40 meters in the Fryslan pilot
area. The map shows the Cl- concentration (g/L) in the current situation,
based on all datasets available to us, including the HEM, skyTEM,
ECPT’s and water samples collected in the CLIWAT project.
The CLIWAT Handbook 59
Fig 4.8.4: Borkum Pilot Area D (D) – The map is showing the island (mean sea level)
at present time compared with the simulated A2 scenario for year 2100. The results
is that the sea level is 0,94 m higher and thereby flooding about 25 % of the island.
This table gives a few examples of useful maps and helps the planner or
water manager e.g. to understand the magnitude and geographically dis-
tribution of climate change impact.
Thematic map Map is used to indicate Pilot Area
Sea-level changeareas with increasing risk of flooding A, B, C, D, F
Salt water intrusionareas where groundwater quality is threatened by salt water intrusion A, B, C, D,
Groundwater rechargeregional change in groundwater abstraction possibilities E, F
Groundwater table changes
areas with increasing risk of flooding / demand for extension of drainage E, F
Precipitation / evapo-transpiration
areas with increasing need for irrigation E
Infrastructure
areas threatened by damage to houses, roads and crucial infra-structure (dikes, etc.) D, E, F
Groundwater pollutionextent of change of groundwater pollution F, G, E

60 The CLIWAT Handbook
5 Involving stakeholders
Figure 5.1 Stakeholder involvement
The active participation of different interest groups in the development
and implementation of CLIWAT has been a cornerstone of the project.
The involvement of key stakeholders has played a central role in the evalu-
ation of the effects of various climate scenarios, cooperation across region-
al and national boundaries, and ultimately, the development of adaptive
approaches to water management.
This chapter describes the value of stakeholder involvement in relation to
resource management, the various levels of stakeholder involvement and
the establishment of a participatory process. Examples from the CLIWAT
project are given in in the text boxes and serve to highlight the benefits,
challenges and solutions that have arisen out of the participatory proc-
ess. Additionally, a bibliography of handbooks on participatory processes
is provided.
The CLIWAT Handbook 61
5.1 Why participation?
Stakeholder and public participation is now widely used for supporting
any planning, policy or decision-making process. Stakeholders are those
who are considered to be directly or indirectly affecting or affected by a
management decision (Glicken, 2000), and their participation often allows
them to influence the outcomes of a project or process. Participation is
widely accepted as playing a key role in many environmental and resourc-
es management processes and policy developments. Specifically, the active
involvement and contribution of stakeholders can have the following ben-
eficial effects for a given project or planning process:
incorporate local and practitioners’ knowledge into the project devel-
opment and research activities
support capacity building and improved understanding of the research
approach and results
improve quality of project outcomes,
ensure broader acceptance of project outcomes
contribute to broader dissemination and uptake of the results
In the case of CLIWAT, the implementation of the project and its results
have benefited from including stakeholders at all stages of the project,
from inception to dissemination of results. Box 5.1 provides some specific
examples, which are also presented in sections 5.4 and 5.5 of this chapter.

62 The CLIWAT Handbook
5.2 Establishing a Participatory Process
Once the decision has been taken that a participatory process is neces-
sary or desirable, consideration needs to be given to the nature of this
involvement both in form and level. Should it involve the general public
and stakeholders or just one of these groups? When this is determined, the
extent of their involvement needs to be established, ranging from more
passive one-way information provision to collaborative designing/decision
making. Finally, the process requires a detailed plan at the start of a project.
Box 5.1. Examples of stakeholder involvment processes from 3 countries The value of the stakeholder process: Perspectives of CLIWAT partners and stakeholders
Germany: The German project team used special events to raise awareness
among the general public of the vulnerability of the freshwater lens on the
coastal islands in the North Sea. This has provided a foundation for later
communication to the public of the specific effects of climate change, and
demonstrated through the CLIWAT groundwater models and scenarios.
Belgium: “CLIWAT provides an excellent opportunity to gather everyone
involved in the coastal area. It is for us as stakeholders, an interesting
platform to exchange ideas and a vision for the future of coastal groundwa-
ter management together with researchers and other stakeholders alike.”
(comment by a representative of the Flemish Environmental Agency).
Denmark: The awareness CLIWAT has brought to the regional and national
debate regarding climate change and groundwater is valuable. A major
part of the concern in Denmark at the moment is focused on sudden heavy
rainfall and the resulting collapse of sewage systems in urbanised areas.
The CLIWAT project and the meeting of the Danish stakeholder board has
secured that future challenges regarding change in groundwater levels and
quality is taken into account.
The CLIWAT Handbook 63
Various forms of stakeholder involvement
Participation can take place with four different levels of involvement: in-
formation provision, public consultation, active involvement (co-design-
ing) and decision making (co-deciding). As a basic condition for all levels
of participation, it is essential that there is access to relevant and sufficient
information (e.g., through newsletters, websites, flyers, street stalls or con-
ference stands).
In a stakeholder consultation process, the participants are normally asked
to provide their opinion, and also their knowledge of the issues/circum-
stances surrounding draft plans, proposed measures or policies, and/or
preliminary results. Consultation can take place in written or oral/active
form. In the case of the active involvement of stakeholders, as has been
undertaken in CLIWAT, the organisations represented have a share of
the responsibility for, or at least the opportunity to provide input into the
creation of a plan or policy, its implementation and/or the use of results.
In contrast to a public consultation process, it is often impossible to ac-
tively involve all possible stakeholders in a process. Therefore, a selection
of stakeholders needs to be made, and this is often done by means of a
stakeholder analysis (see Section 5.2.3).
Depending on the issue being addressed and/or the goal of the participa-
tory process, the level of success will depend upon selecting the appropri-
ate elements including:
level (or extent) of involvement
range of stakeholders
geographical scale
participatory method
Although a project such as CLIWAT may be undertaken at the higher na-
tional or transnational scale, it may be nonetheless valuable to organise at
least a part of the participatory process at the local scale, because effects
of management decisions will be felt most directly at this scale (European
Commission, 2003). In the CLIWAT project, a combination of national and
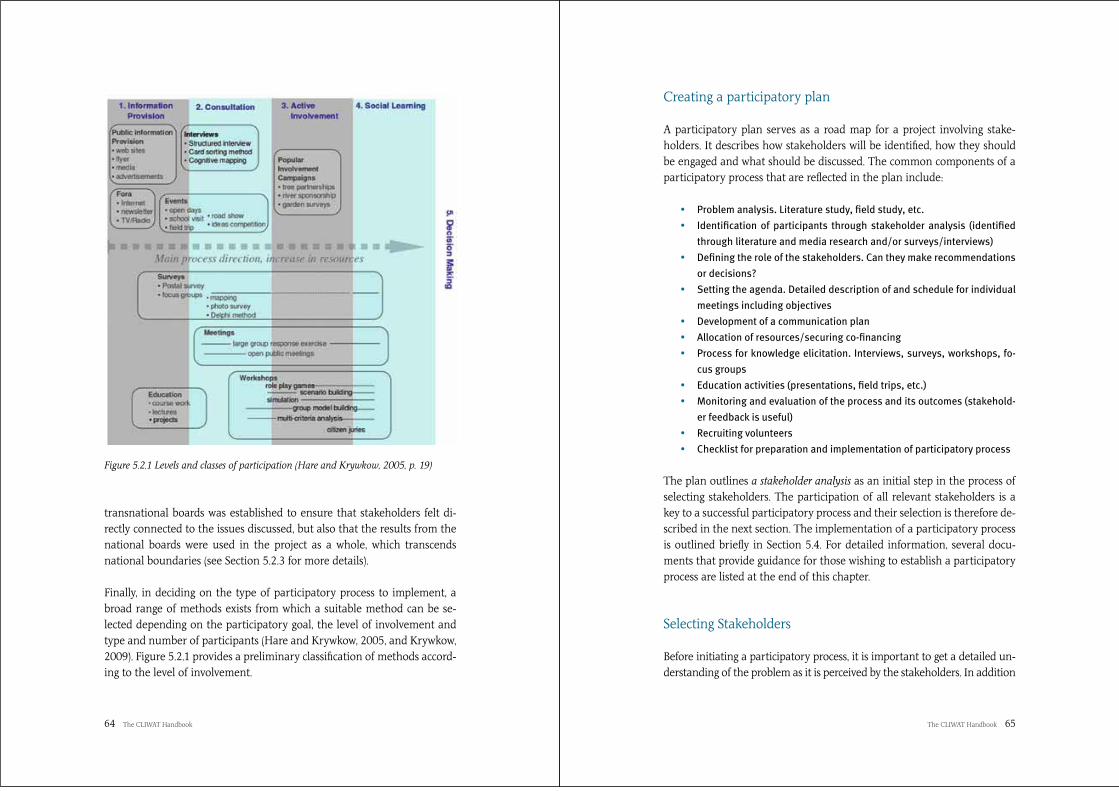
64 The CLIWAT Handbook
transnational boards was established to ensure that stakeholders felt di-
rectly connected to the issues discussed, but also that the results from the
national boards were used in the project as a whole, which transcends
national boundaries (see Section 5.2.3 for more details).
Finally, in deciding on the type of participatory process to implement, a
broad range of methods exists from which a suitable method can be se-
lected depending on the participatory goal, the level of involvement and
type and number of participants (Hare and Krywkow, 2005, and Krywkow,
2009). Figure 5.2.1 provides a preliminary classification of methods accord-
ing to the level of involvement.
Figure 5.2.1 Levels and classes of participation (Hare and Krywkow, 2005, p. 19)
The CLIWAT Handbook 65
Creating a participatory plan
A participatory plan serves as a road map for a project involving stake-
holders. It describes how stakeholders will be identified, how they should
be engaged and what should be discussed. The common components of a
participatory process that are reflected in the plan include:
Problem analysis. Literature study, field study, etc.
Identification of participants through stakeholder analysis (identified
through literature and media research and/or surveys/interviews)
Defining the role of the stakeholders. Can they make recommendations
or decisions?
Setting the agenda. Detailed description of and schedule for individual
meetings including objectives
Development of a communication plan
Allocation of resources/securing co-financing
Process for knowledge elicitation. Interviews, surveys, workshops, fo-
cus groups
Education activities (presentations, field trips, etc.)
Monitoring and evaluation of the process and its outcomes (stakehold-
er feedback is useful)
Recruiting volunteers
Checklist for preparation and implementation of participatory process
The plan outlines a stakeholder analysis as an initial step in the process of
selecting stakeholders. The participation of all relevant stakeholders is a
key to a successful participatory process and their selection is therefore de-
scribed in the next section. The implementation of a participatory process
is outlined briefly in Section 5.4. For detailed information, several docu-
ments that provide guidance for those wishing to establish a participatory
process are listed at the end of this chapter.
Selecting Stakeholders
Before initiating a participatory process, it is important to get a detailed un-
derstanding of the problem as it is perceived by the stakeholders. In addition

66 The CLIWAT Handbook
to providing a better insight into the perception of the problem, a stake-
holder analysis also serves as a basis for selecting appropriate stakeholders
for the participatory process. Stakeholder analysis is a three-stage, iterative
process: identify, categorise and select stakeholders (see Figure 5.2.2).
Identification Categorisation Selection Involvement
Figure 5.2.2: Stages of stakeholder analysis (Hare and Krywkow, 2005)
As a first step, a list of possible stakeholders has to be made. It should
include all groups and individuals who have a possible stake or interest in
the issue, preferably grouped according to areas of interest and competen-
cy. This identification process can be improved or speeded up by drawing
on the advice of those stakeholders already confirmed as being necessary
to the process.
Potential stakeholders are then prioritised and the extent of their involve-
ment is determined. A possible framework for this checklist is shown in Ta-
ble 5.1. It allows a listing of the interests of the stakeholders, their attitude
towards the issue, the level of power/authority held (national, regional,
local by type of authority: political, financial and human) and the degree of
influence of each stakeholder (very strong – strong – average – weak – very
weak), as well as the role and the degree of involvement the stakeholder
should have in the participatory process.
Stake-holder
Type Stake/ Interest
Atti-tude
Power* Level Role Degree of InvolvementP F H
…. …..* p = political, f = financial, h = human
Table 5.1: Stakeholder Analysis Table
Selecting stakeholders depends on the purpose of the participatory proc-
ess. If the aim is to involve potential objectors, these criteria may be help-
ful in selecting those stakeholders who hold more power and may oppose
the project or aspects of it. If a diverse range of stakeholders is desired,
The CLIWAT Handbook 67
Box 5.2 Engaging stakeholders in the CLIWAT Project
At the outset of the CLIWAT project, a generic participatory plan was
developed by a consultancy specialising in participatory processes. This
document prescribed the establishment of four national boards (one in
each partner country) and one transnational board comprising represent-
atives from the national boards. The plan was then adapted to the needs
of each country.
Among the CLIWAT project partners, it was agreed that the members of
the national boards should represent all spatial levels and a range of sec-
tors, and they should be “hands-on” representatives of their respective
interest groups. For each national board 10 to 20 representatives were
anticipated.
The main challenge in establishing a national board was securing repre-
sentation from a range of sectors and at more than one scale level. This
was relatively successful in Denmark. The Danish board was made up of
participants from many sectors such as water, agriculture, and highway
and rail authorities, and from all levels (state, regional, and municipal), as
well as from consultancy companies and academic institutions. This led
to many fruitful discussions about the CLIWAT results and upcoming chal-
lenges that cross-sectoral boundaries. Thus, in Denmark the stakeholder
process has become a platform for future cooperation.
then one or more stakeholders from each category (e.g. local, regional,
national) can be selected. While selecting stakeholders, the number of de-
sired participants has to be taken into account. A larger group allows for
more representation across sectors and scales. Involvement of a broad range
of backgrounds requires more skilful facilitation of meetings, but also en-
hances the prospects for the success of a given plan or project on a broader
level. With a smaller group, social learning is more likely to occur, active
involvement is more likely to be successful and the participatory process will
be less expensive to implement. The process for engaging stakeholders in the
CLIWAT project is described in Box 5.2.

68 The CLIWAT Handbook
5.3 Implementing and Managing a Participatory Process
There are a variety of challenges and potential solutions to those chal-
lenges that those implementing a participatory process should be aware
of. Stakeholder processes require careful planning if they are to meet their
objectives. Some of the most important considerations are:
ensuring that sufficient resources are allocated
establishing realistic expectations
ensuring that the leadership is sufficiently strong to guide and main-
tain control of the process
avoiding information overload (Hare and Krywkow, 2005)
Furthermore, it is strongly advised that:
those facilitating a process remain open to the outcomes of that process
responsibilities are shared, for the sake of shared ownership of the
process, and for social learning
the participatory process remains attractive to stakeholders through-
out the duration of the project or planning process - not only at the be-
ginning, but also during the process by avoiding information overload,
ensuring an appropriate pace and including sufficient substance in the
process (Ridder et al., 2005)
In Box 5.3, some of the most important insights about managing a stake-
holder processes that were learned in the CLIWAT project are presented.
For more detailed guidance, the handbook, “Learning Together to Manage
Together: Improving participation in water management”, produced by the
European-funded HarmoniCOP project, describes all the elements needed
for establishing and managing a participatory process, and how to assess
or evaluate progress and achievements.
The CLIWAT Handbook 69
Box 5.3 Insights from stakeholder processes in CLIWAT
In an interim evaluation of the CLIWAT national and transnational boards,
most partners viewed the work of the boards positively. In addition, sev-
eral conclusions were drawn and recommendations made based on the
experience with the CLIWAT participatory process:
Getting and keeping stakeholders involved can be challenging
(e.g. stakeholder fatigue). Creative solutions such as catchy kick-
off events (e.g. with higher profile keynote speakers, field visits,
etc) can be effective in attracting stakeholders. It should be possi-
ble for stakeholders to clearly see their role in the project. During
the meetings, scientific methods and results need to be presented
in a way that is understandable to the stakeholder.
Present realistic expectations of stakeholder involvement and the
project as a whole (i.e. state clearly what the project can and what
it cannot achieve)
Resources should be allocated by project partners for the national
boards, primarily for planning and implementation of meetings.
Project partners naturally place higher value on the scientific
dissemination of project results than non-scientific dissemination
types (such as training and project newsletters). It was valuable to
bring in a project partner to support the non-scientific dissemina-
tion. In CLIWAT, a dissemination plan (Schmidt, 2009) was devel-
oped at the outset of the project to ensure that project progress
and results were communicated to diverse audiences.

70 The CLIWAT Handbook
5.4 Assessing the Achievements of a Participatory Process
The success of the participatory process can only be measured against the
goals of the project or the initiative as a whole. Some achievements or fail-
ures will be apparent depending on the project results. However, in order
to have a complete picture of the effectiveness of a stakeholder process,
an evaluation is needed. The HarmoniCOP handbook mentioned above
includes a chapter on monitoring and evaluating a participatory process. It
provides a comprehensive checklist of questions that supports this evalu-
ation process.
A central challenge when addressing the impacts of climate on ground-
water is developing approaches and solutions that draw on multiple disci-
plines and involve multiple scales. Engaging researchers, practitioners and
stakeholders from these various scales, sectors and disciplines is thus vital
to an interdisciplinary project of this nature. Several of the achievements
of the CLIWAT stakeholder process that reflect the importance of this ap-
proach are presented in Box 5.4.
Through a stakeholder process such as that implemented in the CLIWAT
project, it is possible to raise local, regional and national awareness of an
issue. Moreover, the participatory process of this project has demonstrated
that there are numerous effective solutions that can be developed and im-
plemented when stakeholders work together to create win-win situations
both for individual sectors and society as a whole.
The CLIWAT Handbook 71
Box 5.4: Achievements of the CLIWAT Stakeholder Process
In the CLIWAT project, it is possible to distinguish short and long term
impacts of stakeholder involvement. In the short term, awareness of the
effects of climate change on the groundwater was raised among stake-
holders involved in the project and represented on the boards. It was
raised to the extent that practices have changed. For example, the Danish
Road Directorate has made the stability of new highways a higher priority,
and the Dutch water distribution company, Vitens, is now mapping saline
and fresh water lenses in coastal areas of the Netherlands.
In German pilot areas, fieldwork presentations as well as presentations at
special events helped to attract stakeholders. In the two pilot areas (Bor-
kum and Schleswig/Föhr) stakeholders were able to try out the methods
for examining groundwater. These events supported the building up of
local and regional knowledge. Stakeholders and the public were informed
of new techniques and technical developments through presentations on
fieldwork. The project team took advantage of World Water Day and En-
ergy Day on the island of Borkum in order to also reach out to the general
public.
In the longer term, new methods for mapping of saline freshwater are be-
ing linked between countries (e.g. Denmark and the Netherlands), which
permits more accurate predictions of climate change and freshwater
availability. Furthermore, CLIWAT has contributed to a wider acceptance
of groundwater as a parameter in the water cycle that has to be taken
into account when dealing with climate change adaptation. A further
tangible spin-off of the stakeholder board meetings was agreement on a
ten-year collaboration project between the Danish Roads Directorate and
the Geological Survey of Denmark and Greenland to include the effects of
changing groundwater levels when building highways in Denmark.

72 The CLIWAT Handbook
Further Guidance on setting up participatory processes
Ridder, D., E. Mostert, and H. A. Wolters. 2005. Learning Together to Man-
age Together – Improving participation in water management. Publisher:
University of Osnabrück, Institute of Environmental Systems Research.
Osnabrück.
The HarmoniCOP Handbook provides practical and easy-to-fol-
low advice on all aspects of setting up and running a participatory
process. It is available in English, German, Dutch and French and
can be downloaded for free from
http://www.harmonicop.uos.de/handbook.php
Krywkow, J. 2009. A Methodological Framework for Participatory Processes in
Water Resources Management. PhD thesis.
University of Twente, Netherlands. June 2009.
The thesis outlines a process for selecting appropriate methods
for a participatory process. The thesis is intended for scientific
audiences and includes a conceptual foundation. However, it pro-
vides a detailed outline for participatory process planning in all
its dimensions. Available from http://doc.utwente.nl/64058/
European Commission. 2003. Guidance Document No 8: Public Participa-
tion in Relation to the Water Framework Directive. Common Implementa-
tion Strategy for the Water Framework Directive (2000/60/EC). Working
Group 2.9.
This report, which is intended for EU member states, provides a
common understanding of public participation in the context of
the Water Framework Directive. It outlines how to implement
and manage such a process, including who to involve, the time
frame for involvement, and the importance of selecting the right
scale for involvement.
circa.europa.eu
The CLIWAT Handbook 73
6. EU policy
6.1 Introduction
The CLIWAT project focuses on climate change impact assessments for
adaptive water management in coastal regions. Such assessments are part
of the important knowledge base needed to plan required adaptation
measures as described in the EU White Paper on climate change and EU
directives, guidelines and reports.
Generally, climate change impacts and adaptation are not directly men-
tioned in the Water Framework Directive (WFD; EC, 2000) or Groundwa-
ter Directive (GWD; EC, 2006). However, the WFD and GWD require ac-
tions that at least to some extent have to consider climate change impacts
and adaptation measures that are needed to develop climate proof river
basin management plans (EC, 2009a,b; Quevauviller, 2011). This also in-
cludes assessment of climate change impacts on groundwater quality and
quantity as a pressure on the chemical and quantitative status of ground-
water. However, as described in the EU White Paper on climate change
adaptation (EC, 2009a), a more strategic approach and guidelines such as
the EU guidance document no. 24 “River basin management in a changing
climate” (EC, 2009b), are strongly needed to describe appropriate ways to
tackle the challenges of climate change.
This chapter briefly introduces relevant documents from the European
Commission that have important implications for appropriate management
of groundwater as an important part of river basins and the hydrological
cycle in a changing climate. Generally groundwater quantitative and chemi-
cal status affects drinking water resources, the ecological and chemical status
of ecosystems from springs to marine ecosystems, and the built environ-
ment. Hence, proper consideration and understanding of climate change
impacts on groundwater is imperative for developing climate-proof infra-
structure and for adaptive and sustainable management of water resources
and groundwater dependent ecosystems in a changing climate.

74 The CLIWAT Handbook
6.2 Directives relevant for groundwater and river basin management
The WFD and GWD are the most important directives for groundwater
and river basin management, and although they do not provide direct
requirements on climate change impact assessment and adaptation they
do provide a general framework for addressing this important aspect of
river basin management plans as illustrated by the following quotation,
Quevauviller (2011): “..several articles of the directive (WFD) provide a
framework to include climate change impacts into the planning process. In
particular, the requirement of the directive to collect information on the
type and magnitude of ‘significant pressures’ affecting surface waters could
be considered as including climate change with the consensus that it is at
least to a certain extent caused by human activities (Wilby et al., 2006)”.
Besides the WFD and GWD “the Flood Directive” (EC, 2007) also includes
important requirements for river basin management in a changing cli-
mate. Other directives such as “The Habitats Directive” and “The Maritime
Strategy Directive” (EC, 2008) also include requirements of relevance for
the development of climate proofed river basin management plans, but
these are generally covered in the WFD and GWD. The implementation of
WFD and GWD in the EU member states are not straightforward. Further
directives may not always be properly adopted in national laws (Stolten-
borg, 2011). Hence, detailed guidelines to assist in proper implementation
are strongly needed. A brief description of the most important guidances
developed to assist in the implementation of the WFD and GWD in mem-
ber states is provided in a later section.
6.3 Groundwater and the EU White Paper on climate change adaptation
The EU White Paper “Adapting to climate change: Towards a European
framework for action” (EC, 2009a) acknowledges that: “climate change
increases land and sea temperatures and alters precipitation quantity
and patterns, resulting in the increase of global average sea level, risks of
coastal erosion and an expected increase in the severity of weather related
The CLIWAT Handbook 75
natural disasters” and that the changing water levels, temperatures and
runoff will affect food supply, health, industry, transport and ecosystems.
Furthermore it states that two types of response are needed to address
climate change – firstly, we must reduce greenhouse gas emissions and
secondly we must take adaptation actions to deal with the unavoidable
impacts. The White Paper recognises that even if we reduce greenhouse
gas emissions we will face climate changes in the coming decades due to
the effects of the greenhouse gases that are already in the atmosphere and
that we need to take measures to adapt.
The White Paper sets out a framework to reduce the EU’s vulnerability
to the impact of climate change, and it describes the needs to develop the
knowledge base, integrate adaptation into EU policies and increase the
resilience of the following areas:
Health and social policies
Agriculture and forests
Biodiversity, ecosystems and water
Coastal and marine areas
Production systems and physical infrastructure
Although groundwater of course is mainly related to “biodiversity, ecosys-
tems and water” it is worth noticing that groundwater quantity and qual-
ity has relevance for all the other areas to varying degrees, for instance as
water supply for irrigation, a media for transporting nutrients between
agricultural soils and surface waters or stabilising/destabilising physical
infrastructure such as roads and railways. Hence climate change impacts
on groundwater quantity and quality have major implications for society
and nature.
Under the heading “Biodiversity, ecosystems and water” the White Paper
describes that while the first river basin management plans (RBMPs), which
were finalised in 2009 in most memberstates, to some extent include cli-
mate change considerations the second generation of RBMPs due in 2015
should be fully climate-proofed. Further, climate change must be properly
integrated in the implementation of the “Floods Directive” (EC, 2007).
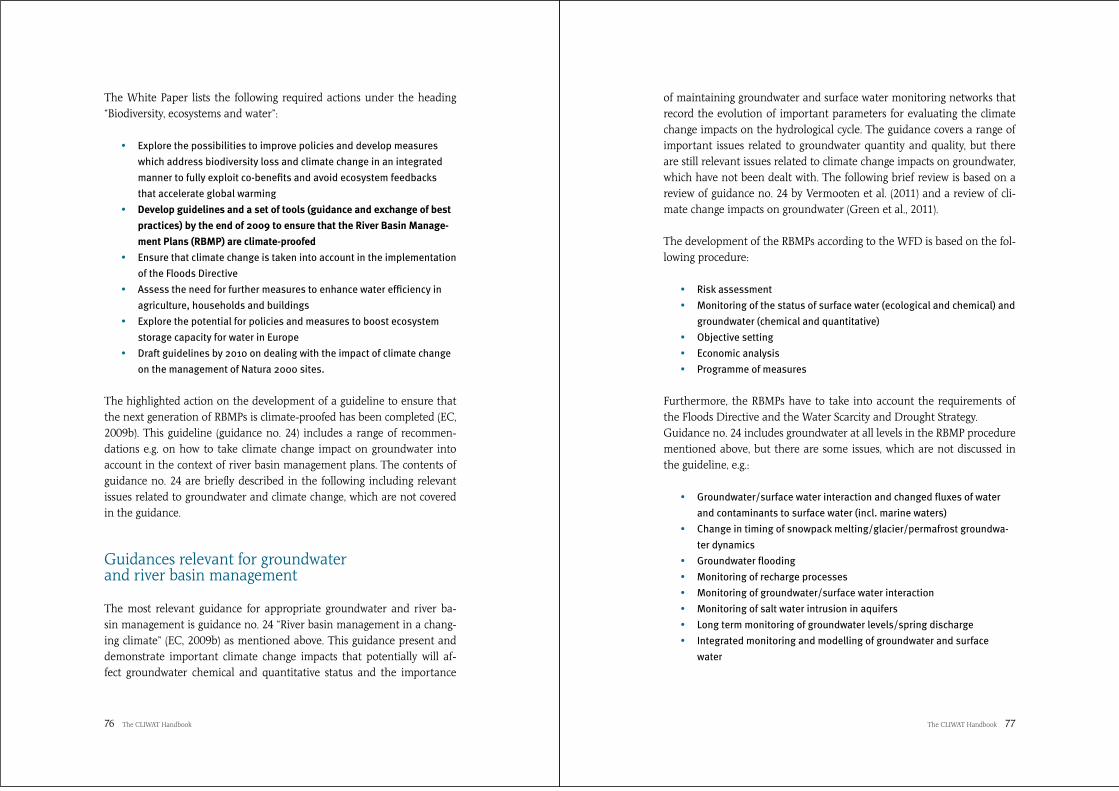
76 The CLIWAT Handbook
The White Paper lists the following required actions under the heading
“Biodiversity, ecosystems and water”:
Explore the possibilities to improve policies and develop measures
which address biodiversity loss and climate change in an integrated
manner to fully exploit co-benefits and avoid ecosystem feedbacks
that accelerate global warming
Develop guidelines and a set of tools (guidance and exchange of best
practices) by the end of 2009 to ensure that the River Basin Manage-
ment Plans (RBMP) are climate-proofed
Ensure that climate change is taken into account in the implementation
of the Floods Directive
Assess the need for further measures to enhance water efficiency in
agriculture, households and buildings
Explore the potential for policies and measures to boost ecosystem
storage capacity for water in Europe
Draft guidelines by 2010 on dealing with the impact of climate change
on the management of Natura 2000 sites.
The highlighted action on the development of a guideline to ensure that
the next generation of RBMPs is climate-proofed has been completed (EC,
2009b). This guideline (guidance no. 24) includes a range of recommen-
dations e.g. on how to take climate change impact on groundwater into
account in the context of river basin management plans. The contents of
guidance no. 24 are briefly described in the following including relevant
issues related to groundwater and climate change, which are not covered
in the guidance.
Guidances relevant for groundwater and river basin management
The most relevant guidance for appropriate groundwater and river ba-
sin management is guidance no. 24 “River basin management in a chang-
ing climate” (EC, 2009b) as mentioned above. This guidance present and
demonstrate important climate change impacts that potentially will af-
fect groundwater chemical and quantitative status and the importance
The CLIWAT Handbook 77
of maintaining groundwater and surface water monitoring networks that
record the evolution of important parameters for evaluating the climate
change impacts on the hydrological cycle. The guidance covers a range of
important issues related to groundwater quantity and quality, but there
are still relevant issues related to climate change impacts on groundwater,
which have not been dealt with. The following brief review is based on a
review of guidance no. 24 by Vermooten et al. (2011) and a review of cli-
mate change impacts on groundwater (Green et al., 2011).
The development of the RBMPs according to the WFD is based on the fol-
lowing procedure:
Risk assessment
Monitoring of the status of surface water (ecological and chemical) and
groundwater (chemical and quantitative)
Objective setting
Economic analysis
Programme of measures
Furthermore, the RBMPs have to take into account the requirements of
the Floods Directive and the Water Scarcity and Drought Strategy.
Guidance no. 24 includes groundwater at all levels in the RBMP procedure
mentioned above, but there are some issues, which are not discussed in
the guideline, e.g.:
Groundwater/surface water interaction and changed fluxes of water
and contaminants to surface water (incl. marine waters)
Change in timing of snowpack melting/glacier/permafrost groundwa-
ter dynamics
Groundwater flooding
Monitoring of recharge processes
Monitoring of groundwater/surface water interaction
Monitoring of salt water intrusion in aquifers
Long term monitoring of groundwater levels/spring discharge
Integrated monitoring and modelling of groundwater and surface
water

78 The CLIWAT Handbook
The list above is not complete but indicates some important issues related
to step 1 and 2 in the development of the RBMPs. Important issues men-
tioned in Guidance no. 24 related to groundwater and step three “objec-
tives setting” include the WFD requirement of obtaining good groundwater
chemical and quantitative status in 2015. However, it does not relate to or
discuss how to handle the slow groundwater flow dynamics in this context,
and how to handle climate change impacts on groundwater chemical and
quantitative status e.g. how climate change may affect groundwater flow
systems (Sonnenborg and Oude Essink, ch.4.5, this volume) and ground-
water threshold values (Hinsby et al., 2008, 2011, 2012).The required eco-
nomic analysis of climate change impact and adaptation is mentioned in
broad terms, but does not mention specific problems such as the effect
of varying water tables on physical infrastructure, energy costs due to in-
creased pumping for irrigation, etc. The CLIWAT project addresses many
of these issues (Pedersen et al., ch.3, this volume; Hinsby et al. 2012) pro-
viding important new data and knowledge for future climate-proofed river
basin management plans in the North Sea Region. Most of the applied
tools may be used globally.
Figure 6.4.1 Conceptual model of the catchment to the Horsens estuary
showing selected pressures on the chemical status of groundwater and surface
water, which may increase due to climate change impacts such as increasing
winter precipitation. If for instance nutrient loads to the estuary increase due
to increasing runoff, future groundwater threshold values will have to be lower
than estimated for the current situation, and groundwater chemical status will
deteriorate compared to the current situation (Hinsby et al., 2011, 2012).
Field
Drain pipe
Stream
HorsensEstuary
OxidizedReduced
Regionalgroundwater body
Regionalgroundwater body
Confining layer (clayey till)Groundwater body (sand)Riparian Area Aquifer
Oxidized
Reduced
Redox boundary
N and P loadings inducepoor ecological status
Deep groundwater bodyDeep groundwater body
!
!
!Terrestrialecosystem
Localgroundwater body
Localgroundwater body
© G
EUS
Innerestuary
Horsens
Regionalgroundwater body
Regionalgroundwater body
Deep groundwater bodyDeep groundwater body
Outerestuary
Belt Sea
The CLIWAT Handbook 79
Other relevant guidances include guidance no. 18, 19, 23 and 26 (EC,
2009c-e, 2010). The most relevant directives and guidances can be down-
loaded via the CLIWAT website (www.cliwat.eu). Generally, the guidances
recommend to use conceptual models in the understanding of e.g. the
interaction between groundwater and surface water in river basins – an
example is shown in Figure 6.4.1.
6.5 CLIWAT and the EU directives and guidances
CLIWAT deals with climate change impact assessments on future ground-
water chemical and quantitative status according to EU directives and
guidance’s and provides important results for the review of the GWD in
2013 and for climate-proofing the next generation of RBMPs due in 2015.
CLIWAT deals with both primary climate impacts (e.g. flood risks, ground-
water recharge, water tables and runoff) as well as secondary impacts (e.g.
irrigation needs/effects, eutrophication). The main focus of CLIWAT is
climate change impact on groundwater chemical and quantitative status,
primarily:
Saltwater intrusion (primary impact): The most imminent threat for
groundwater chemical status and to some extent quantitative status is
saltwater intrusion into coastal aquifers due to the expected sea level rise.
In contrast to many other negative climate change impacts, which vary be-
tween different climatic regions, saltwater intrusion is a global problem of
great concern as it reduces the available drinking water resource in coastal
regions, globally (Oude Essink et al., 2010; Sonnenborg and Oude Essink,,
ch. 4.5, this volume).
Increased contaminant loading to groundwater and dependent or associ-
ated ecosystems (secondary impact): The North Sea Region is expected to
receive increasing precipitation during the winter period. The likely in-
crease in nutrient loads, and contaminants from point sources etc., will
result in decreasing groundwater and stream threshold values in order

80 The CLIWAT Handbook
to ensure good ecological status of groundwater dependent or associated
ecosystems (Hinsby et al., 2008, 2011, 2012; Sonnenborg et al., 2011)
Issues related to quantitative status such as changes in water tables, runoff
and flooding of the built environment e.g. coastal cities and effect of in-
creasing irrigation needs (e.g Hinsby et al, 2012)
Objectives of preventing or limiting groundwater pollution by point sourc-
es as required by the WFD and GWD (EC, 2000, 2006) are needed.
CLIWAT provided input on these issues for a new document developed
by the EU Working Group C ”Groundwater” on climate change impact on
groundwater (WGC, 2011).
6.6 Other sources of relevant information for climate change adaptation
A rapidly increasing amount of information and sources for climate impact
assessment and adaptation is available on the internet, and it is impossible
to give an exhaustive list of these sources. However, the following sources
have extensive information about water and environmental issues includ-
ing European climate change impact assessment and adaptation:
“WISE” - The Water Information System for Europe (http://water.europa.
eu)
“CIRCA” – A collaborative workspace with partners of the European Insti-
tutions (http://circa.europa.eu)
“EEA”: The European Environment Agency (http://www.eea.europa.eu)
The CLIWAT Handbook 81
6.7 The Blueprint to safeguard Europe’s Water.
The EU Commissioner for the Environment has taken the initiative to put
together a new policy response to protect Europe’s water for all legitimate
uses. The following section is taken directly from a BLUEPRINT publicity
folder.
»In 2000 the Water Framework Directive (WFD) established a legal basis
to protect and restore clean water across Europe and ensure its long-term,
sustainable use. The general objective of the WFD is to get all water — for
example, lakes, rivers, streams and groundwater aquifers — into a healthy
state by 2015. But the achievement of EU water policy goals is threatened
by a number of old and emerging challenges, including water pollution,
water abstraction for agriculture and energy production, land use and the
impacts of climate change.
The EU’s policy response to these challenges is the forthcoming 2012 Blue-
print to safeguard Europe’s water resources. The overall objective of the
Blueprint is to improve EU water policy to ensure good quality water, in
adequate quantities, for all authorised uses. The Blueprint is thought to
ensure a sustainable balance between water demand and supply, taking
into account the needs of both people and the natural ecosystems they
depend on.«
The Blueprint will synthesize policy recommendations building on three
on-going assessments: 1) the assessment of the River Basin Management
Plans delivered by the Member States under the Water Framework Direc-
tive, 2) the review of the policy on Water Scarcity and Drought and 3)
the assessment of the vulnerability of water resources to climate change
and other man made pressures. The CIRCA website is used for the daily
management of the interim information generated by the supporting con-
tracts. Final reports and official papers are stored on the WFD Circa Group.
Read more about the Blueprint to Safeguard Europe’s Water on the WISE
and CIRCA websites listed in the previous section.

82 The CLIWAT Handbook
6.8 Summary and outlook
The development of climate proof river basin management plans and
climate change adaptation measures according to EU legislation requires
sound climate change impact assessments. These include a sound un-
derstanding of the subsurface and the interaction between groundwater,
surface water and ecosystems. Several EU directives especially the Water
Framework, Groundwater and Flooding directives, and related guidelines
have to be taken into account in this process. Further it is essential to
recognize that the adaptation measures have to be flexible and take into
account new data and scientific and technological developments. Provi-
sions should therefore be made for the updating of relevant strategies and
guidelines when new relevant data are available. Efficient on-line presen-
tation procedures for illustration of new monitoring and climate change
impact data will be an important tool for efficient implementation of ad-
aptation measures.
The CLIWAT Handbook 83
7. Perspectives
The project emphasizes the importance of taking groundwater into ac-
count when dealing with climate change impact assessment and adapta-
tion. CLIWAT deals with climate change impact assessments on future
groundwater chemical and quantitative status in accordance with EU di-
rectives and associated guidances and provides important results for the
review of the GWD in 2013 and for climate-proofing the next generation
of RBMPs, due in 2015.
Increased winter precipitation will in many areas give rise to the formation
of more groundwater. However, in low-lying areas such as the polder areas
in especially the Netherlands and Belgium, the delicate management of
the water table during the year leads to the formation of less freshwater. In
addition the sea water intrusion leads to negative impacts on groundwa-
ter chemical and quantitative status. This is also the case for the Wadden
Islands and in coastal areas where the increased sea level will enhance the
sea water into coastal groundwater bodies and lower the amount of ex-
tractable fresh water. This calls for increased focus on optimized the man-
agement of the extraction wells and water conservation campaigns.
During summertime most climate models predict longer dry periods for the
region, which will increase the need for irrigation and may create conflicts
between water used and ecosystem needs. In addition, the rising groundwa-
ter table, built up during wintertime, may cause challenges to existing infra-
structure, and increase the need for drainage of fields and cities. The inves-
tigations in CLIWAT have shown that detailed groundwater and integrated
hydrological models on both regional and local scales are capable of forecast-
ing the challenges that matter to local society, individual house-owners, etc.
The CLIWAT project demonstrates that the ability to integrate results from
local and regional scales is necessary to cope with the many challenges.
The groundwater resource feeds many needs and interests in the nature
and in the society. In the future we have to be able to create cost-effec-
tive measurements and model tools that are able to describe the climatic
impacts on groundwater and dependent surface water and ecosystems
84 The CLIWAT Handbook
on a local scale. This should be done with accuracy and detail that both
planners and engineers can use in their daily planning and construction
projects. However, climate change projections and impact assessment have
inherent uncertainties that planners and engineers have to acknowledge
and include in the development of climate proof river basin management
plans and infrastructure.
The CLIWAT project has demonstrated that involving stakeholders in an
early stage is important and has produced good examples of raised aware-
ness on groundwater conditions.
The CLIWAT project has demonstrated new and efficient ways to establish
the necessary understanding of current conditions. However, it also em-
phasize that e.g. the following tools and processes have to be improved and
more widely applied for future efficient climate change adaptation:
Cost-effective tools to characterise the subsurface, especially the shal-
low parts and the interface between groundwater and surface waters
(e.g. geophysical, efficient drilling techniques, geochemistry, ground-
water dating).
Efficient groundwater and coupled groundwater – surface water
modelling tools that describe groundwater flows in the uppermost part
of the subsurface and the interaction with surface waters suitable for
planning and engineering purposes on a local scale.
Intensive and integrated monitoring and modelling of the groundwater
systems on a local scale.
A better understanding of future leaching from point sources and agri-
cultural areas in order to develop new standards for best practice.
An integrated stakeholder approach
Efficient on-line data presentation and dissemination tools, which can
be easily updated with new results and predictions
Climate change impact assessment and adaptation is a dynamic process
that will have to be improved and developed continuously in the future.
CLIWAT contributed to the initiation of this process.
The CLIWAT Handbook 85
8. References
Chapter 3
Authors: Jes Pedersen, Rolf Johnsen, Central Denmark Region (DK), Klaus
Petersen, Ministry of Environment, Nature agency (DK)
References:
”Vind over vandet”, Central Denmark Region, 2010.
Environmental Project number 1187 (Climate adaptation of sewage systems
and test of methods. Economic analysis) and 1188 (Climate adaptation of
sewage systems and test of methods. Workshops as a method), Danish Minis-
try of the Environment , 2007.
Willems P, De Maeyer P, Deckers P, De Sutter R, Vanneuville W, Brouwers J en
Peeters B (2009). Millieuverkenning 2030. Wetenschappelijk rapport Thema
Klimaatverandering & waterhuishouding.
EEA Report no.4: Impacts of Europe’s changing climate- 2008 indicator based
assessment.
Chapter 4
Editors: Jes Pedersen, Rolf Johnsen, Central Denmark Region (DK), Klaus Pe-
tersen, Danish Ministry of the Environment , Nature agency (DK)
4.1
Author: Hans Sulzbacher, LIAG (DE)
References:
1. Holocene relative sea-level change, isostatic subsidence and the radial
viscosity structure of the mantle of northwest Europe (Belgium, the Neth-
erlands, Germany, southern North Sea)
Quarternary Sciences Reviews, Volumen 26, Issues 25-28
Annemiek Vink , HolgerSteffen, Lutz Reinhardt, Georg Kaufmann
2. A. Daschkeit and H. Sterr. 2003. Klimawandel in Küstenzonen. Umweltwis-
senschaften und Schadstoff-Forschung 15, no. 3 (Mai 1): 199-207.
doi:10.1065/uwsf2003.07.063.

86 The CLIWAT Handbook
3. H. Streif, (2004): Sedimentary record of Pleistocene and Holocene marine
inundations along the North Sea coast of Lower Saxony, Germany. Quaternary
International 112, no. 1: 3-28.
4. IPCC (2007): Synthesis Report. Summary for Policymakers. Assessment of
Working Groups I, II, and III to the Fourth Assessment Report of the IPCC ,
Cambridge University Press, New York, NY (US)
5. S. Rahmstorf (2007): A Semi-Empirical Approach to Projecting Future Sea-
Level Rise.
Science 315, no. 5810 (January 19): 368-370. doi:10.1126/science.1135456
4.2.
Authors: Carolien Courtens, Ghent University (BE), Alexander Vandenbohede,
Ghent University (BE) and Esther Vanbaaren, Deltares (NL).
References:
Oude Essink, G.H.P., E.S. van Baaren, and P.G.B. de Louw 2010, Effects of
climate change on coastal groundwater systems: A modelling study in the
Netherlands, Water Resource. Res., 46, W00F04, doi:10.1029/2009WR008719.
A. Vandenbohede, C. Courtens, L. Lebbe,, W. De Breuck, (2010). Fresh-salt
water distribution in the central Belgian coastal plain: an update. Geologica
Belgica, Vol.13 (3).
Van de Ven, G.P. (1993), Man-Made Lowlands: History of Water Management
and Land Reclamation in the Netherlands, 294 p., Uitgeverij Matrijs, Utrecht,
Netherlands
West-Vlaams Economisch Studiebureau (WES)(2005). Handleiding voor het
opstellen van peilafspraken in kustpolders, 24p
4.3.
Authors: Arjen Kok, Vitens (NL), Hans Sulzbacher, LIAG (DE)
The CLIWAT Handbook 87
4.4.
Authors: Helga Wiederhold LIAG (DE), Esben Auken, Aarhus University (DK)
and Reinhard Kirsch LLUR (DE)
References:
Burschil, T., Wiederhold, H., Scheer, W. & Kirsch, R., 2011. An integrated
geophysical/geological model of the CLIWAT Project area Föhr as basis for
groundwater modeling. – Ext. Abstr., 17th European Meeting of Environmental
and Engineering Geophysics, Leicester, UK.
BURVAL Working Group, 2009. Buried Quaternary valleys - a geophysical ap-
proach. Z. dt. Ges. Geowiss. 160 (3), 237-247.
M. Grinat,, W. Südekum, D. Epping, T. Grelle, R. Meyer, 2010. An automated
electrical resistivity tomography system to monitor the freshwater/saltwater
zone on a North Sea island. Ext. Abstr., 16th European Meeting of Environmen-
tal and Engineering Geophysics, Zürich, Switzerland.
T. Günther, T., J. Liebau,, I. Akca, M. Müller-Petke, 2011. Block joint inversion
(BJI) of MRS and DC resistivity soundings for aquifer imaging at the North
Sea island Borkum. Ext. Abstr., 17th European Meeting of Environmental and
Engineering Geophysics, Leicester, UK.
R. Kirsch (Ed.), 2009. Groundwater Geophysics - A tool for Hydrogeology - 2nd
Ed. Springer, Heidelberg.
R. Kirsch, I. Grabowski, M. Kordanska, S. Lessing, N. Blindow, W. Scheer, 2011.
Geophysical assessment of unsaturated hydraulic conductivities – examples
from the CLIWAT project area Föhr. Ext. Abstr., 17th European Meeting of Envi-
ronmental and Engineering Geophysics, Leicester, UK.
A. Kok, E. Auken, M. Groen, J. Ribeiro, F. Schaars, 2010. Using ground based
geophysics and airborne transient electromagnetic measurements (SkyTEM)
to map salinity distribution and calibrate a groundwater model for the island
of Terschelling – The Netherlands. Ext. Abstr,, 21st Salt Water Intrusion Meet-
ing SWIM21, Azores, Portugal.

88 The CLIWAT Handbook
H. Sulzbacher, H. Wiederhold, M. Grinat, J. Igel, T. Burschil, T. Günther, B.
Siemon & K. Hinsby, 2011. Calibration of density driven flow model for the
freshwater lens beneath the North Sea Island Borkum by geophysical data.
Ext. Abstr., 17th European Meeting of Environmental and Engineering Geo-
physics, Leicester, UK.
4.5.
Authors: Torben Sonnenborg, GEUS (DK) and Gualbert Oude Essink, Deltares
(NL).
References:
Louw, P.G.B., de, Eeman, S., Siemon, B., Voortman, B.R., Gunnink, J., Baaren,
E.S., van and G.H.P. Oude Essink, Shallow rainwater lenses in deltaic areas
with saline seepage, Hydrol. Earth Syst. Sci. Discuss., 8, 7657-7707, 2011.
Oude Essink, G.H.P. and Boekelman, R.H., 1996, Problems with large-scale
modelling of salt water intrusion in 3D, In: Proc. of the 14th Salt Water Intru-
sion Meeting, Malmoe, Sweden, June 1996, 16-31.
Oude Essink, G.H.P. 2003. Mathematical models and their application to salt
water intrusion problems. TIAC’03: Coastal aquifers intrusion technology:
Mediterranean countries, Alicante, Spain: 57-77.
Refsgaard, J.C., S. Christensen, T.O. Sonnenborg, D. Seifert, A.L. Højberg, and
L. Troldborg (2011), Strategies for handling geological uncertainty in ground-
water flow and transport modelling, Accepted for publication in Advances of
Water Resources.
van Roosmalen, L., B.S.B. Christensen, and T.O. Sonnenborg (2007), Regional
differences in climate change impacts on groundwater and stream discharge
in Denmark, Vadose Zone Journal, 6, 554-571, doi:10.2136/vzj2006.0093.
van Roosmalen, L., T.O. Sonnenborg, K.H. Jensen, and J.H. Christensen (2011),
Comparison of hydrological simulations of climate change using perturbation
of observations and distribution based scaling, Vadose Zone Journal, 10, 136-
150, doi:10.2136/vzj2010.0112.
The CLIWAT Handbook 89
Vandenbohede, A. and Lebbe, L.C. 2006, Occurrence of salt water above fresh
water in dynamic equilibrium in a coastal groundwater flow system near De
Panne, Belgium, Hydrogeology Journal 14: 462–472.
4.6.
Authors: Jes Pedersen, Central Denmark Region (DK), Klaus Petersen, Ministry
of Environment, Nature agency (DK)
References:
Regional Differences in Climate Change Impacts on Groundwater and Stream
Discharge in Denmark. Lieke van Roosmalen, Britt S. B. Christensen, and
Torben O. Sonnenborg. www.vadosezonejournal.org Vol. 6, No. 3, August
2007.
Impacts of Europe’s changing climate — 2008 indicator-based assessment,
EEA Report No 4/2008
4.7.
Authors: Rolf Johnsen, Central Denmark Region (DK) and Jørgen F. Christensen,
Region of Southern Denmark (DK).
References:
Ellis P.A. and Rivett M.O. 2006. Asessing the impact of VOC-contaminated
groundwater on surface water at the city scale. Journal of contaminant hydrol-
ogy 91 107-127
Mussolf, A. et al 2007. Xenobiotika im Grundwasser und Oberflächenwasser
der Stadt Leipzig. Grundwasser – Zeitschrift der Fachsektion Hydrogeologie
(2007) 12:217–231
Region Midtjylland 2011: Undersøgelser af grundvandets kvantitet og kvalitet
i Horsens by.
Shepherd, K.A et al. 2006. Intergrated understanding of urban land, ground-
water baseflow and surface water quality - The City of Birmingham. Science of
total environment 360 (2006). 180-195

90 The CLIWAT Handbook
4.8.
Authors: Jan Gunnink, TNO (NL) and Wolfgang Scheer, LLUR (DE).
Chapter 5
Author: Caroline van Bers, Seeconsult (DE)
References:
M. Abrado and M Hassan, (unpublished). Stakeholder Analysis, CEDARE. URL:
www.wadi.unifi.it/stakeholder_analysis_cedare.pdf
European Commission. 2003. Guidance Document No 8: Public Participation
in Relation to the Water Framework Directive. Common Implementation Strat-
egy for the Water Framework Directive (2000/60/EC). Working Group 2.9.
J. Glicken, 2000. Getting stakeholder participation ’right’: a discussion of
participatory processes and possible pitfalls. Environmental Science & Policy
3:305-310.
M. Hare, and J Krywkow. 2005. Participatory processes for the design of water
storage areas, TRUST inception report III.
J. Krywkow, 2009. A Methodological Framework for Participatory Processes in
Water Resources Management. PhD thesis. University of Twente, the Nether-
lands. June 2009.
D. Ridder, E. Mostert and H. A. Wolters, 2005. Learning Together to Manage To-
gether – Improving participation in water management. Publisher: University
of Osnabrück, Institute of Environmental Systems Research. Osnabrück.
S. Schmidt, 2008a. CLIWAT: Report on identification of end-users/stakehold-
er. December 2008.
Seecon Germany GmbH (downloadable from http://cliwat.eu)
S. Schmidt, 2008b. CLIWAT Generic Participatory Plan. November 2008.
Seecon Germany GmbH (downloadable from http://cliwat.eu)
The CLIWAT Handbook 91
S. Schmidt, 2009. CLIWAT Dissemination Plan. February 2009. Seecon Ger-
many GmbH (downloadable from http://cliwat.eu)
Chapter 6
Authors: Klaus Hinsby, GEUS (DK) and Klaus Petersen, Ministry of Environ-
ment, Nature agency (DK)
References:
Broers, H.P., Preziosi, E., Hinsby, K., Kozel, R. and Vermooten, S. (2011).
Workshop – “Climate change impact on Groundwater” – Summary and
Outcomes. Presentation at the workshop “Climate change impact on
groundwater”organized by the Water Resources Expert Group of the Eurogeo-
surveys. Held back-to-back with the 21st Plenary Meeting of Working Group C
“Groundwater” under the umbrella of the Polish presidency, Warsaw, October
12-13. Accessible at: http://circa.europe.eu.
EC (1992). Council Directive 92/43/EEC – “The Habitats Directive”
EC (2000).Directive no. 2000/60/EC – “The Water Framework Directive”.
EC (2006).Directive 2006/118/EC – “The Groundwater Directive”.
EC (2007), Directive 2007/60/EC – “The Flood Directive”.
EC (2008).Directive 2008/56/EC – “The Maritime Strategy Directive”.
EC (2009a). EU White Paper “Adapting to climate change: towards a European
Framework for Action”.
EC (2009b).Guidance Document no. 24 (“River Basin Management in a
changing climate”)
EC (2009c).Guidance Document no. 18 (“Groundwater threshold values”)

92 The CLIWAT Handbook
EC (2009d).Guidance Document no. 19 (“Surface water”)
EC (2009e).Guidance Document no. 23 (“Eutrophication”)
EC (2010).Guidance Document no. 26 (“Risk assessment and conceptual
models”)
Green, T.R;.Taniguchi, M., Kooi, H., Gurdak, J.J., Allen, D.M., Hiscock, K.M.,
Treidel, H. and Aureli, A. (2011). Beneath the surface of global change: Impacts
of climate change on groundwater. Journal of Hydrology, 405, 532-560.
Hinsby, K. (2011). “CLIWAT” and “BaltCICA” – climate change impact and ad-
aptation around the North Sea and Baltic Sea. Presentation at the workshop
“Climate change impact on groundwater”organized by the Water Resources
Expert Group of the Eurogeosurveys. Held back-to-back with the 21st Plenary
Meeting of Working Group C “Groundwater” under the umbrella of the Polish
presidency, Warsaw, October 12-13. Accessible at: http://circa.europe.eu.
Hinsby, K., Condesso de Melo, T. and Dahl, M (2008).European case studies
supporting the derivation of natural background levels and threshold values
for protection of human health and ecosystems. Science of the Total Environ-
ment, 40, 1-20.
Hinsby, K., Markager, S.S., Kronvang, B., Windolf, J. and Thorling, L. (2011).
Threshold concentrations and management options for nutrients in a cach-
ment of a temperate estuary with poor ecological status. Submitted.
Hinsby, K., Auken, E., Essink, G.H.P.O., de Louw, P, Jørgensen, F., Siemon, B.,
Sonnenborg, T.O., Vandenbohede, A., Wiederhold, H., Guadagnini, A. and
Carrera.J. (2012).Assessing the impact of climate change for adaptive water
management in coastal regions.Special Issue of the journal Hydrology and
Earth System Sciences, http://www.hydrology-and-earth-system-sciences.
net/submission/scheduled_special_issues.html#4.
The CLIWAT Handbook 93
Johnsen, R. WaterCAP – Cluster on water management in a chang-
ing climate. Presentation at the workshop “Climate change impact on
groundwater”organized by the Water Resources Expert Group of the Eurogeo-
surveys. Held back-to-back with the 21st Plenary Meeting of Working Group C
“Groundwater” under the umbrella of the Polish presidency, Warsaw, October
12-13. Accessible at: http://circa.europe.eu.
Oude Essink, G.H.P.(2011). Groundwater in deltaic areas – climate change
impacts solutions. Presentation at the workshop “Climate change impact on
groundwater”organized by the Water Resources Expert Group of the Eurogeo-
surveys. Held back-to-back with the 21st Plenary Meeting of Working Group C
“Groundwater” under the umbrella of the Polish presidency, Warsaw, October
12-13.EC(2000). Accessible at: http://circa.europe.eu.
Oude Essink G. H. P., van Baren, E.S. and de Louw, P.G.B. (2010). Effects of
climate change on coastal groundwater systems: A modeling study in the
Netherlands.Water Resources Research, 46, W00F04.
Pedersen, J., Johnsen, R. and Petersen, K. Challenges in a future climate – an
overview.Chapter 3, this volume.
Quevauviller, P. (2011). Adapting to climate change: Reducing water-related
risks in Europe – EU policy and research considerations. Environmental Sci-
ence and Policy, 14, 722-729.
Sonnenborg, T.O. and Oude Essink, G.H.P. (2011).Groundwater and integrated
hydrological models as predictive tools.Chapter 4.5, this volume.
Sonnenborg, T.O. and Refsgaard, J.C. (2011). Uncertainties in climate change
impact modeling (groundwater). Presentation at the workshop “Climate
change impact on groundwater”organized by the Water Resources Expert
Group of the Eurogeosurveys. Held back-to-back with the 21st Plenary Meeting
of Working Group C “Groundwater” under the umbrella of the Polish presiden-
cy, Warsaw, October 12-13. Accessible at: http://circa.europe.eu.

94 The CLIWAT Handbook
Sonnenborg, T.O., Hinsby, K., van Roosmalen, L. and Stisen, S. (2011). Assess-
ment of climate change impacts on the quantity and quality of a coastal catch-
ment using a coupled groundwater – surface water model. Climatic Change, in
press.
Stoltenborg, T.B. (2011). The Significance of Article 6(3) of the Habitats Direc-
tive in the area of animal husbandry – a problem child or just forgotten?. PhD
thesis, School of Law, Faculty of Social Sciences, University of Aarhus, in Dan-
ish with English summary, 349 pp.
Vermooten, S., Preziosi, E., Broers, H.P., Hinsby, K. and Kozel, R. (2011).
Groundwater aspects in the Guidance no. 24 on river basin management in a
changing climate. Presentation at the workshop “Climate change impact on
groundwater”organized by the Water Resources Expert Group of the Eurogeo-
surveys. Held back-to-back with the 21st Plenary Meeting of Working Group C
“Groundwater” under the umbrella of the Polish presidency, Warsaw, October
12-13. Accessible at: http://circa.europe.eu.
WGC (2011).Manifesto on climate change impacts on groundwater. EU Working
Group C »Groundwater, document developed from the outcome of the work-
shop »Groundwater and Climate Change«, Warsaw, October 12, 2011.
Wilby, R. L., Orr H. G., Hedger, M., Forrow, D., and Blackmore, M. (2006). Risks
posed by climate change to the delivery of Water Framework Directive objec-
tives in the UK, Environment International, 32(8), 1043-1055.
The CLIWAT Handbook 95
A
B
CD
E
FG
Appendix
Pilot area A: Belgische Middenkust (B)
Pilot area B: Zeeland (B + NL)
Pilot area C: Frylan Mainland and Terschelling (NL)
Pilot area D: Borkum (D)
Pilot area E: Schleswig/Sønderjylland (D + DK)
Pilot area F: Egebjerg and Horsens Town (DK)
Pilot area G: Aarhus River (DK)
96 The CLIWAT Handbook
Pilot Area A
Belgische Middenkust (B)
Introduction
The Belgian pilot area ‘Belgische Middenkust’ is situated in the central
part of the Belgian coast between Zeebrugge en Nieuwpoort. It is the most
populated part of the Belgian coast.
The pilot area is characterized by a shore, dunes and polder area. The
width of the shore varies between 200 and 500 m and has one of the high-
est sea level fluctuations of the North Sea with an amplitude of almost 2.5
m during spring tide. Dune area is relatively small, between 50 and 1500
m. This results in a large variation in the extension of the freshwater lenses
underneath the dunes. Polders are low-lying areas (between 0 and 3 msl)
which need drainage by a dense network of ditches and canals. The drain-
age level is about the mean seawater level. The polders contain a complex
fresh-saltwater distribution which is the result of Holocene transgression
combined with geologic and geomorphologic evolution and the human
intervention (e.g. land reclamation).
Present situation
Freshwater reserves in the dunes (because of the limited width) and pol-
ders (because of the complex fresh-saltwater distribution) are limited.
Meeting demands for freshwater is thus a major challenge. Polders are fur-
ther an artificial, by man created landscape and hydrology must be care-
fully managed. Projected evolutions of climate change add to this constant
management. The varying width of the dune makes that there are several
weak points in the coastal defence with potential inundation threats.
Historical maregraph measurements (1925-2004) in Oostende show an in-
crease in the mean sea level of 14,4 mm per decade over this measuring
The CLIWAT Handbook 97
period. Globally, during the period 1961-2003 sea level rose 18 mm per
decade. Because of sea level rise and the presence of a limited dune belt,
seepage of water in the polder area is likely to increase. In many areas this
will lead to an increase in salt load having a negative influence on crop
yield.
Change of climatologic parameters will influence recharge and recharge
patterns. Subsequently, this has an influence on drainage and repercussion
for the hydraulic management of the polder area.
It’s expected that periods of high rainfall and severe storms will occur
more frequently in the future. Due to insufficient drainage at such severe
events, flooding can arise. This will result in the infiltration of additional
freshwater in the aquifer. Flooding can also be the result of severe storm
events whereby sea water inundates parts of the dune and polder area. In
this case, saltwater will enter the aquifer. Consequently floods will alter
temporally groundwater flow and could have a long-lasting influence on
fresh-saltwater distribution.
What kinds of problems/issues have been investigated?
The complex fresh-saltwater distribution was first mapped in the early
1970s by De Breuck et al. (1974). In the following 40 years, a lot of new
data have been collected but never interpreted on the scale of the pilot
area. Consequently, this data (chemical and geophysical data) has been
integrated within the old map.
Geochemistry has been so far investigated in small study areas in the
coastal plain but not on a large scale. The chemistry data collected to up-
date the fresh-saltwater distribution is also used for that purpose. Key
question is what chemical reactions determine the overall composition of
the fresh, brackish and salt water.
Characterising fresh-saltwater distribution on a field scale is a difficult
task. Moreover, its distribution is driven by a number of different pro-

98 The CLIWAT Handbook
cesses. It was therefore investigated how different kinds of data and tech-
niques (chemistry, hydraulic heads, borehole geophysics, aquifer tests, tem-
perature logs, environmental tracers, flow and transport modelling) can be
combined and contribute to this.
So, it was investigated how geophysical borehole logs (electrical conduc-
tivities of the deposits and the natural gamma radiation) will help us in
the schematization of the groundwater reservoir. In hydrogeological litera-
ture a number of estimation methods of the hydraulic conductivities are
known. These estimations are based either on the natural gamma radia-
tion of the deposits or on the electrical matrix conductivity of the deposits.
These matrix conductivities are however not directly measured and should
indirectly be deduced by the joint interpretation of the two geophysical
borehole logs. By this joint interpretation of the logs it was also possible
to derive the variation of the porosity and of the electrical pore water
conductivity versus the depth. The depth variation of the pore water con-
ductivity is important to derive the fresh-salt water distribution; the depth
variation of the porosity is important to estimate the depth variation of
the hydraulic conductivities of the deposits.
Finally, a 3D density-dependent flow and transport model has been made
of the central area of the pilot area. The current fresh-saltwater distribu-
tion is simulated and with this as starting point to simulate influence of
sea level rise. Special attention goes to the change in freshwater reserves
and salt load on the surface.
De Breuck, W., De Moor, G., Tavernier, R., 1974. Depth of the fresh-salt water
interface in the unconfined aquifer of the Belgian coastal area (1963-1973). Proc. 4th
Salt Water Intrusion Meeting, Gent, annex-map, scale 1/100000.
The CLIWAT Handbook 99
What are the outcome/results?
Fresh-saltwater distribution (Vandenbohede et al., 2010)
Data collected in the last 35 years are in general in good agreement
with the map of 1974.
An updated map was made, see figure below.
With the exception where (hydraulic) interventions were done (e.g.
harbour infrastructure) current fresh-saltwater distribution is in
equilibrium with the hydraulic boundary conditions.
Map gives a good and representative distribution at large scale, at
small scale (hundreds of meter) additional research is recommended.

100 The CLIWAT Handbook
Geochemistry of pore water (Vandenbohede and Lebbe, 2011)
Holocene transgression, consequential geologic and geomorphologic
changes and human intervention (impolderdering) influenced pore
water chemistry in the pilot area. Two hydrosomes (bodies of water of
the same origin) are found (see figure below): brackish and saltwater
dating from before the impoldering and freshwater dating from after
the impoldering.
Mixture of fresh and saltwater, carbonate mineral dissolution, cation
exchange, and some oxidation-reduction reactions (organic matter,
pyrite) determine water quality.
A clear chromatographic sequence due to cation exchange is visible in
the fresh water hydrosome. This hydrosome originates because of the
displacement of saltwater with freshwater because of the impoldering.
Older brackish and saltwater contain the signature of both freshening
and salinization illustrating the complex evolution of the coastal plain
from the last ice age until the impoldering.
Combination of different methods to characterize aquifers (Vandenbohede et
al., 2011)
Tracer data can serve to derive parameters related to groundwater sys-
tems or can be used in the calibration of transport and flow models. In
this part of the study, we used temperature, 3H/3He (age dating) and
hydrochemical data, together with head measurements, borehole logs
and an aquifer test to obtain insight in the groundwater flow and fresh-
saltwater distribution of a small area in the pilot area (Snaeskerepol-
der).
Flow and transport model code SEAWAT acted as the integration
medium for the different data. Each data type has its own interpreta-
The CLIWAT Handbook 101
tion technique and delivers pieces to add to the model. Additionally,
the aim of using different data is to perform verification of results. For
instance, fluxes from temperature logs and the SEAWAT model, water
quality and age dating all provide information of flow to and velocities
in the vicinity of drainage ditches.
Different data also provide information on different scales. Tempera-
ture logs and aquifer tests act on a small scale, groundwater age is
influenced by larger scale flow and water quality is determined by the
general flow of the area.
With this part of the study we aimed to illustrate that integration of dif-
ferent kind of geological, hydrological, geophysical and geochemical data
is an important way forward in our modelling efforts and understanding
of (coastal) groundwater systems. And this is a prerequisite for simulating
effects of climate change.
Depth variation of hydraulic conductivities estimated from geophysical borehole logs
A method is developed to estimate the equivalent horizontal and vertical
hydraulic conductivities of a defined depth interval of sediments based on
geophysical borehole logs (electrical conductivities of deposits and natural
gamma radiation) and on a limited number of electrical conductivities of
extracted pore waters. This method is developed using the observations
of two double pumping tests performed at two different sites in the Bel-
gian pilot area. In this estimation method a number of well established
relations are applied such as: the law of the parallel electrical conductivi-
ties, the relation between the natural gamma radiation and the electrical
conductivity of the matrix and the relation between the formation factor
F, pore water conductivity and electrical matrix conductivity. Beside the
estimation of the equivalent horizontal and vertical hydraulic conductivi-
ties of well defined depth intervals also the depth variation of the total salt
content of the pore water, the porosity and of the electrical matrix conduc-
tivities is estimated. All these valuable data about the electric and hydrau-
lic parameter derived from the geophysical allows us the schematization
of the groundwater reservoir (succession of pervious and semi-pervious

102 The CLIWAT Handbook
layers and their heterogeneity). So, the borehole data will not only deliver
data about the present salt-fresh water distribution but also about the hy-
draulic conductivity of the groundwater reservoir. These are both valuable
data for the 3D density-dependent flow and transport model.
The CLIWAT Handbook 103
Future effects of sea level rise
Fresh-saltwater distribution in the area of Oostende, central in the pilot
area is simulated. Subsequently, this distribution is used a starting point
to simulate the effect of sea level rise. Some results of this are shown
in the section 5 ‘Future situation, including aps/figures illustrating the
scenario(s)’.
Vandenbohede, A. Courtens, C. Lebbe, L., De Breuck, W. (2010). Fresh-salt water distribution in the central Belgian coastal plain: an update. Geologica Belgica, 11/3, 163-172.
Vandenbohede, A, Lebbe, L. 2011.
Groundwater chemistry patterns in the phreatic aquifer of the central Belgian coastal plain. Applied Geochemistry, doi:10.1016/j.apgeochem.2011.08.012.
Vandenbohede, A., Hinsby, K., Courtens, C., Lebbe, L., 2011.
Flow and transport model of a polder area in the Belgian coastal plain: example of data integration. Hydrogeology Journal, DOI: 10.1007/s10040-011-0781-7.
Future situation, including maps/figures illustrating the scenario(s)
By using a 3D density dependent model to study the effects of climate
change in the coastal area central in the pilot area the following conclu-
sions were obtained:
Sea level rise results in the decrease of the volume of freshwater in the
freshwater lenses present under the dunes. This means that freshwater re-
serves in the dune area become even more limited than they currently are.
A second effect is the increased salt load in the upper part of the aquifer.
Mean increase in salt load for the first km inland from the coast is already
1.25 times larger than in the current situation. It is expected that this will
have its effects on the land use and culture which will be possible in the
future. Further from the coast, sea level rise mainly results in an increased
flow of brackish to saltwater to the drainage channels. Increase of salt load

104 The CLIWAT Handbook
on intermediate land is limited. Figure below shows the evolution of the
mineralisation of the groundwater (in mg/L) at the top of the aquifer.
Challenges and future possible solution – recommendations for adaptation or further investigations
Predictions for the future are heavily dependent on our present-day
system understanding. Some recommendations for this are:
Ditches are a vital part of the drainage system for the management of
the polder area. However, not much is known about the water balance of
these ditches (base flow, run-off capture, sensonal fluctuations in drainage
capacity etc.). A first step was made with the project to determine and
verify with different methods groundwater fluxes to two ditches in the
Snaeskerkepolder but obviously, more data is necessary on this ground-
water-surface water interaction.
Additionally, few data are available of the water quality (e.g. total dissolved
solutes, TDS) in the ditches. Monitoring this, for instance by measuring the
electrical conductivity which is function of TDS, would therefore be a valu-
able contribution for our understanding to the drainage system.
The CLIWAT Handbook 105
Pilot Area
B Zeeland (B-NL)
Introduction
The Dutch pilot area ’Zeeland’ is situated in the South-West of the Nether-
lands. The province of Zeeland has 380.000 inhabitants in thirteen coun-
ties. 70% of the landuse in Zeeland is agriculture, while tourism and recre-
ation are important economic activities. Large parts of Zeeland are below
mean sea level and dikes prevent the land from flooding. The most north-
ern island ’Schouwen-Duiveland’ is of particular interest in the project Cli-
Wat. Dunes are located in the western part of Schouwen-Duiveland, the
parts with the lowest surface elevation are the reclaimed salt marshes and
there are some creek deposits on the island.

106 The CLIWAT Handbook
Present situation
Most of the groundwater and surface water of Schouwen-Duiveland is sa-
line. The ecological reserves in the dunes are relying on fresh water, all
other ecological reserves areas are of brackish / saline nature. There is
infiltration of fresh water (transported from outside the dunes) into the
dunes for drinking water supply. Agriculture and nature reserves on the
other hand are self-relying for their fresh water supply. Irrigation is rare on
Schouwen-Duiveland and salt and drought damage to crops occurs dur-
ing dry summers. There are sources of fresh water available at Schouwen-
Duiveland: 1. precipitation surplus (mean last 10 years: 200mm/year); 2.
fresh groundwater in the dune area (up to 50-100m below surface level); 3.
fresh groundwater in the creek deposits (up to 5-15 m below surface level)
and 4. rainwaterlenses in saline seepage areas (less than 5 m below surface
level). The dynamics and dimensions of these fresh water resources are not
known exactly end these fresh water resources are probably not optimally
used.
Figure 1: The province of Zeeland in de South-West of the Netherlands.
Schouwen-Duiveland is the island in the north .a. surface elevation [laser-
altimetry] and b. island Schouwen-Duiveland [from Intereg IV-b project CPA].
The CLIWAT Handbook 107
Figure 2: Profile of the Chloride concentration of the
groundwater of Schouwen-Duiveland.
What kind of problems/issues has been investigated?
In many coastal areas groundwater is saline because of sea water intrusion
and marine transgressions. Large parts of the province of Zeeland is situ-
ated below mean sea level and saline groundwater may reach the surface
by upward groundwater flow. This upward seepage of saline groundwater
causes salinization of surface waters and mixes with shallow fresh water
bodies making it unfit for irrigation, drinking water supply and industrial
use. Rainwater lenses develop on top of saline groundwater by infiltration
of rainwater. These rainwater lenses act as fresh groundwater storage in
the study area. The lenses are generally thin (< 3 m) in the low-lying seep-
age areas and may reach greater depth in the infiltration areas in sandy
creek ridges (5 to 10 m) and at the dunes (> 20 m). Future rises in sea level
and climate change are expected to increase the seepage and salt loads
to surface waters and decrease the availability of both fresh surface and
groundwater.
The research objective of pilot area B – province of Zeeland – is to de-
scribe the characteristics and spatial variability of rainwater lenses and
determine the main factors that control these characteristics. Different in-

108 The CLIWAT Handbook
situ (including TEC-probe, ECPT, groundwater sampling) and ex-situ field
techniques (including CVES, EM31, HEM) are used to map the characteris-
tics of the rainwater lenses (e.g. thickness rainwater lens, width of mixing
zone, depth fresh-saline groundwater interface). Complementary to the
field measurements we used numerical groundwater models to determine
the controlling factors of the different lens characteristics and to explain
their spatial variability. With the model we also calculated the effect of
climate change and sea level rise on lens characteristics and fresh water
availability.
Figure 3. Position of field measurements in pilot area B: province of Zeeland.
The CLIWAT Handbook 109
What are the outcome/results?
The outcome of the research of pilot area B are:
1. Field measurements that show the characteristics of rainwater lenses in different kind of areas;
2. Extrapolation of rainwater lens characteristics to larger areas using HEM: map of rainwater lens thickness;
3. An analysis of the most important factors that control the development of rainwater lenses;
4. Improvement of the 3D-chloride distribution map of Schouwen-Duivenland;
5. Simulation of the present groundwater system (heads, fluxes and Cl-concentration) with a numerical density dependent groundwater model of Schouwen-Duivenland;
6. Quantification of the effects of climate change and sea level rise on the groundwater system of Schouwen-Duivenland.
Characteristics of rainwater lensesThe in-situ measurement show that the centre of the mixing zone be-
tween rainwater and saline groundwater varies between 4 and 11 m depth
(e.g. ECPT 32 and ECPT 4 in Fig. 4). At the dunes or nearby the dunes the
fresh water lens may reach depths greater than 50 m (e.g. ECPT 12 in Fig.
4). In the seepage areas the rainwater lenses are much thinner; mixing of
saline seepage with rainwater occurs no deeper than 3.5 m and the centre
of this mixing zone is found as shallow as 1.0 to 2.5 m below ground level
(e.g. ECPT 31 and ECPT 13 in Fig. 2). There is no sharp boundary between
infiltrating fresh rainwater and saline seepage groundwater but a gradual
transition zone with an average width of 2.0 m. As the mixing zones mani-
fest at shallow depth, their depth and width is of great importance for the
fresh water availability for the growth of crops. In most seepage areas, we
did not find any fresh groundwater. The upper groundwater is therefore
already a mix of seepage and rainwater, which indicates that part of the
mixing process occurs in the unsaturated zone.

110 The CLIWAT Handbook
Figure 4. Comparison of six ECPT soundings and smooth
15-layer HEM inversion models (for location see Fig. 1)
Mapping rainwater lens thickness using Helicopter-borne electromagnetic measurements (HEM)
The combination of the applied techniques made it possible to extrapolate
the detailed in-situ measurements at point scale (groundwater sampling,
TEC-probe, ECPT) to field scale (CVES, EM31) and even to large areas with
helicopter-borne electromagnetic measurements (part of the island Schou-
wen-Duivenland, 56 km2).
The HEM data inverted to layered-earth resistivity depth models reveal
the spatial distribution of the electrical conductivity down to depths of
about 20-30 m in the lowlands and more than 60 m in the dune area. The
results of the smooth 15-layer HEM models agree very well with nearby
ECPT measurements (Fig. 4). From the HEM- inversion models we made a
map of the thickness (Dmix
) of the rainwater lenses for the entire airborne
survey area (Fig. 5). Thicker rainwater lenses occur in the eastern part of
The CLIWAT Handbook 111
the survey area (Dmix
= 5-10 m), close to agricultural field 11 and the adja-
cent the fossil sandy creek (Dmix
= 8-20 m) and, of course, in the dune area
(Dmix
> 30 m).
Figure 5. Estimated depth of Dmix
(average position of the mixing zone) derived from
HEM inversion models. All flight lines (black lines) and the location of the ECPTs (red
circles, those shown in Fig. 4 are numbered) are plotted on top of the depth map.

112 The CLIWAT Handbook
Future situation, including maps/figures illustrating the scenario(s)
In the Netherlands 4 climate scenario’s are used to predict the climate for
the year 2050:
Tabel 1: Climate scenario’s 2050 KNMI (Klein Tank en Lenderink, 2009)
Scenario G G+ W W+
Worldwide
Windcirculation un-changed
changed un-changed
changed
Temperature (°C) +1 +1 +2 +2
Summer the Netherlands
Mean temperature (°C) +0,9 +1,4 +1,7 +2,8
Mean precipitation (%) +2,8 -9,5 +5,5 -19.0
Mean evaporation (%) +3,4 +7,6 +6,8 +15,2
Winter the Netherlands
Mean temperature (°C) +0,9 +1,1 +1,8 +2,3
Mean precipitation (%) +3,6 +7.0 +7,3 +14,2
Sea level rise
Sea level rise (cm) 15-25 15-25 20-35 20-35
There are different causes for future salinization of the groundwater and
surface water system:
1. autonomous proces (no equilibrium yet in the low lying areas; the saline
groundwater from historical transgressions goes in upward direction
which results in salinization of the shallow groundwater)
2. sea level rise
3. changing groundwater recharge
4. land subsidence
5. antropogenic (f.e. groundwater extractions)
The autonomous process is dominant in the salinization proces (figure 6b).
Due to sea level rise or land subsidence the difference between the level of
the sea and the level of the locks increases, the seepage flux increases and
The CLIWAT Handbook 113
salinization is accelerated. The salinization of the shallow groundwater
(at bottom Holocene layer) due to climate change scenario W+ increases
mainly (figure 6c).
Figure 6: a. chloride concentration groundwater at bottom of Holocene layer,
present situation; b. salinization/freshening due to autonomous processes 2050
and c. salinization/freshening due to only climate scenario W+ 2050.

114 The CLIWAT Handbook
Challenges and future possible solution – recommendations for adaptation or further investigations
Recommendations for adaptationIn the present situation, the fresh precipitation and the fresh seepage from
the dunes and sandy creeks is quickly drained out of the island in order to
avoid damage from too much water. These fresh water resources are quick-
ly mixed with salt surface water. For each subarea of Schouwen-Duiveland
the fresh water supply for agriculture can probably be improved. But the
best measure depends (among others) on the available amount of fresh
water nearby, the kind of landuse, the surface elevation and soil. Some
examples are shown in figure 7.
Figure 7: some measures in order to increase the fresh
water availability for agricultural use.
Recommendations for further investigations
Research on the effect of climate change and in particular the increase
of heavy rainfall and drought on the groundwater discharge and ther-
fore on the dynamics of the fresh water resources (shallow rainwater
lenses and fresh water in sandy creeks).
Research on the resolution of the model on the seepage fluxes to the
surface water system.
The CLIWAT Handbook 115
Where is the most uncertainty in the quantification of the influence of
the climate scenario’s on the salinisation in the year 2050 (geologie,
hydrological parameters, climate scenario, …)?
Pilot study on the possible increase of the fresh groundwater resourc-
es in the sandy creeks: where is artificial infiltration of water during
the wet season possible?; how much can the fresh water resource be
increased?; will there be too much fresh seepage near the infiltration/
what is the risk?; is this measure economically interesting?
Can the shallow rainwater lenses in saline seepage areas be made
more robust by smart drainage systems?; In what kind of soils can this
be done?
Can there be more interaction in the subject of fresh water supply be-
tween the different kinds of land use: urban areas, agriculture, nature
and recreation?

116 The CLIWAT Handbook
Pilot Area C
Fryslân Mainland (NL)
Introduction
Fryslân is situated in the north of the Netherlands. The CLIWAT pilot area
of the Main land of Fryslân covers a part the coastal area of the Wadden
Sea (figure 1). The area is characterised by low surface elevation. In large
parts of the area the surface elevation is even below mean sea level. This
necessitates among others an appropriate management of surface water
levels and a complex water infrastructure to maintain these levels and to
protect the land from water flooding. Furthermore the surface water has
to be flushed frequently with fresh water from the IJssel Lake, to remove
the salt water in the surface waters, which originates from salt seepage
from the shallow subsoil.
Typical for this area is the shallow depth of the fresh / saline boundary of
the groundwater. Near the coast the thickness of the fresh groundwater
body is only 2 to 5 meters. Further from the coast this depth increases to
over 100 meters. The thickness of the fresh groundwater body, or ground-
water lens, varies during the seasons. At the end of the winter (wet season)
the thickness is maximum. At the end of the summer however, the fresh
groundwater lens shrinks considerably, and in few cases even completely
disappears. This may cause severe problems for agriculture. It is expected
that, due to climate change, especially changes in precipitation, and also
by changes in seawater levels, the problems with salt (ground)water will
increase in the near future.
It should also be mentioned that climate change and rise of seawater levels
are not the only reason for salt groundwater intrusion. The present salt dis-
tribution very much reflects the Holocene transgression of the sea. Further-
more the effects of the last 200 years of water management, the effects of
groundwater abstractions, and of mining salt and gas from the deep subsoil,
considerably contribute to an ongoing salt groundwater intrusion.
The CLIWAT Handbook 117
Present situation
In the present situation relatively few farmers encounter problems with
salt groundwater. There is, in many cases, a delicate balance between
fresh water needs of the crops and the availability of fresh groundwater
in the thin fresh groundwater lenses. Nevertheless, especially in the low
lying areas, there is an increasing number of farmers, who encounter prob-
lems with their crops and or cattle, because of the salt.
Recent studies also confirm that an increasing number of farmers expect
to be confronted with increasing salt problems in the near future.
What kind of problems/issues has been investigated?
First of all the present salt groundwater situation has been mapped using
various geophysical, geotechnical, geohydrological field techniques. In ad-
dition the subsurface has been characterised in detail in 3D.. Finally, by
means of a groundwater model, the effects of climate change and seawater
level rise have been calculated.
What are the outcome/results?
determine the present distribution of salt groundwater in the subsoil
determine the structure of deposits in the subsoil (clay, sand, etc.).
improved geological and geohydrological model
improved geohydrological, parametric model
quantify present regional groundwater flow patterns and flow rates by
improved groundwater model
quantify present regional patterns of salt water seepage to surface
waters by improved groundwater model.
quantify changes in regional groundwater flow patterns and –rates
due to climate change and sealevel rise.

118 The CLIWAT Handbook
Figure 1: map of the CLIWAT pilot area in the main land of Fryslân.
Challenges and future possible solution – recommendations for adaptation or further investigations
The CLIWAT study indicates which parts of the project area will most like-
ly encounter problems with salt groundwater and salt groundwater seep-
age. Additional studies will have to be implemented to minimise the risks
of salt groundwater. Especially the role of drainage and surfacewater level
will have to be studied in detail at local scale.
Furthermore the airborne geophysical measurements proved to be very
successful, and it resulted in very detailed maps of saltwater distribution
and geohydrological characterisation of the subsoil. For this reason it is
recommended to extend this fieldwork to other parts of Fryslân. Further to
extend the density driven groundwater flow model to other parts of Fryslân.
The CLIWAT Handbook 119
Pilot Area C
Terschelling (NL)
Introduction
Terschelling is one of the Dutch Frisian Wadden islands. The island is 30
km long and 4 km wide. Based on the Ghyben-Herzberg principle, a fresh
groundwater lens has been established under the Dutch Wadden Islands.
This lens is the “beating heart” of the hydro geological cycle and the drink-
ing water supply of the islands are in many cases depending on this lens.
For salanization risks, i.e. as an effect of climate change, the knowledge of
the variation (in time) of the depth of the salt and fresh water interface
is essential. The presence, distribution and time variation of a fresh water
lens depends on the lithology, topography, rainfall and (of course) exploita-
tion.

120 The CLIWAT Handbook
Present situation
The aim of this project is to research the effects of sea level rise and climate
change on the equilibrium between salt and fresh groundwater. This prob-
lem is an essential issue in a relative flat and sandy costal areas, like The
Netherlands, Germany and Denmark.
According to the principle of Ghyben-Herzberg a fresh water lens has de-
veloped locally under the island up to 100 meters thickness in the dune
area and up to 60 mtrs in the polder area. This lens was also detected
below the North See locally up to a depth of 60 mtr, this was already
confirmed with a field survey in 2007. This salt and fresh water interface
as a part of the hydrological system was also calculated with a density
driven geohydrological model (MODFLOW-SWI). This modflow model of
Terschelling is used for calculating the hydrological effects or salanization
risks of groundwater withdrawal and will also be used for the effects of
climate change upon the distribution of the lens in time.
At this moment the island is not self supporting in their drinking water
supply. For 66% the drinking water is coming via a pipe line from the main
land. Water supply company Vitens is busy with a pilot study. The aim
of this study is to investigate if a self supporting water supply is possible
in the future. Knowledge about the equilibrium between salt and fresh
groundwater and changes caused by sea level rise is therefore essential.
What kind of problems/issues has been investigated?
With the SkyTEM survey it was possible to ‘map’ the whole fresh water
lens, not only under the dunes but also in the polder area, but also north
of the beach, outside the coast line.
The CLIWAT Handbook 121
What are the outcome/results?
Based on the SkytTEM data and many field measurements a detailed 3D
model of the distribution of fresh water was the result. These results are
compared with the calculated boundary based on the results of the geo-
hydrological model (Modflow-SWI) of the island. Conclusion was: in some
areas the fit was quite good, in others it could be better.
With the SkyTEM data (distribution of the salt fresh interface and consistent
low-intermediate resistivity layers) it was possible to refine the geohydrological
model. This model is now calculating the measured interface.

122 The CLIWAT Handbook
Challenges and future possible solution – recommendations for adaptation or further investigations
Field measurements are essential to calibrate hydrological models. Nor-
mally this calibration is based on point information. Often we do not know
what happens between these points. SkyTEM makes an ´old fashioned´
and sometimes forgotten EM-technique very useful. In a very short time
this system is able to map a large area in a very detailed scale. Combined
with a few calibration measurements SkyTEM is a very powerful and cost-
effective tool, for hydrological survey. Results of SkyTEM data, like the dis-
tribution of the salt fresh interface or consistent low-intermediate resistiv-
ity layers are very useful to calibrate the hydrological model.
The CLIWAT Handbook 123
Pilot area D
Borkum
Introduction
The German North sea island Borkum is the westernmost and largest of
the East Frisian Islands. Ranging 10 km from east to west and maximum
7 km from north to south it covers an area of about 31 km². The 5500
inhabitants are living mainly in the village of Borkum, lain on the western
side of the island. The main source of income is tourism and about 280000
tourists visit the island during summertime.
The drinking water supply of Borkum is autonomous and there are two
water works. The wells of water work I (Waterdelle), located in the western
part, reach down to a depth of 10 m and those of water work II (Ostland),
located in the eastern part, reach a depth of 40 m.
Fig.1: Map of Borkum with ground water table and
catchment areas of water supply wells

124 The CLIWAT Handbook
Fig.1 shows a map of Borkum combined with the groundwater table and
the catchment areas of the water works. The fresh water lens of the island
is limited more or less to the dune areas and exhibits in the areas of the
water works thicknesses of about 50 m. Two vertical electrode chains have
been installed in the course of the CLIWAT project in the deep drillings
CLIWAT I and CLIWAT II, which are located in the vicinity of the well
fields Waterdelle and Ostland, to monitor the temporal and spatial behav-
iour of salinity in the vicinity of the saltwater/fresh water transition zone
in a depth between about 45 and 65 m.
The aquifer exhibits 4 different levels, each separated by more or less leaky
aquitards. In the area of the water supply well fields there are extended
clay layers, protecting the drinking water from pollution from above and
up coning salt from below. The Tertiary basement of the aquifer is located
in a depth of about 180 m (Fig. 2 left). The uppermost three Quaternary
aquifers are used for drinking water supply and reach down to a depth of
about 50 m.
The delivered water generally is of good quality, though in several wells
high concentrations of iron occur. After delivery the water has to be threat-
ened by some standard procedures. The chloride concentration in all wells
is lower than 100 mg/l. From water work I an amount of 340 thousand
m³/a drinking water is delivered (permitted 400 thousand m³/a) and from
water work II an amount of 530 thousand m³/a (permitted 800 thousand
m³/a). According to the seasonable pattern of the tourism the annual vari-
ation of the abstraction is considerable and varies usually during one year
between 30 and 120 m³/month for all supply wells.
Present situation
Former studies indicate a limited fresh groundwater resource and a level
of water abstraction (0.9 million m³/year) that is just in balance with the
amount of recharged fresh groundwater. Climate changes are expected to
adversely affect this balance and decrease the potential fresh water supply
by salinization. In addition, the waterworks may use the entire permissible
amount (1.2 million m³/year), which could lead to problems of salinization
The CLIWAT Handbook 125
from overexploitation. Waterworks (administrated by Stadtwerke Borkum
GmbH) abstract vital amounts of groundwater in water work I and II and
supply the island of Borkum with drinking water. Increasing salinization in
the deep screen of water work II even now is a problem.
The groundwater resources in Borkum must be protected to meet the cur-
rent and future demands for domestic water. The need to adapt to the
predicted climate changes is urgent and the Borkum project and the CLI-
WAT project in general, will provide the basis on which adaptations can
be made.
What kind of problems/issues has been investigated?
The main objectives of the Borkum pilot area are to develop a 3-D hy-
dro geological model, map the spatial distribution of subsurface ground
water bodies, and to evaluate quantitative and qualitative effects of cli-
mate change on groundwater from simulations generated by a numerical
model which is based on the hydro geological model. The hydro geological
model is mainly based on geophysical data like airborne electromagnetic
data (HEM), seismic data and the statistical evaluation of drilling data.
The total model area attains 133 km² and is four times as large as the is-
Fig.2. Hydrogeological model (Fig. left). Numerical model, setup with 39 vertical
layers (centre of the figure), discretization of the model in 1 m depth (const. mass
boundary conditions for sea water are marked blue) (Fig. right).

126 The CLIWAT Handbook
land of Borkum itself because considerable parts of the Wadden Sea have
to be incorporated into the numerical computations (Fig.2. centre and
right). For the numerical modelling the 3D-finite elements code FEFLOW
( www.feflow.de ) was used.
The numerical model will use data from the Intergovernmental Panel of
Climate Change (IPCC) climate scenarios (A2), in particular for the Ger-
man North Sea coast. The results will provide an important input (as well
as tool) for current and future quantitative and chemical status assess-
ments of groundwater according to the Water Framework- and Ground-
water directives, as well as for the planning of strategies for flood defence.
The results will also be accompanied with guidelines and recommenda-
tions for the management of the water supply and the protection of the
groundwater resources.
What are the outcome/results?
The following are the main outcomes from the pilot area.
Determination of the local effect of climate changes on groundwater
resources
Quantification and visualisation of the changes to the groundwater
table, salinity for different depths and surface water flows
Evaluation of protection strategies and methods for groundwater
reservoirs and catchment zones (well fields) under changed climatic
conditions
Evaluation of protection strategies against salinization of delivered
drinking water due to climate change
Protective measures against land loss due to permanent flooding by
increased sea level.
Development of protective measures for low lying polder areas under
storm flood conditions
The CLIWAT Handbook 127
Future situation, including maps/figures illustrating the scenario(s)
Using a distributed hydrological simulation model, a study of projected
regional climate change effects for the different German federal states like
Niedersachsen on temperature and precipitation has been carried out by
the “Deutsches Institut für Küstenforschung” for different IPCC emission
scenarios. After the IPCCA2 Scenario an average annual increase in tem-
perature of 2.9 °C and for the annual precipitation of about 10 % (summer
-5% and winter +25%) in the area of the North German coast is expected
until 2100.
Climate change effects on groundwater recharge and discharge to streams
were found to vary seasonally with wetter winters and dryer summers.
Potential effects of climate change on water availability were also predicted
to vary seasonally. These predictions are typically for the north German
North Sea coast.
Using the ICPP-A2 Scenario quantification and visualisation of the chang-
es to the groundwater table was carried out. Due to the enhanced annual
precipitation scenarios with an enhanced ground water recharge of +10%
(average scenario) and annul recharge of + 5% (conservative scenario) were
used.
Due to the enhanced recharge and the increased sea level for the average
scenario the ground water table will rise until 2100 by about 0.5 m for the
average scenario and 0.3 m for the conservative scenario in the dunes ar-
eas while in the drained polder areas it will be nearly not affected. Due to
the enhanced drainage the outflow from the open waters will increase by
about 50% for both the average scenario and for the conservative scenario.
The model results show that sea level rise will not affect essentially the
general shape of the fresh water lens. In deeper located regions changes of
the lens are limited to the environment of the water works where up con-
ing of sea water will threaten the drinking water quality.

128 The CLIWAT Handbook
Fig. 3 shows vertical profiles of the TDS-concentration (Total Dissolved
Solids) for the pore water of the sediments at the new drillings CLIWAT
I and CLIWAT II. These new drillings are located in vicinity of the well
fields of water work I (Waterdelle) and water work II (Ostland) respectively.
The data were computed by the numerical model which was calibrated in
this area by using high precision geophysical data of the buried electrode
chains and data from Helicopter electromagnetic HEM.
Computations of the TDS for the year 2100 using the IPCC-A2 scenario for
ground water recharge and sea level rise show the proceeding salinization
with time (blue curve). The computations illustrate that until the end of
this century the salinization in the vicinity of the well fields has increased
considerably and could become a problem for the quality of the delivered
drinking water, in particular for the deep lying well screens of water work
II.
This feature can be seen also in Fig. 4, where the TDS-concentration is
computed with proceeding time during the period 2010 – 2100 for all
water supply wells of the water works. A linear increase of the ground
water recharge to a maximum of +5% by the year 2100 was used for the
computations (conservative assumption). The figure shows that until 2100
several of the TDS-curves, in particular 3 of the 4 TDS-curves in the deep
screens of WW II –Ostland, exceed substantially the permitted NaCLcon-
centration for drinking water. An intelligent management of the water re-
sources is required to prevent excessive salinization of the drinking water
resources.
Low-lying areas which are not protected by the great south dike or the
dune belts are more and more flooded by the rising sea. Here, predomi-
nately in the natural reserves of the north and south beaches, the aquifer
is getting more and more salted. Without protection measures by the year
2100 these areas are lost to the Wadden Sea (Fig. 5).
The CLIWAT Handbook 129
Fig. 3: Salinization with proceeding time computed at the location of
the CLIWAT I (water work I) and CLIWAT II drilling (water work II)
Fig. 4: TDS concentration [mg/l] computed in the screen of the water
supply wells of WWI-Waterdelle (top) and WWII Ostland (below)

130 The CLIWAT Handbook
Fig. 5: ICPP-A2 scenario: sea level rise of 0.94 m by 2100, flooded areas by
mean flood tide (blue), areas protected by dike and dunes shaded blue
Challenges and future possible solution – recommendations for adaptation or further investigations
Groundwater models that can predict local change need to be developed.
The avaliability of local-scale data and data coverage is therefore vital for
the models. Local factors more or less directly impact the adaptation strat-
egy, e.g. in the case of waterworks of Borkum.
On Borkum protection measures are necessary to prevent the water sup-
ply from excessive salinization caused by over-exploitation and sea level
rise. By means of the density driven flow model the location of the respec-
tive water supply wells in the water works can be optimized to prevent
exorbitant salinization beyond the permitted limits.
Fig. 6 (left) shows the supply wells of water work I (top) and water work II
(below) (red circles) together with the TDS-distribution computed for 2100
in the depths of the screens of the water works. Possible locations for new
wells which could relieve the water work and prevent the wells field from
up coning of salt water are marked blue and are located at positions where
for 2100 sufficient water quality can be expected. Wells which should be
closed because of excessive salinization until 2100 are marked brown.
The computed TDS-curves for all water supply wells (Fig 6 right) demon-
strate that solutions for the well field configuration can be found to keep
The CLIWAT Handbook 131
water quality below the required limit for the NaCl -concentration. In this
way it is possible to maintain drinking water quality without being forced
to reduce the amount of abstraction for more than 100 years. Simulations
with the numerical model can help to find adequate. locations for possible
new wells.
The topography of low-lying areas, which are predominatly located in the
south and north east of the island and which are endangered by flooding
under an increased sea level (Fig 5) should be adapted to the rising sea
level by sand fillings like it has been already carried out successfully on
barrier islands like Sylt.
Fig.6: Spreading of well fields as protection measure from excessive salinization
of the water supply. Location of old wells, new wells and closed wells (left),
development of TDS concentration in the supply wells with time (right).
WW I Waterdelle (top), WW II Ostland (below)
The North Sea region, in particular the German Bight, can be target of heavy
storm flood events. Under extreme weather conditions and an enhanced
sea level of 1 m storm floods can attain altitudes of 4 m above MLS (one in

132 The CLIWAT Handbook
50 years event). It will be clear, that protection measures are necessary. The
altitudes of the dikes have to be controlled and adapted where required.
Moreover dune valleys which could be possible gateways for the flood have
to be banked up with appropriate material like sand to maintain their pro-
tection function.
The work and conclusions of Pilot area D Borkum will make an important
contribution to local-scale knowledge. The same kind of modelling should
be done in other North Sea islands to compare and evaluate the variabil-
ity. Adaptation strategies based on national or local-scale models like those
typical for North Sea islands may be quite different from regional models.
The CLIWAT Handbook 133
Pilot Area E
Sønderjylland/Schleswig (DK/D)
Introduction
The Pilot Area E Sønderjylland/Schleswig extends over nearly 6.000 km²
on both sides of the Danish-German border and covers all typical land-
scape elements of southern Jutland and Schleswig. This are the islands of
Föhr in the North Sea and Als in the Baltic Sea, flat marshlands at the west
coast, outwash plains and older moraine areas in the middle part and a
district with younger moraines in the east.
The highest ground level elevations, which define the water divide between
the runoff of surface water towards the Baltic Sea and towards the North
Sea respectively, are found in the areas of younger moraines in the eastern
parts. Therefore most of the streams flow towards the lowlands on the west
coast. The general direction of the groundwater flow is also influenced by
the morphology of the landscape.
Characteristics of the groundwater conditions in this area are:
Quaternary and Tertiary aquifers
Deep Quaternary aquifers in buried valleys
Two fault zones (Tarper Trog and Tønder Graven) and several salt struc-
tures
Artesian confined aquifers in some parts of the area as e.g. around
Flensburg and Løgumkloster
Saline groundwater in the flat marsh plains, freshwater/saltwater
boundary inland between coast and the western boundary of the outwash
plains
Freshwater lenses surrounded by saltwater on the islands
The structure of the subsurface is very complicated due to the genesis of
the strata. Quaternary sediments show a profound variation in thickness,
extension and permeability of the different layers. Furthermore the depo-

134 The CLIWAT Handbook
sition of Pre-quaternary rocks was strongly influenced by tectonic proc-
esses caused by the activities of salt structures and two large fault systems
in the area. In the run of buried valleys, the base of the Quaternary strata
has been cut deeply into the underlying rocks, caused by the erosional
activity of buried valleys during the ice ages. For these reasons the investi-
gation and interpretation of the hydrogeological and hydraulic conditions
in the pilot area are very complicated.
The land use in this region is mainly agriculture in the rural areas and
some small to medium-sized industry in the urban surroundings of the
cities. The public water supply is performed by approximately 90 small to
medium size waterworks in the Danish part and 21 small to large water-
works south of the border. The total annual amount of abstracted ground-
water is around 30 mio m³ in Schleswig and almost 30 mio m³ north of
the border. Additionally, a lot of private wells for e.g. drinking water sup-
ply for private consumers, irrigation or industrial users also extract water
Fig.: E1_1 Pilot Area E with the focus areas Hørløkke, Als and Föhr
The CLIWAT Handbook 135
from the subsurface. The depth of the production wells varies from a few
meters down to 290 m, located in Quarternary and Tertiary Aquifers. In
many parts of the area, these aquifers are protected by thick layers of clay
and till.
Present situation
Preliminary studies indicate that in the catchment areas of the water
works groundwater abstraction and recharge are in balance. In general,
the groundwater quality, especially of the deeper seated aquifers, is good.
Though inside and along the northern ‘shoulder’ of the Tønder Graven
water abstracted from deep seated resources may be miscoloured (light
brown to black) because of increased content of organic constituents. Fur-
thermore, many wells in shallow aquifers in the rural areas mainly located
on the outwash plains are influenced by human activities, which can be
traced back to e.g. agriculture in the form of nitrate and pesticides. In
urban areas the groundwater quality may be poor e.g. due to the use of
pesticides or road salt. Additionally, the water quality of some wells may be
threatened by contamination from old landfills or from industrial activi-
ties.
Currently, unconfined aquifers are influenced by leaching of nitrate
and pesticides from agricultural activities during the winter season. The
amount of available leachable species, dilution, and change of redox and
degradation conditions determines the resulting concentrations. An in-
creased demand for irrigation during dry summers may also affect the
groundwater quality, especially if the water is abstracted from shallow, un-
confined aquifers.
In coastal near parts of the area and on the outwash plains the groundwa-
ter level is close to the terrain surface leading to occasional flooding.
On the islands of Als and Föhr and in the coastal areas the development of
the boundary between salt and fresh water is mainly sensitive to changes
of the sea level. These islands and the landfill in Hørløkke were locations
for focussed investigations.

136 The CLIWAT Handbook
Hørløkke is a small old landfill located near Vojens, Denmark, in an area
very close to the primary groundwater divide. Household waste and indus-
trial waste including chlorinated solvents have been disposed off directly
on the original soil surface. The underlying sandy aquifer has an average
groundwater level one meter below soil surface. A small creek north of the
landfill drains the upper groundwater during winter and spring.
Investigations have been going on at the landfill since 1986 and therefore
geological, geophysical, and chemical data from a large number of local
deep drillings were already available before this project. A massive plume
of chlorinated solvents leaching from the landfill to a depth of more than
50 m in the aquifer has been delineated. The plume extends more than
500 m downstream from the landfill. Even a small general increase in the
groundwater level due to climate changes is expected to lead to occasional
flooding of the waste in the landfill and a change in the leaching potential.
An increased groundwater level may also change the location of the water
divide and the length and the direction of the plume.
What kind of problems/issues has been investigated?
Main objectives of the Sønderjylland/Schleswig pilot area were to develop
3D geological and hydrological models that can be used to evaluate quan-
titative and qualitative effects of climate change on groundwater and sur-
face water. The hydrological models use data from the Intergovernmental
Panel on Climate Change (IPCC) climate scenarios (A2 and B2). The mod-
els were separated into a generalised model for the mainland and more
detailed models for the islands of Föhr and Als and for the Hørløkke area.
Besides drilling results, these models were backed by geophysical results
mainly from aeroelectromagnetic surveys (SkyTEM and HEM) covering
large parts of the project area and reflection seismic surveys at selected
locations.
The CLIWAT Handbook 137
Special problems that have been investigated were, e.g.,:
a) on the mainland:
a border crossing system of buried valleys within the area of Süder-
lügum-Tønder.
the course of the fresh/saltwater boundary in the march areas along
the coastline
b) on the island of Föhr:
delineation of the freshwater body
the course of a system of buried valleys
glacial induced thrust structures in the PreQuaternary layers
a geological 3D-model and a hydraulical model for the island of Föhr
was installed to estimate quantitative and qualitative effects of climate
change on groundwater and surface water.
c) on the island of Als
based on a geological model which has been revised and enhanced
during the project period an existing groundwater model has been
rerun to estimate quantitative and qualitative effects of climate change
on groundwater and surface water.
d) Hørløkke
five new drillings have been established near the landfill during the
project period to map the pollution plume and to describe the local
geology in more details
IP investigations have been carried out to determine the extension of
the plume
a helicopter-borne geophysical survey has been conducted in a 50 km2
area around the landfill to map the semi-regional geology
a geological model and a dynamic 3D hydrogeological flow and trans-
port model has been developed
the historical plume development from 1980-2010 has been modelled
the possible climate change effects on groundwater divide location,
flow direction, and leaching potential have been modelled

138 The CLIWAT Handbook
What are the outcome/results?
On the mainland especially the results of the SkyTEM surveys, in combi-
nation with new seismic lines delivered important new information about
the border crossing ground water systems and the distribution of saltwater.
Fig. E4-1: The horizontal resistivity slices show several generations of buried valleys
which are up to 350 m deep and 2 km wide. Yellow and red colours mean sandy
deposits with higher resistivity; bluish colour means clayey sediments and/or saltwater
with lower resistivity. The dotted lines give the position of the cross section in Fig. E4-2.
Fig. E4-2: The top shows the north-south profile indicating the complicated geological
conditions in the project area with a deep buried valley in the middle and the depth
shift of the Prequaternary layers due to the Tønder Graven in the northern part (right).
The bottom shows the west-east profile south of the border with saline ground water
in the western part and a deep reaching glaciotectonic complex in the middle part.
The CLIWAT Handbook 139
Fig. E4-3: On the Island of Föhr a rising sea level will impact especially the
hydrological conditions in the marsh lands. Blue areas are indicating areas below
the mean sea level (sea level rising: left = 0, middle = +0.7 m, right = + 1.0 m)
Fig. E4-4: Detailed section of the geological 3d-Model of Föhr
showing some of the model layers in combination with geophysical
data (SkyTEM, seismics). This model provides a basis for the ground
water model and the modelling of the climate change impacts.

140 The CLIWAT Handbook
Fig. E4-5: Changes in groundwater potential (m) for the primary aquifer for the
A2 climate scenario compared to reference model. Island of Als, Denmark.
On Als the hydrogeology and groundwater regime has been subject to ex-
and intensive investigations over the years with the purpose to manage
and administer the fresh water of the island. Lately a revised detailed geo-
logical model has served as part of the basis for a refined ground water
model for Als. In the CLIWAT project this model is used for calculations of
effects of IPCC climate scenarios A2 and B2 on key ground water hydraulic
issues. These issues include changes of hydraulic head levels in the coastal
areas, of abstraction zones of public water works and qualitative assess-
ments of the risk of saltwater intrusion the aquifers.
The outcomes of the project are discussed in details in a special issue of the
HESS journal (Hydrology and Earth System Science, European Geosciences
Union). As an example, the results of the project area Hørløkke are shown.
The CLIWAT Handbook 141
The geological model of Hørløkke is based on MikeGeoModel-software (for
more details visit www.dhigroup.com). The model was established on the
basis of existing and new drillings in the investigation area. Also a number
of new geophysical data (helicopter EM conducted by the BGR as part of
the CLIWAT project) and existing geophysical data (SkyTEM, PACES and
MEP) were used. The model shows that the thickness of the Quaternary
sediments is 30 to 50 meters, consisting mainly of melt water sand, which
is superimposed with till in certain parts of the area. Under the quaternary
deposits, we find a sequence of Miocene sediments consisting of the sand-
rich Bastrup and Odderup Formation, alternating with the clayey and silty
marine Klintingehoved and Arnum Formations. The Miocene sediments
are located down to about 250 meters below the surface (Fig. E4-6).
Fig. E4-6 west to east cross-section of the lithostratigraphy in the model area.
The boundary between the Klintingehoved Formation and Bastrup For-
mation is associated with some uncertainty in the model area, because
it’s mainly based on the geophysical data. The clayey Arnum Formation
separates the Odderup Formation and the Bastup Formation. Only a few
wells penetrate the Arnum clay and its location is based on a combination
of well information, geophysical data and biostratigraphy.
From well data it is difficult to differentiate between the Quaternary fluvial
sand deposits and the Tertiary Odderup sand below. Therefore the Odd-
erup sand and the Quaternary glaciofluvial sand are treated as one homo-

142 The CLIWAT Handbook
geneous sand formation in the hydrogeological model. The total thickness
of this sand formation is about 60 meter around Hørløkke landfill.
Over the Quaternary fluvio-glacial sand deposits are later Weichsel till de-
posits. It has a greater thickness in the eastern part of the model domain
and is absent in the lower parts of the western area. The till has a thickness
of 5 to 30 meters. The till is rich in clay and in many areas drained, sug-
gesting a low permeability.
The model domain is crossed by several buried valleys. The valleys are
cut into the Quaternary sand and Odderup sand formations. In the case
where the buried valley consists of sand it is not possible to distinguish it
from the sand formation around it, but in the area, where the buried val-
ley deposit consists of clay rich materials, they are easy to recognize. These
valleys have been located in several TEM points and in a few wells. The
base of the burried valleys rarely reaches the Arnum clay and the base of
the valleys have been estimated by interpolation between the elevation of
the clay rich base of the valleys and by extrapolating outside the area for
the geophysical prospecting area.
Based on the geological model a dynamic hydrogeological solute transport
model including degradation of the chlorinated solvents has been set up
based on HydroGeoSphere (hydrogeosphere.org/) to simulate the develop-
ment of the landfill plume from 1980 to 2010 and afterwards to model the
development of the plume in a future climate scenario. The fate of the
chlorinated solvents will not be discussed in this chapter, please confer the
paper in the HESS journal.
The model consists of 32 numerical layers. Most layers are located in the
Quaternary and Odderup sand, where the pollution plume from the land-
fill is located. This sand deposit has been subdivided into 28 layers in order
to get a good representation of the contamination in the model. It includes
the top till and the burried valley clay. Two layers are representing the Ar-
num clay and two layers are used for the Bastrup sand making it possible
to calculate transport through the Arnum clay to the lower Bastrup sand.
The model uses a minimum layer thickness of 1 m. The cell size varies
between 10 m in the focus area around the landfill and 100 m in areas
The CLIWAT Handbook 143
far from the landfill. Calibration of the model is based on historical head
observations from wells in the model area.
The model simulation shows how the pollution plume expressed as chlo-
ride has developed downstream from the landfill until now (Fig. E4-7
above) and how the plume is expected to develop in the year 2100 (Fig.
E4-7 below) in an unchanged climate. The plume will continue to expand
through the modelling period and the flow direction will change to a more
northern path in the front of the plume. This change in flow direction is
caused by the creek as it is in contact with the groundwater and therefore
works as a drain throughout the year in the western part of the focus area.
Annual fluctuation in groundwater level controls the flow direction and
thereby also the direction of the plume. The fluctuation in groundwater
recharge introduces a dispersion of the plume.
Fig. E4-7: Horizontal development of the pollution plume expressed as chloride in 2010 (above)
and in 2100 (below) under unchanged climate conditions.

144 The CLIWAT Handbook
Future situation, including maps/figures illustrating the scenario(s)
Hørløkke:Both the A2 and B2 climate scenarios has been implemented in the model
to evaluate the changes in the hydrogeological system in year 2100. No
relevant differences were found between the results of A2 and B2, so only
the A2 results are show.
Fig. E5-1: Groundwater head in the Quarternary fluvial sand and the Odderup
sand shown as contours for top and bottom of the aquifer in 2010 (above)
and for the A2 scenario in 2100 (below). The iso-interval is 10 cm.
The CLIWAT Handbook 145
Fig. E5-1 shows groundwater head for the Quarternary fluvial sand and
the Odderup sand formation. The two contours represents the ground-
water head at the top and bottom of the aquifer. The uppermost figure
shows the sitution for 2010 for normal climate, whereas the (E5.1 buttom
figure) figure shows the situation in 2100 with the A2 climate scenario.
The groundwater head is much higher in the A2 climate scenario (present
time) than in the normal scenario leading to flooding of the areas near
the creek. The higher head also causes a more northern groundwater flow
direction as well as a flow towards the creek which shows that the creek
drains the aquifer throughout the year and in the whole focus area. Where
two curves are seen there is either a downwards flow direction as seen
south and north of the creek, or an upward flow direction as seen in both
figures where the creek has changed into a more northern direction. This
illustrates that the creek also influence the groundwater flow in the deep
part of the aquifer.
Fig. E5-2: Horisontal development of the pollution plume in 2100
in a normal climate (above) and in the A2 scenario (below).

146 The CLIWAT Handbook
As expected the model shows that the increased groundwater recharge in
the A2 scenario will cause a higher groundwater flow through the landfill
which will mobilize more contaminants into the aquifer. Fig. E5-2 shows
the development of the pollution plume in 2100 in a normal an in the A2
scenario. It is seen that the increased groundwater flow and solute trans-
port in scenario A2 did not cause the plume to progress further down-
stream as expected. Instead the front and the centerline of the plume is
fixed under the creek without any expansion. Again this is caused by a
more intensive drainage of the aqufer by the creek.
Challenges and future possible solution – recommendations for adaptation or further investigations
It was shown that the combination of geological/geophysical surveys, geo-
logical modelling and hydrogeological modelling is a powerful tool for the
prediction of climatic change effects on the groundwater conditions. In
Schleswig-Holstein these investigations should be continued at other loca-
tions, e.g. at the lowlands of the Eider-Treene-Sorge region. Of special in-
terest is also the future development of swampy areas, because these areas
are an important storage of CO2. On the northern side of the boarder the
result of the project will enhance the means for administering and protect-
ing fresh water ressources.
The model simulations regarding the Hørløkke landfill have illustrated
that it is necessary to understand the geo-hydrological system to predict
the direction and the expansion of a pollution plume when the climate
is changing. Initially, we had a clear expectation that the pollution plume
from the landfill would expand in a future climate with more precipita-
tion, but model simulations showed, however, that the pollution plume
declines. The reason for this is that the nearby creek works as a drain when
the groundwater table rises and makes contact with the creek. Therefore,
it is not possible with simple assumptions to predict a pollution plume
direction and development. We therefore recommend always to use a hy-
drogeological model to predict the fate of a pollution plume, especially in
changing climatic conditions.
The CLIWAT Handbook 147
Pilot Area F
Egebjerg, Denmark.
Introduction
The Egebjerg area is situated in eastern Jutland, near the city of Horsens.
The model area is approximately 200 km2 and its central part (90 km2) is
the main focus of CLIWAT (see Figure 1). Land use is mainly agriculture
with a few villages. The area supplies Horsens city and other villages with
groundwater from wells located in aquifers 20–140 m below the surface.
The aquifers are located in two or three levels, protected in most places by
thick layers of clay tills/clays. The general geological setting is clay-domi-
Figure 1. Map of the
Egebjerg Pilot Area. Blue
colours identify areas with
groundwater resources
containing particularly
valuable aquifers.

148 The CLIWAT Handbook
nated. Buried valleys dominate the subsurface geology and complicate the
interpretation of groundwater flow and its interaction with surface water.
In general, the groundwater quality is good though there are problems
with naturally occurring arsenic. However, most of the waterworks are
able to deal with the arsenic problem using simple water treatment. Wa-
terworks abstract approximately 3.5 million cubic metres of water every
year in the central Egebjerg area.
Present situation
Preliminary studies indicate a limited groundwater resource and a level
of water abstraction that is just in balance with the amount of abstract-
ed groundwater (3.5 million m3/year). Climate changes are expected to
adversely affect this balance and may affect the potential water supply.
Changes are possibly a decrease in precipitation during the summer pe-
riod and a increase during the winter period. In addition, the waterworks
may well use the entire permissible amount (6.5 million m3/year), which
will almost certainly lead to problems from overexploitation.
Waterworks (administrated by the municipality of Horsens) abstract vital
amounts of groundwater in Egebjerg and supply domestic water to Hors-
ens and nearby villages. The groundwater resources in Egebjerg must be
protected to meet the current and future demands for domestic water.
In this respect, it is vital that the effects of the predicted climate changes
are known. The Egebjerg project and the CLIWAT project in general, will
help to provide a basis on which new ways of managing the groundwater
resources can be made. Table 1 shows the present overall water balance for
the Egebjerg area before the CLIWAT modelling. Illustration no. 2 shows
the data coverage of the area for the present water balance.
What kind of problems have been investigated
The main objectives of the Egebjerg Pilot Area F are to develop a 3-D geo-
logical model, map the spatial distribution of subsurface groundwater bod-
ies, and to evaluate quantitative effects of climate change on groundwater
The CLIWAT Handbook 149
and surface water from simulations generated by an integrated hydrologi-
cal model. The hydrological model has used data from the Intergovern-
mental Panel of Climate Change (IPCC) climate scenario (A1B and to some
extent A2). The results will provide an input (as well as tool) for current
Table 1 Present water balance in Egebjerg Area
Area 66 km2
Net precipitation (from Danish model) 389 mm/year
River discharge (station no. DDH 27.01) -333 mm/year
Recharge 56 mm/year
Abstracted amount (permitted in 2008) -50 mm/year
Outflow (“surplus”) groundwater =6 mm/year
The numbers are compiled of different sources before the modelling in the Cliwat
project and therefore only to be used as an guide to the overall water balance
Figure 2. Recharge (mm/year) calculated from the
national Danish model. Grid size is 1 x 1 km.

150 The CLIWAT Handbook
and future quantitative status assessments of the groundwater resource
in the pilot area. It is hoped that the results and conclusions will be used
in recommendations for the management of the water supply and the
protection of the groundwater resources.
The overall results for model work in Egebjerg
We have determined the local effect of climate change on groundwater re-
sources located in the clay-dominated geological settings in this pilot area.
The Egebjerg area work has resulted in two types of integrated models:
A state-of-the-art 3-D geological model. This model provides highly de-
tailed maps of subsurface groundwater bodies (aquifers). Geophysical
mapping methods were used in the interpretation of the geology, e.g. Sky-
TEM, seismic and MRS. See figure 3 and figure 4 for examples of some of
the results.
A hydrological model with climate scenarios, based on the geological mod-
el. The hydrological model provides climate scenarios (A1B and A2) which
are especially focused on the capture zones, water balances (run-off) and
changes in the general groundwater table (hydraulic head). See figure
The modelling work was carried out in cooperation with the Geological
Survey of Denmark and Greenland (GEUS). In particular, the hydrological
model was modified in relation to the Egebjerg local area and the objec-
tives of the CLIWAT project. The geological modelling software application
is called GeoScene3D (for more details visit www.i-gis.dk), and the inte-
grated hydrological modelling uses the MIKE SHE software application (for
more details visit www.dhigroup.com). The geology was modelled in voxels
(volumetric pixels) in blocks of 5 x 100 x 100 metres.
The CLIWAT Handbook 151
Figure 4. An example of the mapped groundwater bodies (aquifers) at 0–50
m elevation above sea level. The groundwater bodies have been mapped
in voxels (volumetric pixels) of 100 x 100 x 5 m. The result gives a highly
detailed view of a very complex subsurface structure with many individual
reservoirs which to some extent are hydraulically interconnected. The more
reddish the colours are, the thicker the groundwater body is on the map.

152 The CLIWAT Handbook
Future situation – results and conclusions of climate simulations
The results from the climate simulations are based on two IPCC scenarios:
A1B and A2.
Table 2. IPCC scenarios
Present reference scenario
A1B scenario A2 scenario
Present climate refer-ence period for Ege-bjerg is 1991-2010. (abstracted amounts of groundwater is an average of 2000-2004)
Echam/KNMI 2081-2100ref. 1991-2010 (EN-SEMBLES) A1B is a medium-strong climate scenario compared to CO2 and temperature changes. In the data-set, there are however no results for the A2 emissions scenario.
2071-2100 ref. 1961-90Van Roosmalen et al. (Dataset PRUDENCE) A2 is a quite strong climate scenario compared to CO2 and temperature changes.
Part of the difference between A1B and A2 is the differences in reference
periods, where the A1B use the ‘present period’ (~1991-2010), where already
an increase has taken place in precipitation and temperature compared to the
classical reference period used in A2 scenario (1961-1990). Climate modelling
of the A2 scenario compared to A1B scenario resulted in twice as much winter
precipitation, evaporation is also higher in the A2 scenario. These are some of
the main differences between the two scenarios which are versions adapted to the
Danish area. The IPCC scenarios are described in more detail at www.ipcc.ch.
Results
The comparison of present (ref. situation) and future climate (IPCC A1B
and A2 scenarios by the end of this century) gives us the following overall
results in Egebjerg area:
The CLIWAT Handbook 153
There are only a few percentage differences in defining catchments
(capture zones) and groundwater forming areas to well fields (water
works). See example figure no. 5.
Changes in the water table (hydraulic head in the primary upper
aquifers) in a changed climate (A1B) are typically from 0 to 0,5 meter.
However, in some local areas the level may rise by 1-1,5 metres. In
the A2 scenario the results is almost twice as high increase in water
tables: This means 0,5 to 1 metres and locally 2-3 metres. The water ta-
ble may rise up to 2-5 metres in the primary lower water table (deeper
aquifers). These deeper aquifers are often located 20-40 m below the
ground surface, which in this case limits the problem of groundwater
flooding. However, a change of several metres in the groundwater res-
ervoirs may alter the groundwater chemistry and thereby cause water
quality problems. The available groundwater resource has relatively
increased. The rise in the surface near aquifers is limited by drains
and is bypassed into the rivers and thereby increasing the runoff. See
figures 6,7 and 8.
Maximum river runoff as predicted in A1B scenario increases slightly but significant, while the minimum runoff is largely unchanged. The duration of minimum run-off will be extended into the autumn period. See table 3.
Maximum river runoff as predicted in A2 scenario increases and is very notably, while the minimum runoff is reduced moderately. The dura-tion of minimum run-off will be extended into the autumn period. See figure 9 and table 3.
The overall water balance at the end of 2100, result in a minor surplus (few percentages) of groundwater formation in the primary upper and lower groundwater reservoirs. The main net effect of more precipita-tion in clayey geological settings is more run-off in the rivers, espe-cially caused by the relatively extensive drainage of agricultural areas. Scenario A1B and A2 are listed below for more comparison.

154 The CLIWAT Handbook
Subject A1B scenario impact
A2 scenario impact Comments
Upper aquifers groundwater table
Rise in water table is 0 – 0,5 meter in general but rise locally up to 2 meters.
In areas where today’s high ground water table (0-1 m below surface) will increase groundwater recharge will be drained into drains and water-courses.
Rise in water table is 0,5 – 1,0 meter in general but rise locally up to 3 meters.
In areas where today’s high ground water table (0-1 m below surface) will increase groundwater recharge will be drained into drains and water-courses.
The significantly changing groundwater levels (at 1 meter or more) of the ground-water bodies near the surface (and in the unsaturated zone) in a future climate could lead to altered leach-ing and pollution loads from point and diffuse sources. The need for drainage or maintain of drainage could be comprehensive
Deeper aquifers groundwater table
Areas with a certain depth to the up-permost groundwater table (depth> a couple of meters) will experi-ence some changes in groundwater level corresponding to overall increases of 0 - 0,5 meter locally 2-3 meters.
Areas with a certain depth to the up-permost groundwa-ter table (depth> a couple of meters) will experience significant changes. The deeper aquifers experience the highest impact with an overall increase of 0,5 – 1.0 meters up to 3 – 5 meters locally.
Changes in ground-water levels may require more effective drainage in areas where there currently is not drained. It is the model assumed that there are drains everywhere, and that therefore the land will be drained likewise in the future climate.Direct effects of cli-mate change will lead to increased pressure level in the deeper aq-uifers. This will have a positive effect on the possibility of water extraction from these deeper aquifers.
Run-off periodSep.- Nov.
Reduction in runoff of magnitude of 0 to 2% which is practically no change at all.
Reduction in runoff of magnitude 5 to 25%
There will be a risk of drying up of rivers and wetlands as the runoff is reduced in late summer and autumn months.
The CLIWAT Handbook 155
Subject A1B scenario impact
A2 scenario impact Comments
Run-off periodJan.-Mar.
Maximum water flow will increase. For Ll. Hansted river basin (St. 27.1). Winter runoff increas-es at an average of 7-22%, and increases in maximum runoff in the same magnitude
Maximum water flow will increase. For Ll. Hansted river basin (St. 27.1). Winter runoff increas-es at an average of 30-45%, and increases in maximum runoff in the same magnitude.
This is a significant challenge to keep the increased amounts of water and suspended materials in the hin-terland during winter and early spring as climate change will not compromise such a risk of flooding downstream, e.g. in Horsens city or sub-stance flow to Horsens Fjord.
Capture zones to well fields
There is almost no change (<2%) I the area when compared to reference situation
There is almost no change (<2%) I the area when compared to reference situation and A1B scenario
The changes in captures zones due to climate changes are marginal – Changes in abstraction during the year (e.g. pump strat-egy, new wells) has a relatively greater im-pact than the induced climate changes.
Groundwa-ter forming areas to well fields
There is almost no change (<2%) I the area. The relative formation of ground-water is however a bit higher than A2 scenario
There is almost no change (<2%) I the area when compared to reference situation and A1B scenario.
See the comments above
Water bal-ance (aver-age year)
Minor – moderate sur-plus of groundwater formation and minor surplus in run-off
Minor - moderate sur-plus of groundwater formation and minor -moderate surplus in run-off
The overall conclusion is that the increased precipitation leads to more available groundwater. However in a clayey area the run off is increasing which may cause problems for the rivers (erosion e.g.). Extreme events like late sum-mer droughts and severe rain showers are predicted to cause some water stress.

156 The CLIWAT Handbook
Figure 5. Map is showing capture zone and groundwater forming
zone compared with the reference situation for A1B scenario for one
medium size well field (water work Gedved north of Horsens).
Figure 6. Map is showing average depth (under terrain) to ground
water table for the reference situation (1991-2010)
The CLIWAT Handbook 157
Figure 7. Map is showing the changes in depth of ground water
table. Reference situation compared with A1B scenario
Figure 8. Map is showing the changes in depth of ground water
table. Reference situation compared with A2 scenario

158 The CLIWAT Handbook
Figure 9. Diagram is showing the simulated changes in streamflow
(run off) during a year for the A2 scenario. Changes for winter
period and late summer/autumn period are quite significant.
The main results of the study shows that in an area like Egebjerg, which
is characterised by deep buried valleys and a clay-dominated geological
setting, the groundwater systems are not affected dramatically by climate
changes. Note however that:
The CLIWAT Handbook 159
Slightly more groundwater is to be formed and thereby more ground-water is potentially available for abstraction in a future climate due to the (in general) increased groundwater levels for deeper aquifers
As the climate behaves more extremely with droughts occurring more frequently, the local groundwater resources may be challenged during the summertime and/or autumn period. The availability of water at the near-surface aquifers may be limited and thereby more vulnerable due to abstraction
A significantly increase in run off during the winter period is likely to cause flooding and/or increased erosion in the rivers/streams. Sus-pended material and leaching of harmful substances might increase as well.
The overall increase in hydraulic head for the surface near aquifers may
challenge the land use. Drainage systems are challenged in terms of need
for more drainage if land use at the same type is to be maintained (agri-
culture).
Climate change in an area like Egebjerg is likely to result in altered drainage
or water abstraction requirements due to the overall increase in precipita-
tion and more extreme changes in river runoff (floods versus droughts).
Protection measures against river flooding and river droughts should be
devised.
Inspiration for the Egebjerg modelling
Using a distributed hydrological simulation model, van Roosmalen et al.
(2007) conducted a study of the projected regional climate change impact
on groundwater recharge, storage and discharge to streams in Denmark.
Increases in precipitation, temperature, and potential evapotranspiration
were predicted in each of the two 30-year climate scenarios (IPCC A2 and
B2). Groundwater recharge and resulting subsurface storage and discharge
were predicted to increase in sandy soils, while only small changes were
predicted in clayey sediments and soils. Climate change effects on ground-
water recharge and discharge to streams were found to vary seasonally.
Potential effects of climate change on water availability were also predicted
to vary seasonally. The geological factors are evaluated as being vital for
the results of the modelling. The results and methods of van Roosmalen et

160 The CLIWAT Handbook
al. (2007) where used as a “pathfinder” for the investigations and modelling
work done in Egebjerg. The Egebjerg area represents a local scale (clayey
sediments) and compared with the outcome of the Roosmalen study (re-
gional scale), the overall results were the same. Climate change studies
on the different main geological settings at varous geographical scales is
recommended to be carried out.
Perspectives
The National Groundwater mapping project and other national databases
means that there is a lot of groundwater and geophysical data that is read-
ily available in Denmark. On the basis of the existing data and models, it
is possible to illustrate the effects of climate change on a national scale but
not on a local scale. Groundwater models that can predict local changes
need to be developed. The avaliability of local data and data coverage is
therefore vital for the models. There is however a need for more hydro-
logical as well as geological data for climate modelling on a local scale in
order to minimise the uncertainties and to achieve more specific results.
This is especially required for the uppermost 5-10 meter where there is a
lack of good quality data needed for development of improved conceptual
and numerical models of interacting surface water and groundwater flow
systems.
Adaptation strategies based on national or local models may be quite dif-
ferent. Local factors more or less directly impact the adaptation strategy,
e.g. in the case of waterworks. The work and conclusions of Pilot Area
Egebjerg F increase our knowledge on a local scale, especially in clay-dom-
inated sediments. The same kind of modelling should be done in other
geological settings, so that variability can be compared and evaluated.
The CLIWAT Handbook 161
References:Rasmus Rønde Møller & Flemming Jørgensen.
3D geologisk model for Egebjerg. GEUS rapport 2011/37.van Roosmalen, L., B.S.B. Christensen, and T.O. Sonnenborg (2007), Regional differences in climate change impacts on groundwater and stream discharge
in Denmark, Vadose Zone Journal, 6, 554-571, doi:10.2136/vzj2006.0093.
Hans Jørgen Henriksen & Lars Troldborg. 3D hydrologisk strømningsmodel for Egebjerg området. Kvantificering af grundvandsressourcen og afgrænsning af indvindingsoplande ved nuværende og fremtidigt klima. GEUS rapport 2011/101
Hans Jørgen Henriksen & Lars Troldborg. 3D hydrologisk strømningsmodel for Egebjerg området. Beskrivelse og uddybning af A2 klima scenariet med henblik på CLIWAT projektet. GEUS rapport 2011/126
www.klimatilpasning.dk
http://www.naturstyrelsen.dk/Vandet/Klima/
http://www.dmi.dk/dmi/index/klima.htm

162 The CLIWAT Handbook
Pilot Area F
Horsens Town (DK)
Introduction
The current subsurface groundwater conditions in Horsens have been in-
vestigated as well as the potential effects that changing climate will have
on the quantity and quality of groundwater in the future and what meas-
ures need to be taken.
The study area focuses on Horsens town, which is located in the inner
part of the Horsens Fjord. The fjord is a shallow and eutrophic estuary
located on the east side of Jutland, Denmark within the European Water
Framework Directive catchment area Horsens Fjord. The surface area of
the Fjord is approximately 46 km2, the mean depth is 2.9 m and it has a
narrow shipping channel whose depth varies between 7 and 22 m. The
Horsens Fjord catchment area is 517 km2 and it is dominated by agricul-
ture (75%). The remaining 25% is covered by forests, wetlands, lakes and
urban areas. The catchment area is drained by two main rivers; the River
Bygholm å and the River Hansted, located in the inner part of the fjord.
Both rivers flow through the town. Several smaller streams are located on
the north coast and south coast of the estuary. The wastewater treatment
plant for Horsens town is located close to the mouth of the River Bygholm.
The near-surface sediments in the low-lying parts of Horsens town are
dominated by post-glacial, finely-grained sediments, such as gytja, silts
and clays with a high content of organic matter. Coarser materials such
as sands are interbedded within the fine-grained sediments. The aquifers
are located in these coarse grained materials and in man-made backfill
which is the result of land expansion, road and pipe installations. On the
elevated areas, the uppermost geology is dominated by glacial tills and
diluvian sands.
The CLIWAT Handbook 163
The old part of the town is located in a low-lying area between 0 and 2 m
above sea level. The groundwater level of these aquifers is situated near
the surface. The location of the town leaves it exposed to the changing
water cycle caused by climate change.
Most recently, in November 2006, there was a flood of port riparian areas,
including the Town Hall parking lot. The flooding was caused by a storm
surge that pushed sea water from the North Sea into Kattegat and further
into Horsens Fjord.
A changing climate and more frequent floods entering the town raise sev-
eral issues:
What is the interaction between the fjord, river and the shallow ground-
water in the city?
What is the quality of this water when it is returned?
Aims of the study:
Examine the quality of groundwater below Horsens and analyse how
a changing climate will affect quality and whether there is a need for
additional water management of domestic and wastewater systems
Quantify and visualise the effects on the surface groundwater and
analyse possible changing patterns in a future climate
Present situation
The near-surface aquifers in Horsens are a result of their low-lying loca-
tion situated close to the terrain. The dominant parts of the aquifers are
unconfined and low-yielding. The dominant flow direction is west-to-east;
towards the fjord. The tidal influence in the inner fjord is around 0.6 m.
During the storm of 2006, the sea level in Horsens Fjord was registered
as high as 1.76 m above normal. The increased level caused flooding of
the low-lying harbour areas, including the town hall parking lot located
around 700 m from the harbour. Locals reported that the parking lot was
under approx. 40 cm of water. Streets and buildings where seriously af-
fected by the rising sea level during the storm and in the days and weeks

164 The CLIWAT Handbook
to follow. The town hall used sand bags as protection against the flooding.
Similar extreme events are forecast to happen more frequently. When the
flood water needs to be drained away, its quality is of importance to the
surrounding ecosystem.
An analysis of historical and contemporary maps has been carried out to
increase the knowledge of town areas that are built on backfill. The map
below (Figure 1) shows the extension of the area covered by sea in 1876
(Blue filled area).
The extension is based on a historical map of the Horsens area. The map
shows that around 2.5 km2 of the harbour near town areas are built on
areas previously covered by the sea. This includes a southern landfill cover-
ing 0.5 km2. The blue line is the 2.5 m elevation curve showing the outline
Figure 1: Map showing 2.5 m curve based on the present topographic elevation
curves. The blue-coloured area is the area covered by the sea in 1876
The CLIWAT Handbook 165
of the preliminary area at risk of flooding in the future. This is based on
a future sea level and an expected groundwater level increase around 0.75 m
and a major storm like the one in 2006, where the sea level was 1.76 m
above normal.
What kind of problems/issues has been investigated?
To get a better understanding of the general quality of the near-surface
water in the town, a number of drillings have been made. The drillings
were shallow and the groundwater samples were taken from the upper-
most aquifer, which was identified during the drilling. Sample depth varied
from 1.5 to 8 m below surface.
The map below (figure 2) illustrates the location of the CLIWAT drillings
Figure 2: CLIWAT drillings and surface water
sampling sites in the Horsens area

166 The CLIWAT Handbook
The water from the samples has been analysed for 80 potential contami-
nants and the preliminary conclusion is that the water is characterised
as being influenced by human activities. The analysis showed evidence of
contamination caused by point sources (industrial sites, landfills etc), but
also activities referring to the sewers and roads.
Outcome/Results
HydrologySeveral wells, especially those close to the port, have shown a good hy-
draulic contact between the seawater and the groundwater. This is demon-
strated by logging the water levels in wells over a longer period.
The curves showed clear tidal influence. Some of the head measures in
the wells showed clear tidal influence especially B6, B7, C7021, C7024 and
B8 have a clear response to the sea level, while the others only respond
directly to actual precipitation.
During the logging period of around five months, there have been regis-
tered a change between 20 cm and 1.49 m in the wells. The change in head
varies over short distances and wells situated a distance of 400 m away
can be very differently affected by tidal changes. The tidal amplitude is
around 0,6 meters in the Horsens fjord. The study indicated that a former
extension of a stream in the city has a great influence on the contact to
the fjord. The groundwater levels in a well situated 800 m from the port
showed clear tidal influence, while wells closer to the port showed no affect
from the tidal change.
On the current basis, we have a reason to believe that the contact between
inlet and groundwater may be due to the River Bygholm’s former loca-
tion. This means that present and former anthropogenic made sub surface
structures have a strong impact on the groundwater levels and the ground-
water flow in the town.
In the graph below (Figure 3) is an illustration of what will happen if the
sea water level increases by 75 cm and there is a connection between the
The CLIWAT Handbook 167
fjord and the groundwater aquifer. The result is a groundwater level above
surface. The result will be an increased need for drainage and the impor-rr
tant question in this context is the quality of the water.
Figure 3: Groundwater levels in the present and future climate.
Blue graph is present level and yellow is estimated future level
including a ground water/sea level rice of 75 cm.
ChemistryTo get a better understanding of the general quality of the near-surface
water in the town, a number of water samples were collected from ditches
(2), drillings (16) and the Fjord (1). Most of the drillings are made for the
CLIWAT project but the investigation also includes a few existing wells that
are used to monitor landfills. The CLIWAT wells are shallow; the screens
for ground water extraction are set in the uppermost aquifer, which was
identified during the drilling. The depth of the screen varies from 0.2 to 8
m below terrain.
Water samples from the wells, ditches and fjord has been analysed for
80 potential contaminants, salts and wastewater parameters. The conclu-
sion is that the water is characterised as being influenced by human ac-
tivities. Many different kinds of substances were identified in the samples,

168 The CLIWAT Handbook
e.g. chlorinated solvents, tar substances, pesticides and caffeine. The sub-
stances behave differently in the environment; as some are absorbed and
become fixed in the soil matrix, while others are more mobile and thus
easily spread to the surrounding environment.
The source of pollution varies. In some areas the pollution was assumed
to derive from the sewage system, while other sources are derived from
the roads and a few have a point of origin in industrial sites. The analy-
sis showed evidence of contamination caused by point sources (industrial
sites, landfills etc), but also activities related to the sewers (caffeine) and
roads. Especially the water in the two ditches is heavily contaminated and
clearly influenced by wastewater, the wastewater probably origins from
sewage overflow.
Future situation, including illustrative maps/figures
A groundwater model with a discretization of 50 x 50 m has been set up
in the area. The results from the model indicate changes in groundwater
levels in Horsens town of up to 0.50 m with an A2 scenario. The results
from the model is illustrated in figure 4
This means that on top of the sea level change planners in Horsens city
have to prepare for raising groundwater in the future.
In addition, the increased groundwater level is expected to lead to an in-
crease in the amount of contaminant being washed out from former in-
dustrial sites because of an increase in water passing by such sites.
In the future the uppermost groundwater and the ditchwater can be ex-
pected to be more influenced by contamination due to sewage overflow
and increased pressure on the sewage system which leads to a higher
amount of sewage water leaching into the aquifers.
On Figure 5 contaminants in the aquatic environment and their sources of
pollution is illustrated. Pollutants from the land use e.g. former or present
industry, gardens etc. are contaminating the surface near soil and ground-
The CLIWAT Handbook 169
Figure 4: Change in mean groundwater level for the Horsens
Catchment when the climate is changed from the present to A2-
conditions. The model does not include sea level change.
Openwater
Polluted site
NitrateHeavy metalsTar and oil pollutantsPesticidesChloride
BODCODCaffeineNitrateMedicine residuesHeavy metalsOil and tar products
Surface contamination
Groundwater aquifer
Clays
Postglacial sediments
Sewage pipe Chlorinated solvents
Heavy metalsTar and oil pollutantsPesticidesChloride
Figure 5: Simplified diagram of the hydrogeology and water quality in Horsens

170 The CLIWAT Handbook
water. Further this is distributed to the open ditch and fjord. In addition
contaminants from the leaking sewage systems are percolating towards the
aquatic environment and receiving eco systems.
Challenges and future solution – recommendations for adaptation or further investigations
The investigations have shown clear evidence of the linkage between sur-
face water, sea water and groundwater in a Danish coastal town. Further
the study also shows that antropogenic sub surface structures affects the
flow and creates hydraulic connection between structures in the under-
ground.
The change in groundwater levels in the town will increase the need for
drainage. This means that open water channels, ditches or underground
drainage systems will need to be established to prevent flooding.
This study shows that the quality of the water and the sources of con-
tamination varies. This means that if water managers are to lower the
groundwater table in the town, we have to be aware of the quality of the
water. This can be done by monitoring the quality of the drained water
and by distributing some water to treatment plants where the xenobiot-
ics and other environmentally-hazardous compounds can be cleaned and
thus prevent from affecting the estuary and receiving eco systems.
The authorities dealing with adaptation to climate change should have
a strong attention to the linkages in the hydrological cycle and include
all the components when planning and preparing for future development
and restoring existing infrastructure.
The survey underlines that geological and hydrological sub surface charac-
terizations can be a strong tool for understanding the linkage between sur-
face and groundwater systems. And further the importance of a well char-
acterized subsurface and a better understanding of the subsurface when
dealing with climate change. This means that equivalent studies should be
undertaken in other low laying cities with in the North Sea region to im-
The CLIWAT Handbook 171
prove the understanding of the entire hydrological cycle and make a more
resilient planning in the future.
Leaking sewage systems affect the groundwater quality. In a future climate;
heavy rainfall is predicted to increase the amount of water flowing into the
sewage system. This scenario calls for separated storm water drains and
wastewater pipe systems.
The study is described in detail in:
Region Midtjylland 2011:
Undersøgelser af grundvandets kvantitet og kvalitet i Horsens by.

172 The CLIWAT Handbook
Pilot area G
Aarhus River (DK)
Introduction
The Aarhus River pilot area is located in eastern Jutland, near the city of
Aarhus (see figure 1 and figure 2). It is an old landfill site situated in the
flat meadows along Aarhus river. Waste was dumped here up until early
Figure 1 Aerial view of the area facing east. Landfill-areas are marked with red.
The CLIWAT Handbook 173
1980ties without any kind of membrane, leachate capture or isolation sys-
tem. The leachate from the landfills pose a treat to the aquatic system of
the river and Aarhus bay and the groundwater resource below which is
used as the main drinking water resource for the town of Aarhus. The area
is now used for recreational activities and allotment gardens. The water
level in the river occasionally rises to flood parts of the landfill area during
heavy rainfall events or when a storm pushes water up the river from the
bay.
The primary focus for this pilot area is to understand the effects of climate
change on the hydraulic system and how it will affect the flow of contami-
nants from the landfills.
Geologically the area consists of a buried pre-quaternary valley, filled with
quaternary sediments of alluvial sand, gravel and clay-till. The deeper
sand-layers are used as the main drinking water resource for the town of
Aarhus.
Figure 2 Map showing the pilot area.

174 The CLIWAT Handbook
Present situation
The nearest drinking water abstraction well is situated less than 1,5 km
from the landfill sites (see figure 2).
Water is pumped from sandy aquifers between 80 and 100 meter below
the surface. It is not entirely clear to what extend these deeper aquifers are
in hydraulic contact with the upper aquifers under the landfill sites.
The waterwork pump approximately 2.1 million m3 per year with a maxi-
mum permit of 3.7 million m3.
The landfills are uncontrolled landfill sites. Municipal-, construction- and
industrial waste was dumped in the soft meadows by the Aarhus river. The
river flow was even moved further north several times to allow more space
for the dump deposits. After landfilling was stopped in the early 1980ties
the landfill was covered with a thin topsoil cover.
The landfills have been monitored for many years, and a remediation sys-
tem is pumping contaminated groundwater and drainage water, to prevent
contaminants from entering the surrounding environment and seeping
into the deeper groundwater resource. During high water level in the river,
the drainage pumping system has to be stopped to prevent pumping river
water. At present high water level is predominantly occurring during win-
ter following heavy rainfall or melting snow in the upland. Occasionally a
storm surge pushes water from the bay up the river increasing water level.
This occurs currently quite rare once or twice every 5 to 10 years.
Methane gas has been detected at the landfill site. Methane gas is a strong
greenhouse gas about 25 times more potent than CO 2. Reducing or captur-
ing methane gas from the landfill would reduce the climate impact of the
landfills.
What kind of problems/issues has been investigated?
In the Cliwat project a lot of field work has been carried out in the pilot
area. The primary objective has been to gain more knowledge of the geol-
The CLIWAT Handbook 175
ogy, the hydraulic system and the water quality. In addition it has been an
objective to develop new investigation techniques and to learn how to take
advantage of the diversity of the data collected.
The field work includes the following:
Well logging using special well-logging equipment and age-dating of
water samples
A pumping test.
To better understand the hydraulic connections between the upper
aquifer and the deeper aquifers used for drinking water purposes,
a pumping test was carried out in a deep well on the site.
3D Landfill and plume mapping using IP geophysical methods.
El-log drilling
To investigate geo-electrical properties of the subsurface as input
for the IP surveys.
A temporary shut down of the remediation system.
To investigate how increased groundwater level affects the hydrau-
lic system around the landfill. This involved measuring the water
table and leachate using loggers and water sampling.
Investigation of river-landfill flow using water table data-loggers in
new boreholes close to river, flow of water to from the landfill was
monitored.
Quantification of methane flux using mobile extractive FTIR technique.
This method is based on emission of tracer-gas in combination with
measurements of emission- and tracer-gas concentrations in the
downward wind plume.
Based on the finding from the field work and previous studies a 3-D hydro-
geological model was developed to map the geology and hydraulic connec-
tions of the subsurface.
The hydro geological model consist of 7 layers, where the lower four con-
sist of two sandy aquifers and two aquitards of glacial clay and till. Above
these two layers are post glacial sediments related to the valley; peat and
marine sand. The uppermost layer is the urban fill and includes the waste
deposit (see figure 3).

176 The CLIWAT Handbook
Finally a model of the hydraulic system was set up using a finite element
model called HydroGeoSphere. This model system is able to fully integrate
all the hydraulic systems. By running the model using different scenarios
it has been possible to test how the climate change effect might change the
hydraulic flow and the leaching of contaminants from the landfills. Several
scenarios including changes in groundwater abstraction at water work and
changes in the remediation system has also been examined.
The model boundaries are natural fixed head or no flow. Climate data and
water abstraction from 1980 to 2010 has been implemented in the model.
The model is calibrated and validated against groundwater heads and river
flow. Focus on the calibration has been the waste deposit area.
Figure 3 West-East profile through Stautrup well field and
Eskelund deposit showing major hydrogeological units.
Figure 4 Left: Model mesh with smaller triangles in the focus area at the
waste deposit. Red area is landfill, green is water work well fields and blue is
lake and river. Right: 3D hydrogeology in model (looking north-west).
The CLIWAT Handbook 177
What are the outcome/results?
The following are the main outcomes from the pilot area.
Results from the pumping test and the investigation of water table and
ground water age has been inconclusive on the extend to which the landfill
is in contact with the deeper groundwater. However the results do show
that if a connection exists it is not very strong. The pumping test also
showed that there is only a very small leakage from the river.
The shutdown of the remediation system resulted in clearly increased wa-
ter table and surface runoff of iron rich leachate. However due to the
relatively short shutdown period it has not been able to see any significant
effects on groundwater quality.
Methane investigations identified several hotspots where methane was
seeping out from the surface area and ponds. The innovative flux meas-
urements were also able to give a good estimate on the total flux of meth-
ane from the entire area.
The results are now being used further in another project attempting to
reduce methane emissions using compost heaps.
Landfill mapping using IP measurements was able to clearly identify the
landfilled area. The figure below show an example of a map from the IP
measurments. The area with high chargeability correspond well with the
landfilled area. It also indicated possible landfilling or a leachate plume
south of the currently identified landfill area. This has lead to further in-
vestigations of the landfill boundary.
The hydrological model has been used to evaluate different objectives.
First a model on a short timescale has been evaluated to simulate the
mobilization of contamination in a situation with high sea level and wet
conditions. Four different scenarios have been tested for the situation with
and without active remediation at the waste deposit site; a) normal condi-
tions without a flood situation, b) a situation simulating a flooding situa-
tion in 2006 where the sea level rose to +1.7 m, c) a situation simulate to

178 The CLIWAT Handbook
Figure 5 Map of IP measurements overlaying aerial map from 1993.
b) but in the future where sea level is an additional +0.75 m, and finally d)
a situation as c) but with very wet conditions from rainfall and high river
discharge.
The results from these scenarios show a complex interaction between river
flow and transport from the waste deposit to the river. With the high water
level in scenario c, the river reverses its flow and the same water volume
Figure 6 The cumulative transport in the two flood situations with and without
active remediation.
The higher the water level is, the more total mass is released, and is around
30-40 % higher, independent on the scenario. The hydraulic properties of
the waste deposit are assumed homogeneously throughout the whole waste
deposit and therefore there are some uncertainties to the absolute values of
the model results. The increase in the total mass release in the active drain
situation may relate to the situation where there is a general higher circulation
of water through the contaminated zone, thereby mobilizing more salts.
The CLIWAT Handbook 179
then passes the waste deposit several times. On each passage, contami-
nants enter the water. The raise and fall in river level causes an increase
in the transport of contaminants from waste deposit to the river, and the
model predicts that there is an increase in the mobilization of contami-
nants ion the situation where the drainage system is active. The active
drain actually increases the total transport with 10-20 %.
In the second objectives, the model is used to examine the future extend
of the contamination below the waste deposit under different climate sce-
narios as well as drainage systems and water abstraction from the nearby
water works.
Future situation, including maps/figures illustrating the scenario(s)
The transport model has been simulating the contamination expan-
sion from year 1980 to year 2100 using three different climate scenarios,
present day, A2 and B2. The present day [1980-2009] precipitation, eva-
potranspiration and temperature have been extrapolated to future condi-
Figure 7 Three dimensional view of the waste deposit and contaminated
ground water (to the left) and the water work well field (to the right)

180 The CLIWAT Handbook
tions using a monthly delta transfer function. The present day situation
has an average groundwater recharge of 248 mm / year. Scenario A2 has
an average groundwater recharge of 295 mm / year and scenario B2 has
363 mm / year.
The results from these scenarios show that there is in practical no difference
between the total volume of contamination released in the different cli-
mate scenarios. There is a slightly larger cumulative transport of contami-
nation in the situation where the abstraction from at the water work is
increased. The simulation also shows that the plume reaches a certain
volume and overall appears to stop expanding, but following a rhythm of
annual and decadal dry and wet periods.
The reason for the small climatic effect lies in the hydrogeological system
and the location in the river valley. The contamination of the aquifer sys-
tem below the waste deposit is confined by the regional flow system. The
large catchment makes the river valley a natural drainage system. Water
is pushed through the system from the high located areas through the
lower aquifer and below the river at zones with high contact, water enters
the river. This mechanism fixates the contamination. An increase in the
precipitation may increase the flow but not the total mass of contaminants
in the aquifer.
Figure 8 Conceptual understanding of the regional
flow system confining the contamination.
The CLIWAT Handbook 181
Model results show that an increase in the water abstraction did not in-
crease the total mass below the aquifer, - but a tendency for the contami-
nation plume to be located closer to the Stautrup well field. The tipping
point of where there is a direct inflow of contaminants to the well field is
at present time unknown and relies on further investigations due to un-
certainties of the hydrogeological parameters.
Challenges and future possible solution – recommendations for adaptation or further investigations
Integrating information from the different field work results proved very
beneficial for understanding the system. The investigations also highlight-
ed the importance of good quality data and the importance of long term
monitoring data. This is vital for setting up a representative geological and
hydrogeological model.
The flooding scenarios showed that an increase in the river head would
flood the lower parts of the waste deposit and contaminants would enter
the river. The higher water level, the more total mass would be released. In
the future, a weir at the harbour end of the river will be build, preventing
flooding of the inner city. This weir will prevent extreme water flooding
and thereby prevent release of contaminant due to flooding from the sea.
Flooding from the river side may still occur and here investigation of the
efficieny of the remediation system should be evaluated as the model re-
sults show that the remediation causes a greater flux through the system.
The model results show that there is only little – if any – climate effect on
the contamination. This is a consequence of the location of the waste de-
posit in the river valley, where the contamination is confined by a regional
groundwater flow system.
The biggest threat in the system lies in the future water demand from
the well field. The model did not show any direct contamination of the
water supply abstraction wells, but showed that the contamination moved

182 The CLIWAT Handbook
towards the abstraction wells when abstraction rate was increased. Further
investigation are required here . This includes:
Model uncertainty analysis to investigate the tipping point, where
contamination enters the abstraction wells
Recommendation to implement an active warning system between
waste deposit and well field.
Evaluation of the remediation system on a long term.
The investigations at this pilot area did not show any significant climate
change effect under the used climate change scenarios. However this does
not imply that the same result would be the same for other similar landfill
sites. It all depends on the local conditions; geology, topography, hydrology
etc.
The key component is how often the landfill will get flooded and the hy-
draulic conductivity of the land filling. Sites that are very low lying will nat-
urally be most vulnerable to climate change effects, but a limited top cover
and a land fill volume with good hydraulic conductivity plays a major role.
The CLIWAT Handbook 183

184 The CLIWAT Handbook