groundwater recharge and flow investigations in the ... · of unpurged (c) to purged (co) 222rn...
TRANSCRIPT

DWLBC REPORT
Groundwater recharge
and flow investigations in
the Western Mount Lofty
Ranges, South Australia
2007/29

Groundwater recharge and flow investigations in the Western Mount Lofty Ranges, South Australia
Graham Green, Eddie Banks, Tania Wilson and Andrew Love
Knowledge and Information Division Department of Water, Land and Biodiversity Conservation
September 2007
Report DWLBC 2007/29

Knowledge and Information Division Department of Water, Land and Biodiversity Conservation 25 Grenfell Street, Adelaide GPO Box 2834, Adelaide SA 5001 Telephone National (08) 8463 6946 International +61 8 8463 6946 Fax National (08) 8463 6999 International +61 8 8463 6999 Website www.dwlbc.sa.gov.au Disclaimer The Department of Water, Land and Biodiversity Conservation and its employees do not warrant or make any representation regarding the use, or results of the use, of the information contained herein as regards to its correctness, accuracy, reliability, currency or otherwise. The Department of Water, Land and Biodiversity Conservation and its employees expressly disclaims all liability or responsibility to any person using the information or advice. Information contained in this document is correct at the time of writing. © Government of South Australia, through the Department of Water, Land and Biodiversity Conservation 2007 This work is Copyright. Apart from any use permitted under the Copyright Act 1968 (Cwlth), no part may be reproduced by any process without prior written permission obtained from the Department of Water, Land and Biodiversity Conservation. Requests and enquiries concerning reproduction and rights should be directed to the Chief Executive, Department of Water, Land and Biodiversity Conservation, GPO Box 2834, Adelaide SA 5001. ISBN 978-1-921218-77-4 Preferred way to cite this publication Green, G, Banks, E, Wilson, T & Love, A 2007, Groundwater recharge and flow investigations in the Western Mount Lofty Ranges, South Australia, DWLBC Report 2007/29, Government of South Australia, through Department of Water, Land and Biodiversity Conservation, Adelaide.

Report DWLBC 2007/29 Groundwater recharge and flow investigations in the Western Mount Lofty Ranges, South Australia
iii
FOREWORD
South Australia’s unique and precious natural resources are fundamental to the economic and social wellbeing of the State. It is critical that these resources are managed in a sustainable manner to safeguard them both for current users and for future generations.
The Department of Water, Land and Biodiversity Conservation (DWLBC) strives to ensure that our natural resources are managed so that they are available for all users, including the environment.
In order for us to best manage these natural resources it is imperative that we have a sound knowledge of their condition and how they are likely to respond to management changes. DWLBC scientific and technical staff continues to improve this knowledge through undertaking investigations, technical reviews and resource modelling.
Rob Freeman CHIEF EXECUTIVE DEPARTMENT OF WATER, LAND AND BIODIVERSITY CONSERVATION

Report DWLBC 2007/29 Groundwater recharge and flow investigations in the Western Mount Lofty Ranges, South Australia
iv

Report DWLBC 2007/29 Groundwater recharge and flow investigations in the Western Mount Lofty Ranges, South Australia
v
CONTENTS
FOREWORD........................................................................................................................... iii
EXECUTIVE SUMMARY .........................................................................................................1
1. INTRODUCTION...............................................................................................................3
2. WMLR CATCHMENTS .....................................................................................................5 2.1 CLIMATE....................................................................................................................5 2.2 GEOLOGY .................................................................................................................5 2.3 HYDROGEOLOGY ....................................................................................................8
3. DRILLING PROGRAM......................................................................................................9 3.1 SITE SELECTION ......................................................................................................9
3.1.1 River Torrens Catchment.......................................................................................9 3.1.2 Onkaparinga River Catchment ............................................................................10
3.2 DRILLING.................................................................................................................10 3.3 WELL SONDING AND GEOPHYSICAL LOGGING.................................................11
4. RECHARGE ESTIMATION TECHNIQUES ....................................................................13 4.1 INTRODUCTION......................................................................................................13 4.2 PIEZOMETER INSTALLATION................................................................................13 4.3 GROUNDWATER AGES AND DEPTH OF CIRCULATION ....................................13
4.3.1 Major chemistry and isotopes ..............................................................................13 4.3.2 Carbon-14 and chlorofluorocarbons ....................................................................14
4.4 VERTICAL FLOW RATES AND AQUIFER RECHARGE.........................................15 4.4.1 Carbon-14 and chlorofluorocarbons ....................................................................15 4.4.2 Aquifer pump tests...............................................................................................16 4.4.3 Chloride mass balance ........................................................................................17
4.5 HORIZONTAL FLOW VELOCITIES FROM RADON ACTIVITY..............................17
5. FIELD INVESTIGATIONS...............................................................................................19 5.1 FORRESTON INVESTIGATION SITE .....................................................................19
5.1.1 Fracture analysis .................................................................................................19 5.1.2 Electrical conductivity, temperature and PH in open wells ..................................19 5.1.3 Geophysical and EM Flowmeter surveys in open wells.......................................21 5.1.4 Hydraulics ............................................................................................................22 5.1.5 Aquifer pump tests...............................................................................................23
5.2 FOX CREEK INVESTIGATION SITE.......................................................................24 5.2.1 Fracture analysis .................................................................................................24 5.2.2 EC, temperature and PH in open wells................................................................25 5.2.3 Geophysical and EM flowmeter surveys in open wells ........................................26 5.2.4 Hydraulics ............................................................................................................28 5.2.4 Aquifer pumping tests ..........................................................................................28

CONTENTS
Report DWLBC 2007/29 Groundwater recharge and flow investigations in the Western Mount Lofty Ranges, South Australia
vi
5.3 MYLOR INVESTIGATION SITE...............................................................................28 5.3.1 Fracture analysis .................................................................................................30 5.3.2 EC, temperature and ph in open wells.................................................................32 5.3.3 Geophysical and EM Flowmeter Surveys in Open Well ......................................33 5.3.4 Hydraulics ............................................................................................................34 5.3.5 Aquifer pumping tests ..........................................................................................34
6. GROUNDWATER AGES AND DEPTH OF CIRCULATION ..........................................37 6.1 FORRESTON INVESTIGATION SITE .....................................................................37
6.1.1 Major chemistry and isotopes ..............................................................................37 6.1.2 Carbon-14 and chlorofluorocarbons ....................................................................38
6.2 FOX CREEK INVESTIGATION SITE.......................................................................41 6.2.1 Major chemistry and isotopes ..............................................................................41 6.2.2 Carbon-14 and chlorofluorocarbons ....................................................................42
6.3 MYLOR INVESTIGATION SITE...............................................................................45 6.3.1 Major chemistry and isotopes ..............................................................................45 6.3.2 Carbon-14 and chlorofluorocarbons ....................................................................46
7. VERTICAL FLOW RATES AND AQUIFER RECHARGE ..............................................49 7.1 STABLE ISOTOPES OF WATER ............................................................................49 7.2 CARBON-14 AND CHLOROFLUOROCARBONS ...................................................49
7.2.1 Forreston investigation site..................................................................................49 7.2.2 Fox Creek investigation site.................................................................................53 7.2.3 Mylor investigation site ........................................................................................53
7.3 CHLORIDE MASS BALANCE..................................................................................54 7.3.1 Forreston investigation site..................................................................................54 7.3.2 Fox Creek investigation site.................................................................................55 7.3.3 Mylor investigation site ........................................................................................57
8. HORIZONTAL FLOW VELOCITIES...............................................................................59 8.1 FORRESTON INVESTIGATION SITE .....................................................................59 8.2 FOX CREEK INVESTIGATION SITE.......................................................................59 8.3 MYLOR INVESTIGATION SITE...............................................................................61
9. CONCLUSIONS AND RECOMMENDATIONS...............................................................63
APPENDICES........................................................................................................................65 A. CHEMISTRY RESULTS...........................................................................................65 B. LITHOLOGICAL LOGS ............................................................................................68
UNITS OF MEASUREMENT .................................................................................................75
GLOSSARY ...........................................................................................................................77
REFERENCES.......................................................................................................................79

CONTENTS
Report DWLBC 2007/29 Groundwater recharge and flow investigations in the Western Mount Lofty Ranges, South Australia
vii
LIST OF FIGURES
Figure 1.1 Location map of catchments of the Torrens and Onkaparinga Rivers, including the EMLR and WMLR Prescribed Water Resources Areas .................4
Figure 2.1 Topography and annual rainfall isohyets of catchments of the Torrens and Onkaparinga Rivers, and locations of the three groundwater investigation sites.................................................................................................6
Figure 2.2 Geology of the catchments of the Torrens and Onkaparinga Rivers ...................7 Figure 5.1 Lower Hemisphere Equal Area Stereographic Projection of fracture sets
at the Forreston investigation site (n = 410).......................................................20 Figure 5.2 Frequency plot of fracture spacings measured over a 2 m interval (n = 160)
at the Forreston investigation site ......................................................................20 Figure 5.3 EC, temperature and pH variation with depth in the 203 mm open holes
(Fr1 and Fr2) at the Forreston investigation site, August 2005..........................21 Figure 5.4 Calliper (a) and EM Flowmeter (b) profiles in the 203 mm hole Fr1 (~44 m)
and calliper (c) and EM Flowmeter (d) profiles in the 203 mm hole Fr2 (~80 m) at the Forreston investigation site, August 2005 ..................................22
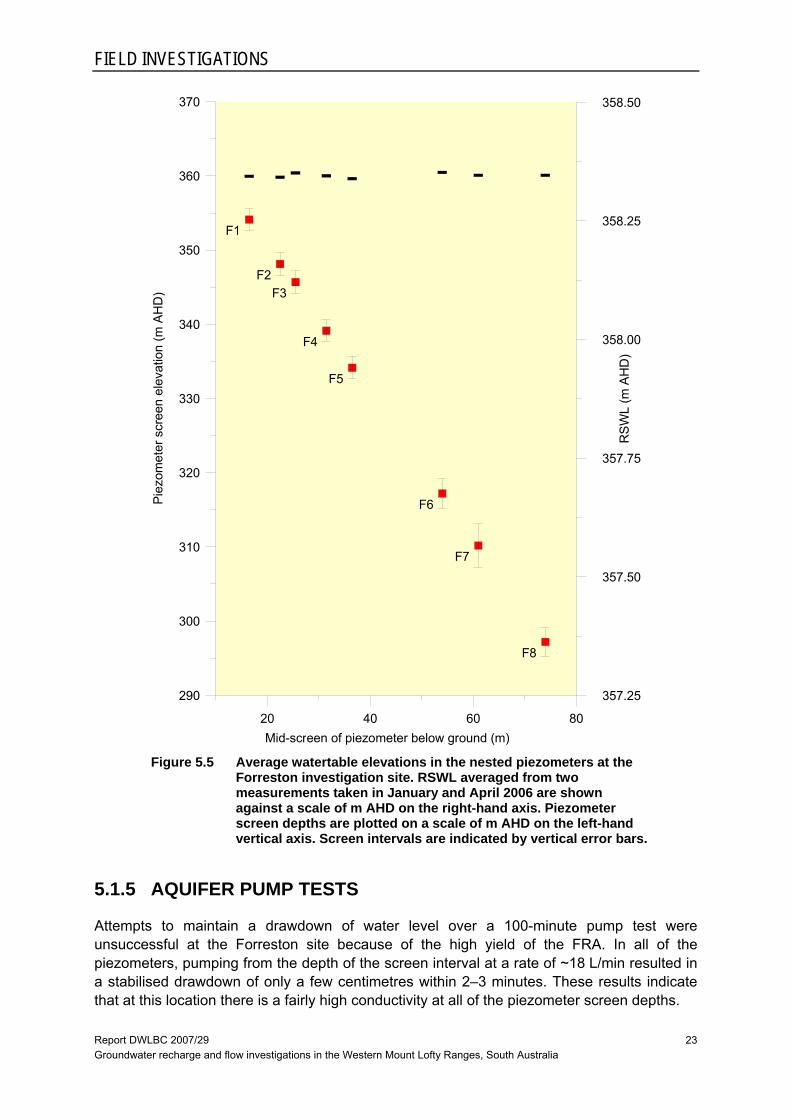
Figure 5.5 Average watertable elevations in the nested piezometers at the Forreston investigation site ................................................................................................23
Figure 5.6 Lower Hemisphere Equal Area Stereographic Projection of fracture sets at the Fox Creek investigation site (n = 150) .....................................................25
Figure 5.7 Frequency plot of fracture spacings measured over a 0.5 m interval (n = 15) at the Fox Creek investigation site .......................................................25
Figure 5.8 EC, temperature and pH variation with depth in the 40.3 m deep 254 mm open hole (FC1) at the Fox Creek investigation site, November 2005 ..............26
Figure 5.9 Calliper (a) and EM Flowmeter (b) profiles in the 254 mm hole FC1 (40.3 m) at the Fox Creek investigation site in August 2005 .............................27
Figure 5.10 Average watertable elevations in the nested piezometers at the Fox Creek investigation site ................................................................................................30
Figure 5.11 Lower Hemisphere Equal Area Stereographic Projection of fracture sets at the Mylor investigation site (n=81) .................................................................31
Figure 5.12 Frequency plot of fracture spacings measured over a 1 m interval (n=12) at the Mylor investigation site.............................................................................31
Figure 5.13 EC, temperature and pH variation with depth in the 80.1 m deep 203 mm open hole at the Mylor investigation site, December 2005 ................................32
Figure 5.14 Calliper (a) and EM Flowmeter (b) profiles in the 203 mm open hole at the Mylor investigation site in May 2005 ..................................................................33
Figure 5.15 Average watertable elevations in the nested piezometers at the Mylor investigation site ................................................................................................35
Figure 6.1 TDS, Cl-, δ2H and pH profiles sampled at the Forreston investigation site, January–February 2006.....................................................................................37
Figure 6.2 Composition diagrams of major ions versus Cl- sampled at the Forreston investigation site, January–February 2006 ........................................................39
Figure 6.3 Depth profile of CFC-12 concentrations (a) and 14C activities (b) of groundwater from the nested piezometers at the Forreston investigation site ................................................................................................40

CONTENTS
Report DWLBC 2007/29 Groundwater recharge and flow investigations in the Western Mount Lofty Ranges, South Australia
viii
Figure 6.4 TDS, Cl-, δ2H, and pH profiles sampled at the Fox Creek investigation site, October 2006 .....................................................................................................41
Figure 6.5 Composition diagrams of major ions versus Cl- sampled at the Fox Creek investigation site in October 2006......................................................................43
Figure 6.6 Depth profile of CFC-12 concentrations and CFC-12 apparent ages of groundwater at the Fox Creek investigation site................................................44
Figure 6.7 Depth profiles of 14C activities and 14C apparent ages from the piezometers at the Fox Creek investigation site, October 2006 ........................44
Figure 6.9 Composition diagrams of major ions versus Cl- sampled at the Mylor investigation site in November 2006 ..................................................................47
Figure 6.8 TDS, Cl-, δ2H, pH and profiles sampled at the Mylor investigation site, November 2006 .................................................................................................45
Figure 6.10 Depth profile of CFC-12 concentrations and CFC-12 apparent ages of groundwater from the piezometers at the Mylor investigation site in November 2006 .................................................................................................48
Figure 6.11 Depth profiles of 14C activities and 14C apparent ages from the piezometers at the Mylor investigation site, November 2006 .................................................48
Figure 7.1 Isotopes δ2H and δ18O of groundwater samples at the Forreston, Fox Creek and Mylor investigation sites..............................................................................50
Figure 7.2 δ2H versus Cl- of the groundwater samples collected at the Forreston, Fox Creek and Mylor investigation sites ............................................................51
Figure 7.3 Vertical distribution of recharge estimates according to the CMB method at the Forreston (a), Fox Creek (b) and Mylor (c) investigation sites.................55
Figure 7.4 Recharge estimates based on the CMB method in the catchments of the Torrens and Onkaparinga Rivers.......................................................................56
Figure 8.1 Horizontal flow rates at the Forreston investigation site derived from ratios of unpurged (C) to purged (Co) 222Rn concentrations in piezometers. ..............60
Figure 8.2 Horizontal flow rates at the Fox Creek investigation site derived from ratios of unpurged (C) to purged (Co) 222Rn concentrations in piezometers sampled during March 2006 (purged samples) and October 2006 (unpurged samples) ...........................................................................................60
Figure 8.3 Horizontal flow rates at the Mylor investigation site derived from ratios of unpurged (C) to purged (Co) 222Rn concentrations in piezometers sampled during November 2006........................................................................61

CONTENTS
Report DWLBC 2007/29 Groundwater recharge and flow investigations in the Western Mount Lofty Ranges, South Australia
ix
LIST OF TABLES
Table 3.1 Well completion details for the three investigation sites in the RTC and ORC...................................................................................................................10
Table 4.1 Construction details of the shallow and nested piezometers at the Forreston, Fox Creek and Mylor investigation sites...........................................14
Table 5.1 Aquifer properties determined from aquifer pumping tests and observations in four piezometers at the Forreston investigation site ......................................24
Table 5.2 Aquifer properties determined from aquifer pumping tests and observations at the Fox Creek investigation site.....................................................................29
Table 5.3 Aquifer properties determined from aquifer pumping tests and observations at the Mylor investigation site.............................................................................36
Table 6.1 Uncorrected and corrected 14C ages for samples from the Forreston investigation site ................................................................................................40
Table 6.2 Uncorrected and corrected 14C ages for samples from the Fox Creek investigation site ................................................................................................45
Table 6.3 Uncorrected and corrected 14C ages for samples from the Mylor investigation site ................................................................................................46
Table A1 Major chemistry, isotopes, CFC-12 concentrations and 14C activities of the groundwater samples at the Forreston, Fox Creek and Mylor investigation sites, and rainfall samples from the Mount Pleasant and Echunga Pluviometers ......................................................................................................65
Table A2 Measured 222Rn concentrations from the unpurged and purged piezometers at the Forreston, Fox Creek and Mylor investigation sites ............67
Table A3 Lithological log for Forreston 203 mm well (Fr1)................................................68 Table A4 Lithological log for Forreston 203 mm well (Fr2)................................................69 Table A5 Lithological log for Fox Creek 254 mm well (FC1) .............................................70 Table A6 Lithological log for Fox Creek 203 mm well (FC2) .............................................71 Table A7 Lithological log for Mylor 203 mm well ...............................................................72

Report DWLBC 2007/29 Groundwater recharge and flow investigations in the Western Mount Lofty Ranges, South Australia
x

Report DWLBC 2007/29 Groundwater recharge and flow investigations in the Western Mount Lofty Ranges, South Australia
1
EXECUTIVE SUMMARY Technical investigations have been conducted to quantify the various components of the water balance of the Western Mount Lofty Ranges (WMLR), which are essential to the development of the Water Allocation Plan for this area. The most important components to be quantified in the groundwater balance are vertical recharge rates, and horizontal flow velocities. Determining these components in fractured rock aquifers is particularly difficult because the groundwater is stored in, and moves through, fractures and joints in what is essentially impervious rock. This investigation provides an analysis and quantification of the groundwater recharge and flow rates in the fractured rock aquifer system at selected sites at Forreston, Fox Creek and Mylor in the Torrens and Onkaparinga River Catchments. These will provide sound knowledge with which to estimate recharge rates at a catchment scale and assist in the development of conceptual models of the fractured rock aquifer systems in the WMLR. Aquifer tests conducted at the Forreston investigation site indicate a freely flowing fractured rock aquifer to a depth of at least 76 m. A recharge model based on groundwater chlorofluorocarbon concentrations indicates a recharge rate at the Forreston site of 44 mm/y. Alternative recharge estimates based on a chloride mass balance model are greater, at 47 mm/y for water at 74 m depth and 61 mm at 18 m depth. Similar hydrochemical compositions throughout the depths sampled suggest that the changes in chloride concentrations with depth are due to changes in the recharge rate over time. Hence an estimate of 61 mm/y for the most recent (shallowest) recharge is taken to be the best approximation of the contemporary recharge rate at this site. At the Fox Creek investigation site, aquifer tests show a strong hydraulic connection between all depths. The aquifer here has an upward hydraulic gradient between the deepest and shallowest piezometers, and is artesian during the winter. Results of carbon-14 dating of the groundwater indicate a minimum age of ~3600 years, suggesting that water reaches this aquifer via an intermediate flow system. Groundwater here increases in age at greater depths, implying that a slow downward flow has occurred prior to the horizontal flow of water to this location. There is a horizontal flow of up to 19 m/y at a depth of about 40 m, with small horizontal flows above and below that depth. A chloride mass balance recharge estimate of 25 mm/y site is supported by other hydrochemical data for the Fox Creek site and by results from a geologically similar recharge investigation site at Burra. At the Mylor investigation site, very low yields from the piezometers indicate poor connectivity of fractures in the aquifer. An analysis of radon-222 activities in the groundwater here shows a very low horizontal flow occurring at all depths. These findings indicate that the conductivity of fractures is uniformly low throughout the depth range investigated, and it is likely that the majority of the small flows are horizontal, through fractures that have very few vertical connections. A recharge estimate for this location has been derived from chloride mass balance recharge estimates for groundwater from 14 wells in a nearby area of similar geology. By scaling the mean of these recharge estimates according to the rainfall difference between the location of those wells and the location of the Mylor investigation site, a recharge estimate of 97 mm/y is derived, which is recommended for resource management purposes as a conservative estimate of recharge at locations with geology and rainfall similar to the Mylor investigation site.

Report DWLBC 2007/29 Groundwater recharge and flow investigations in the Western Mount Lofty Ranges, South Australia
2

Report DWLBC 2007/29 Groundwater recharge and flow investigations in the Western Mount Lofty Ranges, South Australia
3
1. INTRODUCTION
The Mount Lofty Ranges (MLR) provide important surface and groundwater resources for domestic, industrial and agricultural purposes locally, as well as Metropolitan Adelaide’s reticulated water supply. Development and implementation of the Water Allocation Plan (WAP) for the Western Mount Lofty Ranges (WMLR) and Eastern Mount Lofty Ranges (EMLR) Prescribed Water Resources Areas (PWRA) will ensure that current and future development of these resources is sustainable and that the environment is also recognised as a user of the resource.
Technical investigations are being conducted to determine the various components of the water balance in catchments of the WMLR, which are essential to the development of the WAP. The long-term sustainability of the groundwater resource requires careful estimates of the magnitude of all components of the water budget. Important components that need to be quantified are vertical recharge and discharge rates, and horizontal flow velocities. Determining these components in fractured rock aquifers (FRA) is extremely difficult because the groundwater is stored in, and moves through, fractures and joints in what is essentially impervious rock. Traditional investigation techniques applied to sedimentary systems have limited applicability to FRA systems, but several techniques developed recently have been applied to FRA in the Clare Valley (Cook et al. 1999; Cook & Simmons 2000; Love et al. 2002, 2007). These techniques were successful in estimating the components of the groundwater budget and provided sound knowledge in understanding some of the complexities of FRA to develop a conceptual model of the groundwater flow system.
A similar approach has been used in this investigation within the River Torrens Catchment (RTC) and Onkaparinga River Catchment (ORC) as well as other regions in the MLR (Fig. 1.1). The techniques include downhole geophysics, detailed fracture mapping, aquifer pump tests and vertical profiling of groundwater chemistry, isotopes and radioactive tracers. Downhole geophysics was used to indicate physical properties, lithology and porosity of the rock formations. Fracture location, orientation and groundwater flow can also be determined using downhole geophysics. Structural mapping of surface outcrop provided details of fracture spacing and their dominant orientations. Aquifer pump tests provided information on fracture aperture. Groundwater chemistry, specifically chlorofluorocarbon and carbon-14 analyses, provide information on the groundwater age. From this estimated age it is possible to make inferences about the recharge rate — in general, lesser ages indicate relatively high recharge rates, and greater groundwater ages indicate lower recharge rates.
The following investigation aims to provide technical information to support the successful implementation of the WAP for the WMLR.
Specifically, this investigation aims to: • Estimate the recharge rate to the FRA system at the Forreston and Fox Creek
investigation sites in the RTC and at the Mylor investigation site in the Onkaparinga River Catchment.
• Estimate horizontal flow rates at Forreston, Fox Creek and Mylor investigation sites.
• Provide sound knowledge with which to estimate recharge at a catchment scale.
• Assist in the development of a conceptual model of the FRA system in the RTC and ORC.

ADELAIDE
MYLOR
GAWLER
MANNUM
ECHUNGA
WOODSIDE
LOBETHAL
FORRESTON
KANGARILLA
CAPE JERVIS
STRATHALBYN
MOUNT BARKER
MCLAREN VALE
VICTOR HARBOR
MURRAY BRIDGE
LANGHORNE CREEK
Location of the Torrens and Onkaparinga River Catchments
M:\P
roje
cts_
GW
\Mt_
Lofty
_Ran
ges\
Wes
tern
MLR
\WM
LR_R
echa
rge\
wor
k_te
mp\
Torr
_Onk
a_S
tate
_Loc
atio
n
© Government of South Australia, through the Department of Water, Land and Biodiversity Conservation 2007.
DISCLAIMER The Department of Water, Land and Biodiversity Conservation, its employeesand servants do not warrant or make any representation regarding the use,or results of use of the information contained herein as to its correctness,accuracy, currency or otherwise. The Department of Water, Land and BiodiversityConservation, its employees and servants expressly disclaim all liability orresponsibility to any person using the information or advice contained herein.
Produced By: Eastern Mt Lofty Surface Water Assessment Knowledge and Information Division Department of Water, Land and Biodiversity Conservation Projection: Transverse MercatorDatum: Geocentric Datum of Australia 1994 Date: June 2007
Gulf St Vincent
Lake Alexandrina
LakeAlbert
Major stream
Town
Catchment boundary
0 5 10 15 20 25 km
Eastern Mount Lofty Ranges
Western Mount Lofty Ranges
Torrens River Catchment
Onkaparinga River Catchment

Report DWLBC 2007/29 Groundwater recharge and flow investigations in the Western Mount Lofty Ranges, South Australia
5
2. WMLR CATCHMENTS
The RTC covers an area of ~501 km2 (Fig. 2.1). The catchment runs in a westerly direction and ranges in elevation from ~700 m AHD at its most southerly margin, dropping sharply to less than 140 m AHD on the western side of the Eden–Burnside Fault, from where the River Torrens traverses the Adelaide Plains and discharges to the sea at West Beach. The catchment contains two major reservoirs at Kangaroo Creek and Millbrook. The major land uses in the catchment are dairying, irrigated pasture for livestock grazing, fruit trees, and viticulture. The western part of the catchment, on the lower side of the Eden–Burnside Fault, is extensively urbanised.
The ORC covers an area of 555 km2 and adjoins the southern boundary of the RTC (Fig. 2.1). The catchment ranges in elevation from ~700 m AHD at Mount Lofty down to 10 m AHD at the township of Old Noarlunga, where the Onkaparinga River discharges into the Onkaparinga Estuary. The course of the river is interrupted by the Mount Bold Reservoir in the southwest of the catchment. The major land uses in the catchment are dairying, irrigated pasture for livestock grazing, and some viticulture.
2.1 CLIMATE The RTC and ORC have similar climatic conditions, with cool wet winters and typically hot dry summers. Annual average rainfall in the RTC ranges from 500–1000 mm/y, with the higher rainfall in the southern part of the catchment, in areas of higher elevation close to Mount Lofty (Fig. 2.1). Rainfall is significantly less in the topographically lower, western reaches of the RTC where the annual average is less than 600 mm/y. The long-term average annual rainfall in the upper part of the RTC, measured at the townships of Gumeracha, Kersbrook and Birdwood, is 799, 739 and 723 mm/y, respectively. Rainfall is winter dominant, falling between the months of April and October.
The majority of the ORC has an average annual rainfall of 800–900 mm/y, except for a section to the northwest of the catchment, toward Mount Lofty, in which the annual average is up to 1200 mm/y. Rainfall is winter dominant, falling between the months of April and October. The long-term average annual rainfall in the upper part of the ORC, measured at the townships of Lobethal, Bridgewater and Echunga, is 886, 1042 and 807 mm/y, respectively.
2.2 GEOLOGY The geology of the RTC and ORC varies from the Proterozoic Barossa Complex and Adelaidean sequences to the Cambrian Kanmantoo Group (Fig. 2.2).
The Palaeoproterozoic Barossa Complex dominates the northern corner of the RTC, with minor outcrops in the ORC, and forms the basement to the Adelaidean and Cambrian sequences of the Adelaide Geosyncline. Outcrops occur as inliers, thought to represent anticlinal cores, typically with faulted contacts with the overlying Adelaidean sequences. These originally high-grade metamorphic rocks underwent retrograde metamorphism to greenschist facies during the Cambro-Ordovician Delamerian Orogeny (Preiss 1987).

900
950
1000
550
850
850
850
450
500
750
800
850
800
800
MYLOR
NAIRNE
ECHUNGA
OAKBANK
HAHNDORF
ADELAIDE
BIRDWOOD
LOBETHAL
WOODSIDE
GUMERACHA
KERSBROOK
ROSTREVOR
SALISBURY
KANGARILLA
SUMMERTOWN
BRIDGEWATER
MOUNT BARKER
MACCLESFIELD
TEA TREE GULLY
BLEWITT SPRINGS
Catchments of the Torrens and Onkaparinga Rivers
M:\P
roje
cts_
GW
\Mt_
Lofty
_Ran
ges\
Wes
tern
MLR
\WM
LR R
echa
rge\
Wor
k Te
mp\
Torre
ns_O
nkap
_Loc
atio
n.m
xd
Mar
ch 2
007
Gre
enG
01
Forreston Investigation Site
Fox CreekInvestigation Site
MylorInvestigation Site
Eden
- Bur
nsid
e Fau
ltRiver Torrens Catchment
Onkaparinga River Catchment
© Government of South Australia, through the Department of Water,Land and Biodiversity Conservation 2007.
DISCLAIMER The Department of Water, Land and Biodiversity Conservation, its employeesand servants do not warrant or make any representation regarding the use,or results of use of the information contained herein as to its correctness,accuracy, currency or otherwise. The Department of Water, Land and BiodiversityConservation, its employees and servants expressly disclaim all liability orresponsibility to any person using the information or advice contained herein.
Produced By: Mt Lofty Ranges Team Knowledge and Information Division Department of Water, Land and Biodiversity ConservationProjection: Transverse MercatorDatum: Geocentric Datum of Australia 1994 Date: May 2007
0 2 4 6 8 10 km
Elevation (m AHD)
High : 705
Low : 20
TownsGroundwater investigation site
Farm dam
Annual rainfallisohyets (50 mm)
Catchment boundary
Fault
Stream

MYLOR
NAIRNE
ECHUNGA
OAKBANK
HAHNDORF
ADELAIDE
BIRDWOOD
LOBETHAL
WOODSIDE
GUMERACHA
KERSBROOK
ROSTREVOR
SALISBURY
KANGARILLA
SUMMERTOWN
BRIDGEWATER
MOUNT BARKER
MACCLESFIELD
TEA TREE GULLY
BLEWITT SPRINGS
M:\P
roje
cts_
GW
\Mt_
Lofty
_Ran
ges\
Wes
tern
MLR
\WM
LR R
echa
rge\
Wor
k Te
mp\
Torre
ns_O
nkap
_Geo
logy
.mxd
S
epte
mbe
r 200
7 G
reen
G01
Forreston Investigation Site
Fox Creek Investigation Site
MylorInvestigation Site
Eden
- Bu
rnsi
de F
ault
River Torrens Catchment
Onkaparinga River Catchment
© Government of South Australia, through the Department of Water,Land and Biodiversity Conservation 2007.
DISCLAIMER The Department of Water, Land and Biodiversity Conservation, its employeesand servants do not warrant or make any representation regarding the use,or results of use of the information contained herein as to its correctness,accuracy, currency or otherwise. The Department of Water, Land and BiodiversityConservation, its employees and servants expressly disclaim all liability orresponsibility to any person using the information or advice contained herein.
Produced By: Mt Lofty Ranges Team Knowledge and Information Division Department of Water, Land and Biodiversity ConservationProjection: Transverse MercatorDatum: Geocentric Datum of Australia 1994 Date: May 2007
Geology of the Torrens and Onkaparinga River Catchments
0 2 4 6 8 10 km
Stonyfell Quartzite
Mundallio Subgroup
Emeroo Subgroup
Barossa Complex
Saddleworth Formation
GeologyQuaternary and Tertiary sediments
Cape Jervis Formation
Kanmantoo Group
Wilpena Group
Umberatana Group
Belair Subgroup
Groundwater investigation site
Catchment boundary
Town
Stream
Fault

WMLR CATCHMENTS
Report DWLBC 2007/29 Groundwater recharge and flow investigations in the Western Mount Lofty Ranges, South Australia
8
The remaining geology encompasses a significant proportion of the stratigraphic sequence associated with the Adelaide Geosyncline. Outcropping stratigraphic sequences of the Neoproterozoic Burra Group (Emeroo Subgroup, Mundallio Subgroup, Stonyfell Quartzite, Saddleworth Formation and Belair Subgroup), Umberatana Group and Wilpena Group occur in both catchments, as well as the Cambrian Kanmantoo Group. Deformation associated with the Delamerian Orogeny has resulted in north–south-trending, south-plunging folds and complex faulting.
On a local scale, the Forreston investigation site is situated in the Mundallio Subgroup, specifically the Woolshed Flat Shale, of the Burra Group. A fine-grained, quartz–muscovite–schist dominates the geology at this site. Minor quartz vein material and pyrite mineralisation occurs at various depths. Chloritic alteration is observed below depths of 36 m. Weathering appears to be minimal, only extending to 8 m depth, with thin topsoil developed to 2 m.
The Fox Creek investigation site is situated in the Saddleworth Formation of the Burra Group. Slate dominates the geology, with minor occurrences of interbedded metasiltstone and metasandstone. The slate is blue-grey in colour and exhibits a well-developed slaty cleavage. Quartz vein material occurs at depths exceeding 20 m. Pyrite mineralisation, occurring on fracture surfaces and occasionally as discrete veins, occurs below depths of 15 m. Weathering within the slate is observed to depths of ~18 m. A surficial regolith zone, consisting of clay, silty clay and highly weathered slate fragments, extends to ~8 m depth.
The Mylor investigation site is situated in the Emeroo Subgroup, specifically the Aldgate Sandstone, of the basal Burra Group. Quartzite and metasandstone dominate the geology, with minor occurrences of muscovite and biotite–quartz schist. The metasandstone, occurring between 10–25 m, is medium-grained, moderately to well sorted, subrounded–subangular and well cemented. The quartzite is green-grey in colour, crystalline in appearance and well silicified. Possible crenulation cleavage and chloritic alteration can be observed in the mica–quartz schist. Quartz vein material occurs at depths exceeding 10 m. A surficial regolith zone extends to 10 m depth and consists of clay, sand and highly weathered metasandstone fragments. Detailed lithological logs are included in Appendix B.
2.3 HYDROGEOLOGY Groundwater in both the RTC and ORC exists primarily in FRA within the sedimentary and metasedimentary rocks of the Neoproterozoic Adelaidean sequence. In the northern part of the RTC, around Kersbrook, and in a small area of the ORC, significant FRA exist in metamorphic rocks of the Palaeoproterozoic Barossa Complex. In the eastern extremes of both catchments, groundwater resides in the sedimentary and metamorphic rocks of the Cambrian Kanmantoo Group. To the west of the Eden–Burnside Fault, the FRA systems of the upper catchment discharge into the sedimentary aquifers of the Adelaide Plains. This investigation addresses only the FRA systems in the upper RTC and ORC.

Report DWLBC 2007/29 Groundwater recharge and flow investigations in the Western Mount Lofty Ranges, South Australia
9
3. DRILLING PROGRAM Drilling and installation of nested piezometer sites was undertaken at two sites in the TRC and at one site in the ORC.
3.1 SITE SELECTION Potential drilling sites were assessed using several criteria including existing groundwater data, rainfall distribution, topography, and structural and geological data. In both catchments, potential sites were identified in areas of high rainfall and low topographic relief in order to minimise depth to groundwater. Available groundwater data were assessed to provide an indication of depth to water and areas of higher well yield.
The geology was assessed to determine the dominant lithology of each catchment and, within these broad rock types, areas exhibiting appropriate structural characteristics were targeted. Key structural features included steeply dipping to near-vertical bedding and a well-developed bedding plane parallel fracture set. These properties are important for the application of the parallel plate model in groundwater recharge investigations (refer to section 4.5). Another important factor in site selection was distance from large-scale faults and shear zones. Increased fracture development is typically associated with faulting, and whilst this may result in local areas of increased recharge, it is not representative of catchment-scale processes. Therefore, sites that were a considerable distance from major fault zones, and which met all other requirements, were selected.
3.1.1 RIVER TORRENS CATCHMENT
The available groundwater data indicate that the majority of wells are used for either domestic or irrigation purposes. Groundwater in the FRA is generally of good quality for the majority of the upper RTC. Wells are typically less than 100 m deep and 60% are less than 40 m deep. Well yields range from 0.1–50 L/s, with ~92% of wells yielding between 0.1–13 L/s. Well salinities range from 100 to ~8000 mg/L, but the majority are less than 2000 mg/L and 52% of wells have salinities of less than 1000 mg/L.
The topography of the RTC is dominated by the steep slopes of Adelaidean rocks rising to the southern boundary of the catchment, with younger Kanmantoo Group surface geology more prevalent at the eastern end of the catchment. The lower salinity wells are typically in FRA in the areas of higher elevation to the east of the Eden–Burnside Fault. The far eastern end of the catchment is dominated by the geology of the Kanmantoo Group, and salinity of wells in this area is higher than typical for the upper part of the catchment.
As the Kanmantoo Group geology typically provides low-yielding, poor quality aquifers that are less in demand as a groundwater resource, it was considered beneficial to preferentially locate investigation sites in areas of Adelaidean sequence geology. Two suitable investigation sites were located in the RTC, one within an area of Saddleworth Formation at Fox Creek, and another in an area of Woolshed Flat Shale at Forreston.

DRILLING PROGRAM
Report DWLBC 2007/29 Groundwater recharge and flow investigations in the Western Mount Lofty Ranges, South Australia
10
3.1.2 ONKAPARINGA RIVER CATCHMENT Groundwater data for the ORC indicates that the majority of wells are used for either domestic or irrigation purposes. Groundwater is generally of good quality in FRA in the majority of the upper ORC. Wells are typically less than 160 m deep and 67% are less than 100 m deep. Well yields range from 0.1–63 L/s with ~91% of wells yielding between 0.1–13 L/s. Well salinities range from 57 to ~8800 mg/L, but the majority are less than 2000 mg/L, and 68% of wells have salinities of less than 1000 mg/L. Geology of the ORC is dominated by Adelaidean shale and quartzite sequences, principally the Emeroo Subgroup, Woolshed Flat Shale, Stonyfell Quartzite and the Saddleworth Formation. Similar to the RTC, there is a prevalence of Kanmantoo Group geology in the far eastern end of the catchment and a corresponding decline in groundwater quality in that area. A suitable investigation site was located in an area of Emeroo Subgroup, ~3 km south of Mylor.
3.2 DRILLING Underdale Drillers Pty Ltd undertook the drilling program from May to November 2005 in the RTC and ORC. An Ingersoll-Rand rotary hammer drill rig was used to drill two wells at each site in the RTC and one in the ORC. Due to the large diameter and depth of the wells, a second air compressor and drilling additives were required on numerous occasions to facilitate the removal of cuttings from the hole.
At each site, the wells were drilled as close as possible to each other to increase the potential for intersecting the same fracture sets. This is considered important if attempts are to be made to correlate chemistry data from shallow depths with deeper depths.
Each well was completed with Class 9 PVC casing to ensure stability of the upper weathered section. The remainder of the well was left as an open-hole completion to enable sonding, geophysical logging, acoustic televiewer logging, and EM Flowmeter testing to be conducted. These analyses were conducted to inform the design of the nested piezometers, which were installed later (refer to section 4.3).
The completion details for each site are outlined in Table 3.1.
Table 3.1 Well completion details for the three investigation sites in the RTC and ORC
Catchment Easting Northing Permit number
Unit number
Total drilled depth (m)
Diameter (mm)
Casing depth (m)
Forreston 308036.6 6147499.7 106396 6628-22353 43.0 203 6.0
Forreston 308036.1 6147493.6 106397 6628-22348 80.0 203 3.0
Fox Creek 302579.9 6139401.9 106399 6628-22476 39.5 254 12.0
Fox Creek 302581.9 6139406.9 106398 6628-22475 89.0 203 13.5
Mylor 295657.4 6120312.1 106401 6627-11279 80.2 203 10.0

DRILLING PROGRAM
Report DWLBC 2007/29 Groundwater recharge and flow investigations in the Western Mount Lofty Ranges, South Australia
11
3.3 WELL SONDING AND GEOPHYSICAL LOGGING Geophysical logs, EM Flowmeter and Hydrolab surveys were conducted in the 203 mm and 254 mm holes. Hydrolab refers to a YSI® 600XL Series Sonde which is used to measure variations in electrical conductivity (EC), pH and temperature with depth. DWLBC’s Geophysical Technical Services Group completed downhole geophysical surveys for the following parameters: • Gamma Log — Measures natural presence of gamma rays. Aids in defining lithology
changes, bed boundaries and clay content.
• Neutron Log — Measures the amount of hydrogen around the probe. Can provide an indication of porosity and clay content (in combination with gamma).
• Density (or gamma-gamma) Log — Gamma source and gamma receiver measures the electron density, which is a function of the bulk density of the formation. This can also be used for fracture identification in some instances.
• Induction (medium and deep) Log — The induction tool uses electromagnetics to sense the conductivity (inverse of resistivity) of the adjacent formation. Comparisons between deep and medium results can indicate porosity.
• Point Resistance (PR) Log — Changes between a downhole electrode and a reference surface electrode reflect changes in the formation resistivity. This can represent changes in porosity, water salinity, and fluid connectivity.
• Calliper Log — Spring-loaded arms that press against the side of the hole can indicate well and casing integrity. It can also be used to identify fractures in the lithology intercepted by the well.
In addition to the standard geophysical surveys, the EM Flowmeter was used under ambient and pumped conditions to determine vertical flow within the wells at discrete intervals sealed by inflatable packers. An acoustic televiewer survey was also conducted to provide an orientated, visual indication of fracture distribution within each well.

Report DWLBC 2007/29 Groundwater recharge and flow investigations in the Western Mount Lofty Ranges, South Australia
12

Report DWLBC 2007/29 Groundwater recharge and flow investigations in the Western Mount Lofty Ranges, South Australia
13
4. RECHARGE ESTIMATION TECHNIQUES
4.1 INTRODUCTION The observation wells at the Forreston, Fox Creek and Mylor investigation sites were completed with the installation of nested piezometers with screens at discrete depth intervals. These were to enable sampling for a suite of hydrochemical, isotopic and radiogenic tracers to investigate the apparent groundwater age, depth of circulation, vertical and horizontal flow rates, and sources of groundwater. Aquifer pump tests were also conducted to determine some of the physical characteristics of the aquifer systems.
4.2 PIEZOMETER INSTALLATION At the Forreston site, two piezometer nests were installed in open 203 mm holes. At Fox Creek, the piezometers were installed in a 203 mm and a 254 mm hole. At Mylor, a single 203 mm hole was used. PVC casing of 50 mm diameter was used with 0.5 m slotted screens positioned at intervals determined by the geophysical and EM Flowmeter surveys (Table 4.1). Wells were packed with gravel at piezometer screen depths and cemented between depths to isolate the groundwater flow to each piezometer. A full description of the lithological logs is provided in Appendix B.
4.3 GROUNDWATER AGES AND DEPTH OF CIRCULATION
4.3.1 MAJOR CHEMISTRY AND ISOTOPES
Prior to sampling the groundwater, the static water level was measured from top of casing (TOC) using an electric water level probe. The piezometers were then purged using a 12-volt Supertwister® submersible pump for the low-flow shallow piezometers and a Grundfos-MP1 submersible pump for the deeper piezometers. A YSI® multi-parameter meter was used to monitor the physical parameters of pH, specific electrical conductivity (SEC), dissolved oxygen (DO), redox and temperature during purging. The meter was calibrated with known standards prior to use in the field. Samples were collected once the physical parameters had stabilised, indicating that the sample was representative of the section of the aquifer sampled. The total alkalinity (assumed to be HCO3
- for the ranges of pH sampled) was also measured in the field using an HACH titration kit.
Major ion analysis was conducted on the groundwater samples that had been filtered through a 0.45 μm membrane filter in the field. Cations (Na+, Mg2+, K+, Ca2+ and NH4
+) and trace elements were acidified with nitric acid (1% v/v HNO3) to keep the ions in solution and analysed by Inductively Coupled Plasma Emission Spectrometry (ICP-ES). Anions (Cl-, Br-, SO4
2- and NO3-) were analysed by Ion Chromatography (IC). Samples were also collected
and analysed for the stable isotopes of the water molecule (deuterium (δ2H) and oxygen-18 (δ18O)).

RECHARGE ESTIMATION TECHNIQUES
Report DWLBC 2007/29 Groundwater recharge and flow investigations in the Western Mount Lofty Ranges, South Australia
14
Table 4.1 Construction details of the shallow and nested piezometers at the Forreston, Fox Creek and Mylor investigation sites. Reduced standing water level (RSWL) is an average of three measurements made between January 2006 and February 2007.
Unit number Easting Northing Sample name
Surface elevation (m AHD)
Piezometer depth from surface (m)
TOC (PVC)
elevation (m AHD)
Screen interval
from surface (m)
Average RSWL
(m AHD)
6628-22357 308036.64 6147499.68 F1 370.63 18.00 371.64 15.0–18.0 358.01
6628-22356 308036.64 6147499.68 F2 370.63 24.00 371.64 21.0–24.0 358.02 6628-22352 308036.15 6147493.62 F3 371.20 27.00 371.26 24.0–27.0 358.02
6628-22355 308036.64 6147499.68 F4 370.63 33.00 371.64 30.0–33.0 358.02
6628-22354 308036.64 6147499.68 F5 370.63 38.00 371.64 35.0–38.0 358.01
6628-22351 308036.15 6147493.62 F6 371.20 56.00 371.26 52.0–56.0 358.01
6628-22350 308036.15 6147493.62 F7 371.20 64.00 371.26 61.0–64.0 358.01
662822349 308036.15 6147493.62 F8 371.20 76.00 371.25 72.0–76.0 358.01
6628-22478 302579.86 6139401.96 L1 351.99 16.10 352.68 13.1–16.1 352.18
6628-22486 302579.86 6139401.96 L2 351.99 21.00 352.68 18.5–20.5 352.22
6628-22485 302579.86 6139401.96 L3 351.99 25.50 352.67 22.5–25.0
6628-22481 302581.97 6139406.91 L4 351.83 28.50 352.29 25.0–28.0 352.22
6628-22484 302579.86 6139401.96 L5 351.99 30.50 352.68 27.0–30.0 352.23
6628-22483 302579.86 6139401.96 L6 351.99 34.50 352.67 32.0–34.0 352.24
6628-22482 302579.86 6139401.96 L7 351.99 38.50 352.68 36.0–38.0 352.24
6628-22480 302581.97 6139406.91 L8 351.83 40.50 352.30 37.0–40.0 352.23
6628-22479 302581.97 6139406.91 L9 351.83 51.50 352.29 47.0–51.0 352.26
6628-22478 302581.97 6139406.91 L10 351.83 62.50 352.29 56.0–62.0 352.27
6627-11286 295657.38 6120312.09 M1 308.02 16.00 308.88 10.0–16.0 303.23
6627-11285 295657.38 6120312.09 M2 308.02 30.00 308.88 24.0–30.0 303.24
6627-11284 295657.38 6120312.09 M3 308.02 48.00 308.88 42.0–48.0 303.08
6627-11283 295657.38 6120312.09 M4 308.02 65.00 308.88 59.0–65.0 303.00
Adelaide is the closest rainfall station to the RTC and ORC with rainfall isotopic data provided by the International Atomic Energy Agency (IAEA) Global Network of Isotopes in Precipitation (GNIP) service. For this study only, complete annual data sets from the GNIP database were used to derive the weighted average precipitation and the local meteoric water line (LMWL) for Adelaide (δ2H = 7.7, δ18O = 9.9).
4.3.2 CARBON-14 AND CHLOROFLUOROCARBONS
Groundwater samples were collected for analysis of chlorofluorocarbons (CFCs), carbon-14 (14C) and dissolved inorganic carbon (δ13C) to determine the apparent age of the water, and to provide information on the groundwater flow processes, including depth of circulation and vertical aquifer connection.
CFCs are stable organic compounds that were first manufactured in the 1930s and are produced solely from anthropogenic sources. Concentrations of CFCs in water vary as a

RECHARGE ESTIMATION TECHNIQUES
Report DWLBC 2007/29 Groundwater recharge and flow investigations in the Western Mount Lofty Ranges, South Australia
15
function of the atmospheric partial pressures of CFCs and CFC solubility (which is a function of salinity and temperature), and can be used to determine apparent groundwater age. CFCs can be measured in groundwater that has been recharged since ~1940, or in a mixture of groundwater younger than 1940 with older waters. CFCs have been used as age indicators for groundwater studies since ~1979 (Szabo et al. 1996).
Processes that affect the CFC age include sorption, contamination, microbial degradation, hydrodynamic dispersion and soil gas diffusion in the unsaturated zone. Corresponding errors in apparent CFC ages are ~±2 years for ages less than 20 years, increasing to ±4 years for ages of 30 years. The detection limit for CFCs is ~5 pg/kg, which equates to an age of ~1961 (Leaney 2006).
Analysis of 14C can be used to support the CFC data and provide information for the older groundwaters that are beyond the capacity of the CFC dating technique. For a radioactive environmental tracer, where radioactive decay is the dominant process causing change in activity and the input activity of the tracer is relatively constant, then the groundwater age (t) can derived by:
⎟⎟⎠
⎞⎜⎜⎝
⎛−= −
oAAt ln1λ Equation 4.1
where λ is the decay constant [T-1], A is the measured activity and Ao is the estimated initial activity. (In this, and the following equations, L is length, T is time, M is mass.)
One of the complications with interpretation of 14C data is using an appropriate correction model to account for geochemical interactions that modify the initial activity (Ao) of 14C at the time of recharge. The correction models include a chemical mixing model (Tamers 1967), isotopic dilution model (Pearson & Hanshaw 1970) and a complete soil gas exchange model (Fontes & Garnier 1979). Required inputs for the models include the chemical and isotopic end members of soil gas δ13C and 14C, partial pressure of CO2 (pCO2), and δ13C and 14C of carbonates. These can be measured from samples in the laboratory and also approximated using the computer code PHREEQC (Parkhurst & Appelo 1999). The values used in this investigation are as follows: for initial activity (Ao) of soil CO2 14C = 85 pmC, soil gas δ13C = -13‰, carbonate mineral δ13C = -7.8‰ and carbonate mineral 14C = 0 pmC (Harrington 1999).
4.4 VERTICAL FLOW RATES AND AQUIFER RECHARGE
4.4.1 CARBON-14 AND CHLOROFLUOROCARBONS
Vertical profiles of groundwater age have been used successfully to estimate rates of vertical groundwater flow in sedimentary aquifers (Cook & Bohlke 1999). Assuming that sampling takes place near the watertable, then the horizontal component of groundwater flow will be relatively small and the recharge rate (R) may be approximated by:
tzR θ
= Equation 4.2
where z is the depth below the watertable [L], t is the groundwater age [T] and θ is the porosity [unitless].

RECHARGE ESTIMATION TECHNIQUES
Report DWLBC 2007/29 Groundwater recharge and flow investigations in the Western Mount Lofty Ranges, South Australia
16
There are relatively few established and reliable techniques for estimating vertical flow rates in FRA (Love et al. 2002). One approach for determining vertical flow rates, and hence recharge rates, in an FRA assumes that groundwater flow occurs through vertical, planar, parallel fractures with uniform matrix properties. This assumption also implies a vertical distribution of groundwater ages. It is therefore necessary to have knowledge of various aquifer parameters including fracture aperture, which is determined from aquifer tests, fracture spacing (from fracture mapping), and estimates of the matrix diffusion coefficient. Where fracture orientations and distribution are more complex, groundwater ages are more likely to represent depth of groundwater circulation than provide information on vertical flow rates (Love et al. 2002).
For a conservative tracer with a constant source and subject to radioactive decay, the concentrations within the fractures can be related to vertical flow within the fractures (Vw) by:
⎥⎦⎤
⎢⎣⎡
⎥⎦
⎤⎢⎣
⎡+= −
ztBD
bDV am
w δδλ
λθ /)tanh(1 2
12
1
21
21
Equation 4.3
(after Neretnieks 1981)
where Vw is the groundwater velocity in the fracture [LT-1], b is the fracture half-aperture [L], B is the fracture half-spacing [L], θm is the matrix porosity [unitless], D is the effective diffusion coefficient within the matrix [L2T-1], λ is the decay constant [T-1] and δta/δz is the age gradient [TL-1]. The decay constant for 14C is 1.21x10⁻⁴/y. Cook and Simmons (2000) substituted the 14C decay constant with the exponential growth rate for CFC-12 (k = 0.06/y) to determine vertical flow rates from CFC-12 age gradients.
The mean volumetric flow rate through the fracture (Qv [L3T-1]) is given by:
BbVQ wv = Equation 4.4
4.4.2 AQUIFER PUMP TESTS
Single-well pump tests were conducted on several of the piezometers using the Cooper-Jacob straight-line method (Fetter 2001) to determine the bulk hydraulic conductivity over the length of the screen interval. Pump tests are typically more suited to sedimentary systems, but their application to nested piezometers can provide valuable information on the vertical variation of hydraulic conductivity and can be used to derive other physical characteristics of the aquifer (Cook 2003).
Having determined the bulk hydraulic conductivity over the screened interval from the aquifer tests, the average fracture aperture can be derived from:
)2(12)2( 3
BbgKb μ
ρ= Equation 4.5
Rearranging equation 4.5, the equivalent fracture aperture can be determined: 3/1
)2(122 ⎟⎟⎠
⎞⎜⎜⎝
⎛=
gKBb b
eq ρμ
Equation 4.6

RECHARGE ESTIMATION TECHNIQUES
Report DWLBC 2007/29 Groundwater recharge and flow investigations in the Western Mount Lofty Ranges, South Australia
17
where Kb is the bulk hydraulic conductivity over the test interval [LT-1], p is the fluid density [ML-3], g is acceleration due to gravity [LT-2], 2b is the fracture aperture [L], μ is the dynamic viscosity [MT.L-1] and 2B is the fracture spacing [L], which we have assumed to be the same as that in nearby outcrops of similar lithological type.
4.4.3 CHLORIDE MASS BALANCE
Groundwater recharge rates can also be estimated using the chloride mass balance (CMB) technique. The method assumes that the only source of chloride in groundwater is via rainfall and that the rate of chloride accession to the landscape is constant and there are no sources or sinks of chloride in the subsurface. The following steady state mass balance equation can be used to estimate recharge (R) by:
pgw
CC
ROPR )( −= Equation 4.7
where P is the mean annual precipitation rate [L], RO is the annual runoff rate [L], Cp is the chloride concentration in the precipitation [ML-1], and Cgw is the chloride concentration in groundwater [ML-1].
The CMB technique has been used successfully in sedimentary aquifer systems and has been suggested as the most reliable technique for determining recharge rates to FRA systems (Cook 2003). However, the recharge rate determined from CMB should be considered as a minimum because of the addition of other sources of chloride. Changes in environmental conditions (i.e. vegetation clearing) will also impact on the equilibrium of chloride in the fractures with the rock matrix and may take a significant amount of time for the diffusion of salts from the matrix into the fractures to re-equilibrate.
4.5 HORIZONTAL FLOW VELOCITIES FROM RADON ACTIVITY
Radon (222Rn) is a radioactive inert gas that is generated from the decay of uranium and thorium series isotopes in the aquifer matrix. It has a half-life of ~3.8 days, is highly soluble in water, and its concentration will depend on the mineralogy of the aquifer and the pore space geometry (Love et al. 2002).
Cook et al. (1999) developed a technique to estimate horizontal flow rates by comparing unpurged to purged 222Rn concentrations from piezometers, where a purged sample is assumed to be representative of the concentration of 222Rn in the aquifer. For high horizontal flow rates, the concentration of 222Rn of an unpurged sample, measured over the length of the screen of the piezometer, will be similar to the concentration of a purged sample from the piezometer. If the horizontal flow rate were low, then the concentration of 222Rn of an unpurged sample would have decayed to background levels. Hence, the ratio of 222Rn concentration from an unpurged sample to a purged sample will depend on the amount of radioactive decay, which occurs as the groundwater moves through the well under natural flow conditions. Assuming a perfectly mixed well, the groundwater flow rate (q, m/y) is given by:

RECHARGE ESTIMATION TECHNIQUES
Report DWLBC 2007/29 Groundwater recharge and flow investigations in the Western Mount Lofty Ranges, South Australia
18
20
rcc
cq λπ−
= Equation 4.8
where c and c0 are the 222Rn concentrations (Bq/L) in the well and in the aquifer respectively, r is the well radius (m) and λ is the decay constant for 222Rn (0.18/d). Groundwater flow rates calculated by this method refer to groundwater flow within the well. Due to hydrodynamic dispersion, the horizontal flow rate within the well will be higher than in the aquifer. To estimate flow within the aquifer, the calculated flow rate needs to be multiplied by a factor of 0.5 for an open well or 0.25 for a piezometer.

Report DWLBC 2007/29 Groundwater recharge and flow investigations in the Western Mount Lofty Ranges, South Australia
19
5. FIELD INVESTIGATIONS
5.1 FORRESTON INVESTIGATION SITE The Forreston investigation site is located in the north of the RTC at an elevation of ~380 m AHD in an area of moderately steep topography and with an annual rainfall of ~800 mm.
Piezometer nests were installed in two 203 mm holes, with depths of 43 and 80.4 m, referred to below as Fr1 and Fr2, respectively. Surface casing was installed to 4.4 m in Fr1 and to 3.1 m in Fr2. These two holes were completed as nested piezometers as detailed in Table 4.1 (piezometers F1 to F8). The site is situated in the Woolshed Flat Shale; detailed lithological logs are included in Appendix B.
5.1.1 FRACTURE ANALYSIS
Detailed fracture analyses were undertaken at two locations in close proximity to the Forreston investigation site to provide values of fracture spacing for use in the parallel-plate model.
Field measurements indicate the dominant fracture set has an orientation of 002°/67°E. This is represented diagrammatically by the stereographic projection of poles to fracture surfaces in Figure 5.1. The great circle girdles represent the average fracture orientation (black) and outcrop-scale bedding (green), indicating that the dominant fracture set is parallel to the regional cleavage orientation (S1 002°/66°E). On a macroscopic scale, the dominant fracture set is also sub-parallel to bedding (S0 002°/70°E). Average spacing between parallel fracture surfaces is 13 mm, and frequency analysis indicates that 86% of fracture spacings lie within the 0–20 mm range (Fig. 5.2).
5.1.2 ELECTRICAL CONDUCTIVITY, TEMPERATURE AND PH IN OPEN WELLS
EC, temperature and pH were measured using a YSI® 600XL Series Sonde for the open 203 mm holes (Fig. 5.3). The sonde recorded these variables from the watertable, at ~11.5 m depth in both holes, to 44 m (TOC) in Fr1 and to a depth of 80.4 m (TOC) in Fr2.
These measurements in the two wells show distinctly different results. The EC in Fr1 is uniform at ~750 μS/cm for the whole measured depth. There was more variation in Fr2, with a steady decrease from 835 μS/cm at 2 m below the watertable to ~786 μS/cm at 30 m depth, then remaining constant down to a depth of 79 m. Below 79 m there is a marked increase in EC down to the 80.2 m limit of the measurements. This EC increase corresponds to an increase in pH at the same depth and may indicate inflow from a significant fracture at that depth.

FIELD INVESTIGATIONS
Report DWLBC 2007/29 Groundwater recharge and flow investigations in the Western Mount Lofty Ranges, South Australia
20
Figure 5.1 Lower Hemisphere Equal Area Stereographic Projection of fracture sets at the Forreston investigation site (n = 410)
0102030405060708090
100
0-10 10-20 20-30 30-40 40-50 50-60 >60Range (mm)
Num
ber o
f fra
ctur
es
Figure 5.2 Frequency plot of fracture spacings measured over a 2 m interval (n = 160) at the Forreston investigation site

FIELD INVESTIGATIONS
Report DWLBC 2007/29 Groundwater recharge and flow investigations in the Western Mount Lofty Ranges, South Australia
21
6 7 86.5 7.5
pH
Fr 2Fr 1
10 12 14 16 18 20Temperature (oC)
Fr 2Fr 1
700 800 900 1000EC (μS/cm)
80
70
60
50
40
30
20
10
0
Dep
th b
elow
gro
und
(m)
Fr 2Fr 1
Figure 5.3 EC, temperature and pH variation with depth in the 203 mm open holes (Fr1 and Fr2) at the Forreston investigation site, August 2005. Both holes are cased to ~6 m. Fr1 and Fr2 are 42 and 80 m deep, respectively.
The temperature in Fr1 decreases along a constant gradient from 17.5°C at the watertable to 14.1°C at 44 m depth. In Fr2 there is a slight but steady increase in temperature with depth from 17.5°C at the watertable to 18.1°C at 80 m depth. The pH in Fr1 increases along a constant gradient from 6.70 at the watertable to 7.76 at 44 m depth. The pH in Fr2 declines from 7.21 at the watertable to 6.74 at ~32 m depth, then remains fairly constant, decreasing by only 0.12 to 6.62 at 79 m depth, prior to a marked increase to 6.92 at 80.4 m.
5.1.3 GEOPHYSICAL AND EM FLOWMETER SURVEYS IN OPEN WELLS
Calliper and EM Flowmeter results (Fig. 5.4) are used to aid in the identification of strata changes and identify the principle flow zones to determine where the nested piezometer screen intervals should be located.
Deviations in the calliper trace, such as seen at ~21 and 23 m for Fr1, and at 25 and 32 m for Fr2, indicate positions where the holes intersect significant fractures.

FIELD INVESTIGATIONS
Report DWLBC 2007/29 Groundwater recharge and flow investigations in the Western Mount Lofty Ranges, South Australia
22
Figure 5.4 Calliper (a) and EM Flowmeter (b) profiles in the 203 mm hole Fr1 (~44 m) and
calliper (c) and EM Flowmeter (d) profiles in the 203 mm hole Fr2 (~80 m) at the Forreston investigation site, August 2005. Water level at time of measurement was ~10 m below surface. Diamonds on the flowmeter profile represent intervals where the packers were inflated to measure flow. Both holes are PVC cased to 6 m.
The EM Flowmeter results suggest that there is a small amount (1.5 L/min) of upward flow at ~23 m depth in Fr1. This corresponds with a spike in the calliper trace, which may indicate a fracture at this depth. Apart from this, EM Flowmeter results for both holes display very little flow under ambient conditions.
5.1.4 HYDRAULICS
The average watertable elevations measured in January and April 2006 in the nested piezometers are shown in Figure 5.5. The primary y-axis shows the piezometer screen elevation, whilst the secondary y-axis shows the watertable elevation corrected to an RSWL in each of the piezometers. There is no significant difference in groundwater head between the shallow and deep piezometers. Hence, there is no hydraulic gradient over the depth range of these piezometers and, as shown in the EM Flowmeter profile (Fig. 5.4), no ambient vertical flow across this range.
-4 0 4 8Flow (L/min)
120 160 200 240 280Calliper (mm)
80
70
60
50
40
30
20
10
0
Dep
th b
elow
gro
und
(m)
0 4 8Flow (L/min)
120 160 200 240 280Calliper (mm)
60
50
40
30
20
10
0
Dep
th b
elow
gro
und
(m)
AmbientPumped
AmbientPumped
a b c d
FIELD INVESTIGATIONS
Report DWLBC 2007/29 Groundwater recharge and flow investigations in the Western Mount Lofty Ranges, South Australia
23
20 40 60 80Mid-screen of piezometer below ground (m)
290
300
310
320
330
340
350
360
370
Piez
omet
er s
cree
n el
evat
ion
(m A
HD
)
357.25
357.50
357.75
358.00
358.25
358.50
RSW
L (m
AH
D)
F1
F2F3
F4
F5
F6
F7
F8
Figure 5.5 Average watertable elevations in the nested piezometers at the
Forreston investigation site. RSWL averaged from two measurements taken in January and April 2006 are shown against a scale of m AHD on the right-hand axis. Piezometer screen depths are plotted on a scale of m AHD on the left-hand vertical axis. Screen intervals are indicated by vertical error bars.
5.1.5 AQUIFER PUMP TESTS
Attempts to maintain a drawdown of water level over a 100-minute pump test were unsuccessful at the Forreston site because of the high yield of the FRA. In all of the piezometers, pumping from the depth of the screen interval at a rate of ~18 L/min resulted in a stabilised drawdown of only a few centimetres within 2–3 minutes. These results indicate that at this location there is a fairly high conductivity at all of the piezometer screen depths.

FIELD INVESTIGATIONS
Report DWLBC 2007/29 Groundwater recharge and flow investigations in the Western Mount Lofty Ranges, South Australia
24
The Cooper-Jacobs straight-line method, which requires the monitoring of continuous drawdown over a longer period, could not be applied to determine hydraulic conductivity values in this case. Instead, the final drawdown and the applied pumping rate were used in a Darcy’s law calculation to approximate the bulk conductivity (Kb) at the depths of four of the piezometer screens. Fracture aperture values (2b) were then calculated for these four depths using equation 4.2 (section 4.4). The calculated values of Kb and 2b are highlighted in yellow in Table 5.1.
Table 5.1 Aquifer properties determined from aquifer pumping tests and observations in four piezometers at the Forreston investigation site
Piezo- meter
interval Screen length
Aquifer test bulk
K Kb
Fracture spacing
2B
Hydraulic gradient
dh/dx
Fluid density
ρ
Gravityg
Dynamic viscosity
μ
Fracture aperture
2b
Fracture aperture
2b
(m) (m/d) (m) (kg/m3) (m/s2) (kg/s/m) (m) (μm)
F2 3.0 15.9 * 0.013 0.007 1000 9.8 0.00114 1.495E-04 149
F5 3.0 4.1 * 0.013 0.007 1000 9.8 0.00114 9.513E-05 95
F6 4.0 3.7 * 0.013 0.007 1000 9.8 0.00114 9.193E-05 92
F7 3.0 2.1 * 0.013 0.007 1000 9.8 0.00114 7.611E-05 76
* bulk K values determined from Darcy's Law approximation.
5.2 FOX CREEK INVESTIGATION SITE The Fox Creek investigation site is located on Fox Creek Road, ~5 km northwest of Lobethal, in an area of steeply incised valleys at an elevation of ~360 m AHD. Annual rainfall here is ~840 mm.
Piezometer nests were installed in a 254 mm hole of 40.29 m depth and an 203 mm hole of 90.60 m depth, referred to below as FC1 and FC2, respectively. Surface casing for FC1 was installed to 10.5 m, and to 14 m in FC2. These two holes were completed as nested piezometers as detailed in Table 4.1 (piezometers L1 to L10). The lithology encountered during drilling was slate of the Saddleworth Formation. Lithological logs for the two holes are provided in Appendix B.
5.2.1 FRACTURE ANALYSIS
Detailed fracture analyses were undertaken at the Fox Creek investigation site to provide values of fracture spacing for use in the parallel-plate model.
Field measurements indicate that the dominant fracture set has an orientation of 002°/46°E. This is represented diagrammatically by the stereographic projection of poles to fracture surfaces in Figure 5.6. The great circle girdles represent the average fracture orientation (black) and outcrop-scale bedding (green), indicating that the dominant fracture set is sub-parallel to the bedding orientation (So 024°/43°E). The blue great circle girdle represents the cleavage orientation (S1 010°/55°W).
Average spacing between parallel fracture surfaces is 14 mm, and frequency analysis indicates that 87% of fracture spacings lie within the 0–20 mm range (Fig. 5.7).

FIELD INVESTIGATIONS
Report DWLBC 2007/29 Groundwater recharge and flow investigations in the Western Mount Lofty Ranges, South Australia
25
Figure 5.6 Lower Hemisphere Equal Area Stereographic Projection of fracture sets at the Fox Creek investigation site (n = 150)
0
1
2
3
4
5
6
7
0-10 10-20 20-30 30-40 >40Range (mm)
Num
ber o
f fra
ctur
es
Figure 5.7 Frequency plot of fracture spacings measured over a 0.5 m interval (n = 15) at the Fox Creek investigation site
5.2.2 EC, TEMPERATURE AND PH IN OPEN WELLS
EC, temperature and pH were measured using a YSI® 600XL Series Sonde for the open 254 mm hole (FC1) from the watertable, at ~0.7 m, to a depth of 40.29 m (TOC) (Fig. 5.8).
The EC in FC1 is uniform at ~1400 μS/cm for the whole measured depth, which suggests a good connection between fractures over the entire 40 m depth. The temperature in FC1

FIELD INVESTIGATIONS
Report DWLBC 2007/29 Groundwater recharge and flow investigations in the Western Mount Lofty Ranges, South Australia
26
6 7 86.5 7.5pH
FC 1
10 12 14 16 18 20Temperature (oC)
FC 1
1200 1300 1400 1500 1600EC (μS/cm)
40
30
20
10
0D
epth
bel
ow g
roun
d (m
)
FC 1
Figure 5.8 EC, temperature and pH variation with depth in the 40.3 m deep 254 mm open hole (FC1) at the Fox Creek investigation site, November 2005
increases slightly with depth, from 15.5°C at the watertable to 16.5°C at 40 m depth. The pH increases from 6.80 at the watertable to 7.50 at ~20 m depth, and then remains approximately constant down to 40 m depth.
5.2.3 GEOPHYSICAL AND EM FLOWMETER SURVEYS IN OPEN WELLS
Deviations in the calliper trace indicate positions where the hole intersects significant fractures. The greatest deviations in the FC1 calliper trace (Fig. 5.9a) are at ~20 and 34 m; significant deviations are also seen between 11–27 m, and at 27.5 m. In the FC2 calliper trace (Fig. 5.9c), several major deviations are seen between depths of 30 and 50 m, while smaller deviations are also seen between 14–16 m and at 22 m.

FIELD INVESTIGATIONS
Report DWLBC 2007/29 Groundwater recharge and flow investigations in the Western Mount Lofty Ranges, South Australia
27
(a) (b) (c) (d)
0 4 8 12Flow (L/min)
120 160 200 240 280 320Calliper (mm)
60
50
40
30
20
10
0
Dep
th b
elow
gro
und
(m)
0 4 8 12Flow (L/min)
160 200 240 280 320Calliper (mm)
60
50
40
30
20
10
0
Dep
th b
elow
gro
und
(m)
AmbientPumped
AmbientPumped
Figure 5.9 Calliper (a) and EM Flowmeter (b) profiles in the 254 mm hole FC1 (40.3 m) at the
Fox Creek investigation site in August 2005. Calliper (c) and EM Flowmeter (d) profiles in the 203 mm hole FC2 (80.1 m) are from January 2006. Water level at time of measurement was ~0.5 m below surface. Diamonds on the flowmeter profile represent intervals where the packers were inflated to measure flow. The 254 and 203 mm holes are PVC cased to depths of ~11 and 12.5 m, respectively.
The EM Flowmeter trace for FC1 suggests that under pumped conditions, nearly all of the flow into the hole originates from a depth between 29–32 m. This does not correspond to any of the major deviations in the calliper trace for this hole, but suggests that there is a fracture at that depth that is able to conduct a large volume of groundwater. The EM Flowmeter traces for FC1 display very little flow under ambient conditions.
The EM Flowmeter trace for FC2 shows an upward flow of up to 4 L/min under ambient conditions. The flow is greatest between 30–45 m depth, and declines toward the top of the hole. The greater flow corresponds with the location of the largest deviation in the calliper trace, suggesting flow into the hole through fractures at these depths, and flow out of the hole via fractures above 20 m depth. Under pumped conditions, with 10 L/min pumped from near the top of the hole, upward flow is seen to increase significantly between 45–30 m depths, but with no further increase above 30 m. This indicates that the majority of the flow into the hole is via the larger fractures below 30 m depth.

FIELD INVESTIGATIONS
Report DWLBC 2007/29 Groundwater recharge and flow investigations in the Western Mount Lofty Ranges, South Australia
28
5.2.4 HYDRAULICS The average watertable elevations measured in September and October 2006 in the nested piezometers are shown in Figure 5.10. The primary y-axis shows the piezometer screen elevation, whilst the secondary y-axis shows the watertable elevation corrected to an RSWL in each of the piezometers. There is a head difference of 0.1 m between the deepest and shallowest piezometers at this site, with the highest head elevations at greater depth, creating a positive (upward) hydraulic gradient. The hydraulic gradient in FC1, from 14.6–37 m, is ~0.0022 (0.05 m/22.4 m). In FC2, the hydraulic gradient is 0.0015 (0.05 m/32.5 m) between 59.0–26.5 m depth. These upward gradients help to explain the upward flows identified in FC2, as water flows into the well from the larger fractures near the bottom of the hole, and flows out via fractures near the top of the well.
5.2.4 AQUIFER PUMPING TESTS
The required 100-minute aquifer pumping tests were successfully completed in four piezometers (L1, L5, L8 and L10). The bulk hydraulic conductivity (Kb) values resulting from application of the Cooper-Jacobs straight-line method to the results of these tests are shown in Table 5.2. For piezometers in which a pumping test was not conducted, averages of the drawdown log cycle in the adjacent depths were used to provide a K value. Fracture aperture (2b) values were also calculated for these four depths using equation 4.2 (section 4.4).
There was considerable drawdown of up to 9.5 m in the shallowest piezometer with a pumping rate of only 4–5 L/min, indicating a low yield and poorly connected fractures at that depth. Yields were higher in deeper piezometers, with drawdowns of ~1 m at pumping rates of ~10 L/min.
The pumping tests at this site also indicated very strong connectivity between the two wells, and over a range of depths. When any of the piezometers were pumped, a similar drawdown occurred in adjacent piezometers.
5.3 MYLOR INVESTIGATION SITE The Mylor investigation site is located on Stock Road ~3 km south of Mylor. This is an area of moderately steep topography at an elevation of ~310 m AHD and with an annual rainfall of ~840 mm.
Piezometer nests were installed in a single 203 mm hole of 80.1 m depth. Surface casing was installed to a depth of 10 m. The hole was completed with four nested piezometers (M1–M4) as detailed in Table 4.1. The lithology encountered during drilling was Aldgate Sandstone. Lithological logs for this hole are provided in Appendix B.

FIELD INVESTIGATIONS
Report DWLBC 2007/29 Groundwater recharge and flow investigations in the Western Mount Lofty Ranges, South Australia
29
Table 5.2 Aquifer properties determined from aquifer pumping tests and observations at the Fox Creek investigation site. Calculated values of bulk hydraulic conductivity (Kb) and average fracture aperture (2b) are highlighted in yellow
Piezometer interval
Screen length
Drawdown log cycle
h0-h Flow rate
Constant discharge
rate Q
Transmissivity (Cooper-Jacobs)
T
Aquifer test bulk
K Kb
Fracture spacing
2B
Hydraulic gradient
dh/dx
Fluid density
ρ
Gravityg
Dynamic viscosity
μ
Fracture aperture
2b
Fracture aperture
2b
(m) (m) (L/min) (m3/d) (m2/d) (m/d) (m) (kg/m3) (m/s2) (kg/s/m) (m) (μm)
L1 3.0 6.5 5 7.2 0.203 0.068 0.08 0.007 1000 9.8 0.00114 4.436E-05 44
L2 2.0 0.27 4 5.76 3.905 1.952 0.08 0.007 1000 9.8 0.00114 1.361E-04 136
L4 3.0 0.6 10 14.4 4.393 1.464 0.08 0.007 1000 9.8 0.00114 1.237E-04 124
L5 3.0 0.6 10 14.4 4.393 1.464 0.08 0.007 1000 9.8 0.00114 1.237E-04 124
L6 2.0 0.605 10 14.4 4.356 2.178 0.08 0.007 1000 9.8 0.00114 1.412E-04 141
L7 2.0 0.415 10 14.4 6.351 3.175 0.08 0.007 1000 9.8 0.00114 1.601E-04 160
L8 3.0 0.41 10 14.4 6.428 2.143 0.08 0.007 1000 9.8 0.00114 1.404E-04 140
L9 4.0 0.4 10 14.4 6.589 1.647 0.08 0.007 1000 9.8 0.00114 1.286E-04 129
L10 6.0 0.405 10 14.4 6.508 1.085 0.08 0.007 1000 9.8 0.00114 1.119E-04 112

FIELD INVESTIGATIONS
Report DWLBC 2007/29 Groundwater recharge and flow investigations in the Western Mount Lofty Ranges, South Australia
30
10 20 30 40 50 60Mid-screen of piezometer below ground (m)
290
300
310
320
330
340
350
Piez
omet
er s
cree
n el
evat
ion
(m A
HD
)
351.00
351.25
351.50
351.75
352.00
352.25
RSW
L (m
AH
D)
L1
L2
L3
L4L5
L6
L7L8
L9
Figure 5.10 Average watertable elevations in the nested piezometers
at the Fox Creek investigation site. RSWL averaged from two measurements taken in September and October 2006 are shown against a scale of m AHD on the right-hand axis. Piezometer screen depths are plotted on a scale of m AHD on the left-hand vertical axis.
5.3.1 FRACTURE ANALYSIS
Detailed fracture analyses were undertaken at two locations in close proximity to the Mylor investigation site to provide values of fracture spacing for use in the parallel-plate model.
Field measurements indicate that the dominant fracture set has an orientation of 003°/89°E. This is represented diagrammatically by the stereographic projection of poles to fracture surfaces (Fig. 5.11). The great circle girdles represent the average fracture orientation (black) and regional cleavage (blue), indicating that the dominant fracture set is parallel to

FIELD INVESTIGATIONS
Report DWLBC 2007/29 Groundwater recharge and flow investigations in the Western Mount Lofty Ranges, South Australia
31
Figure 5.11 Lower Hemisphere Equal Area Stereographic Projection of fracture sets at the Mylor investigation site (n=81)
the regional cleavage orientation (S1 002°/90°). The green great circle represents macroscopic scale bedding (S0 041°/18°E). In addition to the dominant cleavage-parallel fracture set, a number of significant fracture sets are also illustrated by the contoured stereographic projection, orientated 046°/77°E, 041°/17°E, 046°/52°W and 160°/82°E.
Average spacing between fracture surfaces for the dominant cleavage parallel fracture set is 95 mm, and frequency analysis indicates that 92% of fracture spacings lie within the 0–200 mm range (Fig. 5.12).
0
1
2
3
4
5
6
7
8
0-50 50-100 100-150 150-200 200-250 250-300 >300Range (mm)
Num
ber o
f fra
ctur
es
Figure 5.12 Frequency plot of fracture spacings measured over a 1 m interval (n=12) at the Mylor investigation site

FIELD INVESTIGATIONS
Report DWLBC 2007/29 Groundwater recharge and flow investigations in the Western Mount Lofty Ranges, South Australia
32
5.3.2 EC, TEMPERATURE AND PH IN OPEN WELLS
EC, temperature and pH were measured using a YSI® 600XL Series Sonde for the open 203 mm hole (Fig. 5.13). The sonde recorded these variables from the watertable, at ~1.40 m depth (TOC), to a depth of 80.4 m (TOC).
There is a distinct change in EC and temperature in the upper 5 m of the well, and in pH in the upper 10 m. However, these variations are probably due only to temperature equilibration of the sonde in the first few minutes of measurement, and effects of standing water in the well casing in the upper 10 m of the well. The variation in EC toward the bottom of the well is more significant. The reduction in EC from ~60–66 m, and increase in EC from 73–80 m, may indicate inflows of groundwater into the hole at these depths.
6 7 8 96.5 7.5 8.5pH
10 12 14 16 18 20Temperature (oC)
800 1200 1600 2000EC (μS/cm)
80
70
60
50
40
30
20
10
0
Dep
th b
elow
gro
und
(m)
Figure 5.13 EC, temperature and pH variation with depth in the 80.1 m deep 203 mm open hole at the Mylor investigation site, December 2005

FIELD INVESTIGATIONS
Report DWLBC 2007/29 Groundwater recharge and flow investigations in the Western Mount Lofty Ranges, South Australia
33
5.3.3 GEOPHYSICAL AND EM FLOWMETER SURVEYS IN OPEN WELL
Deviations in the calliper trace indicate positions where the hole intersects significant fractures. The greatest deviation in the calliper trace for the Mylor 203 mm hole is seen between ~10–20 m (Fig. 5.14). In this case however, the calliper deviation is indicative of a collapse of the side of the hole between these depths, increasing the overall diameter of the hole to up to 275 mm at ~18 m depth. Significant deviations are also seen between 38–48 m, with some smaller deviations apparent between 25–34 m.
The EM Flowmeter trace for FC1 suggests that under ambient conditions there is a small upward flow of 1.5 L/min from the bottom to the top of the well. When pumping 3 L/min from 2.35 m depth, nearly all of the additional flow into the well originates from a depth between 30–34 m, with the remainder entering the well between 10–22 m depth, indicating the presence of conductive fractures within these depth ranges.
Figure 5.14 Calliper (a) and EM Flowmeter (b) profiles in the 203 mm open hole at the Mylor
investigation site in May 2005. Water level at time of measurement was ~1.25 m below surface. Diamonds on the flowmeter profile represent intervals where the packers were inflated to measure flow. The hole is PVC cased to a depth of 10 m.
(a) (b)
(a) (b)
0 4 8Flow (L/min)
120 160 200 240 280Calliper (mm)
80
70
60
50
40
30
20
10
0
Dep
th b
elow
gro
und
(m)
AmbientPumped

FIELD INVESTIGATIONS
Report DWLBC 2007/29 Groundwater recharge and flow investigations in the Western Mount Lofty Ranges, South Australia
34
5.3.4 HYDRAULICS
The average watertable elevations measured in September and November 2006 in the nested piezometers are shown in Figure 5.15. The primary y-axis shows the piezometer screen elevation, whilst the secondary y-axis shows the watertable elevation corrected to an RSWL in each of the piezometers. There is a head difference of 3 m between the deepest and shallowest piezometers at this site, with the highest head elevations at greater depth, creating a strong positive (upward) hydraulic gradient. The hydraulic gradient from 13–62 m is ~0.061 (3.00 m/49.0 m). This upward gradient explains the upward flows identified by the EM Flowmeter, as groundwater flows into the hole from near the bottom of the well, and flows out via fractures near the top of the well. Although there is a strong hydraulic gradient, the rate of ambient flow is low at ~1.5 L/min, suggesting that the fractures intersected by the well have a relatively low conductivity.
5.3.5 AQUIFER PUMPING TESTS
Aquifer pumping tests were successfully completed in all four piezometers at the Mylor investigation site. The bulk hydraulic conductivity (Kb) values were calculated by application of the Cooper-Jacobs straight-line method to the results of these tests. Fracture aperture (2b) values were also calculated for these four depths using equation 4.2 (section 4.4). The calculated values of Kb and 2b are highlighted in yellow in Table 5.3.
There was considerable drawdown of between 4–18 m in these piezometers with a pumping rate of only 1 L/min, indicating a very low yield and poorly connected fractures at all depths.
The pumping tests also showed very poor connectivity between piezometers. When any of the piezometers were pumped there was no measurable drawdown in the other piezometers, even with very high drawdown in the pumped piezometer.

FIELD INVESTIGATIONS
Report DWLBC 2007/29 Groundwater recharge and flow investigations in the Western Mount Lofty Ranges, South Australia
35
0 20 40 60Mid-screen of piezometer below ground (m)
240
250
260
270
280
290
300
310
320
Piez
omet
er s
cree
n el
evat
ion
(m A
HD
)
295.0
297.0
299.0
301.0
303.0
305.0
307.0
309.0
RSW
L (m
AH
D)
M1
M2
M3
Figure 5.15 Average watertable elevations in the nested piezometers
at the Mylor investigation site. The RSWL averaged from two measurements taken in September and November 2006 are shown against a scale of m AHD on the right-hand axis. Piezometer screen depths are plotted on a scale of m AHD on the left-hand vertical axis.

FIELD INVESTIGATIONS
Report DWLBC 2007/29 Groundwater recharge and flow investigations in the Western Mount Lofty Ranges, South Australia
36
Table 5.3 Aquifer properties determined from aquifer pumping tests and observations at the Mylor investigation site
Piezometer interval
Screen length
Drawdown log cycle
h0-h Flow rate
Constant discharge
rate Q
Transmissivity (Cooper-Jacobs)
T
Aquifer test bulk K
Kb
Fracture spacing
2B
Hydraulic gradient
dh/dx
Fluid density
ρ
Gravityg
Dynamic viscosity
μ
Fracture aperture
2b
Fracture aperture
2b
(m) (m) (L/min) (m3/d) (m2/d) (m/d) (m) (kg/m3) (m/s2) (kg/s/m) (m) (μm)
M1 6.0 2.465 1.1 1.584 0.118 0.020 0.1 0.007 1000 9.8 0.00114 3.163E-05 32
M2 6.0 14.02 0.6 0.864 0.011 0.002 0.1 0.007 1000 9.8 0.00114 1.448E-05 14
M3 6.0 6.67 1.1 1.584 0.043 0.007 0.1 0.007 1000 9.8 0.00114 2.270E-05 23
M4 6.0 9.7 0.85 1.224 0.023 0.004 0.1 0.007 1000 9.8 0.00114 1.839E-05 18

Report DWLBC 2007/29 Groundwater recharge and flow investigations in the Western Mount Lofty Ranges, South Australia
37
6. GROUNDWATER AGES AND DEPTH OF CIRCULATION
This chapter provides an examination and interpretation of the data sets that were used to establish a conceptual model of groundwater recharge mechanisms, vertical circulation and sources to the aquifer systems at the Forreston, Fox Creek and Mylor investigation sites.
6.1 FORRESTON INVESTIGATION SITE
6.1.1 MAJOR CHEMISTRY AND ISOTOPES
Figure 6.1 shows the measured total dissolved solids (TDS), chloride (Cl-), deuterium (δ2H) and pH profiles with depth at the Forreston investigation site. There is little change in either TDS or Cl- with depth, both increasing by ~20% between the shallowest piezometer at 16.5 m and the deepest at 74 m. The similarity between the Cl- and TDS depth profiles suggests that there is minimal change in hydrochemical composition with depth. There is no clear trend in changes of pH with depth.
There are some variations in δ2H ratio with depth, but these are not reflected in changes in Cl- or TDS concentrations, which would occur if the δ2H changes were a result of different degrees of evaporation prior to recharge. The variations in δ2H with depth are therefore interpreted to be a result of long-term periodic differences in rainfall δ2H over time at this location.
Chloride generally does not participate in common geochemical reactions that occur in aquifers and subsequently behaves as a conservative tracer until saturation is reached (Herczeg & Edmunds 1999). Rainwater in near-coastal areas typically has a major ion composition with the same proportions of the major ions as found in seawater.
6 7 8 9 106.5 7.5 8.5 9.5
pH-34 -32 -30 -28 -26 -24 -22 -20
δ2H (o/oo SMOW)0 2 4 6 8 10
Cl- (mmol/L)0 200 400 600 800 1000
TDS (mg/L)
80
60
40
20
0
Dep
th b
elow
gro
und
(m)
Figure 6.1 TDS, Cl-, δ2H and pH profiles sampled at the Forreston investigation site, January–February 2006. The depth shown for each data point represents the mid-point of the 3 m piezometer screen interval.

GROUNDWATER AGES AND DEPTH OF CIRCULATION
Report DWLBC 2007/29 Groundwater recharge and flow investigations in the Western Mount Lofty Ranges, South Australia
38
If the observed changes in groundwater TDS concentrations with depth are solely a result of evaporation prior to recharge, we should expect to see the changes in all of the major inorganic ions remain in the same proportion relative to Cl- as they are in the rainwater in the locale of the aquifer recharge. As the dissolved salts in near-coastal rainwater are derived from marine aerosols, the ratios of the major ions in rainwater are expected to be similar to those in seawater. Figure 6.2 shows the concentrations of major ions (Ca2+, Mg2+, Na+, K+, SO4
2- and HCO3-) against Cl- and their proximity to the respective seawater ion/Cl-
relationship. All the Forreston samples are closely grouped and plot well above the seawater ion/Cl- ratio in each ion/Cl- graph. This pattern suggests dissolution of ions as a result of interactions with soil or rock during or after recharge. The concentrations of the individual ions plotted here have increased independently of the Cl- concentration, implying that rainwater Cl- concentrations have not been affected by these water–rock interactions. The HCO3
- concentration is much higher than the other major ions relative to the seawater ratio, and this may be explained by dissolution of CO2 as the water passes through soil prior to recharging groundwater.
In all of these graphs, the groundwater from greater depths tends to plot further along the X and Y-axis, reflecting the slightly higher TDS at greater depth, as seen in Figure 6.2.
The most striking feature of the plots of the major cations against Cl- is the close grouping of all the groundwater samples from the Forreston site, indicating that groundwater at all depths appears to have undergone similar processes during and after recharge, suggesting strong hydrologic connection and a common recharge zone and flow path for the groundwater at all depths.
6.1.2 CARBON-14 AND CHLOROFLUOROCARBONS
The CFC-12 concentrations indicate relative groundwater ages. All of the CFC-12 concentrations of samples from the Forreston site were much greater than the present-day concentration of 240 pg/kg (Fig. 6.3) indicating contamination of these samples from a CFC-12 source other than atmospheric CFCs. Duplicate samples taken from this site in April 2006 were found to have similar CFC-12 concentrations to the January 2006 samples, confirming that the groundwater at this location is contaminated by a concentrated source of CFC-12. Although this source cannot be identified without further investigation, the CFC-12 concentrations appear to decrease with depth, suggesting dispersion from a source near the surface. While this contamination precludes the possibility of using CFC-12 concentrations for groundwater age dating at this site, the presence of CFC-12 at the deepest piezometer indicates that if the contamination source is near the surface, groundwater has reached that depth (76 m) since recharging at a time later than the introduction of CFC-12 in manufactured products in 1965. As illustrated by the data in Table 6.1, the presence of modern groundwater at all depths is also supported by the high 14C activities (92.2–98.7 pmC). Values of groundwater 14C activity (denoted as ‘A’ in Table 6.1) above 90 pmC are taken to be affected by post-1950 radiogenic 14C. Hence, both the CFC-12 concentrations and 14C activities suggest that groundwater at all depths sampled at this site has recharged within the last 50 years.

GROUNDWATER AGES AND DEPTH OF CIRCULATION
Report DWLBC 2007/29 Groundwater recharge and flow investigations in the Western Mount Lofty Ranges, South Australia
39
0 2 4 6 8 10Cl- (mmol/L)
0
1
2
3
4
5
HC
O3- (
mm
ol/L
)
16.5
22.5
25.5
31.5
36.554.061.0
74.0
0 2 4 6 8 10Cl- (mmol/L)
0
0.4
0.8
1.2
1.6
2
SO42-
(mm
ol/L
)
16.5
22.5
25.5
31.5
36.554.0
61.074.0
0 2 4 6 8 10Cl- (mmol/L)
0
0.1
0.2
0.3
0.4
0.5
K+
(mm
ol/L
)
16.522.5
25.531.5
36.5
54.061.0
74.0
0 2 4 6 8 10Cl- (mmol/L)
0
4
8
12
Na+
(mm
ol/L
)
16.5 22.5
25.531.5
36.554.0 61.0
74.0
0 2 4 6 8 10Cl- (mmol/L)
0
0.2
0.4
0.6
0.8
1
1.2
Mg2
+ (m
mol
/L)
16.5
22.5
25.5
31.5
36.554.0
61.0
74.0
0 2 4 6 8 10Cl- (mmol/L)
0
0.2
0.4
0.6
0.8
1C
a2+
(mm
ol/L
)
16.5
22.5
25.531.5
36.5
54.0
61.0
74.0
Figure 6.2 Composition diagrams of major ions versus Cl- sampled at the Forreston
investigation site, January–February 2006. The dashed line is the dilution line for the respective ion/Cl- ratio in seawater. Piezometer mid-screen depths are shown beside each point.

GROUNDWATER AGES AND DEPTH OF CIRCULATION
Report DWLBC 2007/29 Groundwater recharge and flow investigations in the Western Mount Lofty Ranges, South Australia
40
Figure 6.3 Depth profile of CFC-12 concentrations (a) and 14C activities (b) of groundwater from the nested piezometers at the Forreston investigation site. The average watertable depth was 12.9 m below surface in January 2006 when sampling was completed. The error bars represent the piezometer screen length from which the sample was taken.
Table 6.1 Uncorrected and corrected 14C ages for samples from the Forreston investigation site. Corrected ages are derived using the Fontes and Garnier (1979) correction model. Data on the sample δ13C and HCO3, and CO2 molar concentrations are used in the correction model. The values of both the δ13C and 14C activities of the FRA carbonates and soil CO2 are also used in the correction model. Values used here were: δ13Ccarbonate = -7.8o/oo, δ13CsoilCO2 = -13o/oo, Acarbonate = 0 pmC, AsoilCO2 = 85 pmC.
Sample Depth A (pmC) δ13C HCO3
(m) CO2 (m)
Uncorrected age (y)
Corrected age [F & G model] (y)
F1 16.5 94.25 -19.10 0.00290 0.00290 -592 969
F2 22.5 93.29 -17.90 0.00298 0.00298 -533 117
F3 25.5 97.10 -16.20 0.00290 0.00290 -763 -1 717
F4 31.5 98.70 -18.20 0.00314 0.00314 -856 35
F5 36.5 94.40 -17.20 0.00292 0.00292 -601 -558
F6 54.0 92.17 -17.10 0.00330 0.00330 -464 -514
F7 61.0 92.40 -17.00 0.00317 0.00317 -478 -622
F8 74.0 90.81 -17.30 0.00314 0.00314 -379 -245
0 20 40 60 80 100
14C (pmC)
80
60
40
20
0
Dep
th b
elow
gro
und
(m)
0 400 800 1200 1600 2000CFC-12 (pg/kg)
80
60
40
20
0
Dep
th b
elow
gro
und
(m)
(a) (b)

GROUNDWATER AGES AND DEPTH OF CIRCULATION
Report DWLBC 2007/29 Groundwater recharge and flow investigations in the Western Mount Lofty Ranges, South Australia
41
Because 14C activities above 90 pmC are considered to be affected by radiogenic carbon, the high 14C activities in these samples result in negative age values when used to derive an age for the groundwater samples (Table 6.1). Application of the Fontes and Garnier correction model to these values results in an inconsistent range of ages, which are not useful in understanding groundwater flow or recharge at this site. However, the high values are indicative of relatively young (<50 years) groundwater, suggesting a fairly high groundwater flow rate.
6.2 FOX CREEK INVESTIGATION SITE
6.2.1 MAJOR CHEMISTRY AND ISOTOPES
Figure 6.4 shows the measured TDS, Cl-, δ2H and pH profiles with depth at the Fox Creek investigation site. There is little change in either TDS or Cl- with depth. The Cl- concentration increases by ~19% between the shallowest piezometer at 14.6 m and the deepest at 59 m, while TDS increases by ~4% across this depth range. The similarity between the Cl- and TDS depth profiles suggests that there is minimal change in hydrochemical composition with depth. There is no clear trend in changes of pH with depth.
There are some variations in δ2H ratio with depth. The δ2H values appear to fall into two distinct groups, with more enriched values in the shallower part of the system and more depleted values in the deeper part. These differences are not reflected in changes in Cl- or TDS concentrations, which would be expected if the δ2H changes were a result of different degrees of evaporation prior to recharge. Aquifer pumping tests have indicated that there is good connection between all piezometers at this site. The variations in δ2H with depth are therefore interpreted to be a result of periodic differences in rainfall δ2H over time at this location.
6 7 8 9 106.5 7.5 8.5 9.5
pH-36 -34 -32 -30 -28 -26 -24 -22 -20
δ2H (o/oo SMOW)0 2 4 6 8 10 12
Cl (mmol/L)0 200 400 600 800 1000
TDS (mg/L)
60
40
20
0
Dep
th b
elow
gro
und
(m)
Figure 6.4 TDS, Cl-, δ2H, and pH profiles sampled at the Fox Creek investigation site, October
2006. The depth shown for each data point represents the mid-point of the 3 m piezometer screen interval.

GROUNDWATER AGES AND DEPTH OF CIRCULATION
Report DWLBC 2007/29 Groundwater recharge and flow investigations in the Western Mount Lofty Ranges, South Australia
42
Figure 6.5 shows the relationships of major ion (Ca2+, Mg2+, Na+, K+, SO42- and HCO3
-) concentrations with the Cl- concentration and their proximity to the respective seawater ion/Cl-relationship. Most of the ion/Cl- ratios lie away from the seawater ion/Cl- ratio, indicating that the hydrochemical composition is influenced by factors other than just evaporation and that groundwater at all sampled depths is influenced by water–rock interaction. There appear to be no trends in the position of samples from different depths in relation to the sea water dilution line in any of the graphs in Figure 6.5. The most striking feature of the plots is the close grouping of all the groundwater samples, indicating that groundwater at all depths appears to have undergone similar processes during and after recharge. This similarity in the chemical compositions probably reflects the strong hydrologic connection between depths observed in the aquifer pumping tests at this site and suggests a common recharge zone and flow path for the groundwater at all depths.
The ion/Cl- relationships for Na+, K+, and Mg2+ lie close enough to the seawater dilution line to be solely a result of evaporative concentration of rainwater. The Ca2+/Cl- and HCO3
-/Cl- ratios are both elevated with respect to the seawater ratios and probably indicate dissolution of CaCO3. However, whereas Ca2+ is elevated by ~0.6 mmol/L, HCO3
- is elevated by ~4 mmol/L, which must be largely due to soil CO2 dissolution prior to recharge. The SO4
2-/Cl- ratio is ~0.4 mmol lower in SO4
2- than the seawater ratio. This is probably a result of CaSO4 precipitation resulting from higher Ca2+ concentration after dissolution of CaCO3.
6.2.2 CARBON-14 AND CHLOROFLUOROCARBONS
The CFC-12 concentrations for the Fox Creek site (Fig. 6.6) are all low, with only the uppermost piezometer at 14.6 m having a concentration high enough to provide a definitive age of 38 years. Below that depth, the CFC-12 concentrations were sufficient only to show that the age of the groundwater is greater than 40 years.
The 14C activities at the Fox Creek site are all very low, indicating the groundwater here is quite old. Uncorrected 14C ages range from 7470 years at 14.6 m depth to 16 787 years at 59 m depth. When corrected according to the Tamers correction model (Table 6.2), which accounts for some carbonate dissolution (as identified in groundwater at this site in section 6.2.1), the ages range from 3569 years at 14.6 m depth to 12 926 years at 59 m depth.
The variation of 14C age with depth (Fig. 6.7) provides a uniform age gradient throughout the range of piezometer depths at this site. Both uncorrected and corrected ages provide an age gradient of 204 y/m.
For the 14.6 m depth, there is clearly a conflict between the 14C age of 3569 years and the CFC-12 age of 38 years. The aquifer pumping tests showed that groundwater at this location was very strongly connected between all piezometer depths, so the consistent 14C age gradient between 14.6 m and all the deeper piezometers tends to support the credibility of the 14C age rather than the CFC-12 age for the 14.6 m sample.

GROUNDWATER AGES AND DEPTH OF CIRCULATION
Report DWLBC 2007/29 Groundwater recharge and flow investigations in the Western Mount Lofty Ranges, South Australia
43
0 2 4 6 8 10 12Cl- (mmol/L)
0
1
2
3
4
5
HC
O3- (
mm
ol/L
)
14.6
19.526.5 28.5
33.0
37.0
38.549.0
59.0
0 2 4 6 8 10 12Cl- (mmol/L)
0
0.4
0.8
1.2
1.6
2
SO
2- (m
mol
/L)
0 2 4 6 8 10 12Cl- (mmol/L)
0
0.1
0.2
0.3
0.4
0.5K+
(mm
ol/L
)
14.6
19.526.5
28.5
33.0
37.038.5 49.0
59.0
0 2 4 6 8 10 12Cl- (mmol/L)
0
4
8
12
Na+
(mm
ol/L
)
14.619.5
26.5
28.533.0
37.0
38.549.0
59.0
0 2 4 6 8 10 12Cl- (mmol/L)
0
0.2
0.4
0.6
0.8
1
1.2
Mg2
+ (m
mol
/L)
14.6 19.5
26.5
28.5
33.037.0
38.5
49.059.0
0 2 4 6 8 10 12Cl- (mmol/L)
0
0.2
0.4
0.6
0.8
1C
a2+
(mm
ol/L
)
14.6
19.5
26.5 28.5
33.0
37.0
38.549.0
59.0
Figure 6.5 Composition diagrams of major ions versus Cl- sampled at the Fox Creek
investigation site in October 2006. The dashed line is the dilution line for the respective ion/Cl- ratio in seawater. Piezometer mid-screen depths are shown beside each point.

GROUNDWATER AGES AND DEPTH OF CIRCULATION
Report DWLBC 2007/29 Groundwater recharge and flow investigations in the Western Mount Lofty Ranges, South Australia
44
0 10 20 30 40 50CFC-12 (apparent age- yrs)
0 40 80 120CFC-12 (pg/kg)
70
60
50
40
30
20
10
0D
epth
bel
ow g
roun
d (m
)
Figure 6.6 Depth profile of CFC-12 concentrations and CFC-12 apparent ages of groundwater at the Fox Creek investigation site. All piezometers had standing water levels above surface level in October 2006 when sampling was completed. The error bars represent the piezometer screen length from which the sample was taken.
6000 8000 10000 12000 14000 16000 18000
14C (uncorrected age- yrs)0 20 40 60 80 100
14C (pmC)
70
60
50
40
30
20
10
0
Dep
th b
elow
gro
und
(m)
Figure 6.7 Depth profiles of 14C activities and 14C apparent ages from the piezometers at the Fox Creek investigation site, October 2006. The error bars represent the piezometer screen length from which the sample was taken.

GROUNDWATER AGES AND DEPTH OF CIRCULATION
Report DWLBC 2007/29 Groundwater recharge and flow investigations in the Western Mount Lofty Ranges, South Australia
45
Table 6.2 Uncorrected and corrected 14C ages for samples from the Fox Creek investigation site. Corrected ages are derived using the Tamers (1967) correction model. Data on the sample δ13C and HCO3, and CO2 molar concentrations are used in the correction model. The values of both the δ13C and 14C activities of the FRA carbonates and soil CO2 are also used in the correction model. Values used here were: δ13Ccarbonate = -7.8o/oo, δ13CsoilCO2 = -13o/oo, Acarbonate = 0 pmC, AsoilCO2 = 85 pmC.
Sample Depth A (pmC) δ13C
HCO3 (m)
CO2 (M)
Uncorrected age (y)
Corrected age [Tamers model] (y)
L1 14.60 23.1 -10.80 0.00407 0.00005 7 470 3 569
L2 19.50 18.4 -9.60 0.00379 0.00008 8 762 4 902
L4 26.50 16.31 -10.60 0.00394 0.00008 9 460 5 598
L5 28.50 12.78 -5.50 0.00374 0.00007 10 857 6 996
L6 33.00 17.44 -2.10 0.00395 0.00006 9 076 5 192
L7 37.00 15.2 -10.70 0.00387 0.00012 9 867 6 068
L8 38.50 11.7 -11.20 0.00400 0.00010 11 363 7 529
L9 49.00 7.47 -11.10 0.00380 0.00008 13 934 10 073
L10 59.00 4.5 -10.90 0.00354 0.00007 16 787 12 926
6.3 MYLOR INVESTIGATION SITE
6.3.1 MAJOR CHEMISTRY AND ISOTOPES
Figure 6.8 shows the measured TDS, Cl-, δ2H and pH profiles with depth at the Mylor investigation site.
The TDS and Cl- depth profiles are quite similar, both having significantly lower concentrations in the upper two piezometers than in the deeper two. The Cl- concentrations increase by ~70% between the two shallower piezometers at 14.6 and 27 m, and the two deeper ones at 45 and 62 m, while TDS increases by ~50% across this depth range.
6 7 8 9 10 11 12pH
-36 -34 -32 -30 -28 -26 -24 -22 -20δ2H (o/oo SMOW)
0 2 4 6 8 10 12 14Cl (mmol/L)
0 400 800 1200 1600TDS (mg/L)
80
60
40
20
0
Dep
th b
elow
gro
und
(m)
Figure 6.8 TDS, Cl-, δ2H, pH and profiles sampled at the Mylor investigation site, November 2006. The error bars represent the piezometer screen length from which the sample was taken.

GROUNDWATER AGES AND DEPTH OF CIRCULATION
Report DWLBC 2007/29 Groundwater recharge and flow investigations in the Western Mount Lofty Ranges, South Australia
46
The δ2H results show a trend of increasing depletion with depth. The aquifer pumping tests show there to be very little hydraulic connection between depths at this site, so any parameters that display a clear trend with depth in these piezometers is considered to be coincidental rather than evidence of greater residence time or temporal changes in recharge conditions.
The pH is ~8.1 at three of the four depths, but is 11.5 at 27 m. This is probably an anomalous result caused by contamination of the groundwater by cement in this piezometer.
The relationships of major ion (Ca2+, Mg2+, Na+, K+, SO42- and HCO3
-) concentrations with the Cl- concentration and their proximity to the respective seawater ion/ Cl- relationship are shown in Figure 6.9.
Most of the ion/Cl- ratios plot above the seawater ion/Cl- dilution line, indicating that the groundwater has gained solutes from water–rock interactions. The exception to this is the Mg/Cl relationship in the 27 m sample. At that depth, a degree of ion exchange appears to have occurred that has caused the water to lose Mg and gain K. This may be related to the unusually high pH found in that piezometer. Apart from this feature, all samples follow a similar pattern to the TDS differences with depth; the 45 and 62 m samples have ion concentrations ~40–80% higher than the 13 and 27 m samples.
6.3.2 CARBON-14 AND CHLOROFLUOROCARBONS
The CFC-12 concentrations for the Mylor investigation site (Fig. 6.10) show considerable variation with depth. While the shallowest sample at 13 m appears to be older than water at 27 and 45 m, there is a linear age gradient between 27–62 m. The greater age at 13 m implies that groundwater at that depth (and above) does not flow downwards to the 27 and 45 m depths. This concurs with the findings of the aquifer pumping tests, which showed no hydraulic connection between the depths of all four piezometers at this location.
The 14C activities (Fig. 6.11) range from ~20 to ~40 pmC, with a general trend of decreasing activity with depth. The corrected ages (Fontes & Garnier 1979 correction model, Table 6.3) indicate that the oldest groundwater is that at 13 m depth and that the ages range from ~3000 to ~5000 years. The conflict between these ages and the CFC-12 ages may be due to dissolution of fossil carbonates, which would artificially increase the age indicated by 14C activity.
Table 6.3 Uncorrected and corrected 14C ages for samples from the Mylor investigation site. Corrected ages are derived using the Fontes and Garnier (1979) correction model. Data on the sample δ13C and HCO3, and CO2 molar concentrations are used in the correction model. The values of both the δ13C and 14C activities of the FRA carbonates and soil CO2 are also used in the correction model. Values used here were: δ13Ccarbonate = -7.8o/oo, δ13CsoilCO2 = -13o/oo, Acarbonate = 0 pmC, AsoilCO2 = 85 pmC.
Sample Depth A (pmC) δ13C HCO3
(m) CO2 (m)
Uncorrected age (y)
Corrected age [F & G model] (y)
M1 13.0 38.8 -14.30 0.00400 0.00008 4 491 5 060
M3 45.0 18.5 -9.70 0.00720 0.00011 8 734 3 033
M4 62.0 24.7 -11.00 0.00625 0.00010 7 079 3 946
The 14C analysis of the 27 m sample was unsuccessful due to insufficient carbonate in the sample. This may be related to the unusually high pH found at that depth.

GROUNDWATER AGES AND DEPTH OF CIRCULATION
Report DWLBC 2007/29 Groundwater recharge and flow investigations in the Western Mount Lofty Ranges, South Australia
47
0 2 4 6 8 10 12 14Cl- (mmol/L)
0
1
2
3
4
5
6
7
8
HC
O3- (
mm
ol/L
)
13.0
27.0
45.0
62.0
0 2 4 6 8 10 12 14Cl- (mmol/L)
0
0.4
0.8
1.2
1.6
2
SO
2-(m
mol
/L)
13.0
27.0
45.0
62.0
0 2 4 6 8 10 12 14Cl- (mmol/L)
0
0.2
0.4
0.6
0.8K
+ (m
mol
/L)
13.0
27.0
45.0
62.0
0 2 4 6 8 10 12 14Cl- (mmol/L)
0
4
8
12
16
Na+
(mm
ol/L
) 13.0
27.0
45.062.0
0 2 4 6 8 10 12 14Cl- (mmol/L)
0
0.4
0.8
1.2
1.6
2
2.4
Mg2
+ (m
mol
/L)
13.0
27.0
45.0
62.0
0 2 4 6 8 10 12 14Cl- (mmol/L)
0
0.4
0.8
1.2
1.6
2C
a2+
(mm
ol/L
)
13.0
27.0
45.0
62.0
Figure 6.9 Composition diagrams of major ions versus Cl- sampled at the Mylor
investigation site in November 2006. The dashed line is the dilution line for the respective ion/Cl- ratio in seawater. Piezometer mid-screen depths are shown beside each point.

GROUNDWATER AGES AND DEPTH OF CIRCULATION
Report DWLBC 2007/29 Groundwater recharge and flow investigations in the Western Mount Lofty Ranges, South Australia
48
10 20 30 40CFC-12 (apparent age- yrs)
0 40 80 120 160 200CFC-12 (pg/kg)
60
40
20
0D
epth
bel
ow g
roun
d (m
)
Figure 6.10 Depth profile of CFC-12 concentrations and CFC-12 apparent ages of groundwater from the piezometers at the Mylor investigation site in November 2006. At the time samples were taken, standing water levels were 3.5 m below surface in M1 and M2, 1.91 m in M3 and 0.51 m in M4. The error bars represent the piezometer screen length from which the sample was taken.
2000 4000 6000 8000 10000
14C (uncorrected age- yrs)0 20 40 60 80 100
14C (pmC)
60
40
20
0
Dep
th b
elow
gro
und
(m)
Figure 6.11 Depth profiles of 14C activities and 14C apparent ages from the piezometers at the Mylor investigation site, November 2006. The error bars represent the piezometer screen length from which the sample was taken.

Report DWLBC 2007/29 Groundwater recharge and flow investigations in the Western Mount Lofty Ranges, South Australia
49
7. VERTICAL FLOW RATES AND AQUIFER RECHARGE
7.1 STABLE ISOTOPES OF WATER The isotopic signatures of the groundwater samples from the Forreston, Fox Creek and Mylor investigation sites all plot to the left of the mean weighted rainfall for Adelaide (δ2H = -4.4‰ and δ18O = -23.8‰; Fig. 7.1) and above the local meteoric water line (based on local Adelaide rainfall events). This implies that recharge of the groundwater at these sites occurs during the winter months as the isotopic signatures of winter rainfall are typically depleted with respect to the mean. At all three locations there is some enrichment of δ2H in the shallower piezometers compared to the deeper ones. This is more apparent in the plot of δ2H against chloride (Fig. 7.2). Cl- concentrations are approximately the same at all depths, but the δ2H ratio varies, with more depleted values at greater depths. This pattern suggests either that groundwater at the shallower depths has been subject to more evaporation prior to recharge, or that the groundwater at greater depths has been recharged during conditions in which winter recharge is more dominant. The isotopic ratios fall into three distinct groups for the three sites, with Fox Creek samples being more isotopically depleted than Mylor samples, and Forreston samples being the most enriched of the three groups. This variation between locations probably reflects differences in the isotopic signatures of rainfall in each location, caused by differences in altitude of the rainfall, and the nature of the recharge process, which may be more summer or winter-dominant in some areas compared to others.
Plotting δ2H against Cl- illustrates that isotopic differences between the three sites and within the three sites are probably not due to evaporation during recharge (Fig. 7.2). While samples from the Fox Creek and Mylor sites have higher Cl- concentrations than samples from the Forreston site, they are isotopically depleted. Also, among the samples at each location, there is no trend of increasing Cl- concentration with increasing enrichment. The only apparent trends are an enrichment of δ2H with depth at each location and an increase in Cl- concentration with depth at the Mylor site (sample depths are shown as a figure against each data point in Figs 7.1 and 7.2).
7.2 CARBON-14 AND CHLOROFLUOROCARBONS
7.2.1 FORRESTON INVESTIGATION SITE
Due to contamination of groundwater at the Forreston site with CFCs from a non-atmospheric source, the CFC-12 data from this site cannot be used to determine the groundwater age gradient required to derive a recharge estimate from the parallel plate model. Furthermore, the high 14C activities found in these samples indicates that they are affected by atmospheric 14C from the post-thermonuclear testing period, making them unsuitable for groundwater age-dating to provide a groundwater age gradient for the 14C vertical plate recharge model. However, if the sources of both the 14C and CFC-12 found at

VERTICAL FLOW RATES AND AQUIFER RECHARGE
Report DWLBC 2007/29 Groundwater recharge and flow investigations in the Western Mount Lofty Ranges, South Australia
50
-6.5 -6 -5.5 -5 -4.5 -4 -3.5 -3 -2.5δ18O (‰ VSMOW)
-40
-38
-36
-34
-32
-30
-28
-26
-24
-22
-20
-18
-16
-14
-12
-10
δ2 H (‰
VS
MO
W)
13.0
27.045.0
62.0
14.6
19.5
26.5
28.5
33.0
37.038.5
49.0
59.0
16.5
22.5
25.5
31.5
36.554.0
61.074.0
ForrestonFox CreekMylorLMWLAdelaide rainfallAverage Adelaide rainfall
Figure 7.1 Isotopes δ2H and δ18O of groundwater samples at the Forreston, Fox Creek and Mylor investigation sites. The LMWL for Adelaide is
δ2H = 7.7, δ18O = 9.9. Adelaide rainfall samples are from GNIP, Adelaide (-34.93, 138.58), 43 m AHD, taken between 1962 and 1976. The mean weighted rainfall for Adelaide is δ2H = -23.8‰ and δ18O = -4.4‰. Piezometer mid-screen depths are shown beside each point.

VERTICAL FLOW RATES AND AQUIFER RECHARGE
Report DWLBC 2007/29 Groundwater recharge and flow investigations in the Western Mount Lofty Ranges, South Australia
51
0 100 200 300 400 500 600 700 800 900 1000Chloride (mg/L)
-36
-34
-32
-30
-28
-26
-24
-22
-20
-18
-16
δ2 H (‰
VS
MO
W)
13.0
27.0
45.0
62.0
14.6 19.5
26.5
28.5
33.0
37.0
38.549.0
59.0
16.5
22.525.5
31.5
36.554.0
61.0
74.0
8-Oct-03
24-Jun-05
3-Apr-2003
8-Oct-2003
4-Mar-2005
ForrestonFox CreekMylorEchunga rainfallMt Pleasant rainfall
Figure 7.2 δ2H versus Cl- of the groundwater samples collected at the Forreston, Fox Creek and Mylor investigation sites. Rainfall samples
collected at Mount Pleasant stream gauge station (Apr-2003, Oct-2003, Mar-2005) and Echunga pluviometer (Oct-2003, Feb-2005, Jun-2005). Piezometer mid-screen depths are shown beside each point.

VERTICAL FLOW RATES AND AQUIFER RECHARGE
Report DWLBC 2007/29 Groundwater recharge and flow investigations in the Western Mount Lofty Ranges, South Australia
52
all piezometer depths are from recent decades (post-thermonuclear testing and during CFC-12 production), we can ascribe a maximum age to the water at all depths: 41 years for the CFC-12 concentrations and ~50 years for the 14C activities.
There is a fairly linear increase in CFC concentration with depth, suggesting that CFC is dispersing from a source close to the surface. If a maximum age of 41 years is assumed for this source, then the age gradient between the watertable and the deepest piezometer at 63.5 m below the watertable is 0.65 y/m (41 y/63.5 m). Using equation 4.6, the average equivalent fracture aperture, determined from aquifer tests carried out on the nested piezometers, is 103 μm with a groundwater velocity through the fractures of 4.9 m/d. A mean fracture spacing of 0.013 m and an average bulk hydraulic conductivity of 6.5 m/d was applied according to outcrop measurements and the single-well aquifer pumping tests conducted at the site. Values of matrix diffusion coefficient and matrix porosity were assumed to be 10-4 m2/y and 0.02, respectively. The values are the same as those used in the investigation by Love et al. (2002) in the Clare Valley where the targeted geology type was the Saddleworth Formation. The latter is dominated by siltstone, shale and dolomite, and has similar lithological characteristics to the Woolshed Flat Shale found at the Forreston investigation site.
To apply the parallel plate model in this case, the growth rate of CFC-12 was assumed to be zero to reflect a constant CFC-12 source. Applying the parallel plate model (equations 4.3 and 4.4), and using the parameter values listed above, the average vertical flow rate in the fracture is 0.013 m/d and the aquifer recharge rate is 44 mm/y.
If the 50 years maximum age for the 14C activity in the deepest piezometer is applied in the parallel plate model, with the aquifer parameters as above, the vertical 14C groundwater age/depth gradient of 0.79 y/m results in an average vertical flow rate in the fractures of 0.010 m/d and an aquifer recharge rate of 38 mm/y.
The accuracy of the parallel plate model depends largely on the estimated fracture spacing, matrix porosity and matrix diffusion coefficient, and to a lesser extent the hydraulic conductivity (Cook & Simmons 2000). In the application of the model here, it is even more dependent on the assumed age of the groundwater at depth, for which we have assumed a maximum age of 40–50 years. As this is a maximum age for the groundwater, providing the minimum possible age gradient, the results of 44 and 38 mm from the CFC-12 and 14C methods, respectively, must be considered to be minimum recharge rates. If the groundwater age at 63.5 m below the watertable is instead assumed to be only 20 years, then the resulting recharge rate for both the CFC-12 and 14C parallel plate models becomes 94 mm/y.
The CMB method provides a further option for the determination of recharge rates at this site (section 7.2). While recharge estimates using the CMB method alone may be questionable in many cases, the CFC-12 and 14C results are useful in supporting CMB recharge estimates determined for this site. The high 14C activities indicate that there is young groundwater, of less than 50 years, to a depth of 74 m. The high CFC concentrations at that depth also indicate that if there is a source of CFC-12 close to the surface near this site, and that CFC-12 is dispersing downward from that source, then it has reached a depth of 74 m since the source was first located here. Also, the uniform distribution of the 14C activities with depth and the consistent gradient of the CFC-12 concentrations with depth suggest the flow of groundwater here is predominantly downward through unconfined fractures. For water to have reached a depth of 74 m in less than 50 years, it must be infiltrating rapidly to this depth, reducing the likelihood of chloride contamination from water–rock interactions. These

VERTICAL FLOW RATES AND AQUIFER RECHARGE
Report DWLBC 2007/29 Groundwater recharge and flow investigations in the Western Mount Lofty Ranges, South Australia
53
findings suggest that if chloride concentrations of samples from these wells are used to determine recharge with the CMB method (section 7.2.1), the resulting recharge probably accurately reflects direct recharge occurring in the locality of the well.
7.2.2 FOX CREEK INVESTIGATION SITE
The 14C results from the Fox Creek investigation site produce a consistent trend of increasing age with depth, from 3500 years at 14.6 m depth to ~13 000 years at 59 m depth, when ages are corrected using the Tamers correction model. The resulting age gradient is 204 y/m. In the vertical plate recharge model, average fracture apertures and fracture spacings of 65 μm and 80 mm, respectively, were used, according to measurements made at outcrops close to the Fox Creek site. Values for the matrix porosity and diffusion coefficient were the same as used for the Forreston site due to the similarity in rock types. These are the same as at the Clare Valley site where the values were measured (Love et al. 2002). The resulting recharge rate according to the model is 0.1 mm/y. This is effectively a zero recharge rate within the accuracy of the parallel plate model. This may be indicative that recharge does not occur locally at this site but that groundwater arrives at this location via an intermediate flow system. This hypothesis is supported by the hydraulic potential measurements at this site, which show that there is an upward gradient in the groundwater head. Furthermore, the groundwater at this location is artesian during the wetter part of the year, which would prevent recharge from occurring locally.
In view of the estimated age of the water here, the absence of significant CFC-12 concentrations in the majority of samples is to be expected. Only the shallowest piezometer (14.6 m) shows a measurable CFC-12 concentration that could be used to derive an age gradient between the watertable and that depth for use in the vertical plate recharge model. Furthermore, the presence of a small amount of CFC-12 conflicts with the 14C date for this depth by ~3500 years. Either the CFC-12 result for the 14.6 m piezometer was affected by atmospheric CFC contamination during sampling, or the ages indicated by the 14C method are incorrect, perhaps because the Tamers correction model has not sufficiently corrected for dissolution of fossil carbonates. If the latter is true, a groundwater age gradient can be derived from the 38-year CFC-12 age at 14.6 m depth over the 14 m from there to the watertable and applying the resulting gradient (2.7 y/m) to the CFC-12 vertical plate recharge model. The resulting recharge rate is 4.0 mm/y. However, as the application of the parallel plate model here is reliant on the age gradient between the 14.6 m piezometer and the watertable depth, this result is only valid if groundwater occurring here is recharging locally, which does not appear to be the case.
If the groundwater found at this location recharges elsewhere and arrives here via an intermediate or regional flow system, the CMB method may be the best way to estimate the recharge rate of water found at this location (section 7.2.2).
7.2.3 MYLOR INVESTIGATION SITE
The 14C results for this investigation site show no clear age gradient with depth. The corrected 14C ages (according to the Fontes & Garnier model, Table 6.3) show the water decreasing in age between 13–45 m depth, and then increasing between 45–62 m, while the uncorrected ages show the converse of this. Aquifer pump testing at the Mylor investigation site show that there is no hydraulic connection between the four depths of the piezometers.

VERTICAL FLOW RATES AND AQUIFER RECHARGE
Report DWLBC 2007/29 Groundwater recharge and flow investigations in the Western Mount Lofty Ranges, South Australia
54
Measurements of piezometric head levels also show that there is an upward hydraulic gradient between these depths. It can therefore be surmised that there is no downward flow of localised recharge between these depths and that groundwater arrives at this location via an intermediate or regional flow system. The parallel plate model is therefore not applicable between the depths of the piezometers at this site. However, we can apply the model using the age gradient between the watertable and the shallowest piezometer at 13 m depth if we assume that the aquifer is unconfined at that depth.
According to measurements made at outcrops close to the Mylor site, average fracture apertures and fracture spacings of 16 μm and 50 mm, respectively, were used in the vertical plate recharge model. Values used for the diffusion coefficient and matrix porosity were 10-3 m2/y and 0.05, respectively. These are significantly higher than the values of these parameters at the other two investigation sites, intending to reflect the greater porosity of the Aldgate Sandstone matrix at this location. The corrected 14C age (Fontes & Garnier correction) in the 13 m piezometer is 5060 years, and the 14C age gradient between the watertable at 2.7 m and the 13 m piezometer is 491 y/m (5060 years over 10.3 m). The resulting recharge rate according to the model is 0.38 mm/y. Within the accuracy of the parallel plate model, this is effectively a zero recharge rate. This result confirms that recharge of the groundwater at this site, even at 13 m depth, does not occur locally but arrives at this location via an intermediate flow system.
The CFC-12 age derived for the 13 m piezometer is 41 years, based on a very low CFC-12 concentration of 26 pg/kg. The resulting CFC-12 age gradient between the watertable and this piezometer is 4 y/m (41 years over 10.3 m). Using the same values for the aquifer parameters as in the 14C calculation above, the parallel plate model produces a recharge rate of 12 mm/y. However, this is based on a very low CFC-12 concentration in the sample from this piezometer. Considering the large discrepancy between the CFC-12 age of 41 years and the corrected 14C age of 5060 years, it may be that the small amount of CFC in this sample was a result of contamination with atmospheric CFC during sampling.
If the groundwater found at this location recharges elsewhere and arrives here via an intermediate regional flow system, the CMB method may be the best way to estimate the groundwater recharge rate at this investigation site (section 7.2.3).
7.3 CHLORIDE MASS BALANCE Estimates of recharge using the CMB method have been made using Cl- concentrations of samples from each piezometer at the investigation sites (Fig. 7.3). The rainfall Cl- concentration is derived from an average of Cl- in rain collected in pluviometers at Mt Pleasant and Echunga between 2002–05. The Mount Pleasant Cl- average is used for the Forreston and Fox Creek CMB calculations and the Echunga average is used for Mylor CMB calculations. A runoff fraction of 10% of rainfall was assumed in these calculations.
7.3.1 FORRESTON INVESTIGATION SITE The groundwater age indicators at the Forreston investigation site (section 7.1.1) show that water is young at all of the depths sampled, and probably less than 50 years old. All major ions in these samples show a similar relationship to Cl-, indicating a common flow path for water at all depths and suggesting vertical flow at this location. These are ideal conditions for

VERTICAL FLOW RATES AND AQUIFER RECHARGE
Report DWLBC 2007/29 Groundwater recharge and flow investigations in the Western Mount Lofty Ranges, South Australia
55
0 10 20 30 40 50 60 70 80 90 100Recharge (mm/y)
80
60
40
20
0
Dep
th b
elow
gro
und
(m)
0 10 20 30 40 50 60 70 80 90 100Recharge (mm/y)
80
60
40
20
0
Dep
th b
elow
gro
und
(m)
0 10 20 30 40 50 60 70 80 90 100Recharge (mm/y)
80
60
40
20
0D
epth
bel
ow g
roun
d (m
)
Figure 7.3 Vertical distribution of recharge estimates according to the CMB method at the Forreston (a), Fox Creek (b) and Mylor (c) investigation sites
the application of the CMB method, and provide some confidence in estimates of contemporary recharge rates using the method at this site. The recharge estimates, according to the CMB method, at the Forreston investigation site decreased with depth ranging from 61 mm at 16.5 m depth to 47 mm at 74 m depth. The latter corresponds closely to the CFC-12 parallel plate model recharge estimate that assumes groundwater in the 74 m piezometer is 41 years old. The apparent trend of increase in recharge rate at shallower depths suggests either that recharge has steadily increased in the past 40–50 years, or that there is some change of the groundwater Cl- concentration at greater depth due to longer residence time. In either case, the estimate of 61 mm at the depth of the 16.5 m piezometer is considered to be the closest to the present-day recharge rate.
The SA Geodata drillhole database contains details of 157 wells with known groundwater Cl-
concentrations in the ORC and TRC (Fig. 7.4). Of these, 18 are in the same geological formation as the Forreston investigation site. When the CMB recharge method is applied to the data for these wells, using an average Cl- concentration from the Mount Pleasant and Echunga pluviometers of 7.9 mg/L, the 18 resulting recharge estimates have a mean of 66 mm/y and a median of 50 mm/y. The proximity of this average to the Forreston CMB recharge estimate of 61 mm/y reinforces the credibility of that estimate.
7.3.2 FOX CREEK INVESTIGATION SITE
For the Fox Creek investigation site, the CMB method was applied using the same values for the runoff fraction and the rainfall concentration as for the Forreston site. The resulting recharge estimates, illustrated in Figure 7.1, are considerably lower than those at the Forreston site, ranging from 21 mm/y at 14.6 m depth, to 17.3 mm/y at 59 m depth. However, the groundwater age indicators show groundwater at this site to be relatively old and increasing in age significantly with depth, suggesting that if there is a vertical displacement of recharging water, then recharge rates are low. However, the age of the groundwater here also means that the CMB method of recharge estimation provides an estimate of recharge
(a) (b) (c)

750
700
800
650
600
550
850
500
900
450
950
1000
850
750
450
750
650
500
650
600
550
650
700
800
850
800
800
850
650
650
750
800
850
MYLOR
NAIRNE
ECHUNGA
OAKBANK
HAHNDORF
ADELAIDE
BIRDWOOD
LOBETHAL
WOODSIDE
GUMERACHA
KERSBROOK
ROSTREVOR
SALISBURY
KANGARILLA
SUMMERTOWN
BRIDGEWATER
MOUNT BARKER
MACCLESFIELD
TEA TREE GULLY
BLEWITT SPRINGS
Chloride Mass Balance Recharge Estimates for Wellsin the Torrens and Onkaparinga River Catchments
M:\P
roje
cts_
GW
\Mt_
Lofty
_Ran
ges\
Wes
tern
MLR
\WM
LR R
echa
rge\
Wor
k Te
mp\
Tor
rens
_Onk
ap_C
MB
.mxd
3r
d M
ay 2
007
Gre
enG
01
Forreston Investigation Site
Fox CreekInvestigation Site
MylorInvestigation Site
Onkaparinga River Catchment
River Torrens Catchment
© Government of South Australia, through the Department of Water,Land and Biodiversity Conservation 2007.
DISCLAIMER The Department of Water, Land and Biodiversity Conservation, its employeesand servants do not warrant or make any representation regarding the use,or results of use of the information contained herein as to its correctness,accuracy, currency or otherwise. The Department of Water, Land and BiodiversityConservation, its employees and servants expressly disclaim all liability orresponsibility to any person using the information or advice contained herein.
Produced By: Mt Lofty Ranges Team Knowledge and Information Division Department of Water, Land and Biodiversity ConservationProjection: Transverse MercatorDatum: Geocentric Datum of Australia 1994 Date: May 2007
Saddleworth Formation
Stonyfell Quartzite
Mundallio Subgroup
Emeroo Subgroup
Barossa Complex
Geology
Belair Subgroup
Quaternary and Tertiary sediments
Cape Jervis Formation
Kanmantoo Group
Wilpena Group
Umberatana Group
Groundwater investigation site
0 2 4 6 8 10 km
Estimated Recharge(mm/y)
140 - 225
80 - 14040 - 8020 - 401.3 - 20
Catchment boundaryStream
Town
Annual rainfallisohyet (50 mm)

VERTICAL FLOW RATES AND AQUIFER RECHARGE
Report DWLBC 2007/29 Groundwater recharge and flow investigations in the Western Mount Lofty Ranges, South Australia
57
during conditions that were present thousands of years ago, at which time surface vegetation and climate may have been considerably different from current conditions. If these CMB recharge estimates are to be used, then the figure of 21 mm/y resulting from the youngest water nearest the surface would be the more representative of present-day recharge.
SA Geodata has data for only three wells with known groundwater Cl- concentrations in Saddleworth Formation in the ORC and TRC (Fig. 7.4). The CMB recharge estimates based on the chloride concentrations in these three wells have a mean of 13.9 mm/y and a median of 14.6 mm/y.
A recharge estimate of 15 mm/y was determined using CFC-12 and 14C in a parallel plate model for a DWLBC investigation site in the Burra Creek Catchment (Banks et al. 2007), also in Saddleworth Formation geology. However, rainfall is considerably lower in that catchment compared to the Fox Creek site. If the Burra Creek recharge estimate is scaled up according to the difference in rainfall between that catchment and the Fox Creek site, the result is a comparative recharge estimate of 25.5 mm/y.
7.3.3 MYLOR INVESTIGATION SITE
At the Mylor site, the CMB recharge estimates range between 13 mm/y at 62 m depth and 20 mm/y at 27 m depth. The poor hydraulic connection between different depths at the site suggests that lateral flow of groundwater is present and that recharge may occur in another area. Sampling from this location shows significantly differing major chemistry in water at each depth, indicating that significant water–rock interaction processes may have occurred which may have affected Cl- concentrations. As a result, the CMB method may be inaccurate in estimating recharge rates.
The investigation well at Mylor is in Aldgate Sandstone (Burra Group). SA Geodata has data for 14 wells with known groundwater Cl- concentrations in Burra Group sandstone in the ORC and TRC (Fig. 7.4). The CMB recharge estimates based on the recorded Cl- concentration for these wells have a mean of 114 mm/y and a median of 119 mm/y. This average may provide a more accurate indication of the recharge rate in this geology type within the WMLR catchments than CMB estimates based on Cl- concentrations at the Mylor investigation site. While it is not recommended that this average be taken as the recharge rate for the Mylor site, it may be reasonable to use this as a value on which to base recharge estimates for other areas of similar geology in the WMLR. The groundwater wells that provide this average are all located between Bridgewater and Summertown, where annual rainfall is ~1000 mm/y. Most other areas in the WMLR have lower annual rainfall. A scaling of the average of 114 mm/y according to rainfall may provide a reasonable approximation of recharge in areas of the WMLR within Burra Group geology. For the Mylor investigation site where rainfall is 850 mm/y, the scaled recharge approximation is 114 mm/y x 850/1000 = 97 mm/y.

Report DWLBC 2007/29 Groundwater recharge and flow investigations in the Western Mount Lofty Ranges, South Australia
58

Report DWLBC 2007/29 Groundwater recharge and flow investigations in the Western Mount Lofty Ranges, South Australia
59
8. HORIZONTAL FLOW VELOCITIES
This chapter describes the horizontal flow velocities according to measured Radon-222 (222Rn) concentrations at the Forreston, Fox Creek and Mylor investigation sites. An understanding of horizontal flow rates is important to the estimation of groundwater recharge rates because the derivation of recharge rate from the age of groundwater at a depth is affected by the pathway that the groundwater has taken to reach that depth.
8.1 FORRESTON INVESTIGATION SITE 222Rn concentrations prior to purging range from 2.1 to 104 Bq/L (Fig. 8.1), with the high values at two distinct depths of 22–25 and 74 m. The relatively high 222Rn concentrations indicate that there is some active groundwater movement through the screens at those depths. At all other depths, the unpurged 222Rn concentrations are very low. 222Rn concentrations increased significantly after purging, ranging from 82 to 209 Bq/L. The purged samples represent groundwater sourced directly from the aquifer. The high purged 222Rn values at some depths, which were very low prior to purging, indicate that horizontal flow at those depths is very low. Conversely, the relatively small difference in the purged 222Rn concentrations at depths that had high 222Rn concentrations prior to purging indicates relatively high horizontal flow rates. This is apparent in the graph of unpurged to purged (C/Co) 222Rn ratios (Fig. 8.1). The variation in purged 222Rn concentrations with depth most likely reflects differing mineralogy and the physical characteristics of the fracture(s) intersecting the piezometer screens.
Using equation 4.9, the horizontal flow velocities at each of the sampled piezometers were calculated. The three depths with relatively high C/Co ratios are shown to have flow velocities of 8, 11 and 67 m/y. These findings suggest that there is a significant fracture intersecting the piezometer screen at ~22 m depth, and less significant fractures intersecting the screens at depths of 26 and 74 m. At all other depths, the horizontal flow rates are close to zero, which supports the suggestion that the majority of groundwater flow at this location is vertical in response to direct local recharge.
8.2 FOX CREEK INVESTIGATION SITE 222Rn concentrations prior to purging range from 1.8–15.6 Bq/L, with an increase in concentrations observed between 30–40 m depth (Fig. 8.2). Concentrations after purging range from 23–65 Bq/L, with the highest concentrations occurring in the uppermost piezometers between 15–20 m depth. The resulting ratios of 222Rn concentrations before and after purging (C/Co) show a fairly steady increase with increasing depth from 15–40 m, but then abruptly decrease at depths below 40 m. The corresponding horizontal flow rates, calculated using equation 4.9, display a similar pattern of increase towards 40 m depth to a maximum horizontal flow rate of 18.8 m/y at 38.5 m depth. Below this there is an abrupt decrease in horizontal flow, which may be indicative of a discontinuity between fractures above and below 40 m depth.

HORIZONTAL FLOW VELOCITIES
Report DWLBC 2007/29 Groundwater recharge and flow investigations in the Western Mount Lofty Ranges, South Australia
60
0
10
20
30
40
50
60
70
80
0 50 100 150 200Unpurged (C) 222Rn (Bq/L)
Dep
th b
elow
gro
und
(m)
0 100 200 300 400Purged (Co) 222Rn (Bq/L) C/Co
0.0 0.5 1.0 -50 0 50 100Flow (m/y)
Figure 8.1 Horizontal flow rates at the Forreston investigation site derived from ratios of
unpurged (C) to purged (Co) 222Rn concentrations in piezometers. Error bars show length of screen interval.
0
10
20
30
40
50
60
70
0 10 20 30 40 50Unpurged (C) 222Rn (Bq/L)
Dep
th b
elow
gro
und
(m)
0 25 50 75 100Purged (Co) 222Rn (Bq/L)
0.0 0.5 1.0C/Co
0 10 20 30Flow (m/y)
Figure 8.2 Horizontal flow rates at the Fox Creek investigation site derived from ratios of
unpurged (C) to purged (Co) 222Rn concentrations in piezometers sampled during March 2006 (purged samples) and October 2006 (unpurged samples). Error bars show length of screen interval.
Aquifer testing at this site shows there is strong hydraulic connection between all the piezometer depths. The results of the 14C and CFC-12 recharge models indicate it is unlikely that any direct recharge occurs at this location, implying that the groundwater here arrives via an intermediate regional flow system. The 222Rn analyses indicate that this flow is primarily between 30–40 m depth. The strong hydraulic connection from 14–60 m allows inflowing water to be transmitted throughout this depth range.

HORIZONTAL FLOW VELOCITIES
Report DWLBC 2007/29 Groundwater recharge and flow investigations in the Western Mount Lofty Ranges, South Australia
61
8.3 MYLOR INVESTIGATION SITE Concentrations of 222Rn prior to purging range from 1–5.9 Bq/L, with the highest value occurring in the shallowest piezometer at 13 m depth (Fig. 8.3). Aquifer testing shows that there is no connection between groundwater at the depths of the four piezometers in this well. The ratios of 222Rn concentrations before and after pumping (C/Co) show minimal variation between these four depths. The resulting calculated horizontal flow rates are low at all four depths, with a maximum flow rate of 2.5 m/y at 13 m. These low flow rates concur with the results of the aquifer testing, which showed very low transmissivity values at all piezometer depths.
0
10
20
30
40
50
60
70
0 10 20 30 40 50Unpurged (C) 222Rn (Bq/L)
Dep
th b
elow
gro
und
(m)
0 25 50 75 100Purged (Co) 222Rn (Bq/L)
0.0 0.2 0.4 0.6C/Co
0 2 4 6Flow (m/y)
Figure 8.3 Horizontal flow rates at the Mylor investigation site derived from ratios of
unpurged (C) to purged (Co) 222Rn concentrations in piezometers sampled during November 2006. Error bars show length of screen interval.

Report DWLBC 2007/29 Groundwater recharge and flow investigations in the Western Mount Lofty Ranges, South Australia
62

Report DWLBC 2007/29 Groundwater recharge and flow investigations in the Western Mount Lofty Ranges, South Australia
63
9. CONCLUSIONS AND RECOMMENDATIONS
Hydrochemistry, isotopes, CFCs and radiogenic tracer profiles, together with geological mapping and aquifer tests, carried out at the Forreston, Fox Creek and Mylor investigation sites in the ORC and RTC, have been used to characterise groundwater flow processes and determine estimates of aquifer recharge.
The aquifer tests at the Forreston site indicate a freely flowing FRA at the depths of all piezometers. The EM flowmeter results also indicate there are conducting fractures at all depths under pumped conditions. The results of horizontal flow models based on 222Rn activities show that the wells intercept fractures at ~22–25 m depth that, under normal conditions, conduct a significant horizontal flow of ~67 m/y. A lesser flow of 8–11 m/y occurs at 74 m depth, but there appears to be negligible horizontal flow at other depths.
The CFC-12 parallel plate model indicates that if the water at 74 m depth has an age of 40 years, the recharge rate at the Forreston site is 44 mm/y. This can be considered the minimum of the range of possible recharge rates for this site. The CMB recharge estimate is slightly greater at 47 mm/y for the 74 m depth, with higher values at shallower depths. The agreement of the CMB and CFC-12 models suggests that the CMB method is providing a good indication of recharge rates. The more recently recharged water closer to the surface has Cl- concentrations that result in higher CMB recharge estimates. In view of the very similar hydrochemical compositions throughout the depths sampled here, it is reasonable to assume the change in Cl- concentrations with depth is due to changes in the recharge rate over time. The CMB estimate of 61 mm/y for the most recent (shallowest) recharge is the best approximation of the contemporary recharge rate at this site.
At the Fox Creek investigation site, the aquifer tests show very strong hydraulic connection between all depths, although the aquifer here is artesian during the winter, implying that it is confined above the shallowest piezometer (14.6 m). In view of this finding, together with the observed upward hydraulic gradient between the deepest and shallowest piezometers, it is surmised that there is no downward flow and therefore no local recharge to the FRA at this location. The water at Fox Creek appears to be very old, with 14C ages showing a minimum age of ~3600 years and a linear age/depth gradient of 204 y/m. Water arrives in this aquifer via an intermediate flow system, with a long travel time since being recharged. There is a horizontal flow of up to 19 m/y at a depth of ~40 m, with small horizontal flows above and below that depth. However, the apparently greater ages at greater depth imply that a slow downward flow has occurred prior to the horizontal flow of water to this location.
In view of the close agreement between the most appropriate CMB recharge estimate for this investigation site (21 mm/y), and the rainfall-scaled recharge estimate (25.5 mm/y) for the geologically similar investigation site at Burra, it is recommended that a recharge rate of 25 mm/y be adopted for the Fox Creek site.
At the Mylor investigation site, very low yields from the piezometers indicate poor connectivity of fractures in this aquifer. Although the piezometric head levels show a strong upward hydraulic gradient between the deepest and shallowest piezometers, the EM flowmeter data show only a small amount of flow occurring between depths under ambient conditions. Similarly, the analysis of 222Rn activities shows a very low horizontal flow occurring at all depths. These findings indicate that the conductivity of fractures is uniformly

CONCLUSIONS AND RECOMMENDATIONS
Report DWLBC 2007/29 Groundwater recharge and flow investigations in the Western Mount Lofty Ranges, South Australia
64
low throughout this depth range, and it is likely that the majority of the small flows are horizontal, through fractures that have very few vertical connections. Because the ages indicated by CFC-12 and 14C are inconsistent at this site and the aquifer properties suggest negligible vertical connectivity, the parallel plate model was not applicable for the determination of recharge rates. However, there is a strong agreement between CMB recharge estimates for groundwater from 14 wells in a nearby area of similar geology. By scaling the mean of these recharge estimates according to the rainfall difference between the location of those wells and the location of the Mylor investigation site, a recharge estimate of 97 mm/y is derived. In view of the tendency of the CMB method to under-estimate true recharge rates, the value of 97 mm/y is recommended for resource management purposes as a suitably cautious estimate of recharge at locations with geology and rainfall similar to the Mylor investigation site.

Report DWLBC 2007/29 Groundwater recharge and flow investigations in the Western Mount Lofty Ranges, South Australia
65
APPENDICES
A. CHEMISTRY RESULTS
Table A.1 Major chemistry, isotopes, CFC-12 concentrations and 14C activities of the groundwater samples at the Forreston, Fox Creek and Mylor investigation sites, and rainfall samples from the Mount Pleasant and Echunga Pluviometers. Mean seawater is also shown.
Field measurements Laboratory analysis
Location and sample type Unit No.
Mid-screen depth from
surface (m)
Sample ID
Collection date DO
(ppm) Field EC (μS/cm) pH Redox
(mV) Temp (°C)
Field alkalinity (HCO3
-)(mg/L)
TDS(mg/L)
Lab pH
Ca2+
(mg/L)Mg2+
(mg/L)Na+
(mg/L)K+
(mg/L)SO4
2-
(mg/L)Cl-
(mg/L)
Lab alkal- inity
(HCO3-)
(mg/L)
Br (mg/L)-
NH4-N (mg/L)
NOx-N (mg/L)
Sr (ug/L)
δ180 (‰
SMOW)
δ2H (‰
SMOW)
CFC-12(pg/kg)
CFC-12 apparent
age (y)
14C(pmC)
δ13C (‰
PDB)
Forreston GW 6628-22357 16.5 F1 01/02/06 0.02 810 7.3 -69 18.3 144 519 7.6 25 16 115 8 79 95 180 0.24 0.037 <0.02 107 -4.94 -23.9 1710 N/A 94.3 -19.1
Forreston GW 6628-22356 22.5 F2 31/01/06 0.50 728 6.85 -47.7 18.76 156 529 7.4 23 18 117 8 73 104 185 0.28 0.025 <0.02 102 -5.03 -22.3 1252 N/A 93.3 -17.9
Forreston GW 6628-22352 25.5 F3 01/02/06 0.92 867 7.09 -52 18.7 130 558 7.6 25 18 126 8 98 102 182 0.26 0.045 <0.02 104 -4.92 -21.9 1000 N/A 97.1 -16.2
Forreston GW 6628-22355 31.5 F4 31/01/06 0.12 759 7.1 -127.1 19.03 156 560 7.5 25 18 124 9 79 110 195 0.29 <0.02 <0.02 109 -4.94 -23.6 1366 N/A 98.7 -18.2
Forreston GW 6628-22354 36.5 F5 31/01/06 0.22 780 6.64 -70.6 19 130 562 7.2 21 21 127 8 90 114 181 0.29 <0.02 <0.02 92 -4.59 -24.8 887 N/A 94.4 -17.2
Forreston GW 6628-22351 54.0 F6 01/02/06 -0.05 943 7.02 -46 18.5 162 604 7.5 28 21 133 9 89 119 206 0.28 <0.02 <0.02 108 -4.93 -24.3 439 N/A 92.2 -17.1
Forreston GW 6628-22350 61.0 F7 01/02/06 -0.08 924 7.1 -97 18.4 162 581 7.4 24 20 133 9 75 123 197 0.31 <0.02 <0.02 96 -4.99 -26.2 367 N/A 92.4 -17.0
Forreston GW 6628-22349 74.0 F8 01/02/06 -0.02 902 6.98 -42 18.4 152 571 7.4 22 20 131 8 73 122 195 0.33 <0.02 <0.02 97 -4.95 -26.1 495 N/A 90.8 -17.3
Fox Creek GW 6628-22478 14.6 L1 03/10/06 1.05 1450 8.1 132 19.17 260 855 8.2 31 28 212 10 8 302 263 0.96 0.079 0.128 1369 -5.86 -30.2 52 38 23.1 -10.8
Fox Creek GW 6628-22486 19.5 L2 03/10/06 0.61 1477 7.79 55 16.62 240 848 8.0 33 28 213 9 8 316 242 0.99 0.178 0.024 1473 -5.91 -29.9 24 >41 18.4 -9.6
Fox Creek GW 6628-22481 26.5 L4 03/10/06 0.31 1513 7.7 -21 16.65 235 867 8.0 30 26 223 9 4 324 250 1.01 0.187 0.038 1566 -5.94 -34.9 25 >41 16.3 -10.6
Fox Creek GW 6628-22484 28.5 L5 03/10/06 0.15 1521 8.04 -43 16.34 203 869 8.0 27 24 234 9 2 335 238 1.06 0.208 <0.02 1506 -5.98 -29.6 <20 >41 12.8 -5.5
Fox Creek GW 6628-22483 33.0 L6 03/10/06 0.07 1508 8.06 -182 16.29 250 870 8.1 31 27 224 9 3 323 253 1.03 0.189 <0.02 1609 -5.92 -28.8 <20 >41 17.4 -2.1
Fox Creek GW 6628-22482 37.0 L7 04/10/06 0.41 1554 7.67 -126 17.48 230 881 7.8 33 27 225 8 2 342 244 1.08 0.196 <0.02 2095 -6.1 -33.4 <20 >41 15.2 -10.7
Fox Creek GW 6628-22480 38.5 L8 04/10/06 0.53 1548 7.75 -91 16.29 238 883 7.9 28 24 235 8 2 333 253 1.03 0.217 <0.02 1522 -5.97 -34.8 <20 >41 11.7 -11.2
Fox Creek GW 6628-22479 49.0 L9 04/10/06 0.37 1557 7.8 -134 17.75 236 877 8.0 26 24 236 8 1 341 241 1.08 0.215 <0.02 1613 -6.06 -34.8 <20 >41 7.5 -11.1
Fox Creek GW 6628-22478 59.0 L10 04/10/06 0.43 1607 7.95 -125 16.92 200 887 8.0 27 24 242 9 1 359 225 1.16 0.217 <0.02 1854 -6.11 -32.7 <20 >41 4.5 -10.9
Mylor GW 6627-11286 13.0 M1 22/11/06 0.03 1554 7.75 -111 17.26 216 997 8.0 39 30 240 12 94 327 254 1.06 0.135 <0.01 224 -5.64 -26.3 26 41 38.8 -14.3
Mylor GW 6627-11285 27.0 M2 22/11/06 0.39 1905 11.7 -116 17.3 270 834 11.4 48 0 226 28 49 278 205 0.76 0.014 <0.01 482 -5.74 -27.6 179 17
Mylor GW 6627-11284 45.0 M3 22/11/06 0.64 1954 7.28 -105 19.12 340 1430 8.1 65 49 298 10 166 369 474 1.24 0.019 <0.01 262 -5.52 -28.2 110 26 18.5 -9.7
Mylor GW 6627-11283 62.0 M4 22/11/06 0.32 2001 7.36 -91 17.32 280 1419 8.1 71 53 294 9 144 437 411 1.48 <0.01 <0.01 292 -5.68 -29 <20 >41 24.7 -11.0
Mt Pleasant pluvio 23/04/03 5.5 -5.08 -27.9
Mt Pleasant pluvio 08/10/03 4.6 -5.69 -26.2
Mt Pleasant pluvio 04/03/05 8.8 -3.72 -17.1
Mt Pleasant pluvio 27/05/05 14.8 -1.78
Echunga pluvio 08/10/03 5.7 -5.12 -21.9
Echunga pluvio 25/02/05 10.6 -2.95 -11.1
Echunga pluvio 24/06/05 5.2 -5.55 -25.2
Mean seawater 35139 8.2 412 1294 10760 399 2712 19350 145 67 0 0

APPENDICES
Report DWLBC 2007/29 Groundwater recharge and flow investigations in the Western Mount Lofty Ranges, South Australia
66

APPENDICES
Report DWLBC 2007/29 Groundwater recharge and flow investigations in the Western Mount Lofty Ranges, South Australia
67
Table A.2 Measured 222Rn concentrations from the unpurged and purged piezometers at the Forreston, Fox Creek and Mylor investigation sites
Sample ID
Mid-screen depth from surface (m)
½ screen length
(m)
Radon — unpurged
date
Radon conc. (C) unpurged
(Bq/L)
Radon error (C)
(Bq/L)
Radon — purged
date
Radon conc. (Co)
purged (Bq/L)
Radon error (Co)
(Bq/L)
Forreston
F1 16.5 1.5 12-Oct-06 7.2 0.4 10-Oct-05 44.3 1.1
F2 22.5 1.5 12-Oct-06 1.8 0.2 10-Oct-05 65.1 1.5
F3 25.5 1.5 12-Oct-06 4.9 0.3 27-Mar-06 27.8 0.9
F4 31.5 1.5 12-Oct-06 3.6 0.3 27-Mar-06 22.9 0.8
F5 36.5 1.5 12-Oct-06 9.5 0.5 28-Mar-06 30.2 0.9
F6 54.0 2 12-Oct-06 13.7 0.6 28-Mar-06 34 1
F7 61.0 3 12-Oct-06 15.6 0.6 28-Mar-06 26.3 0.9
F8 74.0 2 12-Oct-06 1.9 0.2 28-Mar-06 20.6 0.8
Fox Creek
L1 14.6 1.5 12-Oct-06 5.4 0.4 12-Oct-05 40.6 1.2
L2 19.5 1 01-Feb-06 6.6 0.3 01-Feb-06 209 4
L4 26.5 1.25 31-Jan-06 104 2 31-Jan-06 124 3
L5 28.5 1.5 31-Jan-06 64.3 1.7 01-Feb-06 139 3
L6 33.0 1.5 31-Jan-06 4.8 0.3 31-Jan-06 104 2
L7 37.0 1 31-Jan-06 3.6 0.3 31-Jan-06 81.9 1.8
L8 38.5 1 01-Feb-06 13.1 0.5 01-Feb-06 103 2
L9 49.0 1.5 01-Feb-06 2.1 0.2 01-Feb-06 140 3
L10 59.0 2 01-Feb-06 48 1.1 01-Feb-06 124 3
Mylor
M1 13.0 3 22-Nov-06 5.9 0.3 22-Nov-06 36 1.2
M2 27.0 1.5 22-Nov-06 1.2 0.2 22-Nov-06 12.4 0.5
M3 45.0 1.5 22-Nov-06 1 0.2 22-Nov-06 7.9 0.4
M4 62.0 1.5 22-Nov-06 2 0.2 22-Nov-06 17 0.6

APPENDICES
Report DWLBC 2007/29 Groundwater recharge and flow investigations in the Western Mount Lofty Ranges, South Australia
68
B. LITHOLOGICAL LOGS
Table A.3 Forreston — River Torrens Catchment, lithological log for Forreston 203 mm well (Fr1)
Unit No.
Permit No
Drill date
Depth from (m)
Depth to (m)
Major lithology
Minor lithology Description
6628-22353 PN106396 08/12/2005 0 2 SLAT Quartz–muscovite schist and quartzite with minor muscovite. Hard, silicified. Iron staining along fractures. Minor clay, hard, low plasticity, minimal topsoil.
2 6 SLAT Quartz–muscovite schist. Very hard, silicified. Alteration along fracture surfaces.
6 8 SCHT Quartz–muscovite schist. Minor weathering. Iron staining. Grey.
8 12 SCHT Quartz–muscovite schist. Very fine grained. Hard, brittle. Iron staining. Minor clear quartz fragments between 10–12 m. Grey.
12 16 SCHT Quartz–muscovite schist. Very fine grained. Iron staining. Minor opaque quartz fragments. Grey.
16 22 SCHT Quartz–muscovite schist. Very fine grained. Iron staining. Increased quartz vein fragments. Dark grey.
22 28 SCHT Quartz–muscovite schist. Very fine grained. Hard. Minor quartz vein fragments.
28 30 SCHT Quartz–muscovite schist. Fine grained. Minor opaque quartz vein fragments.
30 32 SCHT Quartz–muscovite schist. Fine grained. Minor amber quartz fragments.
32 42 SCHT Quartz–muscovite schist. Very fine grained. Hard. Minor opaque quartz vein fragments.

APPENDICES
Report DWLBC 2007/29 Groundwater recharge and flow investigations in the Western Mount Lofty Ranges, South Australia
69
Table A.4 Forreston — River Torrens Catchment, lithological log for Forreston 203 mm well (Fr2)
Unit No.
Permit No
Drill date
Depth from (m)
Depth to (m)
Major lithology Description
6628-22348 PN106397 09/12/2005 0 2 SOIL Topsoil. Sandy clay. Weathered muscovite schist. Minor schist fragments. Minor quartz vein fragments. Light red-brown.
2 4 SCHT Quartz–muscovite schist. Weathered. Soft. Minor quartz. Light red-brown.
4 8 SCHT Quartz–muscovite schist. Weathered. Moderate-hard. Minor clear quartz fragments. Brown-grey.
8 14 SCHT Quartz–muscovite schist. Very hard. Minor quartz vein fragments. Dark blue-grey.
14 16 SCHT Quartz–muscovite schist. Very hard. Dark blue-grey. Water cut at 16 m.
16 20 SCHT Quartz–muscovite schist. Very hard. Quartz veins present in schist cuttings. Minor quartz vein fragments. Dark blue-grey.
20 22 SCHT Quartz–muscovite schist. Very hard. Minor quartz vein fragments. Dark blue-grey.
22 26 SCHT Quartz–muscovite schist. Very hard. Minor white-smoky grey quartz vein fragments. Dark blue-grey.
26 28 SCHT Quartz–muscovite schist. Very hard. Layering present in cuttings. Minor amber quartz.
28 36 SCHT Quartz–muscovite schist. Very hard. Abundant quartz vein fragments between 32–34 m. Dark blue-grey.
36 46 SCHT Quartz–muscovite schist. Pyrite on fracture and cleavage surfaces. Quartzite fragments. Possible chloritic alteration. Dark blue-grey.
46 48 SCHT Quartz–muscovite schist. Pyrite on fracture and cleavage surfaces. Quartz vein fragments. Minor fragments with brecciated appearance. Chloritic alteration.
48 58 SCHT Quartz–muscovite schist. Silicified fragments. Chloritic alteration. Quartz vein fragments.
58 64 SCHT Quartz–muscovite schist. Fine-grained muscovite (<1 mm). Pyrite on fracture surfaces. Minor quartz vein material. Decreased chloritic alteration.
64 68 SCHT Quartz–muscovite schist. Pyrite on fracture surfaces. Increased chloritically altered quartz vein material.
68 74 SCHT Quartz–muscovite schist. Pyrite on fracture surfaces. Decreased quartz vein material.
74 80 SCHT Quartz–muscovite schist. Pyrite on fracture surfaces. Increased chloritically altered quartz vein material.

APPENDICES
Report DWLBC 2007/29 Groundwater recharge and flow investigations in the Western Mount Lofty Ranges, South Australia
70
Table A.5 Forreston — River Torrens Catchment, lithological log for Fox Creek 254 mm well (FC1)
Unit No.
Permit No
Drill date
Depth from (m)
Depth to (m)
Major lithology
Minor lithology Description
6628-22476 PN106399 24/05/2005 0 2 SOIL CLYU Clayey topsoil. Light red-brown. Moderate plasticity. Pliable. Moderate sheen.
2 4 CLYU Clay. Light red-brown. Moderate plasticity, pliable, increased moisture content, high sheen.
4 6 CLYU SILT Silty clay. Light brown. Friable. Minor weathered slate fragments.
6 8 CLYU SILT Silty clay. Light grey-brown. Increased weathered slate fragments.
8 10 SLAT Slate. Weathered. Cleavage visible in fragments. Soft. Grey.
10 12 SLAT Slate. Weathered. Cleavage visible in fragments. Medium-hard. Grey.
12 14 SLAT Slate. Weathered. Minor pyrite. Slaty cleavage. Blue-grey. High clay content in sample. Soft, pliable.
14 16 SLAT Slate. Weathered. Minor pyrite. Slaty cleavage. Blue-grey. Quartz vein material lining fragment surfaces. Minor iron staining. Decreased clay.
16 18 SLAT Slate. Well-developed slaty cleavage. Pyrite on cleavage and fracture surfaces. Grey.
18 24 SLAT Slate. Well-developed slaty cleavage. Possible crenulation cleavage. Pyrite on cleavage surfaces. Possible bedding; minor quartz-rich thin layers. Quartz vein material between 20–24 m. Blue-grey
24 28 SLAT MSST Slate. Slaty cleavage. Possible crenulation cleavage. Thin pyrite veins. Minor quartz vein material. Blue-grey.
28 30 SLAT MSST Slate. Slaty cleavage. Minor increase in metasandstone throughout cuttings. Decreased quartz vein material. Water cut at 29 m, 20 L/s — water level in adjacent 203 mm well dropped to ~8.6 m, previously flowing.
30 39.5 SCHT MSST Metasiltstone interbedded with metasandstone. Metasandstone layers up to 2 mm thick. Increased pyrite on fracture surfaces.

APPENDICES
Report DWLBC 2007/29 Groundwater recharge and flow investigations in the Western Mount Lofty Ranges, South Australia
71
Table A.6 Forreston — River Torrens Catchment, lithological log for Fox Creek 203 mm well (FC2)
Unit No.
Permit No
Drill date
Depth from (m)
Depth to (m)
Major lithology
Minor lithology Description
6628-22475 PN106398 20/05/2005 0 2 SOIL CLYU Clayey topsoil. Light red-brown. Moderate density, low plasticity. Weathered slate fragments, minor quartz vein material. Manganese weathering, fragments friable.
2 6 CLYU Clay. Soft, pliable, low plasticity, high sheen, increased moisture content. Decreased shale fragments. Red-brown.
6 10 SLAT CLYU Slate. Weathered, friable. Cleavage obvious in fragments. Grey. Clay. Red-brown. Decreased clay between 8–10 m.
10 12 SLAT Slate. Variable weathering. Soft, friable. Grey and light red-brown. Minor quartz vein material. Decreased weathering between 11–12 m.
12 18 SLAT Slate. Minor weathering. Well-developed slaty cleavage. Grey.
18 22 SLAT Slate. Well-developed slaty cleavage. Hard. Pyrite associated with slate and as discrete fragments. Cuttings 2–10 mm.
22 36 SLAT Slate. Well-developed slaty cleavage. Decreased pyrite.
36 38 SLAT Slate. Well-developed cleavage. Minor quartz vein fragments.
38 40 SLAT Slate. Well-developed cleavage. Abundant quartz vein fragments (clear, white). Slate fragments exhibit rounded surfaces.
40 48 SLAT Slate. Slaty cleavage. Quartz vein fragments.
48 54 SLAT Slate. Slaty cleavage. Quartz veins in cuttings. Pyrite and quartz vein fragments.
54 60 SLAT Slate. Slaty cleavage. Quartz veins. Significant pyrite in cuttings.
60 64 SLAT Slate. Slaty cleavage. Pyrite. Minor quartz vein material.
64 66 SLAT Slate. Slaty cleavage. Abundant pyrite.
66 76 SLAT Slate. Slaty cleavage. Pyrite. Minor quartz vein material.
76 80 SLAT Slate. Slaty cleavage. Minor pyrite, minor quartz vein material.
80 90 SLAT Slate. Slaty cleavage. Minor pyrite, minor quartz vein material.
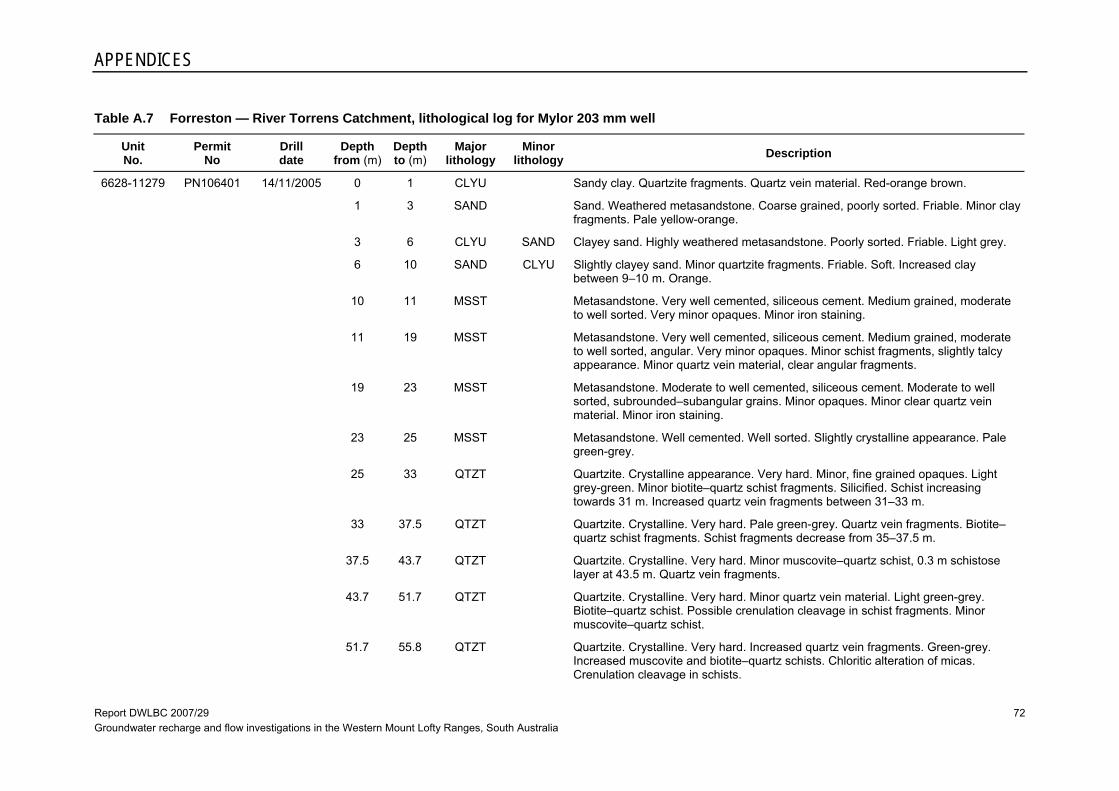
APPENDICES
Report DWLBC 2007/29 Groundwater recharge and flow investigations in the Western Mount Lofty Ranges, South Australia
72
Table A.7 Forreston — River Torrens Catchment, lithological log for Mylor 203 mm well
Unit No.
Permit No
Drill date
Depth from (m)
Depth to (m)
Major lithology
Minor lithology Description
6628-11279 PN106401 14/11/2005 0 1 CLYU Sandy clay. Quartzite fragments. Quartz vein material. Red-orange brown.
1 3 SAND Sand. Weathered metasandstone. Coarse grained, poorly sorted. Friable. Minor clay fragments. Pale yellow-orange.
3 6 CLYU SAND Clayey sand. Highly weathered metasandstone. Poorly sorted. Friable. Light grey.
6 10 SAND CLYU Slightly clayey sand. Minor quartzite fragments. Friable. Soft. Increased clay between 9–10 m. Orange.
10 11 MSST Metasandstone. Very well cemented, siliceous cement. Medium grained, moderate to well sorted. Very minor opaques. Minor iron staining.
11 19 MSST Metasandstone. Very well cemented, siliceous cement. Medium grained, moderate to well sorted, angular. Very minor opaques. Minor schist fragments, slightly talcy appearance. Minor quartz vein material, clear angular fragments.
19 23 MSST Metasandstone. Moderate to well cemented, siliceous cement. Moderate to well sorted, subrounded–subangular grains. Minor opaques. Minor clear quartz vein material. Minor iron staining.
23 25 MSST Metasandstone. Well cemented. Well sorted. Slightly crystalline appearance. Pale green-grey.
25 33 QTZT Quartzite. Crystalline appearance. Very hard. Minor, fine grained opaques. Light grey-green. Minor biotite–quartz schist fragments. Silicified. Schist increasing towards 31 m. Increased quartz vein fragments between 31–33 m.
33 37.5 QTZT Quartzite. Crystalline. Very hard. Pale green-grey. Quartz vein fragments. Biotite–quartz schist fragments. Schist fragments decrease from 35–37.5 m.
37.5 43.7 QTZT Quartzite. Crystalline. Very hard. Minor muscovite–quartz schist, 0.3 m schistose layer at 43.5 m. Quartz vein fragments.
43.7 51.7 QTZT Quartzite. Crystalline. Very hard. Minor quartz vein material. Light green-grey. Biotite–quartz schist. Possible crenulation cleavage in schist fragments. Minor muscovite–quartz schist.
51.7 55.8 QTZT Quartzite. Crystalline. Very hard. Increased quartz vein fragments. Green-grey. Increased muscovite and biotite–quartz schists. Chloritic alteration of micas. Crenulation cleavage in schists.

APPENDICES
Report DWLBC 2007/29 Groundwater recharge and flow investigations in the Western Mount Lofty Ranges, South Australia
73
Unit No.
Permit No
Drill date
Depth from (m)
Depth to (m)
Major lithology
Minor lithology Description
55.8 59.8 QTZT Quartzite. Crystalline. Very hard. Pale green-grey. Minor quartz vein material. Minor muscovite and biotite–quartz schists. Crenulation cleavage in schists. Chloritic alteration absent.
59.8 70 QTZT Quartzite. Crystalline. Very hard. Pale green-grey. Minor quartz vein material. Minor biotite–quartz schist. Crenulation cleavage in schist. Minor chloritic alteration. Schist fragments decrease from 61.9–70 m.
70 72 QTZT Quartzite. Crystalline. Hard. Pale green-grey. Minor biotite–quartz schist. Minor quartz vein material.
72 76.1 QTZT Quartzite. Crystalline. Hard. Pale green-grey. Abundant muscovite and biotite–quartz schists. Schists decreases towards 76.1 m. Quartz fragments.
76.1 80.2 QTZT Quartzite. Crystalline. Hard. Minor opaques. Pale green-grey. Quartz vein fragments. Minor muscovite and biotite–quartz schist fragments.

Report DWLBC 2007/29 Groundwater recharge and flow investigations in the Western Mount Lofty Ranges, South Australia
74

Report DWLBC 2007/29 Groundwater recharge and flow investigations in the Western Mount Lofty Ranges, South Australia
75
UNITS OF MEASUREMENT
Units of measurement commonly used (SI and non-SI Australian legal)
Name of unit Symbol Definition in terms of other metric units Quantity
day d 24 h time interval
gigalitre GL 106 m3 volume
gram g 10–3 kg mass
hectare ha 104 m2 area
hour h 60 min time interval
kilogram kg base unit mass
kilolitre kL 1 m3 volume
kilometre km 103 m length
litre L 10-3 m3 volume
megalitre ML 103 m3 volume
metre m base unit length
microgram μg 10-6 g mass
microlitre μL 10-9 m3 volume
milligram mg 10-3 g mass
millilitre mL 10-6 m3 volume
millimetre mm 10-3 m length
minute min 60 s time interval
second s base unit time interval
tonne t 1000 kg mass
year y 365 or 366 days time interval
~ approximately equal to
δ2H hydrogen isotope composition
δ18O oxygen isotope composition 14C carbon-14 isotope (percent modern carbon)
δ13C dissolved inorganic carbon (DIC)
CFC chlorofluorocarbon (parts per trillion volume)
EC electrical conductivity (µS/cm)
SEC specific electrical conductivity (µS/cm)
pH acidity
ppm parts per million
ppb parts per billion
TDS total dissolved solids (mg/L)

Report DWLBC 2007/29 Groundwater recharge and flow investigations in the Western Mount Lofty Ranges, South Australia
76

Report DWLBC 2007/29 Groundwater recharge and flow investigations in the Western Mount Lofty Ranges, South Australia
77
GLOSSARY Ambient — The background level of an environmental parameter (e.g. a background water quality such as salinity).
Aquifer — An underground layer of rock or sediment that holds water and allows water to percolate through.
Aquifer, confined — Aquifer in which the upper surface is impervious and the water is held at greater than atmospheric pressure. Water in a penetrating well will rise above the surface of the aquifer.
Aquifer test — A hydrological test performed on a well, aimed to increase the understanding of the aquifer properties, including any interference between wells, and to more accurately estimate the sustainable use of the water resource available for development from the well.
Aquifer, unconfined — Aquifer in which the upper surface has free connection to the ground surface and the water surface is at atmospheric pressure.
Baseflow — The water in a stream that results from groundwater discharge to the stream. (This discharge often maintains flows during seasonal dry periods and has important ecological functions.)
Bore — See well.
Catchment — That area of land determined by topographic features within which rainfall will contribute to runoff at a particular point.
DWLBC — Department of Water, Land and Biodiversity Conservation (Government of South Australia).
EC — Electrical conductivity. 1 EC unit = 1 micro-Siemen per centimetre (µS/cm) measured at 25°C. Commonly used to indicate the salinity of water.
EMLR — Eastern Mount Lofty Ranges.
Evapotranspiration — The total loss of water as a result of transpiration from plants and evaporation from land, and surface water bodies.
Geological features — Include geological monuments, landscape amenity and the substrate of land systems and ecosystems.
Groundwater — See underground water.
Hydrogeology — The study of groundwater, which includes its occurrence, recharge and discharge processes, and the properties of aquifers. (See hydrology.)
Hydrology — The study of the characteristics, occurrence, movement and utilisation of water on and below the Earth’s surface and within its atmosphere. (See hydrogeology.)
MLR — Mount Lofty Ranges.
Model — A conceptual or mathematical means of understanding elements of the real world which allows for predictions of outcomes given certain conditions. Examples include estimating storm runoff, assessing the impacts of dams or predicting ecological response to environmental change.
Mount Lofty Ranges Watershed — The area prescribed by Schedule 1 of the regulations.
Natural recharge — The infiltration of water into an aquifer from the surface (rainfall, streamflow, irrigation etc.). (See recharge area, artificial recharge.)
Natural resources — Soil; water resources; geological features and landscapes; native vegetation, native animals and other native organisms; ecosystems.
Permeability — A measure of the ease with which water flows through an aquifer or aquitard. The unit is m2/d.
Potentiometric head — The potentiometric head or surface is the level to which water rises in a well due to water pressure in the aquifer; the unit is metres (m).

GLOSSARY
Report DWLBC 2007/29 Groundwater recharge and flow investigations in the Western Mount Lofty Ranges, South Australia
78
Prescribed water resource — A water resource declared by the Governor to be prescribed under the Act, and includes underground water to which access is obtained by prescribed wells. Prescription of a water resource requires that future management of the resource be regulated via a licensing system.
Recharge area — The area of land from which water from the surface (rainfall, streamflow, irrigation, etc.) infiltrates into an aquifer. (See artificial recharge, natural recharge.)
Surface water — (a) water flowing over land (except in a watercourse), (i) after having fallen as rain or hail or having precipitated in any another manner, (ii) or after rising to the surface naturally from underground; (b) water of the kind referred to in paragraph (a) that has been collected in a dam or reservoir.
Underground water (groundwater) — Water occurring naturally below ground level or water pumped, diverted or released into a well for storage underground.
Water allocation — (a) in respect of a water licence means the quantity of water that the licensee is entitled to take and use pursuant to the licence; (b) in respect of water taken pursuant to an authorisation under s. 11 means the maximum quantity of water that can be taken and used pursuant to the authorisation.
Water allocation plan (WAP) — A plan prepared by a CWMB or water resources planning committee and adopted by the Minister in accordance with Division 3 of Part 7 of the Act.
Watercourse — A river, creek or other natural watercourse (whether modified or not) and includes: a dam or reservoir that collects water flowing in a watercourse; a lake through which water flows; a channel (but not a channel declared by regulation to be excluded from the this definition) into which the water of a watercourse has been diverted; and part of a watercourse.
Well — (a) an opening in the ground excavated for the purpose of obtaining access to underground water; (b) an opening in the ground excavated for some other purpose but that gives access to underground water; (c) a natural opening in the ground that gives access to underground water.

Report DWLBC 2007/29 Groundwater recharge and flow investigations in the Western Mount Lofty Ranges, South Australia
79
REFERENCES
Banks, E, Wilson, T, Love, A & Green, G. 2007, ‘Groundwater investigations in the Eastern Mount Lofty Ranges, South Australia’, Report DWLBC 2007/20, Department of Water, Land and Biodiversity Conservation, Adelaide.
Cook, PG 2003, A guide to regional groundwater flow in fractured rock aquifers, CSIRO Land and Water, Glen Osmond, South Australia, pp.108.
Cook PG & Bohlke, J-K 1999, ‘Determining timescales for groundwater flow and solute transport’, in PG Cook & AL Herczeg (eds), Environmental tracers in subsurface hydrology, Kluwer Academic, Boston, London, pp.1–30.
Cook, PG, Love, AJ & Dighton, JC 1999, ‘Inferring groundwater flow in fractured rock from dissolved radon,’ Groundwater, 37(4), pp.606–610.
Cook, PG & Simmons, CT 2000, ‘Using environmental tracers to constrain flow parameters in fractured rock aquifers: Clare Valley, South Australia’, in B Faybishenko (ed), Dynamics of fluids in fractured rocks: Concepts and recent advances, AGU Monograph, 122, pp.337–347.
Fetter, CW 2001, ‘Cooper-Jacob straight line method’, in Applied Hydrogeology, 4th edn, Prentice Hall, New Jersey, p.174.
Fontes, JC & Garnier, JM 1979, ‘Determination of the initial 14C activity of the total dissolved carbon: A review of the existing models and a new approach’, Water Resources Research, 15, pp.399–413.
Harrington, GA 1999, ‘Recharge mechanisms and chemical evolution in an arid groundwater system, Central Australia’, PhD thesis, School of Chemistry, Physics and Earth Sciences, Flinders University of South Australia.
Herczeg, AL & Edmunds, WM 1999, ‘Inorganic ions as tracers’, in PG Cook & AL Herczeg (eds), Environmental tracers in subsurface hydrology, Kluwer Academic, Boston, London, pp.31–77.
Leaney, F 2006, CSIRO isotope analytical service, CSIRO, Canberra, viewed June 2006, <http://www.clw.csiro.au/services/isotope>.
Love, AJ, Cook, PG, Harrington, GA & Simmons, CT 2002, Groundwater flow in the Clare Valley, South Australia, Report DWR 02.03.0002, Department for Water Resources, Adelaide.
Love, AJ, Simmons, CT, Cook, P, Harrington, GA, Herczeg, A & Halihan, T., 2007, ‘Estimating groundwater flow rates in fractured metasediments: Clare Valley, South Australia’, International Association of Hydrogeologists SP Series.
Neretnieks, I 1981, ‘Age dating of groundwater in fissured rock: Influence of water volumes in micropores’. Water Resources Research, 17(2), pp.421–422.
Parkhurst, DL & Appelo, CAJ 1999, User's guide to PHREEQC (Version 2) — A computer program for speciation, batch-reaction, one-dimensional transport, and inverse geochemical calculations, Water Resources Investigations Report 99-4259, US Geological Survey.
Pearson, FJ Jr & Hanshaw, BB 1970, ‘Sources of dissolved carbonate species in groundwater and their effects on carbon-14 dating’, in Isotope Hydrology 1970, IAEA, Vienna, pp.271–286.
Preiss, WV (compiler) 1987, The Adelaide Geosyncline: Late Proterozoic stratigraphy, sedimentation, palaeontology and tectonics, Bulletin 53, Geological Survey, Adelaide.

REFERENCES
Report DWLBC 2007/29 Groundwater recharge and flow investigations in the Western Mount Lofty Ranges, South Australia
80
Szabo, Z, Rice, DE, Plummer, LN, Busenberg, E, Drenkard, S & Schlosser, P 1996, ‘Age dating of shallow groundwater with chlorofluorocarbons, tritium/helium 3, and flow path analysis, southern New Jersey coastal plain’, Water Resources Research, 32(4), pp.1023–1038.
Tamers, MA 1967, ‘Radiocarbon ages of groundwater in an arid zone unconfined aquifer’, in Isotope techniques in the hydrological cycle, AGU Monograph 11, pp.143–152.