group-based er-ahp system for product project screening yang journal_papers... · 1 group-based...
TRANSCRIPT
1
Group-based ER-AHP system for product project screening
Kwai-Sang Chin*1, Dong-ling Xu2 , Jian-Bo Yang,2 and James Ping-Kit Lam1 1 Department of Manufacturing Engineering and Engineering Management,
City University of Hong Kong, Hong Kong, China 2 Manchester Business School, The University of Manchester, UK
Abstract New product development (NPD) is highly risky because of fierce competition, as well as rapid
technological and market changes, which results in high rates of NPD project failure. A lot of research
has found that the high mortality rate is, to some extent, accountable to the selection of wrong NPD
projects. NPD project screening is thus a critical activity adopted in early product development stages
to enhance the success rate of NPD projects. The manufacturing companies thus demand more
intelligent and advanced tools that can advance their NPD screening decisions.
During the NPD process, companies need to develop their new products with better and safer
performance, higher quality and reliability, better environmental-friendliness and in shorter time.
Such multiple criteria have to be considered and assessed at early product project screening stages,
which involves a group of cross-functional experts. Due to a large number of quantitative and
qualitative criteria and lack of sufficient and concrete data, it is often the case that group members
have to make decisions in uncertain situations. It is therefore a big challenge for product managers
and experts to move from experience-based decision making to scientific NPD project screening
decision making.
This paper proposes a novel methodology by integrating the Evidential Reasoning (ER) approach and
Analytic Hierarchy Process (AHP), which can help manufacturers in handling uncertainties and
group-based decisions in the early NPD project screening stage. A case study with an electronic
consumer product manufacturer is conducted to demonstrate how the developed ER-AHP
methodology can be used to support NPD project screening decisions.
Keywords - New product project screening, Evidential Reasoning (ER), Analytical Hierarchical Process (AHP), Group-based decision, Decision with uncertainties * Corresponding author: Dr. K S Chin, Department of Manufacturing Engineering and Engineering Management, City University of Hong Kong, Tat Chee Avenue, Hong Kong, China. Fax (852) 2788 8423, Email <[email protected]> Acknowledgement The work described in this paper was supported by the grants from the Research Grants Council of the Hong Kong Special Administrative Region, China, project no. CityU-1203/04E and from City University of Hong Kong, SRG project no. CityU-7001971.

2
1. Introduction
New product development (NPD) is highly risky because of fierce competition, as well as rapid
technological and market changes, which results in high rates of NPD project failure. It is reported
that the NPD project failure rate, though it varies from industry to industry, is around one-third or
even higher (Cooper, 1984; Cooper et. al., 2002 & 2004). A lot of research found that the majority of
initial new product ideas are unsuitable for commercialization (Gidel, et. al., 2005; Carbonell et. al.
2004; Hart, et. al., 2003; Cooper, 2003 & 1992). The high mortality rate is, to some extent,
accountable to the selection of wrong NPD projects. Thus, selecting a right project for
commercialization is the first step to the success of NPD (Liginlal, et. al, 2006; Monhanty, et. al.,
2005; Coldrick, et.al., 2005; Lin and Chen, 2004; Calantone, et. al., 1999). NPD project screening has
been a critical activity adopted in early product development stages to enhance the success rate of
NPD projects so as to eliminate projects that have high potential of failure. On the basis of project
screening results, companies can allocate their resources to those projects that have higher potential of
success. As a result, the overall NPD failure rate can be reduced and the growth of companies can be
sustained.
A number of researchers have studied project screening methods (Coldrick, et. al., 2005; Gidel, et. al.,
2005; Carbonell, 2004; Hart, et. al., 2003; Linton, et. al., 2002; Rangaswamy and Lilien, 1997;
Rochford, 1991; Baker and Freeland, 1975). However, most of the methods, such as ranking and
scoring, are rather too simple to deal with complex decision making problems. In view of the growing
complexity of NPD, several researchers, including Mohanty et. al. (2005), Hsu et. al. (2003) and
Calantone et al., (1999) argued that a more comprehensive management science tool is needed for
improving project screening decisions. The tool must be capable of dealing with the issue of
uncertainty which is the common problem of decision making in early product development stages.
In fact, the uncertainty can be induced in two ways: incomplete data, and imprecise judgments.
Incomplete or lack of data is a common problem of early project screening. Many researchers
(Liginlal, et. al., 2006; Mohanty, et. al., 2005; Lin and Chen, 2004; Hsu, et. al., 2003; Rochford, 1991;
Cooper and Brentani, 1984) stated that generally there is insufficient information available for project
screening. They also argued that at early NPD stages, little reliable information is available to make
judgments against screening criteria. For example, the lack of financial and engineering data makes
decision making difficult and unreliable. Another cause of uncertainty is inability of human in making
reliable judgments. Some others (like Gidel, et. al., 2005; Linton, J, 2002; Haque, et. al., 2000; Cooper,
1985, etc.) criticized the screening approaches that are based on judgments of managers. It was
claimed that the experience of the managers may be limited to a small number of projects, and the

3
managers’ ability to judge the importance of screening criteria and compare potential projects may
also be limited.
In addition, NPD is characterized by the involvement of multidisciplinary NPD team members in the
decision making process. For instance, in the concurrent engineering approach to NPD, team
members from different functional units jointly make decisions to screen and select projects (Farris, et.
al., 2006; Hsu, et. al., 2003; Haque, et. al., 2000; Tummala, et al., 1999 and 1997; Winner et al., 1988).
However, the members usually do not have expertise or knowledge in all the aspects of the screening
criteria. In this situation, they may not be able to make accurate judgments on some aspects that are
not related to their functional expertise. Thus, it is important to note that the current AHP method is
not able to tackle the problem of uncertainty which may impair the reliability of the screening results.
Incomplete data and human inability of making accurate judgments are common in practice, which
need to be addressed for better decision making.
This paper proposes a new methodology by integrating the Evidential Reasoning (ER) approach with
Analytic Hierarchy Process (AHP) method to address the problem of uncertainty and group-based
decisions in NPD project screening. The proposed ER-AHP method is capable of handling both
incomplete and imprecise judgments, which can effectively tackle the problem of uncertainty and in
turn improve decision making quality of project screening. Moreover, as most screening activities are
conducted by members of a NPD team, this paper also presents a systematic process for companies to
perform the group-based NPD project screening with the ER-AHP method. This paper has seven
sections. After the introduction, literature review on the past NPD project screening research is
presented. The third section presents the theoretical background and details of the proposed method.
The fourth section portrays the formulation of group-based project screening model and process to
illustrate the application of the method in NPD project screening. A case study, with data collection
procedure, calculation and results are described in the fifth section. The aggregation and analysis of
evaluation results are then presented in the sixth section. It is followed by the conclusion section
which presents practical implications and summarizes the research finding respectively.
2. Literature review
2.1 Past research
NPD is plagued by difficulties and uncertainties which lead to a high NPD failure rate (Cooper, 1985;
Cooper et. al., 2002 & 2004). It is widely argued that good NPD project screening decision making is
critical to depress the high mortality rate of NPD (Liginlal, et. al, 2006; Monhanty, et. al., 2005;
Coldrick, et.al., 2005; Lin and Chen, 2004; Calantone, et. al., 1999, Ozer, 1999; Cooper and Brentani,

4
1984; Chenu and Wilemon; 1973). At the early stage of project development, there are usually
numerous new product ideas. Some of the ideas are good, which have high probability of success.
However, majority of them could be unfeasible. Thus, it is imperative to conduct project screening to
eliminate the ideas that have high failure probability. Based on project screening results, companies
can select the best project, which in turn enables companies to allocate their development resources to
the project that has the highest potential of success (Cooper, 1985; Cooper et. al., 2002 & 2004; Lin
and Chen, 2004).
Various methods are available for NPD project screening, including ranking, checklists, scoring
models, and numerical weighting methods (Coldrick, et. al., 2005; Gidel, et. al., 2005; Carbonell,
2004; Hart, et. al., 2003; Linton, et. al., 2002; Ozer, 1999; Rangaswamy and Lilien, 1997; Rochford,
1991; Baker and Freeland, 1975). However, the methods are too simple to tackle complex problems.
The growing complexity of NPD requires the use of more sophisticated management science decision
support techniques (Mohanty et. al. ,2005; Hsu et. al., 2003; Calantone et al., 1999; Rangaswamy and
Lilien, 1997). Calantone et al. (1999) and Rangaswamy and Lilien (1997) argued that NewProd and
AHP are the important management science tools for NPD project screening, which could provide
greater potential for improving project screening decisions. As evaluated and compared with other
advocacy from the literature, the authors also share the same opinion that the NewProd and AHP do
lay down a good foundation for developing an advanced group-based NPD project screening decision
methodology. The NewProd and AHP approaches as well as the authors’ arguments are elaborated
and discussed in the next sections.
2.2 NewProd
NewProd is a NPD project screening technique developed by Cooper (1985 &1992). It was derived
based on statistical analysis of the successes and failures of past NPD projects. NewProd model
includes a set of screening criteria that are the predicators of project success. To use the model,
evaluators rate potential projects on the model criteria using a 0 to 10 scale. Based on the inputs,
NewProd can calculate the overall score to estimate the probability of project success. Although
NewProd provides a logical means for companies to conduct NPD project screening, the approach has
several main limitations (Calantone et al., 1999). First, NewProd is derived based on the past NPD
project experience. The past experience may no longer be applicable to the current project because of
rapid changes in markets and technologies, etc. Second, NewProd is based on the experience of other
companies which were from different industries. As the backgrounds and practices of the companies
may be different, the applicability of the tool could be limited. Third, projects are evaluated against
the criteria of NewProd. The flexibility of the tool is limited since NewProd cannot be customized to
cater for different companies’ situations and needs. Other than the above, we propose that there is

5
another critical limitation. In practice, most NPD decisions are made by multidisciplinary teams that
constitute members from different departments. NewProd, however, does not provide a logical
mechanism to synthesize group judgments in the evaluation of projects. In general, NPD project
screening is a group-based process, decision support tools must be able to address the needs of this
process.
2.3. AHP
Several researchers, including Mohanty et. al. (2005), Hsu et. al. (2003) and Calantone et al., (1999)
proposed the use of Analytic Hierarchy Process (AHP) to aid companies in screening and selecting
NPD projects. AHP is a decision-making technique developed by Saaty (1980) to tackle the complex
problems of choice and prioritization. It is a viable decision making tool developed based on firm
theoretical foundations (Harker and Vargas, 1987). It has been widely recognized as a powerful
approach to solve multi-criteria decision making problems in numerous diverse areas (Partovi, 2007;
Liu and Hai, 2005; Wei et.al., 2005; Leung and Chin, 2004; Wasil and Golden, 2003; Chin et. al.,
2002; Tummala et. al., 1997). AHP produces a ranking of potential projects using pairwise
comparisons. It was shown that AHP can be very useful for gathering and processing knowledge for
making screening decisions. In view of the limitations of NewProd, Calantone et al. (1999) proposed
to adopt the AHP approach to NPD project screening. The use of AHP is relatively simple that NPD
teams firstly identify a set of screening criteria and sub-criteria that suit their companies’ situations
and organize them into a hierarchical structure. Then, NPD teams conduct pariwise evaluations of
alternatives (projects) at each level of the hierarchy. Finally, the importance weights (scores) of the
screening criteria and sub-criteria can be computed and the overall scores of the potential projects can
be obtained to indicate their priority.
Calantone et al. (1999) argued that AHP can be an alternative to NewProd, but they did not provide
comprehensive discussions about the advantages of the AHP approach over NewProd. However, we
believe that AHP can overcome the limitations of NewProd in several ways. First, AHP approach is
not based on historical statistical data. Rather, it makes judgments on the basis of most updated
information to address the current NPD problems. Second, rather than relying on other companies’
judgments, AHP approach enables companies to employ their own experts to make screening
decisions that best reflect their companies and industries’ situations. Third, AHP is a tool of choice
and prioritization. The pairwise evaluation method best suits the objective of project screening which
is to select the best project. Fourth, companies can develop their own set of screening criteria
according to their own situations and needs. This flexibility is very critical, which allows companies
to modify the criteria when situations change. Finally, AHP facilitates a group approach to project
screening decision making. This is probably the most important feature that makes AHP suitable for
6
project screening. NPD is a multidisciplinary process that requires the participation of a group of
people from different departments in making decisions. This group approach induces a problem of
judgment synthesis. Because of differences in technical backgrounds, departmental goals and
constraints, group members may present different judgments about project screening decisions. The
reliability of the decisions may depend on the way the diverse judgments are synthesized. AHP can
provide a solution to solve this problem. AHP includes a systematic algorithm to synthesize group
judgments and obtain an overall score to reflect group decisions, which is well suited to group
decision making (Dyer and Forman, 1992; Saaty, 1990). In short, AHP is a useful decision support
tool for companies to make NPD project screening decisions.
However, the AHP approach has two major weaknesses. One is the well-known ranking reversal
problem as discussed by many researchers such as Belton and Gear (1985). The other is its limited
capability in dealing with the issue of uncertainty which is the common problem of decision making
in early product development stages. In fact, the uncertainty can be induced in two ways: incomplete
data and imprecise judgments. Incomplete or lack of data is a common problem of early project
screening. There is an obvious need to develop a new approach to support AHP and NewProd in
handling the uncertainties in group-based decision process, like NPD screening process.
2.4. Research problems
Uncertainty has been a major problem of NPD project screening (Liginlal et. al., 2006; Lin and Chen,
2004; Rochford, 1991; Cooper and Brentani, 1984). In 1975, an extensive literature review conducted
by Baker and Freeland (1975) revealed that inadequate treatment of uncertainty was the major
limitation of project selection models. Unfortunately, three decades later, the problem has not yet been
addressed. In fact, uncertainty is very common in making decisions of early product development
stages. There are two causes for uncertainty. Firstly, it is due to incomplete or lack of data for making
decisions. In early product development stages, there is always a lack of data for estimating the
potential performance of new product projects (Lin and Chen, 2004; Rochford, 1991). It was also
argued by Cooper and Brentani (1984) and Cooper et. al. (2002 & 2004) that usually little reliable
information is available to make judgments against screening criteria. With limited information, NPD
team makes their judgments even though they are not fully sure about the evaluations.
The second cause of uncertainty is inability of human in making reliable judgments. Most project
screening approaches, such as scoring and ranking, reply on NPD team members to make their
judgments about project options. Cooper (1985 & 1992) argued that these approaches are not very
reliable because the experience of the NPD team members may be limited. It was believed that the
members can not make accurate or precise judgments if they are inexperienced. In fact, sometimes it

7
is not practical to make judgments based fully on past experience or information because NPD always
involves new issues including new design, new manufacturing processes, and new suppliers, etc.. As a
result, it is common that the team members are not able to make accurate judgments. In other words,
they are not fully confident about their judgments, indicating the existence of uncertainty. Moreover,
NPD is a multi-disciplinary process in which members from different departments form a NPD team
for making project screening decisions. The members usually possess very solid expertise that is
related to their job functions. However, they may not have strong knowledge or expertise on other
aspects that need to be considered for making screening decisions. Thus, they may not be able to
make accurate judgments on those aspects that are not closely related to their functional expertise.
The problem of uncertainty is an inevitable issue that can impair the reliability of NPD project
screening decisions. This suggests that a better NPD project screening method is needed for
improving the quality of decision making. Te authors responds to this need by proposing an ER-AHP
method to address the problem of uncertainty in project screening.
In fact, usually project screening decisions are made by NPD teams, rather than a single individual.
However, most research studies an individual approach to project screening. The studies fail to
address the need of a process to facilitate group-based decision making. Thus, the authors also
propose a group-based decision making process to help companies systematically perform NPD
project screening.
3. ER-AHP approach
In spite of the many excellent features of AHP, it has two crucial limitations: ranking reversal
problem and inability to deal with the problem of uncertainty. The causes of the ranking reversal
problem are analyzed by many researchers. They observed that the normalization of the relative
values of the alternatives on each criterion is one of the causes (Belton and Gear, 1983) and the
weighted additive formula for calculating the overall score of each alternative is the other
(Triantaphyllou, 2000).
We believe that the root cause of the ranking reversal problem is due to the fact the AHP treats
attribute weights and the performance scores of alternatives on each attribute in the same way. By
nature, the importance of attributes is relative to each other. Therefore, it is logical to eliciting
attribute weights by pairwise comparison. However the performance of an alternative on each
attribute should normally be independent of other alternatives. Therefore, the performance should be
measured by using independent standards or common scales, rather than by pairwise comparison
against each other. More specifically, the measurement for a quantitative attribute should be made in

8
terms of the natural unit of the attribute. For a qualitative attribute, the measurement should be in pre-
defined scoring standards which are linked to decision makers’ preferences or utilities.
It is based on such a belief that we propose to use AHP only for eliciting the weights of attributes, not
for generating the performance scores of alternatives on each attribute. The performances of each
alternative will be modeled using a belief decision matrix and the attributes are aggregated by the
Evidential Reasoning (ER) algorithm. Both the belief decision matrix and the ER algorithm are the
two main elements of the Evidential Reasoning (ER) approach, which is briefly described below.
The ER approach is developed for handling multiple criteria decision analysis (MCDA) problems
having both quantitative and qualitative information with uncertainties and subjectivity. (Zhang, Yang
and Xu 1989; Yang and Singh 1994; Yang and Sen 1994; Yang 2001, Yang and Xu 2002a,b). In
conventional methods, a MCDA problem is modelled using a decision matrix, with each criterion
assessed at each alternative decision by a single value. In the ER approach, a MCDA problem is
described using a belief decision matrix, with each criterion assessed at each alternative by a belief
structure – attribute values (or assessment grades) and their associated degrees of belief. This provides
a novel way to model MCDA problems and allows different types of uncertainties, such as
randomness and ignorance, to be modeled in the same framework.
For example, if a new product stands a 70% chance to be successful and 30% chance unsuccessful,
using a belief structure, it can be modeled as [(Successful, 0.7), (Successful, 0.3)]. In a traditional
decision matrix, this may have to be approximated to a single category, which has to be Successful.
From this example, it is clear that in such qualitative assessments a single number or grade is not
capable of modeling uncertainty. Furthermore, it may introduce distortion to original information.
In order to produce rational and consistent assessment outcomes and reveal the combined effects of
any uncertainty in the performances of an alternative, the ER approach employs the ER algorithm to
aggregate belief degrees, which has been developed on the belief decision matrix, decision theory and
the evidence combination rule of the Dempster-Shafer theory (1976). Where there are uncertainties,
the ER algorithm can generate a lower bound and an upper bound of the performance of an alternative
to indicate the sensitivity of the outcomes to uncertainties. To facilitate the applications of the ER-
AHP approach, a software package called Intelligent Decision System (IDS) is developed and it is
used for carrying out the case study described in the next section.
4. Model and process for NPD project screening
4.1. NPD project screening model

9
Past research has developed a number of models which comprise criteria for making NPD project
screening decisions (Chenu and Wilemon, 1973; Cooper and Brentani, 1984; Rochford, 1991). The
criteria include a set of factors affecting the success of new product commercialization, viz. marketing
competencies, product features, financial risk, and company capabilities. Calantone, et al. (1999)
developed a model which comprises comprehensive criteria for making NPD project screening
decisions. However, since the screening criteria were developed by a group of experts of a company,
not all the criteria may suit the needs of most companies. To enhance the applicability of the model,
we revised some of the criteria to generate a generic NPD project screening model which could more
likely be adopted by industries.
As depicted in Figure 1, the NPD project screening model has five criteria, namely Fit with firm’s
core marketing competencies (MKTFIT), Fit with firm’s core manufacturing competencies
(MANUFIT), Fit with customer’s requirements (CUSTFIT), Financial risk of projects (FINRISK),
and Uncertainty about project’s outcomes (UNCERT). The criteria are organized into a hierarchical
structure which has two levels. The first level shows the five criteria, while the second level consists
of the sub-criteria. Definitions of the criteria and sub-criteria are displayed in Table 1. Although this
model covers the essential criteria of project screening, companies may adjust the model by changing
the criteria according to specific companies’ needs.
Figure 1. NPD project screening model
NPD Project Screening (Probability of success)
MKTFIT MANUFIT UNCERT FINRISK CUSTFIT
TIMING
PRICE
LOGISTICS
SALES
MFGTECH
MFGCAP
SUPPLY
DESIGN
RELIA
REVENUE
EXPEND
R&DUNC
NONR&D
Level 1
Level 2

10
1. MKTFIT Fit with firm’s core marketing competencies 1.1 TIMING The product matches the target launch timing needed by our target segment 1.2 PRICE The product matches the target price level for our target segment 1.3 LOGISTICS The product fits with our logistics and distribution strengths 1.4 SALES The product fits with our salesforce coverage and strengths 2. MANUFIT Fit with firm’s core manufacturing competencies 2.1 MFGTECH The product fits with our manufacturing technology 2.2 MFGCAP The manufacturing capacity matches demands 2.3 SUPPLY The product allows us to use our good suppliers 3. CUSTFIT Fit with customer’s requirements 3.1 DESIGN The product is designed for the requirements needed by the customer 3.2 RELIA The product meets the target reliability level 4. FINRISK Financial risk of projects 4.1 REVENUE Expected revenue 4.2 EXPEND Expected expenditure 5. UNCERT Uncertainty about project’s outcomes 5.1 R&DUNC Technological uncertainties in research and product design. 5.2 NONR&D Uncertainties which are not related to research and product design (e.g.
changes in government’s regulations and markets)
Table 1. Definitions of the screening criteria and sub-criteria
4.2. Evaluation process for NPD project screening
New product development (NPD) is a cross-functional task, which normally involves contributions
from marketing, engineering, and manufacturing functions. A group based decision making system is
thus essential for NPD project evaluation in early design stages. However, the contribution (weight)
of an individual function to a particular evaluation criterion is varying. The proposed evaluation
process has four steps. Steps 1 to 3 are to formulate the evaluation model, while step 4 is to evaluate
NPD projects with the determination of probability of success.
Step 1. Top management assigns the weight of each product development team member (Marketing,
Engineering, and Manufacturing) for the level 1 criteria of the evaluation model.
Step 2. Top management evaluates the importance weights of the level 1 criteria of the evaluation
model using AHP*.
Step 3. NPD team members evaluate the importance weights of the model elements (whole model)
respectively using AHP*.
Step 4. NPD team members evaluate NPD projects using the evaluation model and developed
methodologies#.

11
* Referring to the NPD project screening model shown in Figure 1, the resulting importance weights
of the level 1 criteria should be calculated by taking into consideration both the judgments of the top
management and the product development team members, of which the ratio of the two groups of
judgments is 1:1 (Top management 0.5, marketing 0.167, engineering 0.167, manufacturing 0.167).
For level 2 criteria, only the judgments of the product development team members are considered.
The weight of each team member (i.e. marketing, engineering, and manufacturing) is based on the
weights obtained in step 1.
# The evaluation results should be obtained by synthesizing the judgments of the product development
team members, of which the ratio is based on the weights obtained in step 1.
5. Case study
5.1 Background of the company
This section presents a case study to demonstrate the application of the proposed Group-based ER-
AHP approach to NPD project screening. The studied company is a manufacturer headquartered in
Hong Kong, which manufactures a wide range of electronic entertainment products in its factory in
southern China. Other than manufacturing, the company also markets its products in various countries
including United States, the United Kingdom, Canada and Hong Kong. Every year, the company
identifies market requirements and comes up a list of potential NPD projects. Selection of right
projects is one of the key factors that determine company’s success. Thus, it is imperative to have a
reliable system to evaluate the potential projects.
5.2 Description of projects for evaluation
There are two projects selected for the study, namely, an interactive baseball TV game and a handheld
fishing game. The NPD team of the company generated the product ideas of an interactive baseball
TV game and a handheld fishing game. Because of resource constraints, only one of them could be
selected for commercialization. The details of the two projects are presented below.
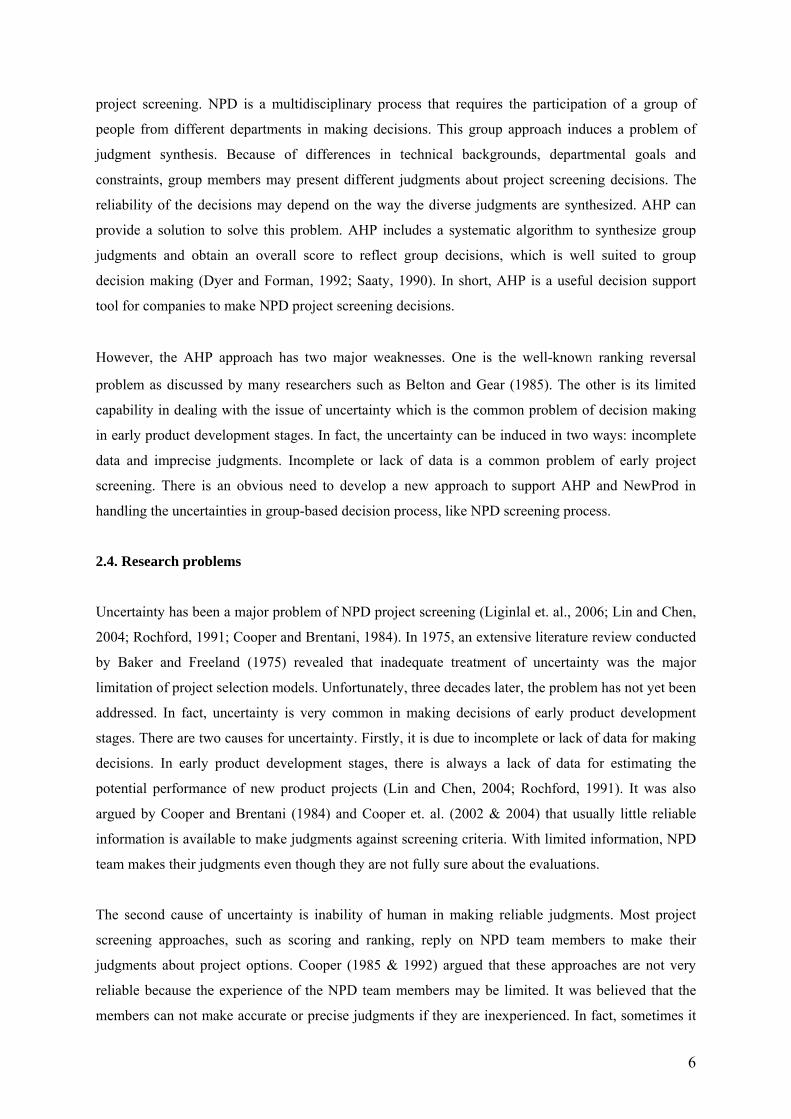
The Interactive Baseball TV Game is an interactive game with which customers can play a virtual
baseball game against a friend or computer using a wireless bat. This is a brand new product that has
very high market potential. However, the product development project is highly risky because of high
product price, uncertain distribution channel, high technological risk, and uncertainty of material/part
availability.
12
The Handheld Fishing Game is a virtual fishing game that enables customers to feel the excitement of
real fishing. With the product, customers can cast, feel the fish bite, set the hook with a jerk, and reel
in the fish with a real handle. The product is an extension of the existing product lines. The market is
very mature and stable and there are limited risks in R&D, manufacturing and distribution. However,
the expected profit is not high.
Figure 2: Interactive baseball TV game
Figure 3: Handheld fishing game
5.3 Data collection and calculation
5.3.1. Formulation of the group-AHP evaluation model
1. Based on the evaluation model and process mentioned in section 4, the following data were
collected to formulate the company’s evaluation model on NPD project screening. The weight of
the NPD team members for each of the level 1 criteria, which is determined by the top
management (Appendix 1)
2. The importance weights of the level 1 criteria of the evaluation model, which are determined by
the top management (Appendix 2)
3. The importance weights of the model elements, which are determined by the NPD team members
(Appendix 3)
The resulting importance weights of the level 1 criteria are calculated by taking into consideration
both the judgments of the top management and the product development team members, of which the
ratio of the two groups of judgments is 1:1 (Top management 0.5, marketing 0.167, engineering 0.167,
manufacturing 0.167).

13
5.3.2. Evaluation scales and guidelines
In addition to the weightings, two general evaluation scales and guidelines of NPD projects screening
are developed. One is for evaluating items with a target value, while another one is for items without
specific target values.
Type 1: 1-7 scale – for an evaluation with a target value (5) which is predetermined according to
companies or industries situations, exceeding the value (6-7) could make additional contributions.
Scale 1# 2 3 4 5 6 7 Definition Not meet
target Marginally meet target
Fairly meet target
Mostly meet target
Meet target
Exceed target
Well exceed target
#A warning symbol to indicate that the project is disqualified because the criterion cannot be met.
Type 2: 1-5 scale – for an evaluation with no target values specified. The highest value (5) indicates a
perfect situation, exceeding the highest value does not make additional contributions.
Scale 1# 2 3 4 5 Definition 1 Not fit Marginally
fit Fairly fit Mostly fit Perfectly fit
Definition 2 Not match Marginally match
Fairly match Mostly match
Perfectly match
Definition 3 Not acceptable
Marginally acceptable
Fair Satisfactory Perfect
#A warning symbol to indicate that the project is disqualified because the criterion cannot be met.
According to these two general guidelines, the specific evaluation scales for each criteria of the
selected two NPD projects in this case study are developed as shown in Appendix 4. The following is
an example of the evaluation scale of “Supply”.
Evaluation scale of “SUPPLY” – in terms of confidence level about the fit
Scale 1 2 3 4 5 Value ≤60% 70% 80% 90% 100% Notes : 100% indicates that the product perfectly fits with the current supply base. A decrease of the
fit is undesirable and the limit is 60% which is extremely unacceptable.
It is noted that screening decisions can be made based on the number of warning symbols and the total
evaluation score. Companies need to take actions to remove the warning symbols; otherwise a project
should not be commercialized. To calculate the total evaluation score of each proposed NDP project, a
utility function needs to be defined for each evaluation scale.

14
A utility function represents the preferences of decision makers towards each point in the evaluation
scale. The utility of each point is normally a number between 0 and 1, with 0 corresponding to the
least favorable point and 1 the most favorable one. The utilities of the other points are normally
monotonically distributed between 0 and 1. More details on utility theory can be found in many
references such as Keeney and Raiffa (1976) and French (1986).
Using utilities as a common scale, the performances of different NPD projects on different criteria can
be measured and compared. The equivalence relationships among different evaluation scales can also
be established based on such a common scale. For the two evaluation scales used in the case study, it
is agreed by the decision makers, the NPD team members, that their utility functions are linear. That
is, for the 7 point scale, the utilities for the points are 0, 0.167, 0.333, …, and 1, respectively, and for
the 5 point scale, they are 0, 0.25, 0.5…, and 1, respectively. An assessment made using the 7 point
scale can be equivalently (in terms of utility) transformed into a 5-point one using a belief structure.
For example, if a project is assessed to be “Fairly meet target”, the 3rd point in the 7 point scale with a
utility of 0.333, the assessment can be transformed into the following equivalent assessment based on
the 5 point scale: The project is “Marginally acceptable” to a degree of 66.7% and “Fair” to a degree
of 33.3%. Because the utilities of “Marginally acceptable” and “Fair”, the 2nd and 3rd points in the 5
point scale, are 0.25 and 0.5 respectively, the utility of [(66.7%, Marginally acceptable), (33.3%,
Fair)] is 66.7%✕0.25+33.3%✕0.5=0.333, which is the same as the one based on the 7 point scale.
5.3.3. Evaluations of two NPD projects by NPD team members
After formulating the evaluation model in terms of criteria, weights and evaluation scales, data and
expert judgments for the two NPD projects on each criterion were collected from the NPD team
members of the company. The judgments are associated with uncertainties that can be presented in
interval values, or in a belief structure, or even unknown. For instance, for the evaluation of the
“Supply” criterion (how the new product allows the company to use their existing good suppliers), the
team members can reply in the following format:
With respect to SUPPLY - The product allows us to use our good suppliers
Evaluation Interactive Baseball TV Game Project
2 (marginally fit) – 3 (fairly fit) : 20% 4 (mostly fit) – 5 (perfectly fit) : 60% unknown : 20%
Handheld Fishing Game Project 5 (perfectly fit) : 100%

15
Comparatively, more uncertainties are noticed in the evaluation of the Interactive Baseball TV Game
Project than the Handheld Fishing Game Project as the company does not have the experience with
the novel Interactive TV Game as much as the Fishing Game. The evaluations of the two NPD
projects by the NPD team members are shown in Appendix 5.
6. Evaluation with Aggregated Information
To facilitate the evaluation process, a software system is developed on the basis of a software shell
called IDS (Intelligent Decision System) which is developed by the authors, Prof. JianBo Yang and
Dr. Dongling Xu, of The University of Manchester. The calculated results and graphs generated by
using the IDS are presented and discussed as follows.
6.1 Hierarchy structure of calculation
For calculation purpose, one more layer is added between the original Level 1 and Level 2 attributes
of the NPD project screening model, as Level 1A. In this new hierarchy, as shown in Figure 4, Level
1 attributes are the 5 main areas given previously. Level 1A attributes are the three departmental
experts in the NPD team. As indicated in Appendix 1, for each area represented by a Level 1 attribute,
the opinions of the three departments carry different weights to reflect the levels of expertise of the
departments in the area. Also from Appendix 5, we can see that the performance of a NPD project in
each area is assessed by the three departmental experts. To aggregate the assessment information from
different experts, we can use the weights given in Appendix 1 to reflect the importance (or credibility)
of their opinions in each area. For example, in the MKFIT area, Marketing Department has
significantly more knowledge and experience than the other two departments, and therefore a heavier
weight to its assessment information. Such logic is accomplished through the adding of the new Level
1A attributes. Level 2 attributes are the various elements associated with the NPD projects and are
assessed by each of the three departments in the NPD team.

16
Figure4 : Hierarchical structure of the IDS based calculation
6.2 Calculated weights of attributes
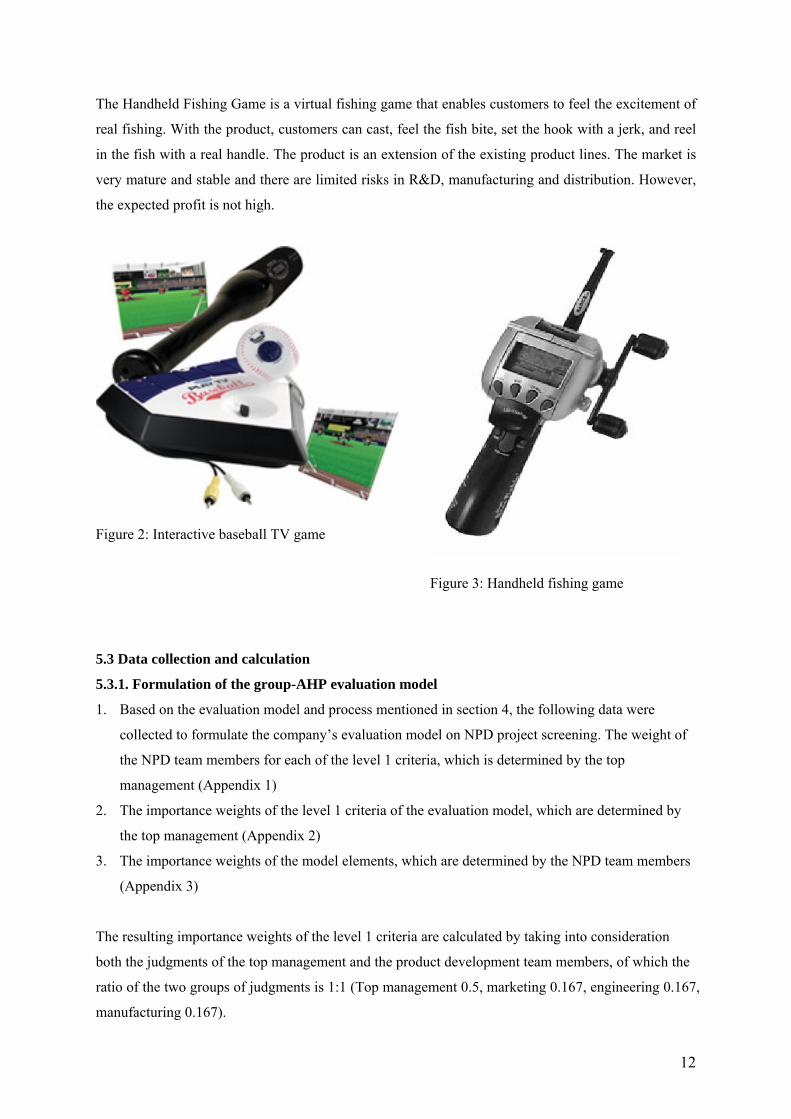
Level 1 attribute weights are calculated as presented in Table 2 as Synthesized AHP results. Level 1A
attribute weights are assigned by top management as given in Appendix 1. The weights for Level 2
attributes are calculated from the pairwise comparison matrices shown in Appendix 3. Hence, the
weightings of all criteria in all levels are calculated as shown in Table 3.
Market Manu Eng TopManSynthesized (0.5*Topmgt+0.16667*( Market+Manu+Eng)
MKFIT 0.3198 0.2226 0.2439 0.3139 0.288MANUFIT 0.0408 0.1523 0.0334 0.1354 0.10545CUSTFIT 0.3197 0.2002 0.2827 0.1054 0.186467FINRISK 0.1517 0.2318 0.1961 0.1602 0.1767UNCERT 0.168 0.1931 0.2439 0.2851 0.243383
Table 2: Calculation of synthesized AHP results in Level 1
17
LEVEL 1 (Table 2 ) LEVEL 1A Attribute Weights (From Appendix 1)
LEVEL 2 Attribute Weights (calculated)
Marketing=0.6 TIMING=0.3383 PRICE=0.2879 LOGISTICS=0.2046 SALES=0.1692
Engineering=0.3 TIMING=0.3383 PRICE=0.2879 LOGISTICS=0.1692 SALES=0.2046
MKTFIT=0.288
Manufacturing =0.1 TIMING=0.2463 PRICE=0.3465 LOGISTICS=0.2036 SALES=0.2036
Marketing=0.1 MFGTECH=0.4 MFGCAP=0.4 SUPPLY=0.2
Engineering=0.4 MFGTECH=0.4126 MFGCAP=0.2599 SUPPLY=0.3275
MANUFIT=0.105
Manufacturing=0.5 MFGTECH=0.3333 MFGCAP=0.3333 SUPPLY=0.3333
Marketing=0.7 DESIGN=0.5 RELIA=0.5
Engineering=0.3 DESIGN=0.5 RELIA=0.5
CUSTFIT=0.186
Manufacturing=0 DESIGN=0.5 RELIA=0.5
Marketing=0.7 REVENUE=0.5 EXPEND=0.5
Engineering=0.3 REVENUE=0.5 EXPEND=0.5
FINRISK=0.177
Manufacturing=0 REVENUE=0.5 EXPEND=0.5
Marketing=0.5 R&DUNC=0.75 NONR&D=0.25
Engineering=0.4 R&DUNC=0.8333 NONR&D=0.1667
UNCERT=0.243
Manufacturing =0.1 R&DUNC=0.8333 NONR&D=0.1667
Table 3: Calculated synthesized AHP results in Level 2
6.3 Utility of Evaluation Scales
Utility is a value between 0 and 1 used to represent the preferences of decision makers towards the
points in the evaluation scales, with 0 representing the most undesirable and 1 the most desirable.

18
From the description given in Appendix 4, it is reasonable to assume that the points of evaluation
scales and their corresponding utilities are in linear relationship. For the 5 and 7 point scales given in
Appendix 4, the utility of each point is assumed to be as shown as follows.
Scale 1# 2 3 4 5 Utility 0 0.25 05 0.75 1
Scale 1# 2 3 4 5 6 7 Utility 0 0.167 0.333 0.5 0.667 0.833 0
6.3 Handling of Assessment Information
For the case study, the two competitive NPD projects are the Interactive Baseball TV Game and the
Fishing Game. The assessment information provided by the three NPD project team members is
shown in Appendix 5. There are various types of uncertainties in the assessment data: Probability,
unknown (global ignorance), and grade intervals (local ignorance or local unknown).
To aggregate the assessment information, the IDS software is employed. To identify the effects of the
uncertainties on the aggregated outcomes, the best and worst possible performances of each NPD
project are analyzed.
To identify the best possible performance of a project, it is assumed that the unknown information
(both locally and globally) in each assessment turns out to be favorable. For example, if Baseball
project is assessed on Revenue to be {(3-5, 70%); (unknown, 30%)}, the best case scenario is that the
30% of unknown turns out to be in grade 5 and the 70% of grade 3-5 performance turns out to be all
in grade 5. Therefore the performance of the Baseball project in the best case scenario is calculated by
assuming that the assessment is {(5, 70%); (5, 30%)}={(5, 100%)}.
Similarly, the worst case scenario would be that all the local and global unknown information turns
out to be unfavorable. For example, the assessment {(3-5, 70%); (unknown, 30%)} would be assumed
to be {(3, 70%); (1, 30%)}.
To record the best and worst case scenarios for each project, 4 alternatives are created using the IDS
software: Baseball (Best Case Scenario), Baseball (Worst Case), Fishing (Best Case) and Fishing
(Worst Case). The 4 alternatives are denoted by BW (Baseball Worst), BB, FW and FB respectively.

19
6.4 Overall Project Performances
6.4.1 Performance Scores
The overall performance scores of the 4 alternatives, as shown in Figure 5, are given by:
U(BW) = 0.54
U(BB) = 0.85
U(FW) = 0.77
U(FB) = 0.90
Figure 5: Performance Scores of the 2 Projects in Their Best and Worst Case Scenarios
From Fig. 5, we can see that the Fishing Game project may outperform the Baseball project because
the former has higher scores than the latter in both worst and best cases respectively. However, as the
score of Fishing in the worst case is lower than the score of Baseball in the best case, there is still a
potential that Baseball Game project may outperform the Fishing Game project.
We can also see from Fig. 5 that there is more uncertainty in the Baseball project than that in Fishing,
because U(BB)-U(BW) = 0.31 > U(FB)-U(FW) = 0.13.
6.4.2 Performance Distributions
Performance distributions reveal the composition (represented by belief degrees) of strengths
(represented by preferred grades or points in a scale) and weaknesses (represented by undesirable

20
grades or points in a scale) of each project. The distributions of the 4 alternatives are shown in Fig. 6.
It shows that the Fishing Game project (whether in its best or worst cases) has more “Best”
components than the Baseball Game project, while Baseball Game project has more “Good”
components than Fishing Game project.
Figure 6: Project Performance Distributions
6.5 Project Performances in Sub Areas
6.5.1 Performance Scores
The performance scores in sub areas reveal the winner and loser in each of the sub areas. We can see
from Fig 7 that the Fishing Game project outperforms the Baseball Game project in MKFIT,
MANFIT, while the Baseball Game project performs well in CUSTFIT.

21
Figure 7: Performance Scores of Projects in Sub Areas
6.5.2 Performance Distributions
Performance distributions can also be generated for each of the sub areas if necessary. Fig. 7 shows
the distributions in the UNCERT area. It tells us that the Fishing Game project performs consistently
well in this area.
Figure 7: Performance Distributions of Projects in UNCERT Area

22
6.6. Overall evaluation result
As the outcomes as discussed in the previous sections are not so conclusive in this case study,
generally the following are suggested:
1) Gather more information to reduce uncertainties
2) Reconsider the attribute weights
3) Make a decision based on the available information and analysis
The 1st option requires more time and efforts in data collection and the subsequent analysis. It
depends on the availability of more data and information of higher certainty. External experts and
consultants may sometimes be required. The 2nd option also either needs the involvement of project
team members, maybe with more other internal/external experts, to re-evaluate the attribute weights.
The 3rd option may have to be taken when options 1 and 2 are not justifiable or can not offer further
information to distinguish the performances of different alternatives. The average performance score
of the best and worst case of each project is a good indicator for ranking purposes. Based on such an
indicator, in this case study, the Fishing Game project is a preferred project.
7. Conclusions
There is a need to tackle the problem of uncertainty which may impair the reliability of the NPD
project screening results. Incomplete data and human inability of making accurate judgments are
common in practice, which need to be addressed for better decision making. The Group based ER-
AHP method presented in previous sections can be used to address the problem of uncertainty in
project screening. The proposed method is capable of handling both incomplete and imprecise
judgments, which can effectively tackle the problem of uncertainty and in turn improve decision
making quality of project screening. It also facilitates the group-based decision making in the project
screening process. A case study, with data collection procedure, calculations and results, is introduced
to illustrate the application of the method to project screening.
The authors extend the basic AHP algorithm to consider uncertainties caused by interval-valued
evaluations, which always happen in NPD project screening problem. The developed ER-AHP
methodology could improve the decision analysis on the basis of taking into account two kinds of
interval-valued evaluations, interval grades and interval assessment in possibilities. As shown in the
case study, the industrial experts’ judgments are associated with uncertainties that are a combination
of qualitative, quantitative and vague information in various forms. The typical formats of data and

23
information employed in the industry are described in a precise number, an interval value, and a belief
structure. The ER-AHP methodology is able to deal with these uncertain data and information with
intervals, probabilities, and unknown embedded, etc.
To illustrate the contribution of this research to the practice, the authors formulated a NPD project
screening evaluation framework incorporated with the ER-AHP methodology for the implementation
through a case study. A hierarchal project screening evaluation model is proposed, which constitutes
five categories of criteria, namely marketing competencies, manufacturing competencies, customers’
requirements, financial risks, and uncertainties of project outcomes. The model consists of thirteen
evaluation criteria in 2 levels. The AHP method is used to determine the weightings of individual
criteria. In addition, a group-based approach is suggested to facilitate the group-based decision
making in the project screening process. This provides a way of implementing the Group ER-AHP
evaluation methodology.
The development of this group based ER-AHP new product project screening methodology is
motivated by practicing product managers trying to make decisions about choices of alternative new
product concepts. The authors have demonstrated the applicability of the methodology through a case
study. This case study, however, is not the full validation of the methodology, as it only demonstrates
its applicability in one company. Therefore, for future work, the methodology will be validated in
more companies and even in different industries.

24
Appendix 1: The weights of the NPD team members for each of the level 1 criteria (determined by the top management)
MKTFIT MANUFIT CUSTFIT FINRISK UNCERT Marketing 0.6 0.1 0.7 0.7 0.5 Engineering 0.3 0.4 0.3 0.3 0.4 Manufacturing 0.1 0.5 0 0 0.1
Appendix 2: The importance weights of the level 1 criteria of the evaluation model
(determined by the top management with AHP approach)
MKTFIT MANUFIT CUSTFIT FINRISK UNCERT MKTFIT
1 3 4 1
MANUFIT
1 1/2 1/3
CUSTFIT
1/2 1/2
FINRISK
1/2
UNCERT
Weights ** 0.3139 0.1354 0.1054 0.1602 0.2851Table 1 Level 1 Overall model
CR=0.1
** Weights are calculated using the Eigenvector (AHP) method in the IDS software

25
Appendix 3: The importance weights of the model elements (determined by the NPD
team members by AHP)
Marketing
MKTFIT MANUFIT CUSTFIT FINRISK UNCERT MKTFIT
8 1 2 2
MANUFIT
1/8 1/3 1/5
CUSTFIT
2 2
FINRISK
1
UNCERT
Weights ** 0.3198 0.0408 0.3197 0.1517 0.1680 Table 1 Level 1 Overall model CR=0.01
TIMING PRICE LOGISTICS SALES TIMING
1 2 2
PRICE
1 2
LOGISTICS
1
SALES
Weights ** 0.3383 0.2879 0.2046 0.1692 Table 2 Level 2 MKTFIT - Fit with firm’s core marketing competencies CR=0.02

26
MFGTECH MFGCAP SUPPLY
MFGTECH
1 2
MFGCAP
2
SUPPLY
Weights ** 0.4 0.4 0.2 Table 3 Level 2 MANUFIT - Fit with firm’s core manufacturing competencies
CR=0
DESIGN RELIA
DESIGN
1
RELIA
Weights ** 0.5 0.5 Table 4 Level 2 CUSTFIT - Fit with customer’ requirements
REVENUE EXPEND
REVENUE
1
EXPEND
Weights ** 0.5 0.5 Table 5 Level 2 FINRISK - Total dollar risk profile of the project
R&DUNC NONR&D
R&DUNC
3
NONR&D
Weights ** 0.75 0.25 Table 6 Level 2 UNCERT - Uncertainty about project’s outcomes

27
Engineering
MKTFIT MANUFIT CUSTFIT FINRISK UNCERT MKTFIT
8 1 1 1
MANUFIT
1/8 1/5 1/8
CUSTFIT
2 1
FINRISK
1
UNCERT
Weights ** 0.2439 0.0334 0.2827 0.1961 0.2439 Table 1 Level 1 Overall model CR=0.015
TIMING PRICE LOGISTICS SALES
TIMING
1 2 2
PRICE
2 1
LOGISTICS
1
SALES
Weights ** 0.3383 0.2879 0.1692 0.2046 Table 2 Level 2 MKTFIT - Fit with firm’s core marketing competencies CR=0.02
28
MFGTECH MFGCAP SUPPLY
MFGTECH
2 1
MFGCAP
1
SUPPLY
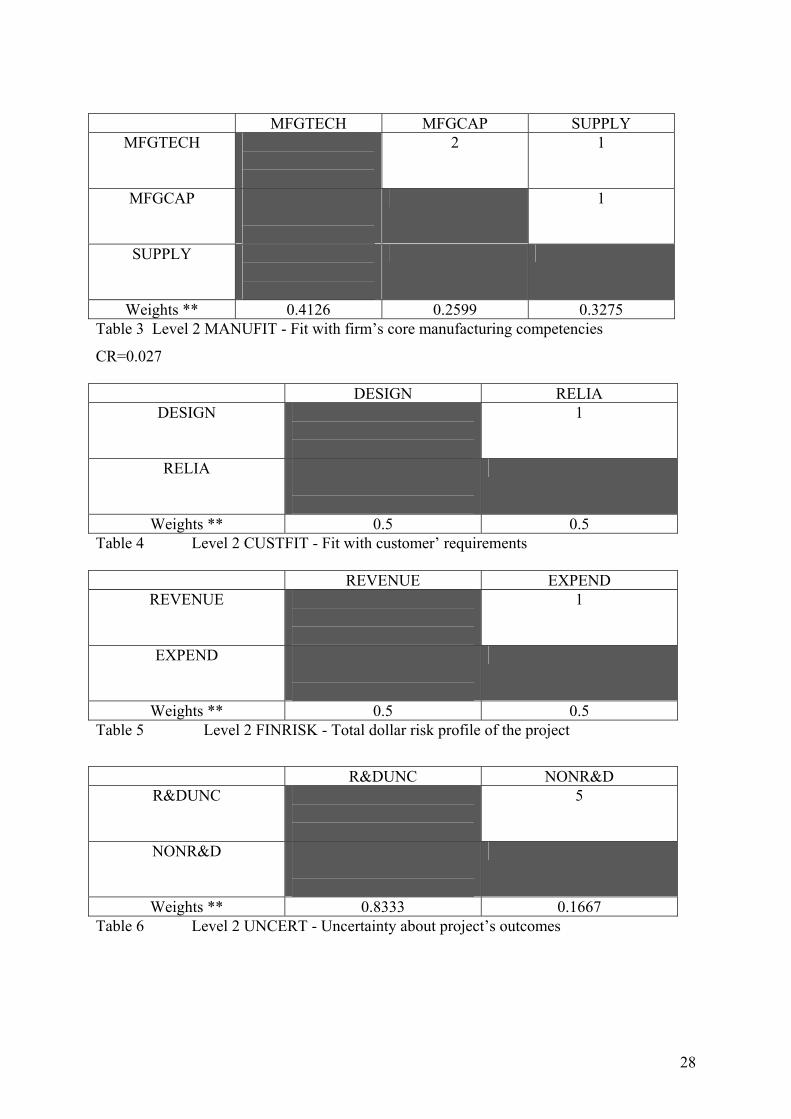
Weights ** 0.4126 0.2599 0.3275 Table 3 Level 2 MANUFIT - Fit with firm’s core manufacturing competencies
CR=0.027
DESIGN RELIA DESIGN
1
RELIA
Weights ** 0.5 0.5 Table 4 Level 2 CUSTFIT - Fit with customer’ requirements
REVENUE EXPEND
REVENUE
1
EXPEND
Weights ** 0.5 0.5 Table 5 Level 2 FINRISK - Total dollar risk profile of the project
R&DUNC NONR&D
R&DUNC
5
NONR&D
Weights ** 0.8333 0.1667 Table 6 Level 2 UNCERT - Uncertainty about project’s outcomes

29
Manufacturing
MKTFIT MANUFIT CUSTFIT FINRISK UNCERT MKTFIT
2 1 1 1
MANUFIT
1/2 1 1
CUSTFIT
1/2 1
FINRISK
1
UNCERT
Weights ** 0.2226 0.1523 0.2002 0.2318 0.1931 Table 1 Level 1 Overall model CR=0.04
TIMING PRICE LOGISTICS SALES TIMING
1 1 1
PRICE
2 2
LOGISTICS
1
SALES
Weights ** 0.2463 0.3465 0.2036 0.20336 Table 2 Level 2 MKTFIT - Fit with firm’s core marketing competencies CR=0.02

30
MFGTECH MFGCAP SUPPLY
MFGTECH
1 1
MFGCAP
1
SUPPLY
Weights ** 0.3333 0.3333 0.3333 Table 3 Level 2 MANUFIT - Fit with firm’s core manufacturing competencies
CR=0
DESIGN RELIA DESIGN
1
RELIA
Weights ** 0.5 0.5 Table 4 Level 2 CUSTFIT - Fit with customer’ requirements
REVENUE EXPEND
REVENUE
1
EXPEND
Weights ** 0.5 0.5 Table 5 Level 2 FINRISK - Total dollar risk profile of the project
R&DUNC NONR&D
R&DUNC
5
NONR&D
Weights ** 0.8333 0.1667 Table 6 Level 2 UNCERT - Uncertainty about project’s outcomes

31
Appendix 4: The specific evaluation scales and guidelines for each model criteria of
NPD projects of this case study
1.1 TIMING – in terms of delivery time for Christmas sales
Scale 1 2 3 4 5 6 7 Value Beyond
Nov End Nov Mid Nov Early
Nov End Oct Mid Oct Before
Early Oct Explanation: The target launch time of the product is set to match the Christmas sales in overseas markets. Thus, it is targeted to deliver the products in End Oct. Earlier delivery, Before End Oct, is preferable. Some degree of late delivery is tolerable. However, it is extremely unacceptable if it is delivered Beyond Nov because the peak sales period will be over when the products arrive at the market. 1.2 PRICING – in terms of percentage of deviation from the target price level
Scale 1 2 3 4 5 6 7 Value ≥+20% +15% +10% +5% 0% -5% ≤-10%
Explanation: A target price level is predetermined based on market situations. It is satisfactory to meet the target, which means zero deviation from the target. However, it is undesirable if the price is higher the target. The limit is 20% of the deviation. It is extremely unacceptable if the price is more than 20% of the target. On the other hand, if the products can be launched at a cheaper price, it is preferable because of marketing advantages 1.3 LOGISTICS – in terms of confidence level about the fit Scale 1 2 3 4 5 Value ≤60% 70% 80% 90% 100% Explanation: 100% indicates that the product perfectly fits with the logistics and distribution channel. A decrease of the fit is undesirable and the limit is 60% which is extremely unacceptable. 1.4 SALESFORCE - in terms of confidence level about the fit Scale 1 2 3 4 5 Value ≤60% 70% 80% 90% 100% Explanation: 100% indicates that the product perfectly fits with the salesforce coverage and strengths. A decrease of the fit is undesirable and the limit is 60% which is extremely unacceptable. 2.1 MFGTECH – in terms of confidence level about the fit Scale 1 2 3 4 5 Value ≤60% 70% 80% 90% 100% Explanation: 100% indicates that the product perfectly fits with the manufacturing technology. A decrease of the fit is undesirable and the limit is 60% which is extremely unacceptable. 2.2 MFGCAP – in terms of confidence level about the fit Scale 1 2 3 4 5 Value ≤60% 70% 80% 90% 100% Explanation: 100% indicates that the product perfectly fits with the manufacturing capacity. A decrease of the fit is undesirable and the limit is 60% which is extremely unacceptable. 2.3 SUPPLY – in terms of confidence level about the fit Scale 1 2 3 4 5 Value ≤60% 70% 80% 90% 100% Explanation: 100% indicates that the product perfectly fits with the current supply base. A decrease of the fit is undesirable and the limit is 60% which is extremely unacceptable.

32
3.1 DESIGN – in terms of extent to which the requirements are met Scale 1 2 3 4 5 6 7 Value ≤80%
meet 85% meet
90% meet
95% meet
100% meet
10% additional features
20% additional features
Explanation: It is desirable that all the customer requirements are met. It is very important to meet the requirements. It is extremely unacceptable if only 80% or less of the requirements can be met. On the other hand, it is preferable if the product can deliver additional features that are required by customers, but not yet voiced out. 3.2 RELIA – in terms of percentage of deviation from the target reliability level
Scale 1 2 3 4 5 6 7 Value ≤-20%) -15% -10% -5% 0% +5% ≥+10%
Explanation: A reliability level is. It is satisfactory to meet the target, which means zero deviation from the target. However, it is undesirable if the estimated reliability is lower the target. The limit is 20% of the deviation. It is extremely unacceptable if the reliability is lower than the target. On the other hand, reliability that is higher than the target is preferable as it will lead to higher customer satisfaction. 4.1 REVENUE – in terms of probability of meeting the target revenue level Scale 1 2 3 4 5 Value ≤80% 85% 90% 95% 100% Explanation: 100% indicates that the product perfectly meets the target revenue level. A decrease of the value is undesirable and the limit is 80% which is extremely unacceptable. 4.2 EXPEND – in terms of probability of meeting the target expenditure level Scale 1 2 3 4 5 Value ≤80% 85% 90% 95% 100% Explanation: 100% indicates that the product perfectly meets the target expenditure level. A decrease of the value is undesirable and the limit is 80% which is extremely unacceptable. 5.1. R&DUNC – in terms of the uncertainty Scale 1 2 3 4 5 Value ≥20% 15% 10% 5% 0% Explanation: 0% indicates a perfect situation that there is no technological uncertainty. An increase of the uncertainty is undesirable and the limit is 20% which is extremely unacceptable. 5.2. NONR&D – in terms of the uncertainty Scale 1 2 3 4 5 Value ≥20% 15% 10% 5% 0% Explanation: 0% indicates a perfect situation that there is no uncertainty that are not related to research and product design. An increase of the uncertainty is undesirable and the limit is 20% which is extremely unacceptable.

33
Appendix 5: The evaluations of NPD projects by the NPD team members for this case
study
The weights of the NPD team members for each of the level 1 criterion
MKTFIT MANUFIT CUSTFIT FINRISK UNCERT Marketing 0.6 0.1 0.7 0.7 0.5 Engineering 0.3 0.4 0.3 0.3 0.4 Manufacturing 0.1 0.5 0 0 0.1
Marketing
With respect to TIMING - The product matches the desired launch timing needed by our target segment Evaluation Baseball 2:10%
3-4:30% 5:60%
Fishing 6-7:80% 5:20%
With respect to PRICE - The product matches the desired price level for our target segment
Evaluation Baseball 3:10%
4:20% 5:70%
Fishing 4:10% 5:80% 6:10%
With respect to LOGISTICS - The product fits with our logistics and distribution strengths
Evaluation Baseball 2:30%
3-4:70% Fishing 4:10%
5:90% With respect to SALES - The product fits with our salesforce coverage and strengths
Evaluation Baseball 3-4:100% Fishing 4:10%
5:90% With respect to MFGTECH - The product fits with our manufacturing technology
Evaluation Baseball 3-5:70%
unknown:30% Fishing 5:100%

34
With respect to MFGCAP - The manufacturing capacity matches demands
Evaluation Baseball 3-5:70%
unknown:30% Fishing 5:100% With respect to SUPPLY - The product allows us to use our good suppliers
Evaluation Baseball 4-5:70%
unknown:30% Fishing 5:100% With respect to DESIGN - The product is designed for the requirements needed by the customer
Evaluation Baseball 6:20%
7:80% Fishing 3-4:20%
4-5:80%
With respect to RELIA - The product meets the target reliability level
Evaluation Baseball 3-5:70%
unknown:30% Fishing 5:100% With respect to REVENUE – Expected revenue
Evaluation Baseball 4-5:70%
unknown:30% Fishing 2-3:30%
4-5:70% With respect to EXPEND – Expected expenditure
Evaluation Baseball 3-5:80%
unknown:20% Fishing 4-5:100% With respect to R&DUNC - Technological uncertainties in research and product design
Evaluation Baseball 3-5:70%
unknown:30% Fishing 4-5:100%

35
With respect to NONR&D- Uncertainties which are not related to research and product design
Evaluation Baseball 3-5:70%
unknown:30% Fishing 3:20%
4-5:80%
Engineering
With respect to TIMING - The product matches the desired launch timing needed by our target segment
Evaluation Baseball 2:10%
3-4:40% 5:50%
Fishing 5:20% 6-7:80%
With respect to PRICE - The product matches the desired price level for our target segment
Evaluation Baseball 2-3:10%
4:30% 5:60%
Fishing 4:10% 5:80% 6:10%
With respect to LOGISTICS - The product fits with our logistics and distribution strengths
Evaluation Baseball 4:80%
unknown:20% Fishing 5:100%
With respect to SALES - The product fits with our salesforce coverage and strengths
Evaluation Baseball 4-5:80%
unknown:20% Fishing 5:100%
With respect to MFGTECH - The product fits with our manufacturing technology
Evaluation Baseball 3:20%
4:80% Fishing 4:5%
5:95%
With respect to MFGCAP - The manufacturing capacity matches demands

36
Evaluation Baseball 3:20%
4:80% Fishing 5:100% With respect to SUPPLY - The product allows us to use our good suppliers
Evaluation Baseball 2-3:30%
4-5:70% Fishing 5:100% With respect to DESIGN- The product is designed for the requirements needed by the customer
Evaluation Baseball 6-7: 80%
unknown:20% Fishing 3:10%
4:90%
With respect to RELIA - The product meets the target reliability level
Evaluation Baseball 3-4:40%
4-5:60% Fishing 4:5%
5:95% With respect to REVENUE – Expected revenue
Evaluation Baseball 4-5:80%
unknown:20% Fishing 3-5:100% With respect to EXPEND – Expected expenditure
Evaluation Baseball 3:20%
4-5:80% Fishing 4-5:100% With respect to R&DUNC - Technological uncertainties in research and product design
Evaluation Baseball 3:30%
4-5:70% Fishing 4:10%
5:90% With respect to NONR&D- Uncertainties which are not related to research and product design
Evaluation Baseball 3-5:70%
unknown:30% Fishing 4-5:80%
unknown:20%

37
Manufacturing
With respect to TIMING - The product matches the desired launch timing needed by our target segment
Evaluation Baseball 1:10%
2-4:50% 5:40%
Fishing 5:20% 6-7:80%
With respect to PRICE - The product matches the desired price level for our target segment
Evaluation Baseball 2-3:20%
4:30% 5:50%
Fishing 4:20% 5:80%
With respect to LOGISTICS - The product fits with our logistics and distribution strengths
Evaluation Baseball 4:80%
unknown:20% Fishing 5:100% With respect to SALES - The product fits with our salesforce coverage and strengths
Evaluation Baseball 4-5:80%
unknown:20% Fishing 5:100% With respect to MFGTECH - The product fits with our manufacturing technology
Evaluation Baseball 2:20%
3-4:70% unknown:10%
Fishing 4:10% 5:90%
With respect to MFGCAP - The manufacturing capacity matches demands
Evaluation Baseball 2:30%
3-4:70% Fishing 4:10%
5:90%

38
With respect to SUPPLY - The product allows us to use our good suppliers
Evaluation Baseball 2-3:20%
4-5:60% unknown:20%
Fishing 5:100%
With respect to DESIGN - The product is designed for the requirements needed by the customer
Evaluation Baseball 6-7:60%
unknown:40% Fishing 3:10%
4:90%
With respect to RELIA - The product meets the target reliability level
Evaluation Baseball 3-4:30%
4-5:50% unknown:20%
Fishing 4:5% 5:95%
With respect to REVENUE – Expected revenue
Evaluation Baseball 4-5:80%
unknown:20% Fishing 3-5:100% With respect to EXPEND – Expected expenditure
Evaluation Baseball 3:20%
4-5:70% unknown:10%
Fishing 4-5:100% With respect to R&DUNC - Technological uncertainties in research and product design
Evaluation Baseball 3:30%
4-5:70% Fishing 4:10%
5:90% With respect to NONR&D- Uncertainties which are not related to research and product design
Evaluation Baseball 3-5:70%
unknown:30% Fishing 4-5:80%
unknown:20%

39
References Baker, N., and Freeland, J., 1975, Recent Advances in R&D benefit measurement and project selection method. Management Science, Vol. 21, No. 10, pp.1164-1175. Belton V and Gear A E, 1983, On a shortcoming of Saaty’s method of analytic hierarchies, Omega, 13, pp.143-144. Calantone, R.J., Benedetto, A.D., and Schmidt, J.B., 1999, Using the Analytic Hierarchy process in new product screening. Journal of Product Innovation Management. Vol. 16, pp.65-76. Carbonell P, Escudero A and Aleman J, 2004, Technology newness and impact of go/no-go criteria on new product success, Marketing Letters, Vol.15, No.2-3, pp.81-97.
Chin K S, Pun K F, Xu Y, J S F Chan, 2002, An AHP based study of critical factors for TQM implementation in Shanghai manufacturing industries, International Journal of Technical Innovation and Entrepreneurship, Vol.22, Issue 11, pp.707-715. Coldrick S, Longhurst P, Ivey P and Hannis, 2005, An R&D options selection model for investment decisions, Technovation, Vol.25, No.3, pp.185-193. Condon E, Golden B and Wasil E, 2003, Visualizing group decisions in the AHP, Computers & Operations Research, Vol.30, pp.1435-1445. Cooper, R.G., 1984, The impact of new product strategies. Industrial Marketing Management, Vol. 12, pp.243-256. Cooper, R.G., 1992, The NewProd system: the industry experience. Journal of Product Innovation Management, Vol. 9, pp.113-127. Cooper, R.G., 1985, Selecting winning new product projects: using the NewProd system. Journal of Product Innovation Management, Vol. 2, pp.34-44. Cooper, R.G., and Brentani, U.D., 1984, Criteria for screening new industrial products. Industrial Marketing Management, Vol. 13, pp.149-156. Cooper R G, Edgett S J and Kleinchmidt E J, 2002, Optimizing the stage-gate process: what best-practice companies do, Research-Technology Management, Vol.45, No.5, pp.21-27. Cooper R G and Edgett S J, 2003, Overcoming the crunch in resources for new product development, Research-Technology Management, Vol.46, No.3, pp.48-58. Cooper R G, Edgett S J and Kleinchmidt E J, 2004, Benchmarking best NPD practices, Research-Technology Management, Vol.47, No.1, pp.31-43. Chenu, P., and Wilemon, D.L., 1973, A decision process for new product selection. Vol. 3, pp. 33-46. Dyer R F and Forman E H, 1992, Group decision support with the AHP, Decision Support System, Vol.8, Issue 2, pp.99-124.

40
Farris J A, Groesbeck R, Van Aken E and Letens G, 2006, Evaluating the relative performance of engineering design projects: A case study using data envelopment analysis, IEEE Transactions on Engineering Management, Vol.53, No.3, pp.471-482. French S, 1986, Decision Theory: an Introduction to the Mathematics of Rationality. Ellis Horwood. Gidel T, Gautier R and Duchamp R, 2005, Decision-making framework methodology: an original approach to project risk management in new product design, Journal of Engineering design, Vol.16, No.1, pp.1-23. Haque B U, Belecheanu R, Barson R and Pawar K S, 2000, Towards the application of case reasoning to decision-making in concurrent product development, Knowledge-based Systems, Vol.13, No.2-3, pp.101-112. Harker, P.T., and Vargas, L.G. 1987, Theory of Ratio Scale Estimation: Saaty's Analytic Hierarchy Process. Management Science, Vol. 33, pp. 1383-1403. Hart S, Hultink E, Tzokas N and Commandeur H, 2003, Industrial companies’ evaluation criteria in new product development gates, Journal of product Innovation Management, Vol.20, No.1, pp.22-26. Hsu Y G, Tzeng H and Shyu J, 2003, Fuzzy multiple criteria selection of government-sponsored frontier technology R&D projects, R & D Management, Vol.33, No.5, pp.539-551. Keeney R L and Raiffa H, 1976, Decisions with Multiple Objectives: Preferences and Value Trade-offs. New York, John Wiley and Sons.
Leung J P F and Chin K S, 2004, An AHP Based Study on Critical Success Factors for Supply Chain Management in Hong Kong Manufacturing Industries, Asian Journal on Quality, Vol. 5, No.2, pp.132-140. Liginlal D, Ram S and Duckstein L, 2006, Fuzzy measure theoretical approach to screening product innovations, IEEE Transaction on Systems Man and Cybernetics Part A- Systems and Humans, Vol.36, No.3, pp.577-591. Lin C and Chen C T, 2004, New product go/no-go evaluation at the front end: a fuzzy linguistic approach, 2004, IEEE Transactions on Engineering Management, Vol.51, No.2, pp.197-207. Linton J D, Walsh S and Morabito J, 2002, Analysis, ranking and selection of R&D projects in a portfolio, R & D Management, Vo. 32, No. 2, pp.139-148. Liu F H and Hai H L, 2005, “The voting analytic hierarchy process method for selecting supplier”, International Journal of Production Economics, Vol.97, pp.308-317. Mohanty R P, Agarwal R, Choudhury A K and Tiwari M, 2005, A fuzzy ANP-based approach to R&D project selection: a case study, International Journal of production Research, Vol.43, No.24, pp.5199-5216.

41
Ozer M, 1999, A survey of new product evaluation models, Journal of Product Innovation Management, Vol.16, pp77-94. Partovi F Y, 2007, “An analytical model of process choice in the chemical industry”, International Journal of Production Economics, Vol.105 (2007), pp.213-227 (available online 16 June 2006) Rangaswamy, A., and Lilien, G.L., 1997, Software tools for new product development. Journal of Marketing Research, Vol. 34, No. 1, pp. 177-184. Rochford, L., 1991, Generating and screening new product ideas. Industrial Marketing management, Vol. 20, pp.287-296. Shafer, G A 1976, Mathematical Theory of Evidence, Princeton University Press. Saaty, T.L., 1980. The Analytic Hierarchy Process. McGraw-Hill, New York. Triantaphyllou, E, 2000, Multi-Criteria Decision Making Methods: A Comparative Study, Kluwer Academic Publishers, Boston, MA, U.S.A.
Tummala V M R, Chin K S and Ho S H, 1999, Evaluation of Success Factors, Benefits and Costs for CE Implementation Using AHP: A Case Study in the Hong Kong Plastic Products Industry, International Journal of Advanced Manufacturing Systems, Vol.2, Issue 1, pp.105-119. Tummala, V.M.R., Chin, K.S., and Ho, S.H., 1997, Assessing success factors for implementing CE: a case study in Hong Kong electronics industry by AHP. International Journal of Production Economics, Vol. 49, pp. 265-283. Wei C C, Chien C F and Qang M J, 2005, “An AHP-based approach to ERP systems selection”, International Journal of Production Economics, Vol.96, pp.47-62. Winner, R.R., Pennell, J.P., Bertrand, H.E., and Slusarzuk, M.M.G., 1988, The role of concurrent engineering in weapons system acquisition IDA Report R-338, Institute for Defense Analysis. Yang J B and Sen P, 1994, A general multi-level evaluation process for hybrid MADM with uncertainty, IEEE Transactions on Systems, Man, and Cybernetics, Vol.24, No.10, pp.1458-1473. Yang J B and Singh M G, 1994, An evidential reasoning approach for multiple attribute decision making with uncertainty, IEEE Transactions on Systems, Man, and Cybernetics, Vol.24, No.1, pp.1-18. Yang J B, 2001, Rule and utility based evidential reasoning approach for multiple attribute decision analysis under uncertainty, European Journal of Operational Research, Vol. 131, No.1, pp.31-61.

42
Yang J B and Xu D L, 2002a, On the evidential reasoning algorithm for multiattribute decision analysis under uncertainty, IEEE Transactions on Systems, Man, and Cybernetics Part A: Systems and Humans, Vol.32, No.3, pp.289-304. Yang J B and Xu D L, 2002b, Nonlinear information aggregation via evidential reasoning in multiattribute decision analysis under uncertainty, IEEE Transactions on Systems, Man, and Cybernetics Part A: Systems and Humans, Vol.32, No.3, pp.376-393. Zhang Z J, Yang J B and Xu D L, 1989, A hierarchical analysis model for multiobjective decision making, in Analysis, Design and Evaluation of Man-Machine System 1989, Selected Papers from the 4th IFAC/IFIP/ IFORS/IEA Conference, Xian, P.R. China, September 1989, Pergamon, Oxford, UK, pp.13-18, 1990.