group results presentation - tiger brands procurement savings of r211 million ... r12.8bn 13%...
TRANSCRIPT

Group Results Presentation
for the year ended 30 September 2016

2Group Results Presentation for the year ended 30 September 2016
Index
Overview
Financial & operating performance
Strategic review

3Group Results Presentation for the year ended 30 September 2016
Disclaimer
Forward-looking statement
This document contains forward looking statements that, unless otherwise indicated, reflect the company’s expectations as at
23 November 2016. Actual results may differ materially from the company’s expectations if known and unknown risks or
uncertainties affect the business, or if estimates or assumptions prove to be inaccurate. The company cannot guarantee that any
forward looking statement will materialise and, accordingly, readers are cautioned not to place undue reliance on these forward
looking statements. The company disclaims any intention and assumes no obligation to update or revise any forward looking
statement even if new information becomes available as a result of future events or for any other reason, save as required to do
so by legislation and/or regulation.
Lawrence Mac DougallChief Executive Officer
Please replace this pic

5Group Results Presentation for the year ended 30 September 2016
A year characterised by a volatile external environment
Including socio-political turbulence
-18
-15
-12
-9
-6
-3
0
Consumer confidence
80
100
120
140
160
180
Maize price index
12
13
14
15
16
17
18
US$/ZAR
Weak consumer confidence Abnormal raw material inflation Unpredictable forex markets
13.84
13.78
13.63
13.59
13.36
13.42
13.30
13.27
13.41
13.32
13.08
13.11
13.25
13.26
13.48
13.44
13.59
13.60
13.66
13.56
13.85
13.81
13.79
13.85
13.94
13.93
14.19
14.32
14.28
14.19
14.29
14.40
14.37
14.27
14.22
14.03
13.93
14.08
13.99
14.16
14.27
14.34
14.42
14.43
14.39
14.39
14.31
14.56
14.61
14.56
15.20
16.02
15.28
14.99
15.04
15.21
15.06
15.05
15.21
15.19
15.29
15.29
15.27
15.29
15.56
15.50
15.50
15.64
15.62
15.81
15.95
16.17
16.67
16.57
16.43
16.46
16.78
16.75
16.73
16.94
16.62
16.50
16.49
16.39
16.38
16.21
15.90
16.00
16.17
16.21
15.83
15.99
16.14
16.05
15.85
15.71
15.86
15.78
15.76
15.50
15.31
15.42
15.18
15.24
15.68
15.61
16.11
15.78
15.66
15.58
15.55
15.39
15.30
15.44
15.25
15.40
15.24
15.56
15.94
16.13
15.19
15.27
15.16
15.20
15.33
15.53
15.53
15.57
15.40
14.83
14.71
14.83
14.73
15.00
15.21
15.23
14.93
14.71
14.68
14.57
14.51
14.61
14.48
14.28
14.26
14.28
14.40
14.50
14.43
14.53
14.26
14.18
14.29
14.61
14.90
14.97
14.94
15.15
15.10
15.03
15.02
15.30
15.65
15.56
15.74
15.90
15.71
15.77
15.67
15.70
15.63
15.66
15.84
15.73
15.58
15.59
15.31
14.91
14.90
14.71
14.83
15.10
15.06
15.33
15.24
15.50
15.19
14.78
14.73
14.67
14.49
14.91
15.52
15.23
14.81
14.65
14.56
14.54
14.79
14.86
14.72
14.59
14.44
14.34
14.46
14.21
14.34
14.29
14.39
14.27
14.18
14.32
14.39
14.41
14.28
14.24
13.86
13.90
13.96
13.99
13.78
13.78
13.63
13.43
13.30
13.26
13.44
13.26
13.34
13.44
13.33
13.47
13.56
13.47
14.14
14.25
14.06
14.41
14.48
14.71
14.67
14.47
14.38
14.05
14.05
13.96
14.37
14.42
14.44
14.30
14.19
14.30
14.02
13.86
13.72
13.59
13.68
13.66
13.53
13.66
13.87
13.75
13.65
13.67
13.75
13.90
13.83
13.77
14.35
14.27
Source: Bloomberg, Factset
Oct 15 Nov 16 Oct 15 Nov 16Dec 15 Sep 16Mar 16 Jun 16

6Group Results Presentation for the year ended 30 September 2016
Solid results from continuing operations
Group performance*
Group volumes up
1%
Group turnover up
11%
to R31.7 billion
Group operating income up
5%
to R4.2 billion
Total dividends up
12%
to 1 065 cents
* From continuing operations | Group operating income from continuing operations before abnormal items, impairments & IFRS 2 charges
1 786
2 127
1 600
1 700
1 800
1 900
2 000
2 100
2 200
FY 15 FY 16
Total HEPS up 19%Cents

7Group Results Presentation for the year ended 30 September 2016
Strong overall performance in tough environment
Domestic
o Volumes up 2%
o Power brands maintain leading positions
o Continued cost savings & investments
o Disciplined price/volume management
International
(including Exports)
o Deciduous Fruit (LAF) delivers exceptional earnings growth
o Seventh consecutive year of growth from Central Africa
o Exports & West Africa impacted by macro-economic challenges

8Group Results Presentation for the year ended 30 September 2016
Sustained market leadership in power brands
#1 #1 #1 #1 #1
#1 #1 #1 #1 #2
#1 #1 #2 #1 #1Source: Nielsen package share, 12 month moving average to September 2016
TOP

9Group Results Presentation for the year ended 30 September 2016
Building on operational excellence
Moving to a high performance culture
Operational
excellence
o Excellent in-store execution
o On-shelf availability at 96% up from 89%
o Achieved further savings of R380 million, including
o Procurement savings of R211 million
o Innovation rate improves to 4.5% of turnover from 3.5%
People & culture
o Improved engagement
o Achieved Top Employer status
Social
responsibility
o Food programmes feed 100,000 children daily
o Sustainable socio-economic development gaining momentum
Financial & operating
performanceNoel DoyleChief Financial Officer

11Group Results Presentation for the year ended 30 September 2016
Credible operating performance*
Boosted by forex gains & associate growth but offset by higher tax rate
* From continuing operations | Effective tax rate before abnormals, impairments & associate income
Rm 2016 2015 % change
Turnover 31 698 28 660 11%
Cost of sales (21 499) (18 981) 13%
Operating income before IFRS 2 charges 4 243 4 055 5%
IFRS 2 charges (89) (29) 207%
Operating income before impairments & abnormal items 4 154 4 026 3%
Impairments & abnormals (324) (339) 4%
Net finance costs (297) (224) (33%)
Foreign exchange gains 121 21 476%
Income from associated companies 861 603 43%
Profit before taxation 4 515 4 087 10%
Taxation (1 221) (977) (25%)
Profit for the year 3 294 3 110 6%
Operating margin before IFRS 2 charges 13.4% 14.1% (0.7%)
Effective tax rate 30.9% 25.6%
EPS (cents per share) 2 007 1 930 4%
HEPS (cents per share) 2 130 2 091 2%

12Group Results Presentation for the year ended 30 September 2016
Income from associates up 43%
Associates contribution driven by once-off items
* Excludes capital profits of R69m in Carozzi, R47m in Oceana & R1m in National Foods Holdings
303234 207
449
402
309
29
29
33
80
79
54
FY16 FY16 excl. capital profits* FY15
Empresas Carozzi Oceana Group UAC of Nigeria National Food Holdings
Total income from
associates (Rm)603861 744

13Group Results Presentation for the year ended 30 September 2016
Cost awareness – a key contributor to performance
Achieved continuous improvement savings of R380 million
R91m
R36m
R42m
R211m
Manufacturing efficiencies
IT platform
Financial shared service centre
Procurement savings
245
481
692
0
100
200
300
400
500
600
700
800
FY 14 FY 15 FY 16
3 year cumulative procurement savings
Total
savings
R380m
Rm

14Group Results Presentation for the year ended 30 September 2016
Continue to invest in growth, efficiency & flexibility
983
882945
679 662
559
1.45 1.33
1.69
0
200
400
600
800
1 000
1 200
FY 14 FY 15 FY 16
Rm
Capex (Rm) Depreciation (Rm)
Capex / Depreciation
R376m
R639m
Capex & acquisition spend for FY16 (Rm)
Expansion Replacement
Capex up
7% to
R945m

15Group Results Presentation for the year ended 30 September 2016
Cash flow improves
Debt reduction impacted by TBCG disposal
Rm 2016 2015
Cash operating profit 4 837 4 396
Working capital changes (604) (812)
Cash generated from operations 4 233 3 584
Finance costs net of dividends received 109 (71)
Taxation paid (1 107) (1 159)
Dividends paid (1 661) (1 643)
Capex & acquisition (1 015) (882)
Exercise of share options held in BMT & other 59 397
Disposal of TBCG debt 1 142 -
Investments - (525)
Opening Balance – Net cash/(debt) (3 788) (3 489)
Closing Balance – Net cash/(debt) (2 028) (3 788)

16Group Results Presentation for the year ended 30 September 2016
Balance sheet strength provides capacity for investment
in future growth
* From continuing operations
2016* 2015
Cash generated from operations (Rm) 4 233 3 584
Net (debt) / cash (Rm) (2 028) (3 788)
Net debt / equity (%) 13 28
Net debt / EBITDA 0.4x 0.8x
RONA (%) 31 26
Net interest cover (times) 14 18*

17Group Results Presentation for the year ended 30 September 2016
Group turnover up 11% to R32 billion
Group volumes up 1%, domestic volumes up 2%
FY 2015 FY 2016
R28.7bn
8%
inflationR31.7bn
1%
volume
2%
forex
Total
growth
Price
inflation
Total
volumeForex
Domestic operations 11% 9% 2% -
International (including Exports) 7% 2% (5%) 10%
Total continuing operations 11% 8% 1% 2%

18Group Results Presentation for the year ended 30 September 2016
Group achieves double-digit turnover growth
Strong performances from Groceries, Beverages & Home Care
Grains
Consumer
Brands Food HPCB
International
(incl. Exports) Group*
Volume - ▲ 3% ▲ 6% ▼ 5% ▲ 1%
TurnoverR12.8bn
▲ 13%
R11.0bn
▲ 9%
R2.4bn
▲ 13%
R5.4bn
▲ 7%
R31.7bn
▲ 11%
Operating
income**
R2.0bn
▼ 3%
R1.2bn
▲ 9%
R0.5bn
▲ 20%
R0.5bn
▲ 19%
R4.2bn
▲ 5%
Operating
margin**▼15.6% 10.8% ▲ 21.9% ▲10.2% ▼13.4%
* From continuing operations ** Before abnormal items, impairments & IFRS 2 charges

19Group Results Presentation for the year ended 30 September 2016
Grains
o Solid performance from core business (Millbake)
• Offset by Maize & Sorghum
o Albany volumes grow despite challenges in Western Cape
• Leading position in bread maintained
• Western Cape bakery online end FY17
o Other Grains driven by Jungle & Fatti’s & Moni’s
• Strong volume growth in Fatti’s & Moni’s
• Launch of instant noodles
• Single-serving Jungle cups
11 37512 845
2 061 2 002
0
4 000
8 000
12 000
16 000
FY 15 FY 16
Resilient in tough environment – margin distorted by abnormal inflation
Turnover Operating income
Rm
Raw material costs
▲ 22%
Marketing investment
▲ 13%

20Group Results Presentation for the year ended 30 September 2016
Groceries
o Strong growth in volumes
o Revenue up 10%
o Operating income up 13%
o Input costs impacted by drought and currency volatility
• Appropriate pricing strategy implemented
o Improved manufacturing performance
o KOO retains South Africa’s favourite brand status
• Ahead of leading international brands
4 2654 701
411 466
0
1 000
2 000
3 000
4 000
5 000
FY 15 FY 16
Benefits from successful price/volume management in H2
Rm
Turnover Operating income
21Group Results Presentation for the year ended 30 September 2016
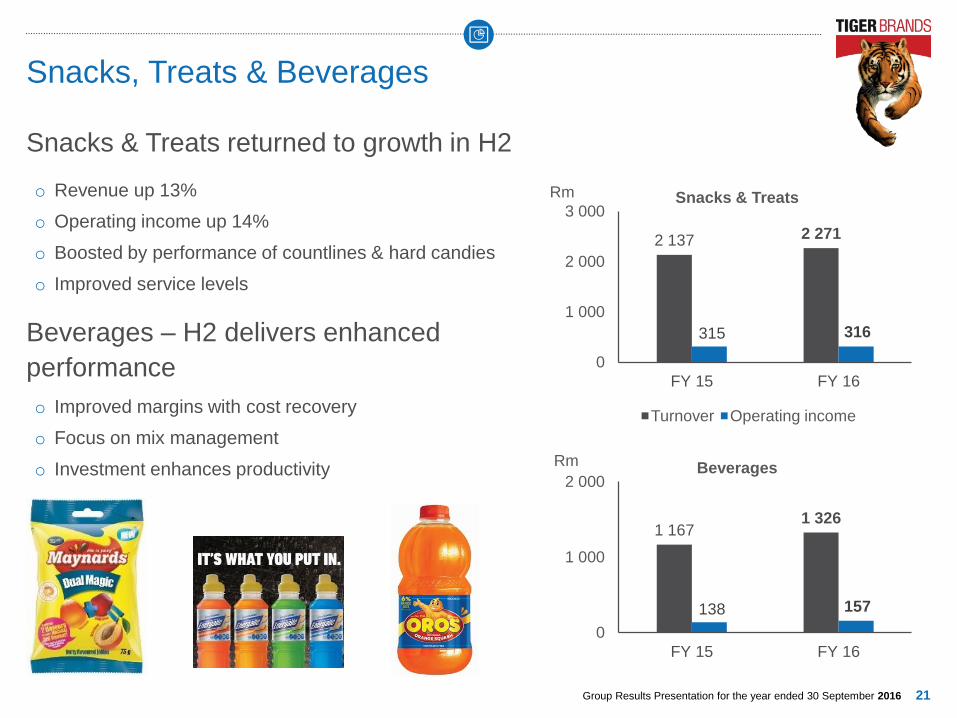
Snacks, Treats & Beverages
o Revenue up 13%
o Operating income up 14%
o Boosted by performance of countlines & hard candies
o Improved service levels
Beverages – H2 delivers enhanced
performance
o Improved margins with cost recovery
o Focus on mix management
o Investment enhances productivity
2 137 2 271
315 316
0
1 000
2 000
3 000
FY 15 FY 16
Snacks & Treats
Snacks & Treats returned to growth in H2
Rm
Turnover Operating income
1 1671 326
138 157
0
1 000
2 000
FY 15 FY 16
BeveragesRm

22Group Results Presentation for the year ended 30 September 2016
Home, Personal & Baby Care (HPCB)
o Outstanding performance from Home Care
o Personal Care delivers growth in competitive environment
o Baby Care impacted by consumer down-trading
o Turnover up 13%
o Operating income up 20%
o Margins improve to 21.9%
o Performance underpinned by
• Innovation
• Operational efficiencies
• In-store execution
2 1472 437
444 534
0
1 000
2 000
3 000
FY 15 FY 16
Exceptional performance repeated
Rm
Turnover Operating income

23Group Results Presentation for the year ended 30 September 2016
International (including Exports)
o Deciduous Fruit (LAF) benefits from favourable
exchange rates, improved yields & cost containment
o Central Africa delivers 7th year of consecutive growth
• Volumes driven by chocolate bars & spreads
• Innovation up to 7.2% of turnover
o East Africa driven by recovery at Haco
• Announced disposal of EATBI
o Exports impacted by macro-economic challenges
• Demand for brands remains robust
o West Africa impacted by delayed recovery in cost push
driven by currency devaluation
• Power shortages
• Value Added Tax
5 0295 386
462 547
0
2 000
4 000
6 000
FY 15 FY 16
Strong growth with mixed performances
Rm
Turnover Operating income

24Group Results Presentation for the year ended 30 September 2016
Outlook
o Difficult trading environment to persist
o Inflation to remain high
o Forex & commodity prices remain volatile
Focus areas
o Leverage power brands to grow market share
o Optimise margin
o Accretive innovation & targeted investment
o Aggressive focus on cost savings
o Drive high performance culture

Strategic reviewLawrence Mac DougallChief Executive Officer

26Group Results Presentation for the year ended 30 September 2016
Strategic review in progress
Developing a strategy for sustainable profitable growth
Portfolio growth
& strategy
o Rejuvenate domestic
operations to profitable
growth
o International strategy
accretive to domestic
performance
o Build a capable & cost
conscious culture with
the capacity to grow
o Winning through a high
performance culture
=
Cost & investment
strategy
Operating model &
organisational design
Growth
CapabilityCost

27Group Results Presentation for the year ended 30 September 2016
Leadership
Board and Executive Committee appointments
o Khotso Mokhele to be appointed chairman at upcoming AGM
o Kevin Hedderwick & Emma Mashilwane join the board as non-executive directors
o Mary-Jane Morifi joins as Corporate Affairs Executive in December
o Neil Brimacombe resigned as Business Executive effective 31 January 2017

Investor RelationsNikki Catrakilis-WagnerGroup Investor Relations Executive
T: +27 11 840 4841

Appendices
30Group Results Presentation for the year ended 30 September 2016
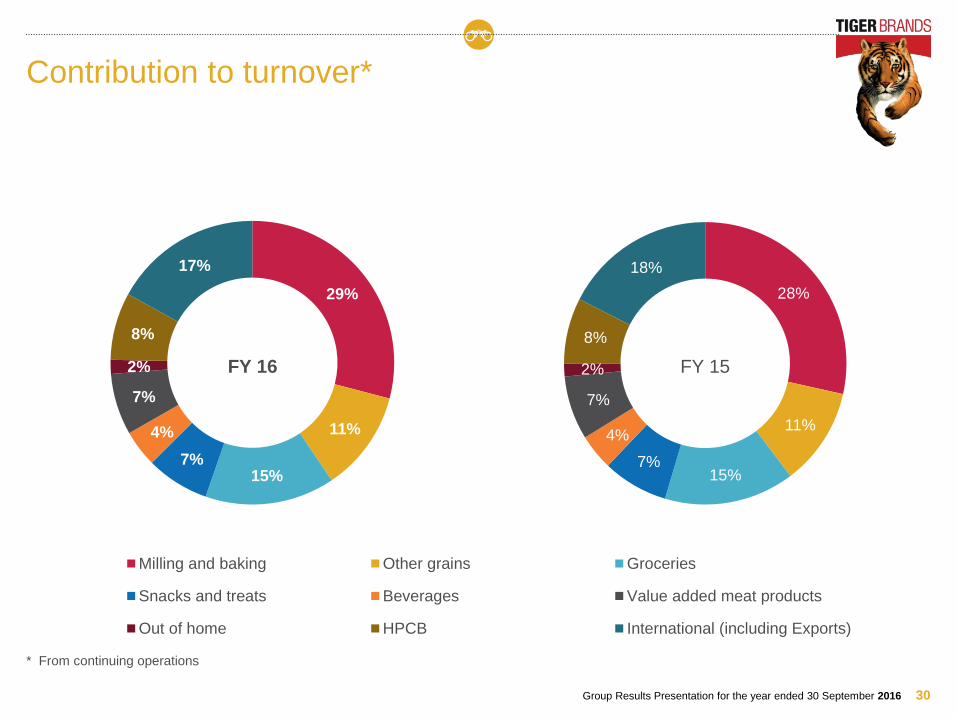
29%
11%
15%7%
4%
7%
2%
8%
17%
Milling and baking Other grains Groceries
Snacks and treats Beverages Value added meat products
Out of home HPCB International (including Exports)
Contribution to turnover*
* From continuing operations
FY 16 FY 15
28%
11%
15%7%
4%
7%
2%
8%
18%
31Group Results Presentation for the year ended 30 September 2016
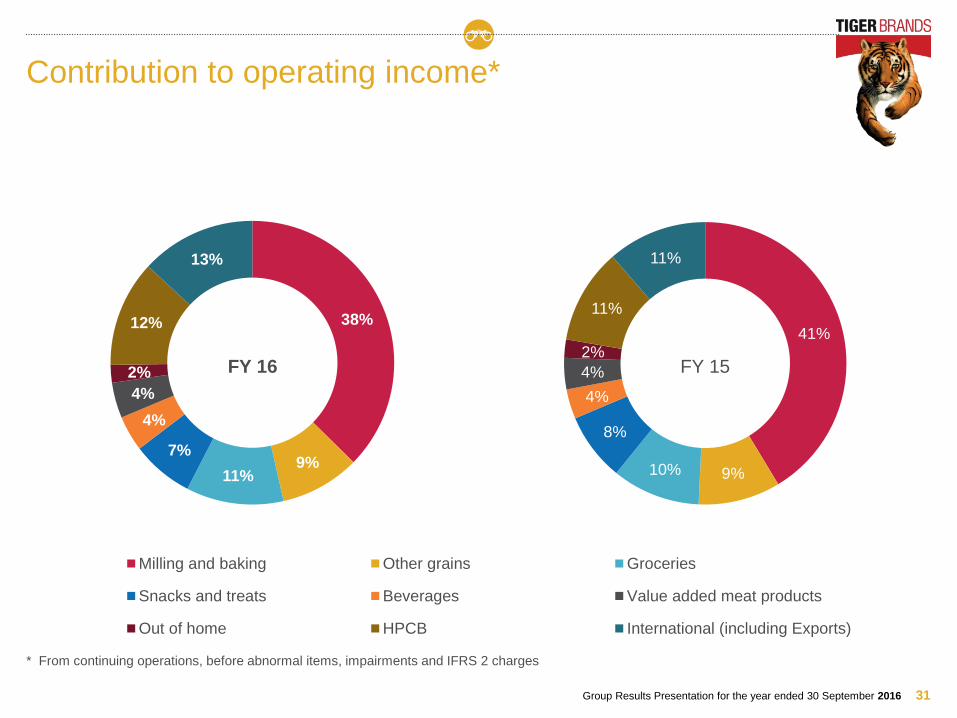
38%
9%11%
7%
4%
4%
2%
12%
13%
Milling and baking Other grains Groceries
Snacks and treats Beverages Value added meat products
Out of home HPCB International (including Exports)
Contribution to operating income*
* From continuing operations, before abnormal items, impairments and IFRS 2 charges
FY 16 FY 15
41%
9%10%
8%
4%
4%
2%
11%
11%
32Group Results Presentation for the year ended 30 September 2016
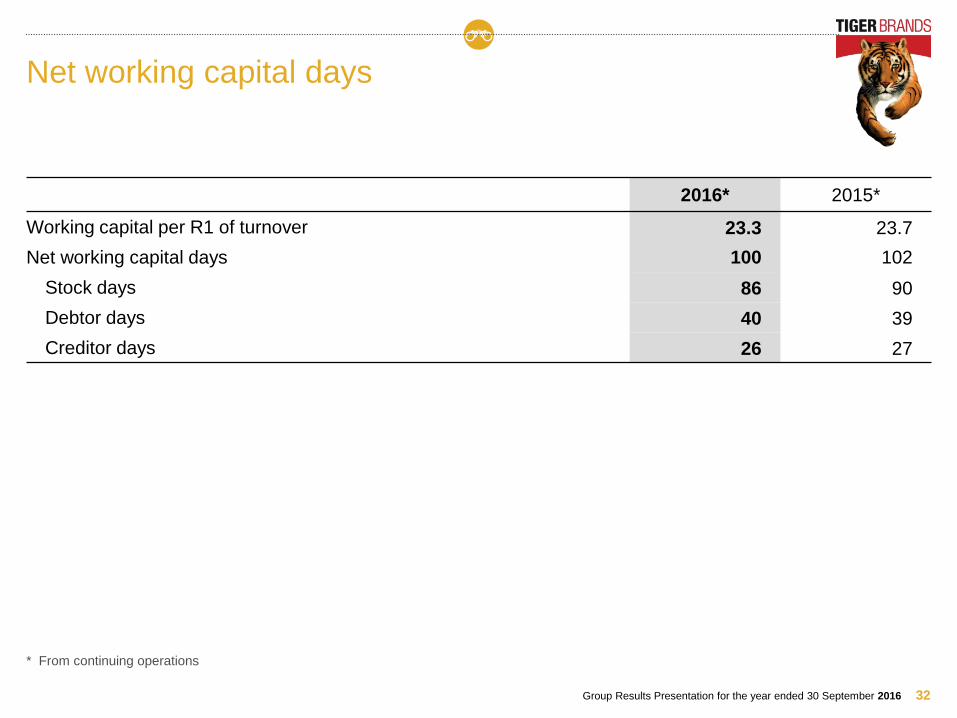
Net working capital days
2016* 2015*
Working capital per R1 of turnover 23.3 23.7
Net working capital days 100 102
Stock days 86 90
Debtor days 40 39
Creditor days 26 27
* From continuing operations

Investor RelationsNikki Catrakilis-WagnerGroup Investor Relations Executive
T: +27 11 840 4841