group versus individual decision-making: is there a...
TRANSCRIPT
Group versus individual decision-making:Is there a shift?�
Attila Ambrusy Ben Greinerz Parag Pathakx
This Version: August 2009
Abstract
The phenomenon that decisions of groups of individuals di¤er in asystematic way from decisions of individuals in isolation has been docu-mented in a wide variety of experiments. This paper revisits this questionwith a design soliciting both individual decisions of group members andthe group�s joint decision in second-mover contributions in gift-exchangegames, and in lottery choices. We examine which group members are in�u-ential in the group decision. In gift-exchange games, if group decisions areobtained without deliberation by public voting, there is no shift relativeto the median individual decisions, indicating that the social context itselfdoes not change behavior. When deliberation is allowed and no decisionrule is imposed on the group, besides the median member, the individ-ual one position away in the sel�sh direction also becomes in�uential inthe group decision. The �ndings contradict the social comparison theoryand are consistent with the persuasive argument theory from social psy-chology. We demonstrate that a researcher incorrectly assuming that thegroup decision is a function of the mean individual decision would concludethat there is a sel�sh level shift. In lottery choices, the median individualdecision becomes the group decision with very high probability. Never-theless, if the distribution of individual choices in a given choice problemis asymmetric enough in some direction, since median group members arelikely to be in that direction, group decisions are even more tilted in thatdirection. Our results highlight that the question whether people behavedi¤erently in group settings can only be addressed relative to a theory ofhow groups make decisions.
�We thank the Warburg foundation for �nancial support and Niels Joaquin for valuableresearch assistance. Eric Budish, Georgy Egorov, Lars Ehlers, and Mihai Manea providedassistance in some of the experimental sessions. Gary Charness, Ignacio Esponda, DrewFudenberg, Stephen Leider, Muriel Niederle, Georg Weizsacker and seminar participants atthe IAS in Princeton provided helpful comments.
yDepartment of Economics, Harvard University, ambrus AT fas.harvard.eduzSchool of Economics, University of New South Wales, bgreiner AT unsw.edu.auxDepartment of Economics, MIT, ppathak AT mit.edu
1
1 Introduction
Many important decisions in the society are made by groups of individuals suchas committees, governing bodies, juries, business partners, teams, and families.Experiments in various contexts demonstrate systematic di¤erences betweenchoices made by groups of individuals and by individuals making decisions inisolation. There is a large literature in social psychology documenting and an-alyzing this phenomenon, referring to it as the �discontinuity e¤ect�or �groupshift�, and a relatively recent literature in economics investigating it both ex-perimentally and theoretically.1
Some of the experiments feature tasks in which there is a normative criterionfor evaluating the quality of the decisions. Laughlin (1980) and Laughlin andEllis (1986) refer to these tasks as intellective.2 In these situations it is nat-ural to expect the distribution of groups�decisions to di¤er systematically fromthe distribution of individual decisions if group members can interact with eachother, since group members can convey information to each other that ratio-nally changes the intended action of the others.3 More surprising is the �ndingthat there is a group shift in many non-intellective tasks, in particular whenonly the decision-makers�personal preferences should dictate choice. There is alarge literature examining attitudes towards cooperation and reciprocity, mostlyconcluding that people in groups act more sel�shly than when they make de-cisions individually (�sel�sh shift�).4 Another line of literature, starting withStoner (1961), investigates risk attitudes expressed by groups and individualsdi¤ering.5 In most choice problems involving a safe and a risky option groupstend to take more risk (�risky shifts�), but in some types of lottery decisions
1 In social psychology, the topic became a standard textbook chapter: see for exampleBrown (1986), chapter 6.
2Within intellective tasks Gigone and Hastie (1993) de�ne highly demonstratable onesas those for which arguments prescribed by the normative model are self-evidently correct,making it very likely that the correct arguments win in a discussion. The correspondingterminology used in the economics literature, starting with Cooper and Kagel (2005) is �thetruth-wins norm.�
3Even if no communication is possible before the decision-making mechanism, if the latterinvolves sequentiality (like sequential voting) group members can learn information from eachother during the mechanism.
4 In the prisoner�s dilemma context this conclusion is reached by Pylyshyn et al. (1966),Wolosin et al. (1975), Lindskold et al. (1977), Rabbie (1982), Insko et al. (1990), andSchopler and Insko (1992). Wildschut et al. (2003) contains a meta-analysis of the subject,while Charness et al. (2007) is a more recent contribution in economics. In centipede gamesBornstein et al. (2004), while in ultimatum games Robert and Carnevale (1997) and Bornsteinand Yanive (1998) report similar �ndings. In gift-exchange games, Kocher and Sutter (2007)�nd no di¤erence between groups and individuals if giving a gift is relatively cheap andunlimited discussion is allowed within groups, but show that groups are more sel�sh if groupmembers can only communicate anonymously, through the computer network. In dictatorgames Cason and Mui (1997) report an altruistic shift, but Luhan et al. (2009) in a modi�eddesign �nd a sel�sh shift.
5See also Teger and Pruitt (1967), Burnstein et al. (1973), and Brown (1974). Recentpapers in economics include Shupp and Williams (2008), Baker et al. (2008) and Masclet etal. (2009).
2
the opposite is observed (�cautious shifts�).6
The two main general explanations in social psychology for such shifts arethe social comparison theory (Levinger and Schneider, 1969) and the persuasiveargument theory (Burnstein et al., 1973; Brown, 1974).7 The social compari-son theory emphasizes that people in group settings behave di¤erently than inisolation. In particular, it assumes that people are motivated both to perceiveand present themselves in a socially desirable way. To accomplish this, a per-son might react in a way that is closer to what he regards as the social normthan how he would act in isolation. According to the persuasive argument the-ory, the reason why deliberation drives group decisions in a particular directionis that the pool of arguments in that direction is more persuasive. A relatedexplanation of group shifts is that people with certain preferences tend to bemore persuasive than others (for example, more sel�sh individuals are also moreaggressive in deliberation).In this paper we provide an experimental investigation of group shifts in
the context of non-intellective tasks, and examine both the social comparisontheory and the persuasive argument theory. The central point we make is thatthe question whether there is a systematic shift in the behavior of people ingroup settings can only be addressed relative to some benchmark hypothesis onhow individual preferences are aggregated into group decisions. For example,it is well-known that if individuals have single-peaked preferences and employmajority voting in their decisions then the group decision is equal to the me-dian of the group members�decisions (Moulin, 1980). Then if the distributionof individual preferences in a subject pool is asymmetric, so that the populationmedian is not equal to the population mean, there is an expected shift in thedirection of the population median when one compares the average of individualdecisions to the average of group decisions, even if there is no change of behaviorin social settings. This is an important observation because most of the exist-ing literature on group shift bases its conclusions on comparing average groupdecisions to average individual decisions. Moreover, there is a line of literatureexplicitly exploring the relationship between the mean of individual decisionsand the mean of group decisions across di¤erent speci�cations of lottery choiceproblems (see for example Teger and Pruitt, 1967; Myers and Arenson, 1972).We are only aware of one paper showing that deliberation causes a group shiftrelative to the initial median individual opinion in the group, in the context ofan intellective task: Schkade et al. (2000) demonstrate this in an experiment inwhich subjects need to decide an appropriate punitive damage award in a caseof recklessly negligent behavior.8
We conducted our investigation in two contexts. The �rst one is a gift-
6As Hong (1978) demonstrates, the cultural setting can also in�uence the direction of theshift in the same decision problem.
7See other explanations, mostly in speci�c types of decision problems, in the next section.8Kerr et al. (1996), in a meta-analysis of intellective tasks, also recognize that the aggrega-
tion method in�uences the distribution of group decisions. They consider several aggregationmethods, including simple majority voting, but they don�t investigate whether there is a groupshift relative to a given aggregation method.
3
exchange game (Fehr, Kirchsteiger and Riedl, 1993; Brandts and Charness,2004), widely studied in experimental economics. In this context we looked atdecisions as a respondent (second-mover), made by groups and by individualsconsisting these groups. The decision problem of the respondent, namely howmuch gift to reciprocate, is a non-intellective task if there is no continuation inthe interaction between the �rst-mover and the second-mover. It should purelyre�ect how much the decision-maker feels compelled to reciprocate gifts by oth-ers. Existing studies suggest that with respect to reciprocity the distributionof preferences in a typical subject pool is asymmetric: based on data from ul-timatum games and repeated public good contribution games, several papersdrew the conclusion that typically roughly 40% of subjects reciprocate others�contributions to various degrees, while 50-60% of the subjects seem to care onlyabout their own material payo¤s.9 This implies that the population median isat the sel�sh extreme, and in particular the median decision in related contextsis di¤erent (more sel�sh) than the average decision.The second setting we examined is binary choices between lotteries, based
on the risk preference elicitation questionnaire of Holt and Laury (2002). Thistype of decision problem is again typically considered to be a non-intellectivetask, re�ecting the subject�s attitudes towards risk-taking.To compare individual and group decisions, we implemented a design in
which some subjects were randomly allocated to be individual decision-makers,while other subjects were allocated to groups of �ve. In gift-exchange games,individual decision-makers played the roles of the �rst movers, and subjects al-located to groups played the roles of the second movers. In every gift-exchangegame, after the amount of gift from the �rst mover was revealed to group mem-bers, �rst we solicited how much the group members would reciprocate individ-ually, and then the group decision. For each of these decisions it was randomlydetermined whether the group choice was implemented, or one of the individualchoices, and if the latter, which one. In both cases, the e¤ective group choicein�uenced all group members�payo¤s identically (even if it happened to be oneof the group members�individual decision). Similarly, in lottery choices �rst wesolicited individual choices of group members, and then group decisions, withthe understanding that it was randomly determined whether one of the individ-ual decisions or the group decision would become the actual lottery choice, butin both cases the same decision would apply to all group members.As far as we know our experiment is the �rst in which both the group decision
and the intended individual decisions of the group members were solicited for thesame decision and monetary incentives were provided for both types of choices.There are studies, like Cason and Mui (1997) and Luhan et al. (2009), in whichboth individual and group decisions are solicited from the same subjects for thesame type of decision, but in these studies individual decisions only apply to theindividual itself.10 As shown recently by several papers (Charness et al., 2007;
9See Ledyard (1995), Palfrey and Prisbey (1997), Brandts and Schram (2001), and Fis-chbacher et al. (2001). The data we collected in the experiments for Ambrus and Pathak(2007) is also consistent with these �ndings.10Furthermore, in the cited studies, groups interact with groups, while individuals interact
4
Chen and Li, 2009; Sutter, 2009), it a¤ects individuals�decisions whether theconsequences of the decision only apply to them or whether they apply to a groupof people they belong to. For this reason, we �nd it important that the individualand group decisions apply to the same set of people for investigating possiblesources of group shifts related to the social comparison theory and the persuasiveargument theory. Another aspect in which our experiments di¤er from the onesfeatured in the above studies is that having groups of �ve individuals allows usto examine the in�uence of non-median group members closer versus furtheraway from the median on the group decision.11
We conducted two di¤erent treatments. In the benchmark, No Deliberation,group members were not allowed to deliberate on the choice, and the group de-cision was determined by a sequential public voting mechanism. This treatmentruled out the possibility of a group shift arising from asymmetric preference ag-gregation such as in the persuasive argument theory. However, since the votingprocedure was publicly observed by group members, it left open the possibilitythat group members acted di¤erently in the group setting than when makingtheir individual decisions, as in the social comparison theory. In the alterna-tive treatment, Deliberation, we allowed for unrestricted deliberation amonggroup members before agreeing upon a group decision (after all of them sub-mitted their individual decisions secretly), hence allowed for the possibility thatcertain individuals a¤ect the group decision more than others. Moreover, sim-ilarly to most studies of group decisions, in this treatment we did not imposea voting mechanism, and left it completely to the groups to decide on howthey come up with a group decision. We chose the above two treatment condi-tions because both of them have been popular in earlier experiments on groupdecision-making. We analyze preference aggregation in the two treatments sepa-rately, instead of directly comparing them, as they di¤er in multiple potentiallyimportant dimensions.The primary focus of our empirical investigation is on the gift-exchange
games, where the larger action space and the larger spread of individual decisionsallowed us a more elaborate testing of which group members were in�uentialin shaping group decisions than in binary lottery choice problems. Based onregressing the group decision on the ordered (from lowest to highest) individualdecisions by the group members, we tested three formal hypotheses. The �rstone is that the group decision is a function of the mean of individual decisions,as implicitly or explicitly assumed by most of the literature. This hypothesisimplies that all individuals within a group should have the same regressioncoe¢ cient, signi�cantly di¤erent from zero. The second one is that the groupdecision is a function of the median decision: in this case only the mediangroup member (the third lowest individual decision) should have a regressioncoe¢ cient signi�cantly di¤erent from zero. The third hypothesis is that thereis a group shift corresponding to a level e¤ect when subjects make the groupdecision: in this case the regression coe¢ cient for the constant term should be
with individuals.11Cason and Mui (1997) investigated groups of two individuals, while Luhan et al. (2009)
examined groups of three individuals.
5
signi�cantly di¤erent from zero (negative for a sel�sh shift), independently ofhow di¤erent individual decisions get aggregated into a group decision.12
In the No Deliberation treatment, the only signi�cant parameter in the re-gression (at the 1% level) is the median group member�s individual contribution.The mean hypothesis is strongly rejected, while the median hypothesis cannotbe rejected. The coe¢ cient for the constant term is not signi�cantly di¤erentfrom zero, therefore we do not �nd evidence for a group shift corresponding toa level e¤ect.In the Deliberation treatment, the coe¢ cient for the constant remains in-
signi�cantly di¤erent from zero, showing that there is no group shift corre-sponding to a level e¤ect in this condition, either. However, besides the medianindividual decision, the second lowest individual decision also becomes signi�-cant in determining the group decision. The mean hypothesis is still rejected,but in the Deliberation treatment the median hypothesis is also rejected. Whilethe group members with the most extreme opinions do not in�uence the groupdecision, the group member one position away from the median in the sel�shdirection does seem to have a signi�cant e¤ect. The point estimate of the regres-sion coe¢ cient for the second lowest individual contribution is smaller than theestimated coe¢ cient for the median decision, but the di¤erence is not signi�cant.We found the above �ndings to be robust to only including data from later
phases of the experimental sessions. That is, while subjects may change theirindividual opinions throughout the experiment about possible choices, the wayindividual choices get aggregated into a group choice stays constant throughoutdi¤erent phases of the experiment.Our results provide evidence against the social comparison theory. The �nd-
ing that the constant term in both conditions is insigni�cant, and hence no levelshift in contributions independent of the aggregation was observed, indicatesthat the social setting by itself does not alter subjects�choices in our context.In particular, the fact that the median group member�s individual contributionis the only signi�cant explanatory variable in the No Deliberation treatmentsuggests that there is no group shift, if one de�nes group shift appropriately,without the possibility of persuasion. On the other hand, our �ndings are inline with the predictions of the persuasive argument theory. Deliberation makesthe group member with the second lowest individual contribution in�uential inthe group decision.Interestingly, when regressing the group decision on the mean of the indi-
vidual decisions in the Deliberation session, the constant term in the regressionbecomes signi�cantly negative. Hence, a researcher working with a speci�cationassuming that the group decision depends on the mean of individual decisionswould conclude that there is a sel�sh shift when switching from individual togroup decisions. At the same time, when regressing the group contributionon the median individual decision, the point estimate for the constant term is
12For example, both when the group decision is the mean of the expressed opinions andwhen the group decision is the median of the expressed opinions, if the publicly expressedopinion of group members di¤ers by a constant c from subjects�secretly submitted individualchoices, the expected coe¢ cient of the constant term is c.
6
insigni�cant and very close to zero.In lottery choices, we �nd that in 96% of the cases the median individual
decision becomes the group decision, in both the Deliberation and the No delib-eration treatments. In the remaining cases there is no clear pattern about thedirection of the shift in the group decision relative to the median. Nevertheless,in all lottery choice problems in which more than 60% of individual subjectsprefer one option (either the safe or the risky one), the share of groups choosingthat option is even higher than the share of individuals choosing it, which ananalyst simply comparing average decisions of groups versus individuals wouldinterpret as a group shift. However, the main driving force behind the di¤er-ences of the average decisions of individuals and groups is that in some lotterychoice problems the median individual decision is the safe choice, even when asigni�cant minority chooses the risky one, or vice versa. In the group decisionsthe minority opinion tends to be oppressed, leading to a di¤erent distribution ofchoices for groups than for individuals. The result that this e¤ect has the sameimpact no matter whether the distribution of individual decisions is skewed to-wards the safe choice or towards the risky choice provides an explanation whyprevious studies found �cautious shifts�in certain lottery choice problems, while�risky shifts�in others.We recorded certain demographic information on subjects: gender, age, and
whether the subject is studying an economics-related �eld. These characteristicsseem to have little e¤ect on how in�uential a person is in deliberation. The onlyconsistent e¤ect we found is that women, if their positions within the groupwere close to the median, were somewhat more in�uential in the Deliberationtreatment than men. This �nding is in contrast with Christensen and Abbott(2000), who �nd that women�s ideas are often less in�uential and sometimessuppressed altogether in mixed-gender groups.
2 Related literature
The literature on group shifts in social psychology dates back to Stoner (1961).Subsequent research showed that in most decision problems exhibiting a groupshift, groups tend to take more extreme decisions than individuals. That is,in one-dimensional decisions in which the distribution of individual decisionsis skewed in one direction, group decisions tend to shift further in that direc-tion. Moscovici and Zavalloni (1969) labeled this as �group polarization�, andrisky/cautious shifts and sel�sh shifts are regarded as particular instances of thisregularity. Sunstein (2000, 2002) and Manin (2005) point out the related phe-nomenon of �group extremization�: even in tasks in which individual preferenceson average are not tilted in one direction, if in a particular group preferencesare more towards one direction, a group shift tends to occur in this direction.That is, groups make more extreme decisions, although not systematically inone direction. On the other hand, there are a few papers that found decisionproblems in which deliberation leads to depolarization of opinions (Fergusonand Vidmar, 1971; Burnstein, 1982).
7

There are many explanations provided in the literature for systematic groupshifts that could apply to contexts involving non-intellective tasks, besides thetwo most popular lines of explanation highlighted in the Introduction. The in-group versus out-group sentiments theory (Tajfel et al., 1971; Kramer, 1991)posits that subjects develop more other-regarding preferences toward their groupmembers than towards subjects outside the group. A recent line of papers start-ing with Charness et al. (2007) provides experimental evidence along theselines.13 The identi�ability explanation (Wallach et al., 1962, 1964) claims thatpeople in group decisions act more sel�shly because the other side�s ability toassign personal responsibility is more limited. Eliaz et al. (2005) point out thatin lottery choice problems subjects who are not expected utility maximizers ex-hibit a group shift, because the decision problem associated with the possibilityof being pivotal in a group�s lottery choice decision di¤ers from individuallydeciding on the lottery choice if the probability of being pivotal is less than 1.Less directly related to our paper is the literature on intellective tasks. In
this environment, a string of papers showed that groups tend to outperformindividuals.14 However, psychologists found several examples in which groupsare more likely to choose incorrect decisions (group members are more likelyto herd with someone arguing for a particular incorrect choice).15 Glaeser andSunstein (2009) provide a theoretical analysis of group shifts in the context ofintellective tasks.A recent survey of the experimental economics literature on group decisions,
both on intellective and non-intellective tasks, is provided in Niederle (2009).
3 Competing Hypothesis
We investigate situations in which �ve individuals �rst make an individualchoice, and then jointly decide on a group choice, for the same decision problem.The models we examine can be generally written as:
ygt = f(x1gt; x2gt; x3gt; x4gt; x5gt; Xg; t)
where t stands for a time period (which for every group is associated with oneparticular decision problem), ygt is group g�s observed decision in period t, xigtis the observed individual decision of individual i in the same period, and Xg isa vector of characteristics of the group members, which allows for the group�sdecision to depend on observed demographic characteristics of the group. Notethat we allow the aggregation function f to depend on t. We also use x(j)gt to
13See also Charness and Jackson (2009), Chen and Li (2009), and Sutter (2009).14Kocher and Sutter (2005) conclude that groups learn faster and make better judgments in
beauty contest games. Blinder and Morgan (2005), in an experiment in which subjects wereasked to make statistical inferences in a design that mimicked certain aspects of monetarypolicymaking, �nd that groups consistently outperform individuals. Cooper and Kagel (2005)show that groups play more strategically than individuals in signaling games.15For an overview, see Asch (1995).
8

refer to the jth highest decision among in the individuals in group g, where x(1)gtand x(5)gt are the highest and lowest, respectively.All of our comparisons are between the individual decisions and group de-
cisions for a particular period t. In our basic speci�cation we assume that therelationship between group and individual decisions - that is, how individualdecisions are aggregated to a group decision - does not depend on the particu-lar time period. In Subsection 6.2, we provide evidence for the validity of thisassumption.In most of the analysis we focus on models in which the group decision is
a linear function of (xigt)i=1;::;5. In particular, we omit Xg from most of theanalysis, for the reason that we found that observed demographic characteristicsof group members played little role in the aggregation. For results on howdemographic characteristics in�uence aggregation, see Subsection 5.2.We focus on linear models and our basic speci�cation is:
ygt = �+ �1x(1)gt + �2x
(2)gt + �3x
(3)gt + �4x
(4)gt + �5x
(5)gt + �gt: (1)
The �rst hypothesis we examine, the mean hypothesis, implies that thegroup�s decision is simply a function of the mean of the individual decisions.This implies that
ygt = �
1
5
5Xi=1
x(i)gt
!:
That is, the mean is a su¢ cient statistic for the group�s decision. If � = 1,then the mean exactly predicts the group�s decision. If � < 1, then the group�spredicted decision is systematically lower than the mean of the individuals, butthere is no systematic di¤erence which is independent of the mean decision. Inour econometric tests, we test whether we can reject the hypothesis that �1 =�2 = �3 = �4 = �5. The version of the mean hypothesis which further requiresthe mean to exactly predict the group decision, what we call the strong meanhypothesis, involves tests of the hypothesis that �1 = �2 = �3 = �4 = �5 =
15 .
The second hypothesis, the median hypothesis, implies that the group�sdecision is a function of the median individual decision only, so that
ygt = �x(3)gt :
In our econometric tests, we estimate equation (1), and test whether we canreject the hypothesis that �1 = 0; �2 = 0; �4 = 0; �5 = 0. The version of thehypothesis which further requires the median to exactly predict the group de-cision, what we call the strong median hypothesis, involves testing whetherwe can reject both �1 = 0; �2 = 0; �4 = 0; �5 = 0 and �3 = 1.The last hypothesis, the level-shift hypothesis, predicts that there is a
systematic shift between the group�s decision and the individual decision. Thegroup shift can happen relative to either the mean decision or the median deci-sion. To allow either possibility, we test the level-shift hypothesis in our mainspeci�cation by examining whether it is possible to reject the hypothesis that
9

� = 0. We also examine models where we only include the mean of the individ-ual decisions and an intercept, and models where we only include the medianof the individual decisions and an intercept, and test whether we can reject thehypothesis that the coe¢ cient on the intercept is zero.We conclude this section with relating the above simple hypotheses to the
two main theories explaining group shifts in social psychology. According to thesocial comparison theory, the social setting itself alters people�s behavior andchoices. We associate this with a level-shift, corresponding to a coe¢ cient �signi�cantly di¤erent from zero (signi�cantly negative for a sel�sh shift), in bothof our treatments. As opposed to this, if the social setting itself does not have asigni�cant e¤ect on people�s choices, we expect not to be able to reject the strongmedian hypothesis and the hypothesis that � = 0. The persuasive argumenttheory by design can only have an impact in the Deliberation treatment, in theform of individual decisions in a particular direction from the median becomingsigni�cant determinants of the group decision, leading to the rejection of themedian hypothesis. In the No deliberation treatment we regard the testing ofthe median hypothesis as a consistency check.
4 Experimental design and procedures
To test the hypotheses, our experiment utilizes decision making situations fromthe two main domains of economic experiments: strategic social interaction andnon-strategic, individual decision making. We confront subjects with the choiceof a second mover in a gift-exchange game, and with a list of binary lotterychoice situations as in Holt and Laury (2002). As we elicit both individual andgroup choices from the same individuals over the same decision task, our designallows us to observe the aggregation of individual choices to group decisions.The �rst game featured in our experiments is structurally the same as the
one in Brandts and Charness (2004), and following their terminology we referto it as a gift-exchange game.16 In the version of the game we use, a �rst moverand a second mover are each endowed with 10 tokens of monetary value. First,the �rst mover may send a gift of 0 to 10 tokens to the second mover. Theamount is deducted from the �rst mover�s account, but is tripled on the waybefore being awarded to the second mover. Then the second mover can decidewhether he wants to send a gift of 0 to 10 tokens to the �rst mover under thesame conditions: For each token sent one token is deducted from the secondmover�s account, and the triple of the amount is added to the �rst mover�saccount. While the socially optimal behavior is to exchange maximal gifts, inthe unique Nash equilibrium outcome neither player contributes any gift.The typical experimental data on this game shows �rst movers trusting and
a signi�cant likelihood of reciprocal behavior among second movers, yieldingoutcomes which are closer to the socially e¢ cient one. Individuals di¤er both
16The term gift-exchange game was introduced by Fehr et al. (1993). Gift-exchange gamesare similar in structure to trust games, introduced by Berg et al. (1995), and can be moregenerally classi�ed as sequential social dilemma games.
10
in their degrees of trust as well as in their pattern of reciprocal behavior. Inour experiment we concentrate on the latter, studying how individual reciprocalpatterns to a diverse set of stimuli are aggregated to group behavior.For the risk choice situation, we used a version of the risk preference elicita-
tion questionnaire of Holt and Laury (2002), displayed in the Appendix of thecurrent paper. In this questionnaire, subjects have to make ten choices betweentwo lotteries, namely p[$11:50]� (1� p)[$0:30] vs. p[$6:00]� (1� p)[$4:80] withp 2 f0; 0:1; 0:2; :::; 0:9g. Of this choice list, one lottery is randomly selected, thedecision implemented and the corresponding lottery played out. Most experi-ments observe heterogeneous individual risk attitudes, with a majority of peoplebeing slightly to strongly risk averse. Our experiment studies how these indi-vidual risk preferences are aggregated to a group risk attitude when the grouphas to make a decision that applies to all members.The experimental sessions took place from January to March 2008 in the
Computer Laboratory for Experimental Research at Harvard Business School.We conducted four sessions with a total of 109 student subjects.The experiment was computerized using the z-Tree software (Fischbacher,
2007). After subjects arrived instructions were distributed.17 An experimenter(the same in all sessions) led subjects through the instructions and answeredopen questions. Then, subjects were randomly assigned to be either one of 6purely individual decision-makers, or to be a member of a group of 5 partici-pants, by drawing a numbered card.The six purely individual decision-makers stayed in the main lab and made
n �rst-mover decisions in a row at the beginning of the experiment, without anyfeedback, with n equal to the number of groups in the session.18 Afterwardsthey had to stay in the lab until the end of the session.Group participants were led to small group rooms to make their decisions.
For them, each session consisted of three phases. Between phases, the initialrandom assignment to the n groups g was reshu ed by assigning each groupmember i to her new group g + i (mod n). During a phase groups stayedconstant. In each phase, group members made decisions as second movers in twogift-exchange games (with two di¤erent �rst movers) and in one lottery task. Ineach game, group members �rst made individual decisions, after seeing the �rstmover�s gift, and submitted their decisions secretly to a researcher conductingthe experiment. Then, depending on treatment, they either freely discussed andmade a group decision, or participated in a sequential public voting mechanismto determine the group decision.19 We refer to the �rst type of session as a
17 Instructions for the Deliberation treatment are included in the Appendix.18About half of �rst movers in our sessions did vary their o¤ers, despite receiving no feedback
between o¤ers, while the other half didn�t. All decisions of a single �rst mover were playedagainst di¤erent groups.19 In the voting procedure, in the gift exchange games, a researcher �rst asked how many
group members would support giving at least one unit of gift to the �rst proposer. Groupmembers were asked to raise a hand in case they supported the proposal. In case the majorityof group members supported giving at least one unit, the researcher asked the group membershow many of them would support giving at least two units. The procedure continued until amajority indicated not supporting any higher amount of gift. For the risky choice experiment,
11

Deliberation session, and the second type of session as a No Deliberationsession. After all decisions in all three phases had been made, group members�lled in a post-experimental questionnaire asking for demographic data andcontaining open questions for motivations of subjects�decisions.There was one session with 18 groups (6 distinct groups in each of the three
phases) of the No Deliberation treatment, where the experimenters used a vot-ing mechanism to aggregate group decisions. There were three sessions with12, 12 and 9 groups, respectively, (in total 33) of the Deliberation treatment,where participants in groups discussed their choice without the presence of theexperimenter. The treatment conditions, the total number of group decisionsand distinct groups are summarized in Table 1. Overall, we collected �ve indi-vidual and one group choice for each of 102 gift exchange games and 510 singlechoices between lotteries.At the end of the experiment all participants were paid in cash. Units of
token money for the gift-exchange game were converted to real money at a �xedexchange rate, plus subjects received an additional �xed show-up fee.20 Groupmembers earned the income from each gift exchange game and from one ran-domly chosen out of the three lottery questionnaire choices they were involvedin. Subjects were told that for each of those choices with 50% probability oneof the individual decisions would become the e¤ective group choice, with equalprobability allocated to every group member�s decision, and that in this case itwould not be revealed to the group whose individual decision was chosen. Withthe remaining 50% probability the group�s joint decision became the e¤ectivegroup choice. The average payo¤ for purely individual and group participantswas $22.25 and $24.01 with a standard deviation of $3.55 and $4.25, respectively.Each session lasted approximately one hour and thirty minutes.
5 Experimental �ndings in the gift-exchange games
5.1 Main results
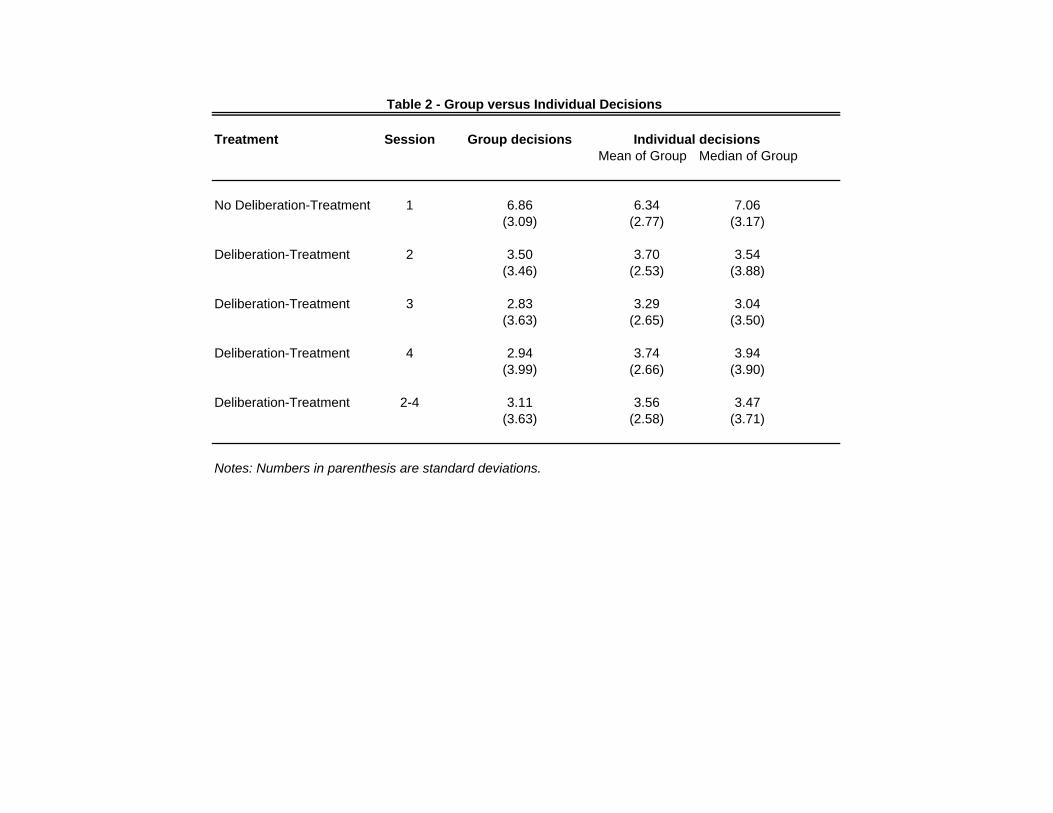
Table 2 presents summary statistics about group and individual group members�decisions. The table shows that in the No Deliberation treatment the mean ofthe group decisions is 6.86 and standard deviation is 3.09, while the mean of thegroup decisions in the three sessions of the Deliberation treatment is 3.11 witha standard deviation of 3.63. The di¤erence between the mean group decisionin the No Deliberation and Deliberation treatments can be partially accountedfor by a higher mean �rst mover o¤er of 8.46 in the No Deliberation sessionversus a mean �rst mover o¤er of 7.26 in the Deliberation treatment. However,
we solicited the number of subjects who preferred the �rst choice for each of the 10 questions.Note that since we imposed simple majority voting and the groups consisted of an odd numberof members, our design did not imply default options like in Charness and Jackson (2006)that could potentially become a focal choice for the group.20The exchange rate for gift-exchange games of $0.10 per token was verbally announced at
the beginning of sessions.
12
the ratio of the �rst mover�s o¤er to the group�s decision in the deliberationsessions is much larger than this ratio in the No deliberation session. This maysuggest that there is a di¤erent subject pool in the No Deliberation session.However, this does not invalidate the tests we conducted as long as the waydi¤erent opinions get aggregated does not depend on the vector of individualopinions (as in the mean or median hypotheses, which postulate that whateverthe individual decisions are, the group decision is the mean or the median ofindividual decisions). Comparing the three deliberation sessions, the mean ofthe group decisions is between 2.8 and 3.5, and the mean of the �rst movers�o¤ers are comparable across these sessions.The next two columns of Table 2 report the mean and median of the decisions
of the �ve members of a group. In the No Deliberation treatment, the meanand median of the group members�individual decisions bracket the mean of thegroup�s decisions. In contrast, in all of the Deliberation sessions, both the meanand the median of individual decisions are larger than the group decision.Table 3 presents estimates using data from the No Deliberation session. The
�rst regression includes a constant and all �ve individual decisions ordered fromlowest to highest. The estimated constant is not signi�cantly di¤erent from zero,which is evidence against the group-level shift hypothesis. Of the �ve individualdecisions, only the third largest group member (the median) has a signi�cantin�uence on the group�s decision at the 1% level. In addition, the group memberwho made the largest individual decision has a marginally signi�cant e¤ect atthe 10% level. The pattern remains the same when we include �xed e¤ectsfor each phase of each session in the second column. The last �ve rows of thetable report F-statistics and p-values for our various hypothesis tests. In bothspeci�cations, we reject both the mean and strong mean hypothesis with highsigni�cance. We cannot reject the median or strong median hypothesis, and wedo not �nd support for a group-level shift.When we aggregate the decisions of group members by computing their mean
and median for each group decision in column (3) and (5), we �nd that both themean and median are very good predictors of the group�s decision, where thecoe¢ cient on the mean is 1.06 and the coe¢ cient on the median is 0.95. Bothregressions include a constant, which is not estimated signi�cantly. Columns (4)and (6) parallel the speci�cations but include �xed e¤ects for each phase of eachsession, with almost no di¤erence in the estimates from columns (3) and (5),respectively. These estimates show that both the mean and median are highlysigni�cant, and have a coe¢ cient which is indistinguishable from 1. Finally, in28 of our 36 observations, the median of the individual decisions is exactly equalto the group�s decision. It is a reassuring test of our experimental setup thatthe median hypothesis holds in our No Deliberation session because the sessionso closely mirrors majority voting.Table 4 presents the estimates from the Deliberation sessions pooled to-
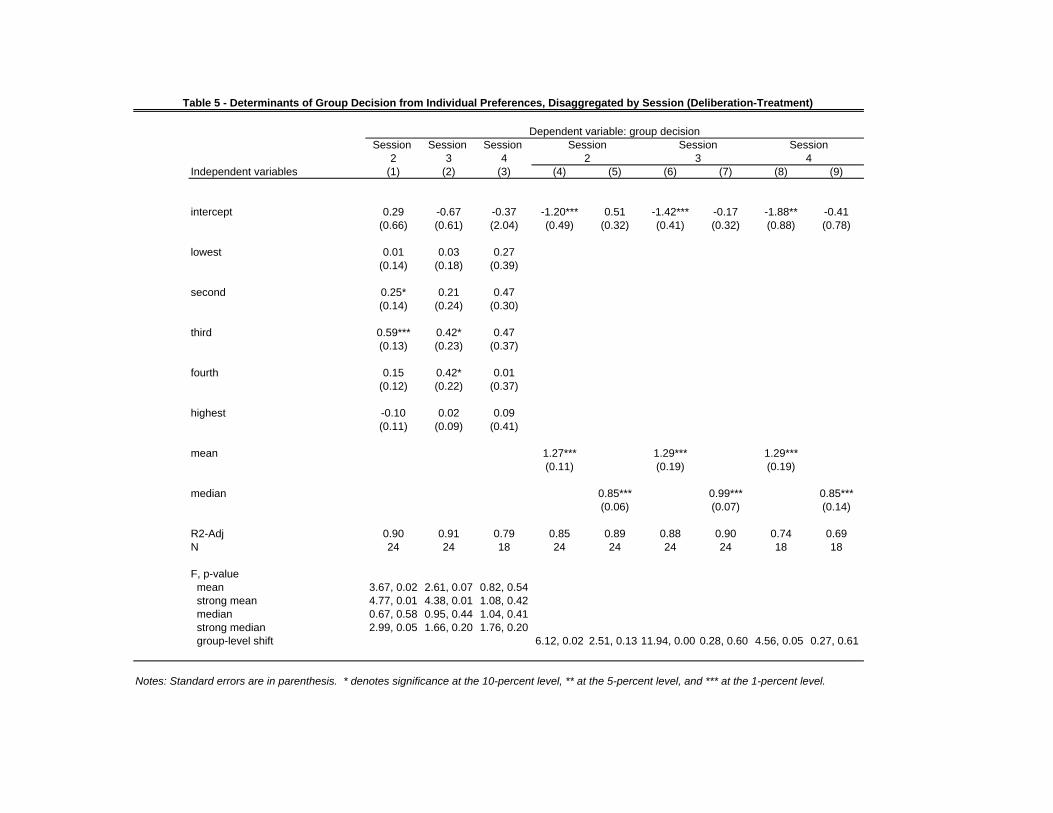
gether, while Table 5 reports estimates for each session separately. In Table 4,in column (1), we estimate that the second lowest and median group memberhave a statistically signi�cant impact on the group�s decision, with the mediangroup member having a larger weight. When we include �xed e¤ects for each
13

phase of each session as controls in column (2), we �nd virtually no change inthe estimated coe¢ cients for the second and median group member.In both speci�cations, we reject both the mean and strong mean hypothesis
with high signi�cance. The fact that the second group member has a reliablysigni�cant e¤ect across speci�cations also casts doubt on the median and thestrong median hypothesis. Both of these hypotheses are rejected under eitherspeci�cation (1) or (2), though the level of signi�cance is greater for the strongmedian hypothesis.Next, we aggregate the group members�decisions by computing the mean
and median for each group decision. In contrast to the No Deliberation session,we now �nd a signi�cant di¤erence between the two models. The estimatedcoe¢ cients do not change in a signi�cant way when we add �xed e¤ects for eachphase of each session as controls in column (4) and (6). In both speci�cations,the coe¢ cient on the mean or median is statistically signi�cant. But in themean speci�cation, the coe¢ cient on the intercept is negative and statisticallysigni�cant, while in the median speci�cation, the coe¢ cient on the intercept isnot statistically signi�cant.A lower fraction of the variation is explained by the median regression in the
Deliberation session than in the No Deliberation session. In the Deliberationsession, in a lower fraction of observations, 39 out of 66, the median is exactlythe same as the group�s decision. In 41% of the observations, the individualmedian is di¤erent from the group. In most of the remaining cases, the groupdecision is lower than predicted by the median. These patterns suggest that theDeliberation treatment may add extra variance relative to the No Deliberationtreatment.Figure 1 presents visual evidence. The scatter plots real group decisions
over mean (solid squares) and median (dashed circles) of individual decisionsin groups in the sessions of the Deliberation treatment. The lines in the �gure(solid and dashed, respectively) are formed from the estimates in speci�cations(4) and (6) in Table 4. As we observed in the regression estimates, there is nosigni�cant intercept in the median regression, so the line almost goes throughthe origin. In contrast, the mean line is shifted. Looking at the data for eachgroup decision shows that if the median is extreme (0 or 1) then the minority�sopinion does not a¤ect the group�s decision and the majority�s opinion - thatis, the median�s opinion prevails. If the median is in between, then in a lot ofcases the group decision is not the median individual decision.
5.2 Additional speci�cations
5.2.1 Robustness across sessions
Table 5 investigates the robustness of our results for the Deliberation treatmentin the gift-exchange games by examining the results separately for each session.The advantage of looking at each session separately is that it does not requireus to make assumptions about comparability across sessions. In the �rst threecolumns of the table, we report the estimates from the speci�cation where each
14
member of the group is ordered by their individual decision and we include aconstant. Since each session only has no more than 24 observations of groupdecisions, we have limited power to estimate signi�cant coe¢ cients in the spec-i�cations. Nonetheless, we see in column (1) and (2) that the median groupmember has a signi�cant and largest impact on the group�s decision. In Session2, the second lowest group member has a marginally signi�cant impact, whilein Session 3, the second highest group member has a marginally signi�cant im-pact. For the �rst and second columns, we also are able to reject both themean and the strong mean hypothesis. In column (3), we �nd that none of theestimated coe¢ cients are signi�cant and we are unable to reject the equality ofthe coe¢ cients at conventional levels. One reason for this is that we have 25%fewer observations in this session than in the other sessions. Finally, in eachof the columns we cannot reject the median hypothesis, and are only able toreject the strong median hypothesis in column (1). Despite the limited powerof these speci�cations, the estimates in columns (1) and (2) support the earlier�ndings that the median group member is in�uential and the mean hypothesisis rejected, while the estimates from all three columns do not allow us to rejectthe median hypothesis.The remaining columns of Table 5 focus on the comparison between the
two ways of aggregating preferences of the individuals in a group. We con�rmthe earlier �ndings for each of the sessions when examined separately: the meanregression shows a signi�cant group level shift, while the median regression doesnot. Moreover, the coe¢ cient on the mean is larger than the coe¢ cient on themedian. The estimated group shift is signi�cant at the 1% level in the �rst andthird session, and at the 5% level in the second session.
5.2.2 Robustness across phases
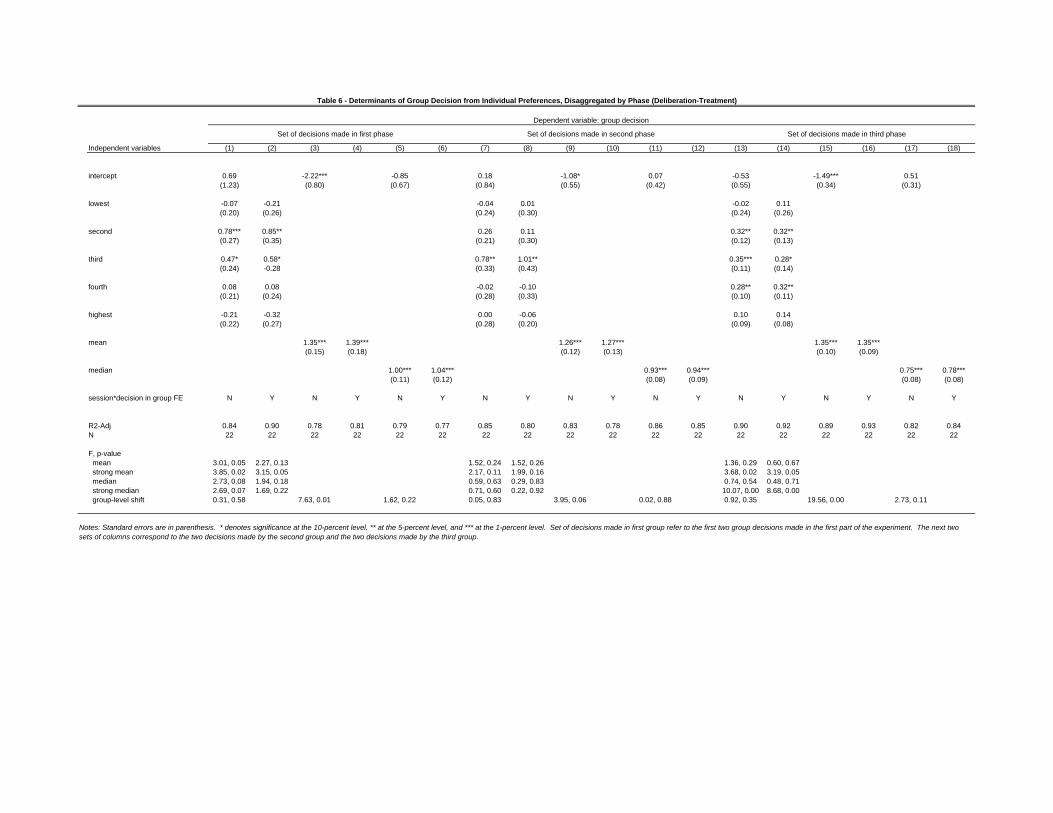
Table 6 investigates the robustness of our results for the Deliberation treatmentby examining how individuals reach their group decision in the di¤erent periodsin the experiment. This has the advantage that we can examine di¤erences inthe aggregation to group decisions over time. During the course of the exper-iment, an individual belongs to three di¤erent groups, and the estimates arereported for each of these phases. The �rst two columns repeat our earlier mainspeci�cation but only consider the �rst set of groups in the experiment. We poolacross sessions leaving a total of 22 group decisions. The di¤erence between col-umn (1) and (2) is that column (2) includes �xed e¤ects for interactions betweenthe session and whether it is the �rst or second decision made by the group inthat phase. The pattern in column (1) mirrors our earlier �ndings: there is nogroup level shift, the second and median group member are most signi�cant, apattern which is robust to the added controls of column (2). The mean regres-sion in column (3) exhibits a highly signi�cant group level shift, while in themedian regression in column (5) there is no group shift and the coe¢ cient onthe median is exactly 1.The speci�cations for the second set of decisions and the third set of decisions
largely parallel the �rst set of decisions. First, the median is signi�cant for both
15
sets. For the second set of decisions, the median is the only signi�cant individualdecision, while for the third set of decisions, the three individuals who are at themiddle of the group are all signi�cant. When we allow the coe¢ cient on each ofthe individual group members to vary with the phase (unreported), we cannotreject the hypothesis that the coe¢ cients are equal across the phases. Next, inthe mean regression, we detect a group shift, which is not present in the medianregression. Taken together, the results presented in this table con�rm our earlier�ndings, and show that the way individual decisions get aggregated into a groupdecision stays the same throughout di¤erent phases of the experiment.
5.2.3 Role of demographic characteristics
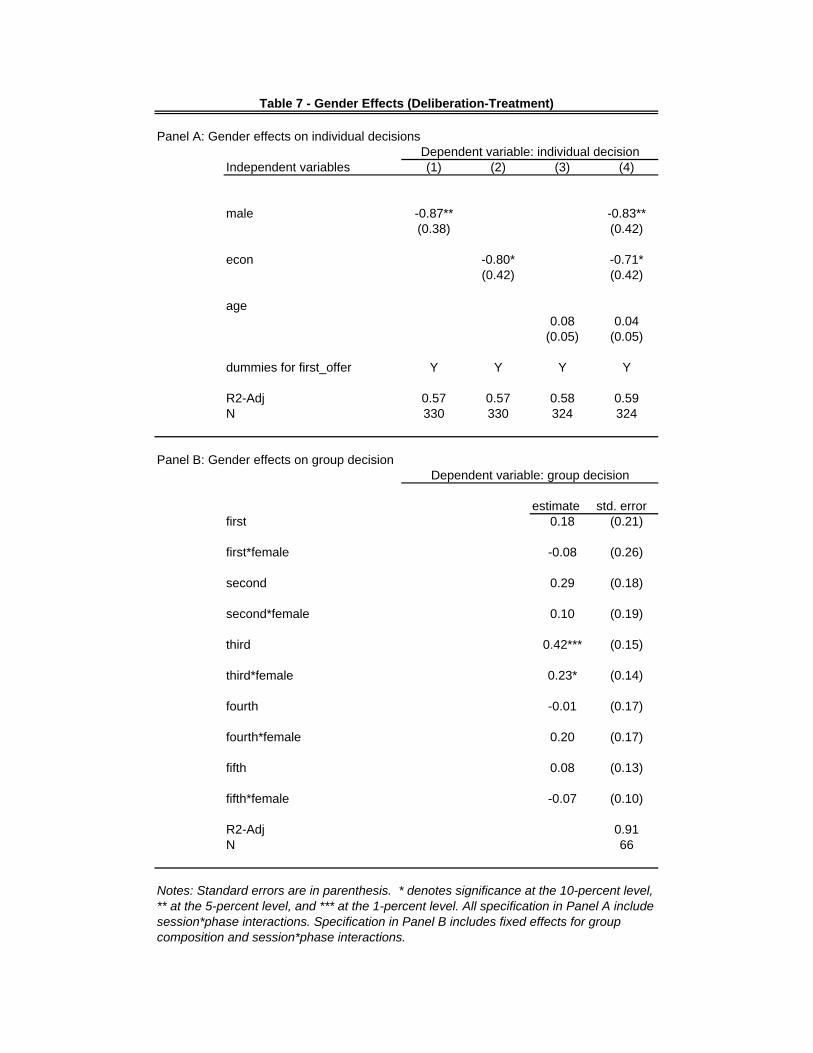
Finally, we investigate how our analysis in the Deliberation treatment dependson the demographic characteristics of the participants. In our sessions of theDeliberation treatment, 60% of subjects are male, 29% study an economics-related �eld, and the mean age is 22.21 Panel A of Table 7 examines how thesethree characteristics are related to the individual decisions. In each column,we report the estimate of a regression on indicators for gender and economics-related �eld, and a linear function of age. We include dummies for the �rsto¤er in the gift exchange game. The coe¢ cient on male both in speci�cation(1) and (4) is large and signi�cant. The coe¢ cient implies that men on averagecontribute about 0.8 points less than women faced with the same �rst o¤er. Thecoe¢ cient on the indicator for economics-related �eld is also signi�cant, but atthe 10% level and implies that these subjects also return back less.Panel B investigates how the gender of a group member in�uences the weight
(s)he has on the group�s decision. The regression follows our main speci�cation,but includes interactions of ordered individuals with their gender being female.22
Adding these gender-speci�c interactions results in only the median group mem-ber�s coe¢ cient being signi�cant. Moreover, when the median group member isa female, her value has even more in�uence on the group�s decision than whenthe median group member is male, and the di¤erence in the coe¢ cients is highlysigni�cant. We explored the same speci�cation for age and economics-relatedsubject and did not detect any e¤ect of the variable on being in�uential in thegroup decision.
6 Experimental �ndings in the lottery choices
In this section, we describe the data from the risk choice situations. Each lotterychoice experiment asks for the comparison between p[$11:50]� (1�p)[$0:30] vs.21One of the subjects in the third session did not answer the question on age in the ques-
tionnaire.22More precisely, the interaction term is between the contribution corresponding to the given
order statistics and the share of females among subjects who are tied at this contribution level.For example, if there are three individuals contributing 10 while the other two contrib uteless, and two of these three individuals are female, then the share of females for the median,the second highest and the highest contribution in the group are all 2/3.
16

p[$6:00]�(1�p)[$4:80] as p ranges from 0 to 0:9. Since the payo¤s from the �rstlottery choice are more variable than the payo¤s for the second choice, we referto the �rst choice as the risky choice and the second choice as the safe choice.Table 8 reports the fraction of decisions which are the risky choice as p
varies. In both the No Deliberation and Deliberation treatments, virtually noindividuals make the risky choice when the probability of the high payo¤ of$11.50 is small (lottery decisions 2 and 3), while nearly all individuals make thislottery choice when the probability of $11.50 is large (lottery decisions 9 and10). The group decisions exhibit the same pattern.In the No Deliberation session, there are 18 observations of group choices
over the lotteries yielding a total of 180 observations. For lottery decisions 1-4and decisions 7-10, the median lottery choice of the group is always equal to thegroup�s choice. There is only disagreement for the 5th and 6th lottery choice.In particular, in only one observation of the 5th lottery choice does the medianof the individual choices and the group�s decision disagree, while there are 4observations of the 6th lottery choice where they disagree. In 4 of these 5 casesof disagreement, the group opts for the safe lottery even though the majority ofindividual decisions are for the risky lottery.In the Deliberation session, there are 33 observations of group choices over
the lotteries yielding a total of 330 observations. As with the No Deliberationtreatment, the median almost always predicts the group�s choice. There area total of 14 lottery choices, or less than 5% of the observations, where thegroup�s choice di¤ers from the median of the individuals. In contrast to the NoDeliberation treatment, in 6 of these cases, the group choice is risky relative tothe median, while 8 times it is the safe choice.The above �ndings suggest that for both the No Deliberation and Delibera-
tion treatments, the median model is a good predictor of binary choice (in fact,a perfect predictor in most of the binary choice problems in our experiments).Nevertheless, as Table 8 shows, whenever at least 60% of individuals prefereither the safe or the risky lottery in a particular lottery choice problem, theshare of groups choosing that lottery is even higher than the share of individualschoosing it. Although this is primarily a consequence of the fact that the distri-bution of median group member choices is di¤erent from the individual choices,a researcher comparing average individual versus group decisions might reacha conclusion that people change their attitudes towards risk in group settings,and in certain lottery choice problems they exhibit a cautious shift, while inothers they exhibit a risky shift.We also investigated speci�cations where the group�s decision depends on the
choices made by each of the �ve group members, analogous to Table 3, althoughthe binary nature of the decision problem limits the scope of such investigationin the lottery choice context. For example, the �rst and second group membermake the same choice nearly all of the time (96% of our observations in theNo Deliberation treatment, and 91% of our observations in the Deliberationtreatment) and the fourth and �fth group member make the same choice inthe vast majority of our observations (93% of the time in the No Deliberationtreatment, and 90% of the time in the Deliberation treatment), making it dif-
17
�cult to draw �rm conclusions on which group members become in�uential ingroup decisions. Moreover, the results are driven by the very few number ofobservations in which the group decision di¤ers from the median individual de-cision. For these reasons, we regard �ndings from this investigation as at mostsuggestive, as opposed to being conclusive.We estimated linear probability models as well as probit regressions. In
both speci�cations, and in both treatment conditions, we �nd that the mediangroup member coe¢ cient is the largest. In the No deliberation treatment inthe probit regression only the median individual decision is signi�cant, while inthe linear probability model the group member one position from the medianin the risky direction also becomes signi�cant.23 Hence, our experiments donot yield conclusive evidence either for or against the median hypothesis in theNo deliberation treatment. The possibility that non-median members mightbecome in�uential in this treatment is created by the sequentiality of solicitinggroup decisions in lottery choices: even though choosing between lotteries notdominating each other is not an intellective task, people might try to learn whatthe �correct�choice is from others�votes. Hence, observing the distribution ofvotes in earlier lottery choice problems might in�uence some subjects�votes insubsequent problems. This implies that the order in which we solicited groupdecisions in the binary lottery choices may have in�uenced the choices of thegroups, which merits further investigation.In the Deliberation treatment, we also �nd that the median group member
has the largest coe¢ cient, while the group members one position away fromthe median in both directions also become signi�cant, with coe¢ cients that aresimilar to each other in magnitudes.24
Analogously to many previous experiments, men in our lottery choice prob-lems are willing to take signi�cantly more risk than women.25 It is not clearhow gender a¤ects a subject being in�uential on group decisions in the deliber-ation treatment. Just like in the gift-exchange game, the median group memberis signi�cantly more in�uential on the group decision if the median is female.However, the gender e¤ect reverses for the amount of in�uence the second mostcautious group member has on the group decision.26 Age and the indicator ofbeing an economics major do not have a signi�cant e¤ect on individual lotterychoices, and on in�uencing the group decision in lottery choices.
23 In the linear probability model with controls for lottery choice*phase, the estimated co-e¢ cient on the median group member is 0.65 and the coe¢ cient on the group member whomakes a riskier choice is 0.28, both of which are highly signi�cant.24 In the linear probability model with controls for lottery choice*phase*session, the esti-
mated coe¢ cient on the median group member is 0.36 (signi�cant at 1%), the coe¢ cient forthe group member who makes a risker choice than the median is 0.19 (signi�cant at 1%),while the coe¢ cient for the group member who makes a less risky choice than the median is0.13 (signi�cant at 10%).25Analogous to the regressions on the demographic e¤ects on trust decisions reported in
Table 7 Panel A, we ran linear probability models on individual lottery decisions, yieldinga signi�cant e¤ect for male decision makers, but no e¤ect for economic education or age.Alternative Ordered Probit regressions con�rmed this result.26Those observations are based on regressions of group lottery choices on individual decisions
and gender interactions analogous to Table 7 Panel B.
18
The limited variation in our lottery choice data prevents us from investigat-ing the same formal hypothesis that we did with the gift-exchange experiments.The study of risky choices made by individuals and groups will likely requirean experimental design that features lottery choices in which subjects have alarger set of choices and more diversely distributed preferences.
7 Conclusion
This paper argues that comparing average individual decisions to average de-cisions made by groups of people can lead to an identi�cation of a group shiftwhich, however, only rests upon the distribution and speci�c aggregation of in-dividual choices, but not on a real preference shift. We also show that a theoryaccording to which the median group member�s individual decision becomes thegroup decision explains the data well in the two contexts we examined if de-liberation is not allowed. If deliberation is allowed then other group membersclose to the median position can also become in�uential in the group decision.Group members too far away from the median position do not seem to be ableto in�uence the group decision.Although we do �nd that deliberation can make non-median group members
in�uential, we think that it is important to reexamine whether there is such ane¤ect in other contexts. If one de�nes group shift as the expected di¤erencebetween average individual decisions and average group decisions, then a groupshift might be detected even when according to our de�nition there is no shift(the median group member�s opinion prevails). This can explain for examplewhy previous research found shifts in opposite directions in two decision prob-lems involving the same kind of task. The observation that in certain lotterychoice problems groups exhibit risky shifts, while in others exhibiting cautiousshifts could be explained by the median hypothesis if in the �rst type of lotterychoice problems the distribution of individual preferences was skewed towardsthe risk-taking extreme, while in the other type of lottery problems they areskewed towards the safe extreme. Finally, the possibility that in many contextsthe group shift documented by the literature might be simply explained by atheory that the median group member�s opinion prevails is consistent with twogeneral observations on group shifts. One is that group shifts tend to occur inthe direction of the original inclination of the group (that is in the directiontowards which the distribution of preferences is skewed).27 The second one isthat group shifts are less likely to occur when groups tend to have roughly equalnumber of individuals predisposed one way versus the other - that is when thedistribution of preferences in the subject pool is close to symmetric.28
In future research we also plan to investigate the question of how individualpreferences get aggregated into a group decision in settings in which people arenot likely to have single-peaked preferences over choices, and hence the medianvoter theorem does not apply.
27See for example Brown (1986), p210-212.28See for example Sunstein (2000), p90.
19

References
ASCH, S. E. (1995): �Opinions and social pressure,�IN: Aronson, E. (Ed.),Readings about the social animal 13.AMBRUS, A. and P. PATHAK (2007): �Cooperation over �nite horizons: A
theory and experiments,�mimeo, Harvard University.BAKER, R. J., S. K. LAURY and A. W. WILLIAMS (2008): �Comparing
small-group and individual behavior in lottery-choice experiments,� SouthernEconomic Journal, 75, 367-382.BERG, J., J. DICKHAUT and K. McCabe (1995): �Trust, reciprocity, and
social history,�Games and Economic Behavior, 10, 122-142.BLINDER, A. and J. MORGAN (2005): �Are two heads better than one?
An experimental analysis of group versus individual decision making,�Journalof Money, Credit and Banking, 37, 789-811.BORNSTEIN, G., T. KUGLER and A. ZIEGELMEYER (2004): �Individ-
ual and group decisions in the centipede game: are groups more "rational"players?,�Journal of Experimental Social Psychology, 40, 599-605.BORNSTEIN, G. and I. YANIV (1998): �Individual and group behavior
in the ultimatum game: Are groups more �rational� players?,� ExperimentalEconomics, 1, 101-108.BRANDTS, J. and G. CHARNESS (2004): �Do labour market conditions
a¤ect gift exchange? Some experimental evidence,� Economic Journal, 114,684-708.BRANDTS, J. and A. SCHRAM (2001): �Cooperation and noise in public
goods experiments: applying the contribution function approach,� Journal ofPublic Economics, 79, 399-427.BROWN, R. (1974): �Further comment on the risky shift,�American Psy-
chologist, 29, 468-70.BROWN, R. (1986): �Social psychology: the second edition,� The Free
Press, New York.BURNSTEIN, E. (1982): �Persuasion as argument processing,�IN: Brand-
stätter et al. (Eds.), Group Decision Making.BURNSTEIN, E., A. VINOKUR and Y. TROPE (1973): �Interpersonal
comparisons versus persuasive argument: a more direct test of alternative expla-nations for group-induced shifts in individual choices,�Journal of ExperimentalSocial Psychology, 9, 236-45.CASON, T. and V. MUI (1997): �A laboratory study of group polarisation
in the team dictator game,�The Economic Journal, 107, 1465-1483.CHARNESS, G. and M. JACKSON (2006): �Group play in games and the
role of consent in network formation,�mimeo, UC Santa Barbara and StanfordUniversity.CHARNESS, G. and M. JACKSON (2009): �The role of responsibility in
strategic risk-taking,�Journal of Economic Behavior and Organization, 69, 241-247.
20

CHARNESS, G., L. RIGOTTI, and A. RUSTICHINI (2007): �Individualbehavior and group membership,�American Economic Review, 97, 1340-1352.CHEN, Y. and S. X. LI (2009): �Group identity and social preferences,�
American Economic Review, 99, 431-457.CHRISTENSEN, C. and A. S. ABBOTT (2000): �Team medical decision
making,�IN: G. Chapman and F. Sonnenberg (Eds.), Decision making in healthcare.COOPER, D. J. and J. KAGEL (2005): �Are Two Heads Better than One?
Team versus Individual Play in Signaling Games," American Economic Review,95, 477-509.ELIAZ, K., D. RAY and R. RAZIN (2005): "Choice shifts in groups and the
Allais paradox," American Economic Review, 96, 1321-1332.FEHR, E., G. KIRCHSTEIGER and A. RIEDL (1993): �Does fairness pre-
vent market clearing? An experimental investigation,�Quarterly Journal of Eco-nomics, 108, 437-459.FERGUSON, D. A. and N. VIDMAR (1971): �E¤ects of group discussion
on estimates of culturally appropriate risk levels,� Journal of Personality andSocial Psychology, 20, 436-445.FISCHBACHER, U. (2007): �z-Tree: Zurich Toolbox for Ready-made Eco-
nomic Experiments,�Experimental Economics, 10, 171-178.FISCHBACHER, U., S. GÄCHTER and E. FEHR (2001): �Are people con-
ditionally cooperative? Evidence from a public goods experiment,�EconomicsLetters, 71, 397-404.GIGONE, D. and R. HASTIE (1993): �The common knowledge e¤ect: In-
formation sharing and group judgement,� Journal of Personality and SocialPsychology, 65, 959-974.GLAESER, E. L. and C. R. SUNSTEIN (2009): �Extremism and social
learning,�The Journal of Legal Analysis, 1, 263-324.HOLT, C. and LAURY, S. (2002): �Risk aversion and incentive e¤ects,�
American Economic Review, 92, 1644-1655.HONG, L. K. (1978): �Risky shift and cautious shift: some direct evidence
on the culture-value theory,�Social Psychology, 41, 342-346.INSKO, C. A., J. SCHOPLER, R. H. HOYLE, G. J. DARDIS & K. A.
GRAETZ (1990): �Individual-group discontinuity as a function of fear andgreed,�Journal of Personality and Social Psychology, 58, 68-79.KERR, N. L., R. J. MacCOUN and G. P. KRAMER (1996): �Bias in judge-
ment: Comparing individuals and groups,�Psychological Review, 103, 687-719.KOCHER, M. G. and M. SUTTER (2005): �The decision-maker matters:
individual versus group behaviour in experimental beauty-contest games,�TheEconomic Journal, 115, 200-223.KOCHER, M. G. and M. SUTTER (2007): �Individual versus group behav-
ior and the role of the decision making process in gift-exchange experiments,�Empirica, 34, 63-88.KRAMER, R. M. (1991): �Intergroup relations and organizational dilem-
mas: the role of categorization processes,�IN: L. L. Cummings and B. M. Staw(Eds.), Research in Organizational Behavior Vol. 13, Greenwich, CT: JAI Press.
21

LAUGHLIN, P. R. (1980): �Social combination process of cooperative problem-solving groups at verbal intellective tasks,� IN: M. Fishbein (Ed.), Progress inSocial Psychology, 1, 127-155.LAUGHLIN, P. R. and A. L. ELLIS (1986): �Demonstrability and social
combination processes on Mathematical intellective tasks,� Journal of Experi-mental Social Psychology, 22, 170-189.LEDYARD, J. (1995): �Public goods,� IN: J. Kagel and A. Roth (Eds.),
Handbook of Experimental Economics, Princeton University Press.LEVINGER, G. and D. J. SCHNEIDER (1969): �Test of the "risk is value"
hypothesis,�Journal of Personality and Social Psychology, 11, 165-169.LINDSKOLD, S., D. C. McELWAIN & M. WAYNER (1977): �Cooperation
and the use of coercion by groups and by individuals,� Journal of Con�ictResolution, 21, 531-50.LUHAN, W., M. KOCHER, and M. SUTTER (2009): �Group polarization
in the team dictator game reconsidered,�Experimental Economics, 12, 26-41.MASCLET, D., N. COLOMBIER, L. DENANT-BOEMONT and Y. LO-
HEAC (2009): �Group and individual risk preferences: A lottery-choice experi-ment with self-employed and salaried workers,�Journal of Economic Behaviorand Organization, 70, 470-484.MANIN, B. (2005): �Deliberation: why we should focus on debate rather
than discussion,�Paper delivered at the Program in Ethics and Public A¤airsSeminar, Princeton University, 13 October 2005.MOULIN, H. (1980): �On strategy-proofness and single peakedness,�Public
Choice, 35, 437-55.MOSCOVICI, S. and M. ZAVALLONI (1969): �The group as a polarizer of
attitudes,�Journal of Personality and Social Psychology, 12, 125-135.MYERS, D. G. and S. J. ARENSON (1972): �Enhancement of dominant
risk tendencies in group discussion,�Psychological Reports, 30, 615-623.NIEDERLE, M. (2009): �Identity: Individual Traits, Discrimination and
Groups,�to be published IN: John Kagel and Al Roth (eds.): The 2nd handbookof experimental economics.PALFREY, T. and J. PRISBEY (1997): �Anomalous behavior in linear
public goods experiments: how much and why?,�American Economic Review,87, 829-46.PYLYSHYN, Z., N. AGNEW & J. ILLINGWORTH (1966): �Comparison
of individuals and pairs as participants in a mixed-motive game,� Journal ofCon�ict Resolution, 10, 211-220.RABBIE, J. M. (1982): The e¤ects of intergroup competition and coopera-
tion on intragroup and intergroup relations,�IN: V. J. Derlega and J. Grzelak(Eds.), Cooperation and helping behavior: Theories and research, 123-49, NewYork: Academic Press.ROBERT, C. and P. J. CARNEVALE (1997): �Group choice in ultimatum
bargaining,�Organizational Behavior and Human Decision Processes, 72, 256-279.SCHKADE, D., C. R. SUNSTEIN and D. KAHNEMAN (2000): �Deliberat-
ing About Dollars: The Severity Shift,�Columbia Law Review, 100, 1139-1176.
22
SCHOPLER, J. and C. A. INSKO (1992): �The discontinuity e¤ect in per-sonal and intergroup relations: Generality and mediation,�IN: W. Stroebe andM. Hewstone (Eds.), European review of social psychology, Vol. 3, 121-151,Chichester, England: Wiley.SHUPP, R. S. and A. WILLIAMS (2008): �Risk preference di¤erentials of
small groups and individuals,�Economic Journal, 118, 258-283.STONER (1961): �A comparison of individual and group decisions under
risk,�unpublished thesis, MIT School of Management.SUNSTEIN, C. R. (2000): �Deliberative trouble? Why groups go to ex-
tremes," Yale Law Journal, 110, 71-119.SUNSTEIN, C. R. (2002): �The law of group polarization,�The Journal of
Political Philosophy, 10, 175-195.SUTTER, M. (2009): �Individual behavior and group membership: Com-
ment,�American Economic Review, forthcoming.TAJFEL, H.,M. G. BILLIG, R. F. BUNDY and C. FLAMENT (1971): �So-
cial categorization and intergroup behavior,�European Journal of Social Psy-chology, 1, 149-177.TEGER, A. I. and D. G. PRUITT (1967): �Components of group risk tak-
ing,�Journal of Experimental Social Psychology, 3, 189-205.WALLACH, M. A., N. KOGAN and D. J. BEM (1962): �Group in�uence on
individual risk taking,�Journal of Abnormal and Social Psychology, 65, 75-86.WALLACH, M. A., N. KOGAN and D. J. BEM (1962): �Di¤usion of re-
sponsibility and level of risk taking in groups,�Journal of Abnormal and SocialPsychology, 68, 263-274.WILDSCHUT, T., B. PINTER, J. L. VEVEA, C. A. INSKO and J. SCHOPLER
(2003): �Beyond the group mind: a quantitative review of the interindividual-intergroup discontinuity e¤ect,�Psychological Bulletin, 129, 698-722.WOLOSIN, R. J., S. J. SHERMAN and C. R. MAYNATT (1975): �When
self-interest and altruism con�ict,�Journal of Personality and Social Psychol-ogy, 32, 752-760.
23
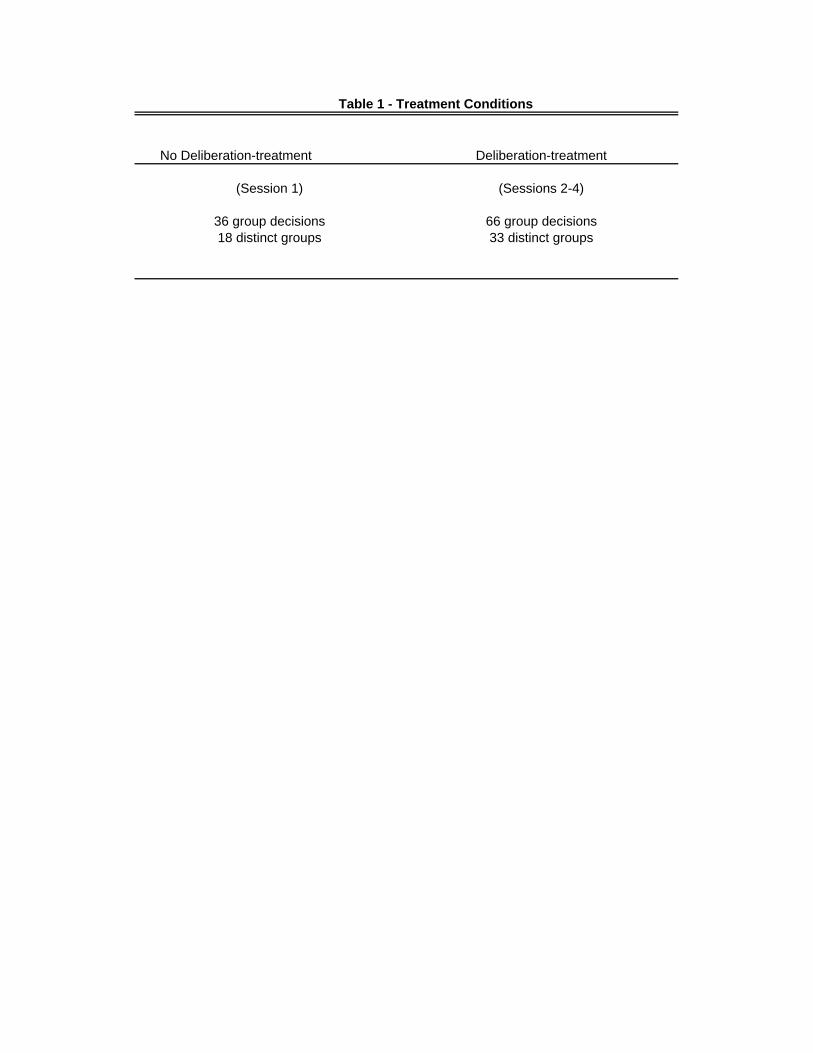
Table 1 - Treatment Conditions
No Deliberation-treatment
18 distinct groups 33 distinct groups
Deliberation-treatment
(Session 1) (Sessions 2-4)
36 group decisions 66 group decisions
Treatment Session Group decisionsMean of Group Median of Group
No Deliberation-Treatment 1 6.86 6.34 7.06(3.09) (2.77) (3.17)
Deliberation-Treatment 2 3.50 3.70 3.54(3.46) (2.53) (3.88)
Deliberation-Treatment 3 2.83 3.29 3.04(3.63) (2.65) (3.50)
Deliberation-Treatment 4 2.94 3.74 3.94(3.99) (2.66) (3.90)
Deliberation-Treatment 2-4 3.11 3.56 3.47(3.63) (2.58) (3.71)
Notes: Numbers in parenthesis are standard deviations.
Table 2 - Group versus Individual Decisions
Individual decisions

Dependent variable: group decisionIndependent variables (1) (2) (3) (4) (5) (6)
intercept -0.36 0.13 0.16(0.37) (0.41) (0.29)
lowest 0.01 0.00(0.05) (0.05)
second 0.02 0.05(0.08) (0.08)
third 0.76*** 0.73***(0.16) (0.16)
fourth -0.03 -0.01(0.18) (0.18)
highest 0.23* 0.23*(0.13) (0.13)
mean 1.06*** 1.06***(0.06) (0.06)
median 0.95*** 0.95***(0.04) (0.04)
phase FE N Y N Y N Y
R2-Adj 0.95 0.95 0.90 0.90 0.95 0.95N 36 36 36 36 36 36
F, p-value mean 9.62, 0.00 9.72, 0.00 strong mean 8.12, 0.00 8.22, 0.00 median 1.27, 0.31 1.40, 0.26 strong median 1.60, 0.20 1.70, 0.18 group-level shift 0.95, 0.34 0.10, 0.75 0.30, 0.59
Notes: Standard errors are in parenthesis. * denotes significance at the 10-percent level, ** at the 5-percent level, and *** at the 1-percent level. To control for time and groups, specifications (2), (4), and (6) contain phase dummies.
Table 3 - Determinants of Group Decision from Individual Preferences (No Deliberation-Treatment)

Dependent variable: group decisionIndependent variables (1) (2) (3) (4) (5) (6)
intercept -0.15 -1.46*** 0.03(0.48) (0.32) (0.26)
lowest 0.02 0.06(0.12) (0.12)
second 0.39*** 0.40***(0.11) (0.12)
third 0.51*** 0.51***(0.12) (0.12)
fourth 0.12 0.14(0.11) (0.11)
highest 0.02 0.02(0.08) (0.09)
mean 1.28*** 1.33***(0.07) (0.08)
median 0.89*** 0.91***(0.05) (0.06)
session * phase FE N Y N Y N Y
R2-Adj 0.86 0.85 0.82 0.82 0.82 0.81N 66 66 66 66 66 66
F, p-value mean 4.44, 0.00 3.79, 0.01 strong mean 7.12, 0.00 7.12, 0.00 median 2.63, 0.06 2.24, 0.09 strong median 6.83, 0.00 5.88, 0.00 group-level shift 0.10, 0.76 20.56, 0.00 0.02, 0.90
Notes: Standard errors are in parenthesis. * denotes significance at the 10-percent level, ** at the 5-percent level, and *** at the 1-percent level. To control for pooling of sessions, time and groups, specifications (2), (4), and (6) contain interactions of phase and session dummies.
Table 4 - Determinants of Group Decision from Individual Preferences (Deliberation-Treatment)
Session Session Session 2 3 4
Independent variables (1) (2) (3) (4) (5) (6) (7) (8) (9)
intercept 0.29 -0.67 -0.37 -1.20*** 0.51 -1.42*** -0.17 -1.88** -0.41(0.66) (0.61) (2.04) (0.49) (0.32) (0.41) (0.32) (0.88) (0.78)
lowest 0.01 0.03 0.27(0.14) (0.18) (0.39)
second 0.25* 0.21 0.47(0.14) (0.24) (0.30)
third 0.59*** 0.42* 0.47(0.13) (0.23) (0.37)
fourth 0.15 0.42* 0.01(0.12) (0.22) (0.37)
highest -0.10 0.02 0.09(0.11) (0.09) (0.41)
mean 1.27*** 1.29*** 1.29***(0.11) (0.19) (0.19)
median 0.85*** 0.99*** 0.85***(0.06) (0.07) (0.14)
R2-Adj 0.90 0.91 0.79 0.85 0.89 0.88 0.90 0.74 0.69N 24 24 18 24 24 24 24 18 18
F, p-value mean 3.67, 0.02 2.61, 0.07 0.82, 0.54 strong mean 4.77, 0.01 4.38, 0.01 1.08, 0.42 median 0.67, 0.58 0.95, 0.44 1.04, 0.41 strong median 2.99, 0.05 1.66, 0.20 1.76, 0.20 group-level shift 6.12, 0.02 2.51, 0.13 11.94, 0.00 0.28, 0.60 4.56, 0.05 0.27, 0.61
Table 5 - Determinants of Group Decision from Individual Preferences, Disaggregated by Session (Deliberation-Treatment)
Dependent variable: group decision
Notes: Standard errors are in parenthesis. * denotes significance at the 10-percent level, ** at the 5-percent level, and *** at the 1-percent level.
4Session Session Session
2 3
Independent variables (1) (2) (3) (4) (5) (6) (7) (8) (9) (10) (11) (12) (13) (14) (15) (16) (17) (18)
intercept 0.69 -2.22*** -0.85 0.18 -1.08* 0.07 -0.53 -1.49*** 0.51(1.23) (0.80) (0.67) (0.84) (0.55) (0.42) (0.55) (0.34) (0.31)
lowest -0.07 -0.21 -0.04 0.01 -0.02 0.11(0.20) (0.26) (0.24) (0.30) (0.24) (0.26)
second 0.78*** 0.85** 0.26 0.11 0.32** 0.32**(0.27) (0.35) (0.21) (0.30) (0.12) (0.13)
third 0.47* 0.58* 0.78** 1.01** 0.35*** 0.28*(0.24) -0.28 (0.33) (0.43) (0.11) (0.14)
fourth 0.08 0.08 -0.02 -0.10 0.28** 0.32**(0.21) (0.24) (0.28) (0.33) (0.10) (0.11)
highest -0.21 -0.32 0.00 -0.06 0.10 0.14(0.22) (0.27) (0.28) (0.20) (0.09) (0.08)
mean 1.35*** 1.39*** 1.26*** 1.27*** 1.35*** 1.35***(0.15) (0.18) (0.12) (0.13) (0.10) (0.09)
median 1.00*** 1.04*** 0.93*** 0.94*** 0.75*** 0.78***(0.11) (0.12) (0.08) (0.09) (0.08) (0.08)
session*decision in group FE N Y N Y N Y N Y N Y N Y N Y N Y N Y
R2-Adj 0.84 0.90 0.78 0.81 0.79 0.77 0.85 0.80 0.83 0.78 0.86 0.85 0.90 0.92 0.89 0.93 0.82 0.84N 22 22 22 22 22 22 22 22 22 22 22 22 22 22 22 22 22 22
F, p-value mean 3.01, 0.05 2.27, 0.13 1.52, 0.24 1.52, 0.26 1.36, 0.29 0.60, 0.67 strong mean 3.85, 0.02 3.15, 0.05 2.17, 0.11 1.99, 0.16 3.68, 0.02 3.19, 0.05 median 2.73, 0.08 1.94, 0.18 0.59, 0.63 0.29, 0.83 0.74, 0.54 0.48, 0.71 strong median 2.69, 0.07 1.69, 0.22 0.71, 0.60 0.22, 0.92 10.07, 0.00 8.68, 0.00 group-level shift 0.31, 0.58 7.63, 0.01 1.62, 0.22 0.05, 0.83 3.95, 0.06 0.02, 0.88 0.92, 0.35 19.56, 0.00 2.73, 0.11
Table 6 - Determinants of Group Decision from Individual Preferences, Disaggregated by Phase (Deliberation-Treatment)
Dependent variable: group decision
Notes: Standard errors are in parenthesis. * denotes significance at the 10-percent level, ** at the 5-percent level, and *** at the 1-percent level. Set of decisions made in first group refer to the first two group decisions made in the first part of the experiment. The next two sets of columns correspond to the two decisions made by the second group and the two decisions made by the third group.
Set of decisions made in first phase Set of decisions made in second phase Set of decisions made in third phase
Panel A: Gender effects on individual decisions
Independent variables (1) (2) (3) (4)
male -0.87** -0.83**(0.38) (0.42)
econ -0.80* -0.71*(0.42) (0.42)
age0.08 0.04
(0.05) (0.05)
dummies for first_offer Y Y Y Y
R2-Adj 0.57 0.57 0.58 0.59N 330 330 324 324
Panel B: Gender effects on group decision
estimate std. errorfirst 0.18 (0.21)
first*female -0.08 (0.26)
second 0.29 (0.18)
second*female 0.10 (0.19)
third 0.42*** (0.15)
third*female 0.23* (0.14)
fourth -0.01 (0.17)
fourth*female 0.20 (0.17)
fifth 0.08 (0.13)
fifth*female -0.07 (0.10)
R2-Adj 0.91N 66
Table 7 - Gender Effects (Deliberation-Treatment)
Dependent variable: individual decision
Dependent variable: group decision
Notes: Standard errors are in parenthesis. * denotes significance at the 10-percent level, ** at the 5-percent level, and *** at the 1-percent level. All specification in Panel A include session*phase interactions. Specification in Panel B includes fixed effects for group composition and session*phase interactions.
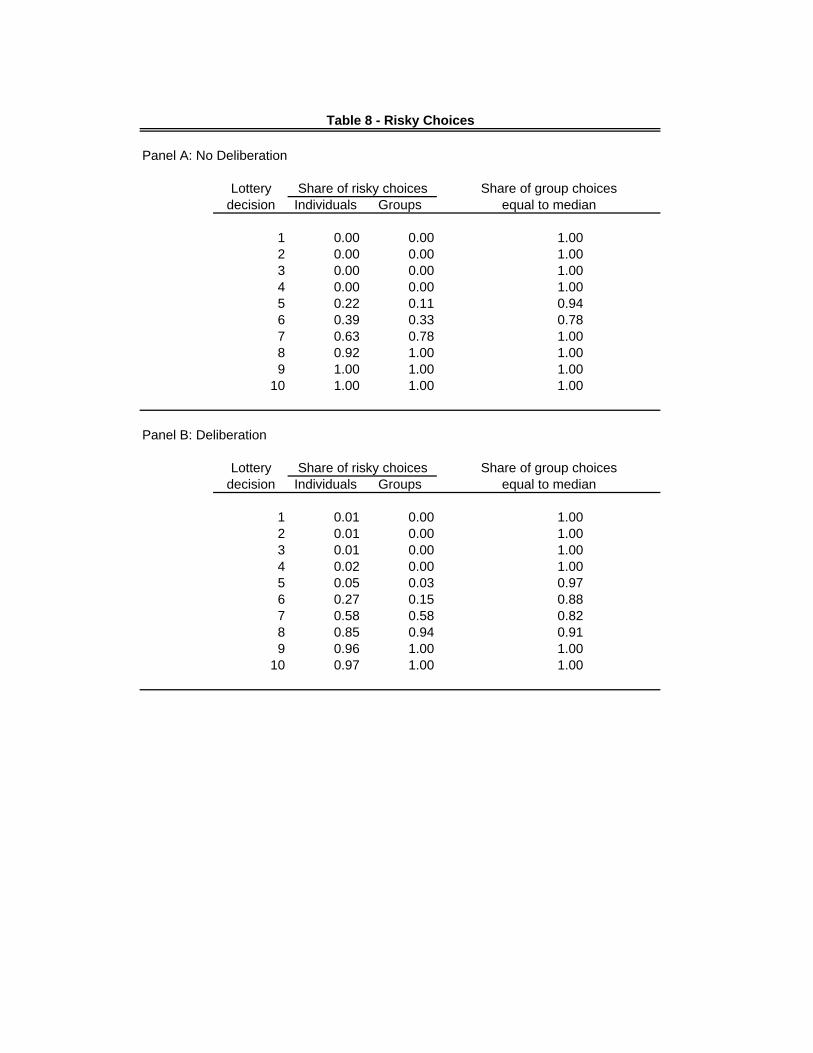
Panel A: No Deliberation
Lottery Share of group choicesdecision Individuals Groups equal to median
1 0.00 0.00 1.002 0.00 0.00 1.003 0.00 0.00 1.004 0.00 0.00 1.005 0.22 0.11 0.946 0.39 0.33 0.787 0.63 0.78 1.008 0.92 1.00 1.009 1.00 1.00 1.00
10 1.00 1.00 1.00
Panel B: Deliberation
Lottery Share of group choicesdecision Individuals Groups equal to median
1 0.01 0.00 1.002 0.01 0.00 1.003 0.01 0.00 1.004 0.02 0.00 1.005 0.05 0.03 0.976 0.27 0.15 0.887 0.58 0.58 0.828 0.85 0.94 0.919 0.96 1.00 1.00
10 0.97 1.00 1.00
Share of risky choices
Table 8 - Risky Choices
Share of risky choices

Figure 1: Comparison of Predicted Group Decision using Mean and Median (Deliberation)
0
1
2
3
4
5
6
7
8
9
10
0 1 2 3 4 5 6 7 8 9 10
Predicted Decision
Gro
up D
ecis
ion median
mean
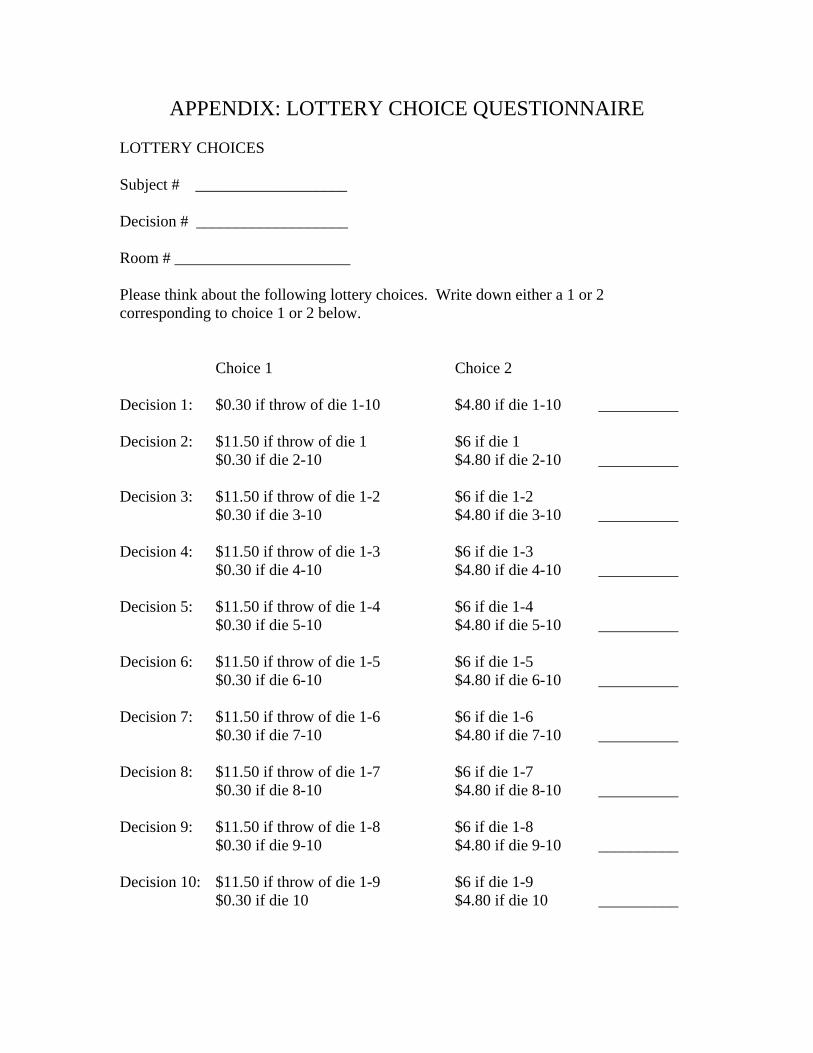
APPENDIX: LOTTERY CHOICE QUESTIONNAIRE LOTTERY CHOICES Subject # ___________________ Decision # ___________________ Room # ______________________ Please think about the following lottery choices. Write down either a 1 or 2 corresponding to choice 1 or 2 below. Choice 1 Choice 2 Decision 1: $0.30 if throw of die 1-10 $4.80 if die 1-10 __________ Decision 2: $11.50 if throw of die 1 $6 if die 1 $0.30 if die 2-10 $4.80 if die 2-10 __________ Decision 3: $11.50 if throw of die 1-2 $6 if die 1-2 $0.30 if die 3-10 $4.80 if die 3-10 __________ Decision 4: $11.50 if throw of die 1-3 $6 if die 1-3 $0.30 if die 4-10 $4.80 if die 4-10 __________ Decision 5: $11.50 if throw of die 1-4 $6 if die 1-4 $0.30 if die 5-10 $4.80 if die 5-10 __________ Decision 6: $11.50 if throw of die 1-5 $6 if die 1-5 $0.30 if die 6-10 $4.80 if die 6-10 __________ Decision 7: $11.50 if throw of die 1-6 $6 if die 1-6 $0.30 if die 7-10 $4.80 if die 7-10 __________ Decision 8: $11.50 if throw of die 1-7 $6 if die 1-7 $0.30 if die 8-10 $4.80 if die 8-10 __________ Decision 9: $11.50 if throw of die 1-8 $6 if die 1-8 $0.30 if die 9-10 $4.80 if die 9-10 __________ Decision 10: $11.50 if throw of die 1-9 $6 if die 1-9 $0.30 if die 10 $4.80 if die 10 __________

INSTRUCTIONS GIVEN TO PARTICIPANTS (For Deliberation Treatment)
The instructions which we have distributed to you are only for your private information. During the experiment, please do not communicate with any of the other participants. If you have any questions at any point during the experiment, raise your hand and the experimenter will help you. Also, please turn off all cell phones, mp3 players and other devices. If you violate this rule, we will need to exclude you from the experiment and you will forfeit payment from participating in the experiment. At the end of the session, we will only keep track of your ID number and your decisions for our research purposes. Objectives In this experiment we will ask you to make decisions that are simplified versions of decisions that you have to take in many real-world situations. Please think carefully about your decisions before making them, considering all possible choices! Procedure At the beginning of the experiment, we will randomly assign you to be either making decisions in isolation in the main computer lab, or making decisions in a small room with four other participants. You will draw a participant card with a number printed on it, which determines whether you stay in the main room or join one of the groups in the small rooms. If you join one of the small rooms, you will have to make both individual decisions in this experiment, and joint decisions with participants in the same room. We will ask you to make two types of decisions: participating in a gift-exchange situation, and making choices between lotteries. The gift-exchange situation There are two participants in this situation, a first proposer and a second proposer. Those of you who are randomly selected to stay in the main lab will always be first proposers, and those of you in the small rooms will always be in the role of second proposers. In the gift-exchange situation, both players will be given 10 tokens (the experiment money) as an endowment. The first proposer will begin by offering a split of the 10 tokens to the second proposer, from 0 to 10 such that if they offer the second proposer some amount X, the second proposer will receive 3X. The remaining 10-X tokens are kept by the first proposer (but they don’t get tripled). For instance, if the first proposer offers 5, (s)he will get to keep 5 for him(her)self and the second proposer will obtain 15. After seeing what the first proposer did, the second proposer offers a split of tokens from his(her) endowment. Again, if the second proposer offers some amount Y, the first proposer will receive 3Y (and the rest is kept by proposer 2, but it doesn’t get tripled). For example, suppose the first proposer offers 8 to the second proposer and the second proposer offers 7 to the first proposer. Then the first proposer receives: 2 (from first period) + 7 * 3 (from second period) = 23
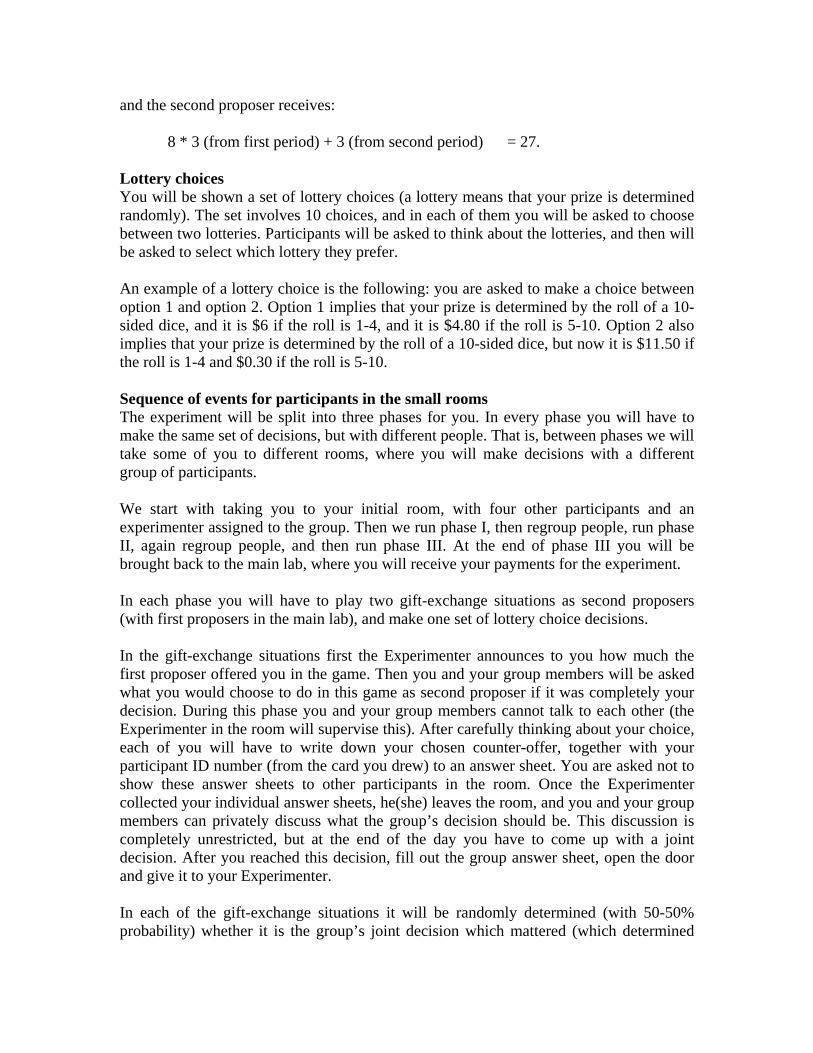
and the second proposer receives: 8 * 3 (from first period) + 3 (from second period) = 27. Lottery choices You will be shown a set of lottery choices (a lottery means that your prize is determined randomly). The set involves 10 choices, and in each of them you will be asked to choose between two lotteries. Participants will be asked to think about the lotteries, and then will be asked to select which lottery they prefer. An example of a lottery choice is the following: you are asked to make a choice between option 1 and option 2. Option 1 implies that your prize is determined by the roll of a 10-sided dice, and it is $6 if the roll is 1-4, and it is $4.80 if the roll is 5-10. Option 2 also implies that your prize is determined by the roll of a 10-sided dice, but now it is $11.50 if the roll is 1-4 and $0.30 if the roll is 5-10. Sequence of events for participants in the small rooms The experiment will be split into three phases for you. In every phase you will have to make the same set of decisions, but with different people. That is, between phases we will take some of you to different rooms, where you will make decisions with a different group of participants. We start with taking you to your initial room, with four other participants and an experimenter assigned to the group. Then we run phase I, then regroup people, run phase II, again regroup people, and then run phase III. At the end of phase III you will be brought back to the main lab, where you will receive your payments for the experiment. In each phase you will have to play two gift-exchange situations as second proposers (with first proposers in the main lab), and make one set of lottery choice decisions. In the gift-exchange situations first the Experimenter announces to you how much the first proposer offered you in the game. Then you and your group members will be asked what you would choose to do in this game as second proposer if it was completely your decision. During this phase you and your group members cannot talk to each other (the Experimenter in the room will supervise this). After carefully thinking about your choice, each of you will have to write down your chosen counter-offer, together with your participant ID number (from the card you drew) to an answer sheet. You are asked not to show these answer sheets to other participants in the room. Once the Experimenter collected your individual answer sheets, he(she) leaves the room, and you and your group members can privately discuss what the group’s decision should be. This discussion is completely unrestricted, but at the end of the day you have to come up with a joint decision. After you reached this decision, fill out the group answer sheet, open the door and give it to your Experimenter. In each of the gift-exchange situations it will be randomly determined (with 50-50% probability) whether it is the group’s joint decision which mattered (which determined

the counter-offer in the situation) or one of the individual decisions of the group members. In the latter case, it will be randomly determined which group member’s choice prevailed. We will only reveal you which decision mattered at the end of the experiment. The lottery choices again start with each of you in the group making your individual decisions. The Experimenter will be in the room during this time. Once you filled out your lottery choice answer sheet and wrote down your participant ID number on the sheet, the Experimenter collects the answer sheets and leaves the room. After this you can freely discuss it with your group members what the group’s decision should be in the lottery choices. At the end of the experiment, it will be randomly determined (with 50-50% probability) whether it is the group’s joint decision which mattered or one of the individual decisions of the group members. In the latter case, it will be randomly determined which group member’s choice prevailed. All in all you will play 6 rounds of gift-exchange situations as second proposers, and make three rounds of lottery choices. In each round of the gift-exchange situations the first offer comes from a different participant in the main room (no group will interact with the same first proposer more than once). Payoffs for participants in the small rooms Your payoff in this experiment will depend on your choices, as well as on choices of participants you interact with. Moreover, your choices affect the payoffs of the participants in your room, and the participants in the main room who you interact with in the gift-exchange situations. All rounds of the gift-exchange situations matter, but in each of them only one of the counter-offer decisions count: it can be either an individual decision (and with some probability your decision) or the group’s joint decision. In either case, the decision that becomes the second offer in the game determines everyone’s payoff in the room in that round. At the end of the experiment we will add up the tokens you collected in the gift-exchange situations, and convert it to dollars using a fixed exchange rate. As for lottery choices, you will fill out three sets of lottery choices, one in each of the phases. However, only one of these will matter: it will be randomly determined at the end of the experiment which phase. At the same time, it will also be randomly determined whether from this round it is the group’s joint decision that determines lottery payoffs in the group, or one of the individual decisions, and if the latter then which member’s decision in the group. From the selected answer sheet then we will randomly choose one of the lottery choices (out of the ten choices), see which lottery was selected on this sheet, and execute that lottery. This becomes everyone’s lottery payoff from the group. Lottery prizes are specified in (real) dollar terms. Note that every choice you make is relevant with some probability: it can become the actual choice that determines your payoff!

At the end of the experiment you will get a printout summarizing which decisions mattered and how your payoff was calculated. Participants in the main lab You will play six rounds of the gift-exchange situation, each time as first proposer. In every situation you will interact with a different group of participants in the small rooms. The counter-offers to your offers will only be revealed to you at the end of the experiment. After you made your first offer decisions, we will ask you to wait until the participants in the small room finished making all their decisions, since their decisions will determine your payoffs. Each gift-exchange situation that you participate in is relevant for your payment. The tokens that you collect from these situations will be converted using a fixed exchange rate to dollars. You will not be asked to make lottery choices in this experiment. Please wait patiently until all participants have finished reading these instructions.