growing climate change - epa archives | us epa · growing cooler: the evidence on ... new passenger...
TRANSCRIPT


Reid ewing Keith BaRtholomew Steve winKelman JeRRy walteRS don Chen
GrowinGCooler The evidence on Urban developmenT and climaTe changeReid ewing, Keith Bartholomew, Steve winkelman, Jerry walters, and don Chen
Addressing climate change has become a vital issue as businesses and government grapple with how to “go green.” Based on a comprehensive review of dozens of studies by leading urban planning researchers, this book illustrates how compact development can be a crucial strategy in combating greenhouse gas emissions from automobiles.
The authors make the case that one of the best ways to get people to drive less is to build pedestrian-friendly places with a mix of uses, where people can walk, bike, or take transit from their homes to offices, schools, restaurants, and shopping. Using facts, charts, and graphs, the authors demonstrate that many fewer miles will be traveled by car with compact development rather than with the current ubiquitous sprawl, which will result in a significant reduction in carbon emissions.
Understanding that citizens often oppose high-density development, the authors show how changing demographics, shrinking households, rising gas prices, and lengthening commutes are contributing to increased consumer demand for smaller homes and lots, townhouses, and condominiums near jobs and other activities. Recognizing that many government policies and regulations still encourage sprawling, auto-dependent development, the authors recommend that policy and program changes be implemented at the local, regional, state, and federal levels to make green, compact neighborhoods more available and more affordable.
GrowinG Cooler: The ev
idenCe on Urban dev
elopmenT a
nd ClimaTe Cha
nGe Ewin
g • Bartholom
Ew • w
inkElm
an
• wa
ltErs • ChEn
GrowinG CoolerThe evidence on Urban developmenT and climaTe change
Order #G15
I S B N 978-0-87420-082-9
9 7 8 0 8 7 4 2 0 0 8 2 9
9 0 0 0 0
C o o p e r a t i n g o r g a n i z a t i o n s
Related titles from the Urban land institute
Conservation Development InfoPacketCreating Value: Smart Development and Green DesignDeveloping Sustainable Planned CommunitiesEnergy and Real Estate InfoPacketGreen Commercial Buildings InfoPacketGreen Housing InfoPacketGreen Office Building: A Practical Guide to Development Green Retail InfoPacketThe Practice of Sustainable DevelopmentSustainable Development InfoPacket
GrowingCoolerHardCover.indd 1 3/7/08 2:35:35 PM

Contents
C h A p t e r 1
overview 1
C h A p t e r 2
emerging trends in Planning, development, and Climate Change 17
C h A p t e r 3
the vmt/Co2/Climate Connection 37
C h A p t e r 4
the Urban environment/vmt Connection 55
C h A p t e r 5
environmental determinism versus Self Selection 91
C h A p t e r 6
induced traffic and induced development 99
C h A p t e r 7
the Residential Sector 107
C h A p t e r 8
the Combined effect of Compact development, transportation investments, and Road Pricing 113
C h A p t e r 9
Policy and Program Recommendations 129
C h A p t e r 1 0
Conclusion 155
notes 157
references 159
related Uli publications 170

1
The phrase “you can’t get there from here” has a new application.
For climate stabilization, a commonly accepted target for the year 2050 would require
the United States to cut its carbon dioxide (CO2) emissions by 60 to 80 percent below
1990 levels. Carbon dioxide levels have been increasing rapidly since 1990, and
so would have to level off and decline even more rapidly to reach this target level by
2050. This publication demonstrates that the U.S. transportation sector cannot do
its fair share to meet this target through vehicle and fuel technology alone. We have
to find a way to sharply reduce the growth in vehicle miles driven across the nation’s
sprawling urban areas, reversing trends that go back decades.
This publication is based on an exhaustive review of existing research on the
relationship among urban development, travel, and the CO2 emitted by motor vehicles.
It provides evidence on and insights into how much CO2 savings can be expected with
compact development, how compact development is likely to be received by con-
sumers, and what policy changes will make compact development possible. Several
related issues are not fully examined in this publication. These include the energy
savings from more efficient building types, the value of preserved forests as carbon
sinks, and the effectiveness of pricing strategies—such as tolls, parking charges,
and mileage-based fees—when used in conjunction with compact development and
expanded transportation alternatives.
The term “compact development” does not imply high-rise or even uniformly high
density, but rather higher average “blended” densities. Compact development also fea-
tures a mix of land uses, development of strong population and employment centers,
interconnection of streets, and the design of structures and spaces at a human scale.
T h e B a s i c s
Scientific consensus now
exists that greenhouse gas
accumulations due to human
activities are contributing to
global warming with potentially
catastrophic consequences
(IPCC 2007). International
and domestic climate policy
discussions have gravitated
toward the goal of limiting the
temperature increase to 2°C to
3°C by cutting greenhouse gas
emissions by 60 to 80 percent
below 1990 levels. The primary
greenhouse gas is carbon
dioxide, and every gallon of
gasoline burned produces
about 20 pounds of CO2.
1Overview

2 Overview
Driving Up cO2 emissionsThe United States is the largest emitter worldwide of the greenhouse gases (GHGs)
that cause global warming. Transportation accounts for a full third of CO2 emissions
in the United States, and that share is growing, rising from 31 percent in 1990 to 33
percent today. It is hard to envision a “solution” to the global warming crisis that does
not involve slowing the growth of transportation CO2 emissions in the United States.
The Three-Legged Stool Needed to Reduce CO2 from Automobiles
Transportation CO2 reduction can be viewed as a three-legged stool, with one leg
related to vehicle fuel economy, a second to the carbon content of the fuel itself, and
a third to the amount of driving or vehicle miles traveled (VMT). Energy and climate
policy initiatives at the federal and state levels
have pinned their hopes on shoring up the first
two legs of the stool, through the development
of more efficient vehicles (such as hybrid cars)
and lower-carbon fuels (such as biodiesel fuel).
Yet a stool cannot stand on only two legs.
As the research compiled in this publica-
tion makes clear, technological improvements
in vehicles and fuels are likely to be offset by
continuing, robust growth in VMT. Since 1980,
the number of miles Americans drive has grown
three times faster than the U.S. population, and
almost twice as fast as vehicle registrations
(see Figure 1-1). Average automobile com-
mute times in metropolitan areas have risen
steadily over the decades, and many Americans
now spend more time commuting than they do
vacationing.
This raises some questions, which this report addresses. Why do we drive so
much? Why is the total distance we drive growing so rapidly? And what can be done to
alter this trend in a manner that is effective, fair, and economically benign?
The growth in driving is due in large part to urban development, or what some
refer to as the built environment. Americans drive so much because we have given our-
selves little alternative. For 60 years, we have built homes ever farther from workplaces,
located schools far from the neighborhoods they serve, and isolated other destina-
tions—such as shopping—from work and home. From World War II until very recently,
nearly all new development has been planned and built on the assumption that people
will use cars every time they travel. As a larger and larger share of our built environ-
ment has become automobile dependent, car trips and distances have increased,
and walking and public transit use have declined. Population growth has been respon-
Figure 1-1Growth of Population, Vehicle Registration, and VMT in the United states relative to 1980 Values
SOurCe: Federal Highway Administration (FHWA). “Vehicle registrations, Fuel Consumption, and Vehicle Miles of Travel as indices,” Highway Statistics 2005. Washington, D.C.: u.S. Department of Transportation, 2006, http://www.fhwa.dot.gov/policy/ohim/hs05/htm/mvfvm.htm.
2
1.5
1
0.5
0 1980 1985 1990 1995 2000 2005
2.5
Inde
x: 1
980=
1
VMTVehiclesPopulation

GrOwinG COOler: The evidenCe On Urban develOpmenT and ClimaTe ChanGe 3
sible for only a quarter of the increase in vehicle miles driven over the last couple of
decades. A larger share of the increase can be traced to the effects of a changing built
environment, namely to longer trips and people driving alone.
As with driving, land is being consumed for development at a rate almost three
times faster than population growth. This expansive development has caused CO2
emissions from cars to rise even as it has reduced the amount of forest land available
to absorb CO2.
How Growth in Driving Cancels Out Improved Vehicle Fuel Economy
Conventional pollutants can be reduced in automobile exhaust with sophisticated
emission control systems such as catalytic converters, on-board computers, and
oxygen sensors. In contrast, CO2 is a fundamental end product of burning fossil fuels;
there is no practical way to remove or capture it from moving vehicles. At this point
in time, the only way to reduce CO2 emissions from vehicles is to burn less gasoline
and diesel fuel.
An analysis by Steve Winkelman of the Center for Clean Air Policy, one of
the coauthors of this publication, finds that CO2 emissions will continue to rise,
despite technological advances, as the growth in driving is projected to overwhelm
planned improvements in vehicle efficiency and fuel carbon content from the Energy
Independence and Security Act of 2007 (U.S. Congress 2007). The act requires pas-
senger vehicle fuel economy improvements to at least 35 miles per gallon (mpg) for
new passenger vehicles by 2020, which would lead to a 34 percent increase in fleet-
wide fuel economy by 2030 (green line in Figure 1-2). The act also sets renewable
fuel requirements that Winkelman calculates would reduce lifecycle GHG emissions
by 10 percent by 2025 (purple line). Absent growth in driving, these measures would
reduce CO2 emissions from cars and light trucks by 23 percent below current levels.
Figure 1-2Projected Growth in cO2 emissions from cars and Light Trucks
SOurCe: S. Winkelman (Center for Clean Air Policy) calculations based on eiA’s Annual Energy Outlook 2008 (Early Release) and the energy independence and Security Act of 2007.
150
140
130
120
110
100
90
80
70
60
50
40 2005 2010 2015 2020 2025 2030
VMT
2020 New35 mpg
CO2
Fuel GHG: –10%
CO2 Target
CO2 Target
1990 CO2 Inde
x: 2
005=
100%

4 Overview
Even when these more stringent standards for vehicles and fuels fully penetrate
the market, however, transportation-related emissions still would far exceed target
levels for stabilizing the global climate. The U.S. Department of Energy’s Energy
Information Administration (EIA) forecasts a 48 percent increase in driving between
2005 and 2030 (orange line in Figure 1-2), outpacing the projected 23 percent
increase in population (EIA 2008).1 The rapid increase in driving would overwhelm
both the increase in vehicle fuel economy and the lower carbon fuel content required
by the Energy Independence and Security Act of 2007. Carbon dioxide emissions from
cars and light trucks would remain at 2005 levels (blue line), or 26 percent above
1990 levels (light blue line) in 2030. For climate stabilization, the United States must
bring the CO2 level to approximately 33 percent below 1990 levels by 2030 to be on
a path to a CO2 reduction of 60 to 80 percent by 2050 (red line).
As the projections show, the United States cannot achieve such large reductions
in transportation-related CO2 emissions without sharply reducing the growth in the
number of miles driven.
changing Development Patterns to slow Global Warming
Recognizing the unsustainable growth in driving, the American Association of State
Highway and Transportation Officials (AASHTO), representing state departments of
transportation, is urging that the growth of vehicle miles driven be cut in half. How
does a growing country—one with 300 million residents and another 120 million on
the way by mid-century—slow the growth of vehicle miles driven? Aggressive measures
certainly are available, including imposing ever stiffer fees and taxes on driving and
parking or establishing no-drive zones or days. Some countries are experimenting with
such measures. However, many in this country would view these measures as punitive,
given the reality that most Americans do not have a viable alternative to driving. The
body of research surveyed here shows that much of the rise in vehicle emissions can
be curbed simply by growing in a way that will make it easier for Americans to drive
less. In fact, the weight of the evidence shows that, with more compact development,
people drive 20 to 40 percent less, at minimal or reduced cost, while reaping other
fiscal and health benefits.
How Compact Development Helps Reduce the Need to Drive
Better community planning and more compact development help people live within
walking or bicycling distance of some of the destinations they need to get to every
day—work, shops, schools, and parks, as well as transit stops. If they choose to use a
car, trips are short. Rather than building single-use subdivisions or office parks, com-
munities can plan mixed-use developments that put housing within reach of these
other destinations. The street network can be designed to interconnect, rather than
end in culs-de-sac and funnel traffic onto overused arterial roads. Individual streets

GrOwinG COOler: The evidenCe On Urban develOpmenT and ClimaTe ChanGe 5
can be designed to be “complete,” with safe and convenient places to walk, bicycle,
and wait for the bus. Finally, by building more homes as condominiums, townhouses,
or detached houses on smaller lots, and by building offices, stores and other destina-
tions “up” rather than “out,” communities can shorten distances between destinations.
This makes neighborhood stores more economically viable, allows more frequent and
convenient transit service, and helps shorten car trips.
This type of development, which has seen a resurgence in recent years, goes by
many names, including “walkable communities,” “new urbanist neighborhoods,” and
“transit-oriented developments” (TODs). “Infill” and “brownfield” developments put
unused parcels in urban areas to new uses, taking advantage of existing infrastruc-
ture and nearby destinations. Some “lifestyle centers” are now replacing single-use
shopping malls with open-air shopping on connected streets with housing and office
space above stores. And many communities have rediscovered and revitalized their
traditional town centers and downtowns, often adding more housing to the mix. These
varied development types are collectively referred to in this publication as “compact
development” or “smart growth.”
How We Know That Compact Development Will Make a Difference: The Evidence
As these forms of development have become more common, planning researchers
and practitioners have documented the fact that residents of compact, mixed-use,
transit-served communities drive less than their counterparts in sprawling communi-
ties. Studies have looked at the issue from varying angles. They have:
Figure 1-3housing within One-Quarter Mile of commercial centers for contrasting Development Patterns in seattle
SOurCe: A.V. Moudon, P.M. Hess, M.C. Snyder, and K. Stanilov. “effects of Site Design on Pedestrian Travel in Mixed-use, Medium-Density environments.” Transportation Research Record. Vol. 1578, 1997, pp. 48–55.
6 Overview
n compared travel statistics for regions and neighborhoods of varying compact-
ness and auto orientation;n analyzed the travel behavior of individual households in various settings; andn simulated the effects on travel of different future development scenarios at the
regional and project scales.
Regardless of the approach, researchers have found significant potential for compact
development to reduce the miles that residents drive.
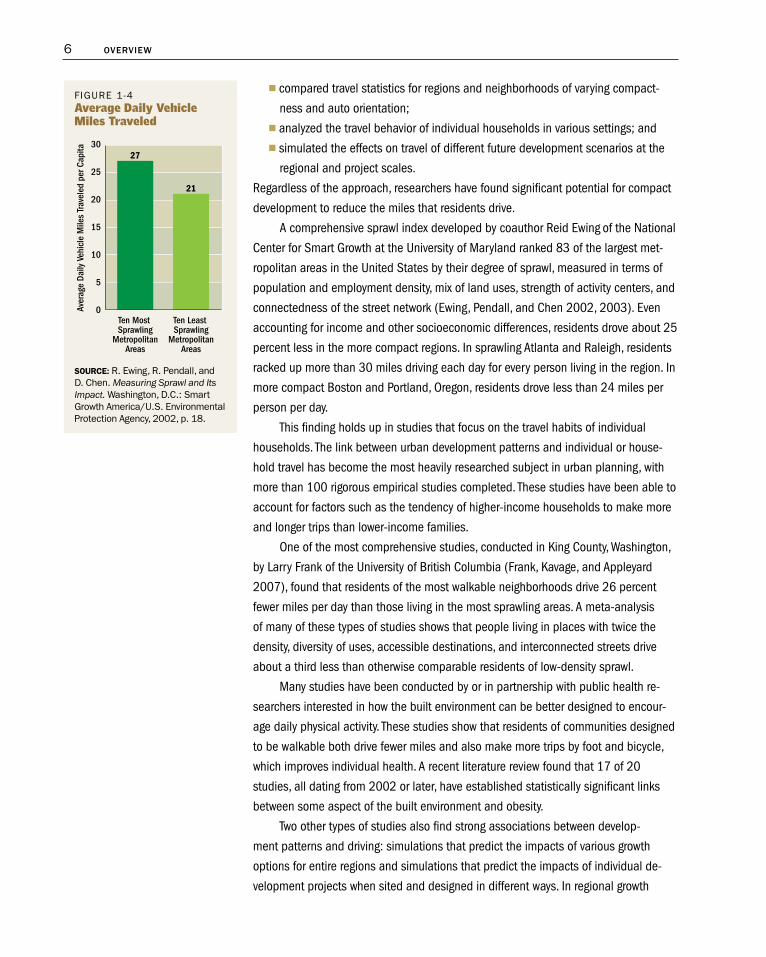
A comprehensive sprawl index developed by coauthor Reid Ewing of the National
Center for Smart Growth at the University of Maryland ranked 83 of the largest met-
ropolitan areas in the United States by their degree of sprawl, measured in terms of
population and employment density, mix of land uses, strength of activity centers, and
connectedness of the street network (Ewing, Pendall, and Chen 2002, 2003). Even
accounting for income and other socioeconomic differences, residents drove about 25
percent less in the more compact regions. In sprawling Atlanta and Raleigh, residents
racked up more than 30 miles driving each day for every person living in the region. In
more compact Boston and Portland, Oregon, residents drove less than 24 miles per
person per day.
This finding holds up in studies that focus on the travel habits of individual
households. The link between urban development patterns and individual or house-
hold travel has become the most heavily researched subject in urban planning, with
more than 100 rigorous empirical studies completed. These studies have been able to
account for factors such as the tendency of higher-income households to make more
and longer trips than lower-income families.
One of the most comprehensive studies, conducted in King County, Washington,
by Larry Frank of the University of British Columbia (Frank, Kavage, and Appleyard
2007), found that residents of the most walkable neighborhoods drive 26 percent
fewer miles per day than those living in the most sprawling areas. A meta-analysis
of many of these types of studies shows that people living in places with twice the
density, diversity of uses, accessible destinations, and interconnected streets drive
about a third less than otherwise comparable residents of low-density sprawl.
Many studies have been conducted by or in partnership with public health re-
searchers interested in how the built environment can be better designed to encour-
age daily physical activity. These studies show that residents of communities designed
to be walkable both drive fewer miles and also make more trips by foot and bicycle,
which improves individual health. A recent literature review found that 17 of 20
studies, all dating from 2002 or later, have established statistically significant links
between some aspect of the built environment and obesity.
Two other types of studies also find strong associations between develop-
ment patterns and driving: simulations that predict the impacts of various growth
options for entire regions and simulations that predict the impacts of individual de-
velopment projects when sited and designed in different ways. In regional growth
Figure 1-4average Daily Vehicle Miles Traveled
SOurCe: r. ewing, r. Pendall, and D. Chen. Measuring Sprawl and Its Impact. Washington, D.C.: Smart growth America/u.S. environmental Protection Agency, 2002, p. 18.
30
25
20
15
10
5
0Ten Least Sprawling
MetropolitanAreas
21
Ten Most Sprawling
MetropolitanAreas
27
Aver
age
Daily
Veh
icle
Mile
s Tr
avel
ed p
er C
apita

GrOwinG COOler: The evidenCe On Urban develOpmenT and ClimaTe ChanGe 7
simulations, planners compare the effect of a
metropolitan-wide business-as-usual scenario
with more compact growth options. Coauthor
Keith Bar thol omew of the University of Utah
analyzed 23 of these studies and found that
compact scenarios generate up to one-third
fewer miles driven than business-as-usual sce-
narios (Bartholomew 2005, 2007). The better-
performing scenarios are those with higher
degrees of land use mixing, infill development,
and population density, as well as a larger
amount of expected growth. Under a plausi-
ble set of assumptions, the reduction of miles
driven with compact development would be 18
percent by 2050. Even this may be on the low
side, since the travel models used in these stud-
ies only crudely account for travel within neigh-
borhoods and disregard walk and bike trips entirely.
Of the project-level studies, one of the best known evaluated the impact of
building a very dense, mixed-use development at an abandoned steel mill site in
the heart of Atlanta versus spreading the equivalent amount of commercial space
and number of housing units in the prevailing patterns at three suburban loca-
tions. Analysis using travel models enhanced by coauthor Jerry Walters of Fehr &
Peers Associates (Walters, Ewing, and Allen 2000), and supplemented by the U.S.
Environmental Protection Agency’s Smart Growth Index (to capture the effects of site
design) found that the infill location would generate about 36 percent less driving and
emissions than the outlying comparison sites. The results were so compelling that the
development was deemed a transportation control measure by the federal govern-
ment for the purpose of improving the region’s air quality.
The Atlantic Station project in Midtown Atlanta has become a highly successful
reuse of central city industrial land. An early evaluation of travel by residents and
employees of Atlantic Station suggests even larger VMT reductions than projected
originally. On average, Atlantic Station residents are estimated to generate eight VMT
per day, and employees to generate 11 VMT per day. These estimates compare favor-
ably with a regional average VMT of more than 32 miles per person per day, among
the highest in the nation.
The Potential of smart Growth
The potential of smart growth to curb the rise in GHG emissions will, of course, be
limited by the amount of new development and redevelopment that takes place over
Atlantic Station today.
JAC
ob
y D
eV
elo
PM
en
T C
oM
PA
ny

8 Overview
the next few decades, and by the share of it that is compact in nature. A great deal
of new building will take place as the U.S. population grows to 420 million in 2050.
According to the best available analysis, by Arthur “Chris” Nelson of Virginia Tech, 89
million new or replaced homes—and 190 billion square feet of new offices, institu-
tions, stores, and other nonresidential buildings—will be constructed through 2050. If
Nelson’s forecasts are correct, two-thirds of the development on the ground in 2050
will be built between 2007 and then. Pursuing smart growth is a low-cost climate
change strategy, because it involves shifting investments that have to be made anyway.
Smart Growth Meets Growing Market Demand for Choice
There is no doubt that moving away from a fossil fuel–based economy will require
many difficult changes. Fortunately, smart growth is a change that many Americans
will embrace. Americans are demanding more choices in where and how they live, and
changing demographics will accelerate this change in demand.
While prevailing zoning and development practices make sprawling development
easier to build, developers who make the effort to create compact communities are
encountering a responsive public. In 2003, for the first time in the country’s history,
the sales price per square foot for attached housing—that is, condominiums and
townhouses—was higher than that of detached housing. The real estate analysis firm
Robert Charles Lesser & Co. has conducted a dozen consumer preference surveys
in suburban and urban locations2 for a variety of builders to help them design their
projects. In every location examined, about one-third of respondents prefer smart
growth housing products and communities. Other studies by the National Association
of Homebuilders, the National Association of Realtors, the Fannie Mae Foundation,
W h a T s M a R T G R O W T h W O U L D L O O k L i k e
How would this shift to compact development change u.S. communities? Many more developments would look
like the transit-oriented developments and new urbanist neighborhoods already going up in almost every city in
the country, and these developments would fill in vacant lots, replace failing strip shop ping centers, and revital-
ize older town centers, rather than displacing forests or farmland. Most developments would no longer be single-
use subdivisions or office parks, but would mix shops, schools, and offices together with homes. They might
feature ground-floor stores and offices with living space above, or townhomes within walking distance of a retail
center. Most developments would be built to connect seamlessly with the external street network.
The density increases required to achieve the changes proposed in this publication would be moderate. In
2003, the average density of residential development in u.S. urban areas was about 7.6 units per acre. As a result
of shifting market demand, new developments between 2007 and 2025 would average 13 units per acre, and
the average density of metropolitan areas overall would rise to approximately nine units per acre.
Two recent publications—This is Smart Growth (Smart Growth Network 2006) and Visualizing Density
(Campoli and MacLean 2007)—provide a glimpse of what this future might look like.

GrOwinG COOler: The evidenCe On Urban develOpmenT and ClimaTe ChanGe 9
high-production builders, and university researchers have corroborated these results—
some estimating even greater demand for smart growth housing products. When smart
growth also offers shorter commutes, it appeals to another one-quarter of the market,
because many people are willing to trade lot or house size for shorter commutes.
Because the demand is greater than the current supply—according to a study
by Chris Leinberger of the Brookings Institution—the price-per-square-foot values of
houses in mixed-use neighborhoods show price premiums ranging from 40 to 100
percent, compared to houses in nearby single-use subdivisions.
This market demand is only
expected to grow over the next
several decades, as the share
of households made up of older
Americans rises with the aging of
the baby boomers. Through 2025,
households without children will
account for close to 90 percent of
new housing demand, and single-
person households will account
for one-third. Nelson projects that
the demand for attached and
small-lot housing will exceed the
current supply by 35 million units
(71 percent), while the demand for
large-lot housing actually will fall
short of the current supply.
Total estimated VMT Reduction and Total climate impact
When viewed in total, the evidence on land use and driving shows that compact devel-
opment will reduce the need to drive between 20 and 40 percent, as compared with
development at the outer suburban edge with isolated homes, workplaces, and other
destinations. So, as a rule of thumb, it is realistic to assume a 30 percent cut in VMT
with compact development.
Making reasonable assumptions about growth rates, the market share of com-
pact development, and the relationship between VMT and CO2, smart growth could,
by itself, reduce total transportation-related CO2 emissions from current trends by
7 to 10 percent in 2050. This reduction is achievable with land use changes alone.
It does not include additional reductions from complementary measures, such as
higher fuel prices and carbon taxes, peak-period road tolls, pay-as-you drive insur-
ance, paid parking, and other policies designed to make drivers pay more of the full
social costs of auto use.
Figure 1-52003 housing supply versus 2025 housing Demand
SOurCe: A.C. nelson. “leadership in a new era.” Journal of the American Planning Association. Vol. 72, issue 4, 2006, pp. 393–407.
60
50
40
30
20
10
0
–10Small Lot Large LotAttached
27,000
18,500
40,000
21,50017,000
44,000
56,000 55,000
–1,500
2003 Supply2025 Demand
Net New Units Needed
Hous
ing
Units
(in
1,00
0s)

10 Overview
This estimate also does not include the energy saved in buildings with compact
development, or the CO2-absorbing capacity of forests preserved by compact develop-
ment. Whatever the total savings, it is important to remember that land use changes
provide a permanent climate benefit that would compound over time. The second 50
years of smart growth would build on the base reduction from the first 50 years, and
so on into the future. More immediate strategies, such as gas tax increases, do not
have this degree of permanence.
The authors calculate that shifting 60 percent of new growth to compact patterns
would save 79 million metric tons of CO2 annually by 2030. The savings over that
period equate to a 28 percent increase in federal vehicle efficiency standards, gen-
erating one-half of the cumulative savings of the new 35 mpg CAFE standards. Every
resident of a compact neighborhood would provide the environmental benefit expected
from, say, driving one of today’s efficient hybrid cars. This effect would be compounded,
of course, if the resident also drove such an efficient car whenever he or she chose to
make a vehicle trip. Smart growth would become an important “third leg” in the trans-
portation sector’s fight against global warming, along with more efficient vehicles and
lower-carbon fuels.
a climate-sparing strategy with Multiple Payoffs
Addressing climate change through smart growth is an attractive strategy because, in
addition to being in line with market demand, compact development provides many
other benefits. Documented co-benefits include preservation of farmland and open
space, protection of water quantity and quality, improvement of health by providing
more opportunities for physical activity, and reduction of road and other infrastruc-
ture costs. For example, the Envision Utah scenario planning process resulted in a
compact growth plan that will save the region about $4.5 billion in infrastructure
spending, leave 171 square miles of additional open space, and reduce per capita
water use by more than 10 percent.
Among the co-benefits of compact development, perhaps the most important is
greater energy security. Compact development uses less energy per capita than does
sprawl. As the world approaches and then passes peak production of conventional oil,
in the face of ever-rising demands, Americans in compact urban areas will be better
able to weather the economic storm of rapidly rising gasoline prices. Moreover, to
the degree that the United States makes the transition to com pact development, the
country as a whole will be less dependent on regions of the world that are unstable,
hostile, and/or especially vulnerable to terrorist attacks.
Finally, unlike hydrogen and cellulosic ethanol, which get a lot of attention in the
climate change debate as substitutes for gasoline, the “technology” of compact, walk-
able communities exists today, as it has in one form or another for thousands of years.
We can begin using this technology in the service of a cooler planet right now.

GrOwinG COOler: The evidenCe On Urban develOpmenT and ClimaTe ChanGe 11
The combined effect of compact Development, Transportation investments, and Road Pricing
Accurately forecasting the implications of compact development for VMT requires an
understanding of the network of interactive effects of population growth, land use,
transportation investments, and road pricing on driving patterns. Analyses of historical
data make it clear that VMT responds to a variety of forces in a complex way. Growth
of metropolitan areas during the past 20 years has been characterized by an actual
decrease in population density, as urbanized areas have expanded faster than popu-
lation. This trend has started to reverse itself, but current conditions reflect the legacy
of this era of sprawl.
During this period, the emphasis in the majority of urbanized areas has been
on increasing highway capacity and the result has been a steady rise in VMT that has
exceeded population growth (see Figure 1-2). Increases in average income during this
period have contributed to substantially greater use of and reliance on personal vehi-
cles. Rising personal income, while positive in other respects, has worked to promote
sprawl, discourage mass transit ridership, and increase VMT.
During the decade from 1985 to 1995, decreases in inflation-corrected gas
prices appear to have contributed to increases in VMT. During the past ten-year period,
however, gas prices have increased as has traffic congestion, and both of these forces
have begun to create pressures to reduce VMT.
Nationally, mass transit has contributed relatively little thus far to reducing reli-
ance on personal vehicle use in the majority of urbanized areas. Increasingly, cities are
attempting to build more mass transit capacity, and it is clear that such a development
could act to reduce VMT if the right set of associated circumstances prevails. Internal
Figure 1-6World Oil Production in the Best and Worst cases*
SOurCe: energy Watch group. Crude Oil: The Supply Outlook. ottobrunn, germany: October 2007, http://www.energywatchgroup.org/fileadmin/global/pdf/EWG_Oilreport_10-2007.pdf.
* The international energy Agency’s optimistic forecast in World Energy Outlook (ieA 2007) shows worldwide oil production continuing to rise (the Weo line on top), while the sobering assessment of the energy Watch group in Crude Oil: The Supply Outlook suggests that oil produc-tion already has peaked (the curve on the bottom). Most forecasts lie between these two extremes, with the peak production of conventional oil occurring between now and 2020 (Hirsch et al. 2005). While oil substitutes such as liquified coal, oil shale, and tar sands will fill some of the gap, they are more expensive than conventional oil and worse from the standpoint of global warming potential.
1935 1965 1995 2025
WEO2006
120
100
80
60
40
20
0
WEO2006Middle East
AfricaLatin America
South AsiaEast Asia
ChinaTransition Economies
OECD PacificOECD Europe
OECD North America
Oil P
rodu
ctio
n (m
illio
ns o
f bar
rels
/day
)

12 Overview
forces such as further increases in traffic congestion and delays, along with sustained
elevated fuel prices, can be expected to automatically produce reductions in VMT as
they affect personal decisions. A deliberate strategy of compact development and
smart growth has the potential to reverse historic trends to an even greater degree.
In Chapter 8, we mathematically model the interactions described above using
a statistical technique called structural equation modeling (SEM) and relying on his-
torical data for 84 urbanized areas. Two models were estimated with our combined
dataset: a cross-sectional model for 2005 and a longitudinal model for the two
ten-year periods between 1985 and 2005. The cross-sectional model was used to
capture long-term relationships between transportation and land use. Each urbanized
area has had decades to arrive at quasi equilibrium among density, road capacity,
transit capacity, and VMT. However, there is not enough spatial variation in fuel prices
across the United States to detect effects on VMT in a cross-sectional sample. So a
longitudinal analysis was required to capture short- and medium-term responses to
fuel price fluctuations.
Together, the cross-sectional and longitudinal models give us a sound basis
for deducing the elasticities of urban VMT with respect to different urban variables.
An elasticity is the percentage change in one variable, such as VMT, with respect to
a 1 percent change in another variable, such as density or average gasoline price.
Using reasonable assumptions about future density, average gasoline price, and other
variables, we project that under a trend scenario, urban VMT in the United States will
experience a rise of 48 percent by 2030 and 102 percent by 2050, leaving the nation
far off a climate-stabilizing CO2 path. In contrast, under a low-carbon scenario of higher
densities, higher gasoline prices, less highway expansion, and more transit service, the
nation can come close to a climate-stabilizing CO2 path by 2030 (see Figure 1-7).
Policy and Program Recommendations
Intentionally or not, many current public policies increase sprawl, auto dependence and,
hence, GHG emissions. Many local zoning codes require low-density, single-use devel-
Figure 1-7Urban VMT Reduction under a Low-carbon scenario (2030)
Elasticities of VMT with Respect to Policy Variables
Change in Annual Growth Rates of Policy Variables
(Percent above/below Trend)
Effect on Annual VMT Growth Rate
(Percent below Trend)
Population density –0.30 1 –7.7
Highway lane miles 0.55 –1 –11.4
Transit revenue miles –0.06 2.5 –4.6
Real fuel price –0.17 2.7 –14.4
Total effect NA NA –38.1

GrOwinG COOler: The evidenCe On Urban develOpmenT and ClimaTe ChanGe 13
opment. Public spending frequently supports development at the urban fringe rather
than in already developed areas. Transportation policies remain focused on accom-
modating the automobile. Implementing an effective smart growth strategy for climate
stabilization will require reorienting these and many other policies and programs.
Here, we summarize key policy initiatives at each level of government that could
form the basis for this policy transformation. The specifics of these initiatives can be
found in Chapter 9.
Federal Actions
enact a “Green-TeA” Transportation Act. Beginning in 1991 with the Inter-
modal Surface Transportation Efficiency Act (known as ISTEA), federal surface
transportation acts have put increasing emphasis on alternatives to the automo-
bile, as well as on community involvement, environmental goals, and coordinated
planning. The next surface transportation bill, scheduled for adoption in 2009,
could bring yet another paradigm shift by emphasizing environmental performance,
climate protection, and green development. We refer to this proposed new legisla-
tion as “Green-TEA.”
The key feature of Green-TEA would be a requirement that states and metro-
politan areas achieve articulated national goals when spending federal transportation
funds. These goals would include GHG emission reductions necessary for eventual
climate stabilization, “fix-it-first” prioritization for transit and highway rehabilitation
and maintenance, and “complete streets” that provide for all transportation modes.
Other Green-TEA provisions would:n create state and metropolitan funding formulas with incentives for reducing
transportation demand instead of rewarding increased driving, as current
legislation does;n eliminate funding and procedural inequities between highway and transit
projects;n give deteriorating roads, bridges, and transit systems priority in funding, lim-
iting highway expansion until existing facilities are brought up to reasonable
standards;n require any subsequent highway expansions to meet economic, transportation,
and climate performance standards;n provide direct project funding for metropolitan planning organizations (MPOs)
instead of routing federal funds through state departments of transportation;n provide technical assistance to MPOs and state and local governments,
including improved data, models, and scenario planning tools to help in devel-
oping and implementing smart growth solutions; andn establish a new National Transportation System Administration to oversee a
national high-speed rail network and integrate that network with the nation’s
aviation system.

14 Overview
extend Transportation Conformity requirements to GHGs. In Massachusetts
v. EPA, the U.S. Supreme Court affirmed the EPA’s authority and duty to regulate GHG
emissions under the current federal Clean Air Act. The EPA could meet its obligation
by adopting national GHG reduction targets, requiring states to develop state imple-
mentation plans for meeting these targets, and mandating that state and metropolitan
transportation plans and programs conform to state implementation plans.
use Cap and Trade to Support Smart Growth. Many Congressional proposals for
climate stabilization would authorize a national cap-and-trade market system similar
to those in use in Europe and under development in several states. The revenues
generated from auctioning allowances under these systems could be used to support
smart growth. Uses of funds might include providing technical assistance to MPOs and
state and local governments, including improved data, models, and scenario planning
tools; a “Smart Location Tax Credit” targeted at compact development; and support
for travel alternatives such as transit, bicycling, and pedestrian infrastructure that
are important complements to compact development. Although land development is
unlikely to become a regulated activity (like electrical power generation) under cap-
and-trade systems, it may have a role to play in “offset” markets. It could be included
as an allowable offset in any cap-and-trade climate legislation.
State Actions
Adopt and Suballocate VMT reduction Targets. In the absence of federal
leadership, many states have adopted goals for GHG reduction. These goals could
be translated into VMT reduction targets. The targets could be proportionally allo-
cated to metropolitan regions within a state, and each MPO could be charged with
developing a plan for meeting its respective target. VMT targets could even be sub-
allocated to localities.
Align State Spending with Climate and Smart Growth Goals. After adopting
targets, states will want to ensure that funding programs—whether carried out directly
by the state or executed through grants to local governments—support such targets.
States can begin by analyzing the criteria used to distribute all state and federal funds
in housing, economic development, water and sewer infrastructure, schools, transpor-
tation, and recreation. States could earmark and distribute at least a portion of these
funds according to local performance in meeting GHG and VMT reduction targets.
Adopt a Statewide “Complete Streets” Policy and Funding Program.
A complete streets policy would require that pedestrian and bicycle facilities be
provided on all new and reconstructed streets and highways, and that pedestrian
and bicyclists’ needs be considered in routine roadway operation and mainte-
nance. To create complete communities, the policy might mandate that new streets

GrOwinG COOler: The evidenCe On Urban develOpmenT and ClimaTe ChanGe 15
be interconnected and culs-de-sac be discouraged so that travel distances for
pedestrians and bicyclists are minimized.
Regional Actions
Give Funding Priority to Compact, Transit-Served Areas. By giving funding
priority to compact, transit-served areas, MPOs can help reduce GHG emissions. In
concert with local governments, MPOs would designate “priority funding areas” where
local governments have planned for compact development. In addition to receiving
priority for public funds, areas could qualify for streamlined development approvals
and other financial incentives.
establish a regional Transfer of Development rights Program. Transfer of
development rights (TDR) programs enable landowners to sell their development rights
to other landowners through a market-based system. Effectively crafted, TDR programs
can help reduce VMT by directing growth to compact, transit-served areas and away
from low-density greenfield sites, thus reducing the need for long-distance travel.
While TDR programs typically have been administered by local governments, a regional
TDR program likely would encompass more rural and urban areas, thereby providing
greater market opportunities for TDR transfers.
Create a Carbon Impact Fee for New Development. Suburban and exurban
development has a cost advantage over urban infill development because of low land
costs and subsidized infrastructure. Regulatory reforms alone cannot overcome this
advantage. For decades, governments have charged impact fees on new development
to offset the costs of schools, libraries, sewers, parks, and transportation. Creating and
implementing a regional CO2 emissions impact fee would internalize carbon impacts
into development costs, thereby rewarding best development practices and raising
the price of carbon-inefficient development. Fee revenues could be used to help fund
transit, bicycling facilities, sidewalks and other pedestrian amenities, and similar proj-
ects in compact areas.
Local Actions
Change the Development rules. Local regulations often prohibit the type of
climate-friendly, compact development discussed in this book. Outdated land de-
velop ment codes—often from the 1970s or earlier—effectively mandate sprawl by re-
stricting the mix of land uses and requiring large amounts of parking as well as large
minimum building setbacks. Many localities have tried to address these issues on a
development-by-development basis, granting exceptions to the rules through arduous
review and approval processes. Instead, a better approach would be to amend local
policies and regulations—including general plans, zoning and subdivision ordinances,
parking standards, annexation rules, adequate public facilities requirements, and

16 Overview
design guidelines—to facilitate smart growth through normal approval processes.
They also should consider ways that permitting processes might be accelerated for
compact development projects that meet specified standards.
Channel Growth into Compact Development Areas. With surprising regularity,
MPOs and localities have settled on a common approach to VMT reduction— channeling
growth into dense, walkable areas that can be efficiently served by transit, and giving
these areas priority for infrastructure funding. This is the idea behind “smart growth
areas” in the San Diego region, “urban development areas” in Virginia, and “metro-
politan activity centers” in Orlando. Public infrastructure, amenities, and good urban
design will guarantee that such areas are attractive places to live, work, and shop.
Provide for Workforce Housing near Jobs. In most metropolitan areas, the cost of
housing declines with distance from job centers and other desired destinations, while
the cost of transportation increases. With gasoline costs rising, the financial tradeoff
between a longer commute and less-expensive housing is changing, and the potential
savings from living in a convenient location with transportation choices is becoming a
more important aspect of affordability. Local governments could make the provision of
affordable “workforce” housing a condition of approval for large-scale residential and
commercial developments. In addition, localities could give priority to transit acces-
sibility when allocating housing assistance funds.
The Organization of this Book
Chapter by chapter, this book addresses the impacts of the following: nemerging market and policy trends on urban development;nvehicular travel on GHG emissions;nurban development on vehicular travel;n residential preferences on urban development and travel;nhighway building on urban development and travel;nurban development on residential energy use; n the combination of urban development, transit enhancements, and roadway
pricing on vehicular travel; and, finallynpolicy options to encourage compact development and reduce vehicular travel.