growth and prosperity: the roanoke region, virginia… · growth and prosperity: the roanoke...
TRANSCRIPT

Growth and Prosperity: The
Roanoke Region, Virginia, and
Beyond
Terry Rephann
Roanoke Regional Chamber of Commerce Meeting
Roanoke, Virginia
June 2, 2011

Presentation Outline
A Brief Overview of the National/International Economy
State and Regional Economic Resiliency in the Current
Business Cycle
Housing
Retail Trade
Employment
Income
Long-term Regional Economic Trends
The Income and Demographic Nexus
The Good News

A Brief History of the 2006-2011 Business
Cycle Monetary tightening
Energy price spike I
Fiscal stimulus I
Housing bubble burst and steep housing price decline
Financial crisis
TARP and quantitative easing I
Fiscal stimulus II (the Big One)
Quantitative easing II (QE2)
Currency depreciation and emerging market growth
Fiscal stimulus III
Japanese earthquake and disrupted supply chains
Middle East volatility and energy spike 2
Eurozone crisis
Debt ceiling concerns and fiscal de-stimulus (reductions in short-term government spending)
Double dip in housing prices
New asset bubbles (e.g., social networking stock bubble, farmland, natural resources)
Slowing growth in some emerging markets
Removal of quantitative easing
Ending of fiscal stimulus
Reluctant consumers (who are still deleveraging) and reluctant businesses (with cash stockpiles)

Economist Forecasts and Reality
-8
-6
-4
-2
0
2
4
6
8
% G
DP
Ch
an
ge
Actual GDP
Source: Bureau of Economic Analysis

Economist Forecasts and Reality
-8
-6
-4
-2
0
2
4
6
8
% G
DP
Ch
an
ge
Actual GDP
9 months
Source: Bureau of Economic Analysis and Wall Street Journal Survey of Economists

Economist Forecasts and Reality: Take 2
-8
-6
-4
-2
0
2
4
6
8
% G
DP
Ch
an
ge
Actual GDP
9 months
6 months
Source: Bureau of Economic Analysis and Wall Street Journal Survey of Economists

Economist Forecasts and Reality: Take 3
-8
-6
-4
-2
0
2
4
6
8
% G
DP
Ch
an
ge
Actual GDP
9 months
6 months
3 months
Source: Bureau of Economic Analysis and Wall Street Journal Survey of Economists

Economist Forecasts and Reality: Take 4
-8
-6
-4
-2
0
2
4
6
8
% G
DP
Ch
an
ge
Actual GDP
9 months
6 months
3 months
<1 month
Source: Bureau of Economic Analysis and Wall Street Journal Survey of Economists

Annual GDP Growth
-5
-4
-3
-2
-1
0
1
2
3
4
5
6
2002 2003 2004 2005 2006 2007 2008 2009
% G
DP
Ch
an
ge
Roanoke MSA
Virginia
United States
. . . but output fall was deeper.
Source: Bureau of Economic Analysis
Roanoke MSA slower to enter recession . . .

Roanoke MSA Employment Growth, 1969-2009
Source: Bureau of Economic Analysis
Roanoke MSA employment shrinkage worse than U.S., VA % change
-6
-4
-2
0
2
4
6
8
1970
1972
1974
1976
1978
1980
1982
1984
1986
1988
1990
1992
1994
1996
1998
2000
2002
2004
2006
2008
United States
Virginia
Roanoke MSA

The Short Term

Housing Permits, 6 Month Moving
Average % of 2000 Census housing units
. . . .
Source: U.S. Census Bureau
0
0.02
0.04
0.06
0.08
0.1
0.12
0.14
0.16
Jun-2
004
Jun-2
005
Jun-2
006
Jun-2
007
Jun-2
008
Jun-2
009
Jun-2
010
United States
Virginia
Roanoke MSA
Housing construction less active

Housing Price Changes
Source: Federal Housing Finance Agency
% change
-10
-5
0
5
10
15
United States
Virginia
Roanoke MSA
Housing prices continue to decline

Retail Sales: Local Option Sales Tax
-15
-10
-5
0
5
10
15
Jun-0
0
Jun-0
1
Jun-0
2
Jun-0
3
Jun-0
4
Jun-0
5
Jun-0
6
Jun-0
7
Jun-0
8
Jun-0
9
Jun-1
0
% 1
2 m
on
th c
han
ge
Virginia
Roanoke
Source: Virginia Department of Taxation
Retail sales rebound.

Employment Growth
Source: Bureau of Labor Statistics, Current Employment Statistics (last point April 2011)
% Roanoke employment rebound has not materialized quite yet.
-5
-4
-3
-2
-1
0
1
2
3
4
1991 1993 1995 1997 1999 2001 2003 2005 2007 2009 2011
United States
Virginia
Roanoke MSA

Unemployment Rate Graph
Source: Bureau of Labor Statistics (last point in April 2011)
% Roanoke MSA unemployment rate spread with Virginia has grown in recovery.
0
2
4
6
8
10
12
19901992199419961998200020022004200620082010
United States
Virginia
Roanoke MSA

Initial Unemployment Claims, 6 Month
Moving Average
0
500
1,000
1,500
2,000
2,500
Aug-07 Aug-08 Aug-09 Aug-10
Initial claims remain high
Source: Virginia Employment Commission
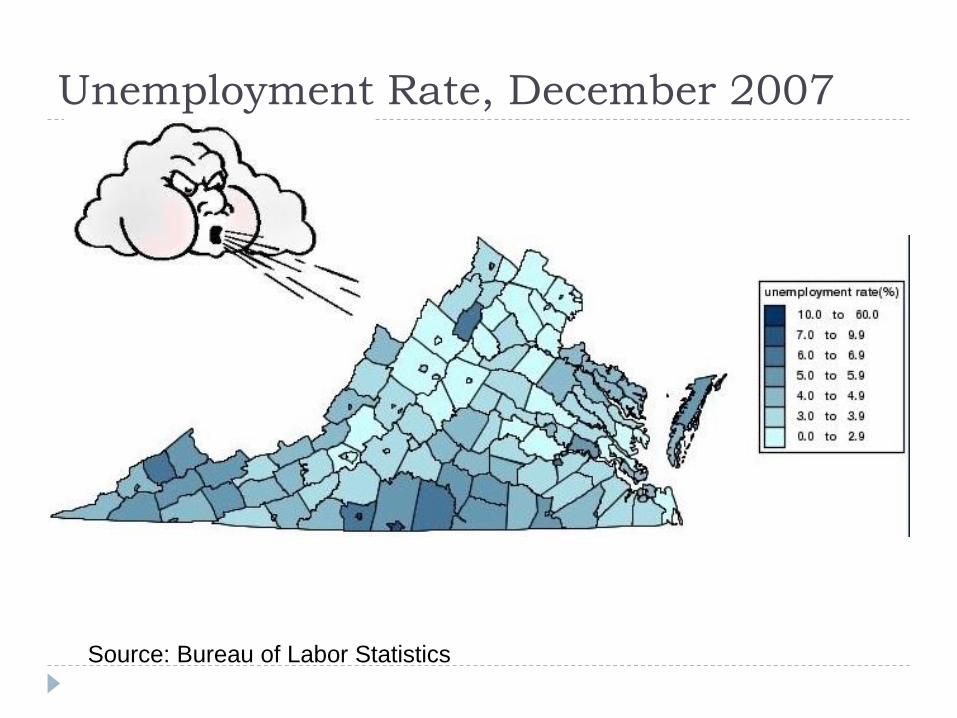
Unemployment Rate, December 2007
Source: Bureau of Labor Statistics

Unemployment, December 2007-March
2011

Unemployment Rate, March 2011
Source: Bureau of Labor Statistics

The Long Term

The Recent View: Roanoke MSA Per Capita
Income as Percentage of U.S
84
86
88
90
92
94
96
98
1969
1971
1973
1975
1977
1979
1981
1983
1985
1987
1989
1991
1993
1995
1997
1999
2001
2003
2005
2007
2009
Source: Bureau of Economic Analysis
Roanoke per capita income is converging on U.S. average

Population Growth, 1970-2009
-1
-0.5
0
0.5
1
1.5
2
2.5
3
3.5
1970
1973
1976
1979
1982
1985
1988
1991
1994
1997
2000
2003
2006
2009
% C
han
ge
United States
Virginia
Roanoke MSA
Source: Bureau of Economic Analysis
Slower growing population

Transfer Payments as Percentage of
Total Personal Income
0
5
10
15
20
25
1969
1972
1975
1978
1981
1984
1987
1990
1993
1996
1999
2002
2005
2008
% o
f To
tal
United States
Virginia
Roanoke MSA
Source: Bureau of Economic Analysis
Greater increase in transfer payments

Government Transfer Receipts Per
Capita by Category
0
1,000
2,000
3,000
4,000
5,000
6,000
7,000
8,000
1969
1972
1975
1978
1981
1984
1987
1990
1993
1996
1999
2002
2005
2008
$ p
er
cap
ita
Other transfers
Education
Veterans
Unemployment insurance
compensation
Income maintenance
Medical
Retirement and disability
Source: Bureau of Economic Analysis
Growth in medical payments is accelerating

Roanoke MSA, Aging, 2000 and 2010
0
1
2
3
4
5
6
7
8
9<
5
5-9
10-1
4
15-1
9
20-2
4
25-2
9
30-3
4
35-3
9
40-4
4
45-4
9
50-5
4
55-5
9
60-6
4
65-6
9
70-7
4
75-7
9
80-8
4
85+
% o
f to
tal p
op
ula
tio
n
2000
2010
Source: U.S. Census Bureau
Fewer younger adults . . . more middle aged.

Aging, Roanoke MSA versus Virginia, 2010
0
1
2
3
4
5
6
7
8
9<
5
5-9
10-1
4
15-1
9
20-2
4
25-2
9
30-3
4
35-3
9
40-4
4
45-4
9
50-5
4
55-5
9
60-6
4
65-6
9
70-7
4
75-7
9
80-8
4
85+
% o
f to
tal p
op
ula
tio
n
Roanoke MSA
Virginia
Source: U.S. Census Bureau
Fewer younger adults . . . more middle aged and seniors.

Virginia, Percentage 65 Years and Older
0
2
4
6
8
10
12
14
16
18
20
1980 1990 2000 2008 2010 2020 2030
The Baby Boomers are approaching the hill.
Roanoke MSA is already here (16.3%).
Source: U.S. Census Bureau

1980
Source: U.S. Census Bureau

1990
Source: U.S. Census Bureau

2000
Source: U.S. Census Bureau

2008
Source: U.S. Census Bureau

2010
Source: U.S. Census Bureau

2020
Source: Virginia Employment Commission

2030
Source: Virginia Employment Commission

Income Patterns
Source: Bureau of Labor Statistics,
Consumer Expenditure Survey,
2008
Household Income varies
over the life cycle
Composition changes
from earnings to pension,
social security, and
dividends, interest, and
rent income
The latter categories are
more stable than the
former $0
$10,000
$20,000
$30,000
$40,000
$50,000
$60,000
$70,000
$80,000
$90,000

Consumption Patterns per Household
Member ($)
Item <25 25-34 35-44 45-54 55-64 65-74 75+
Food 2,224 2,225 2,378 2,850 3,027 2,966 2,623
Maintena
nce
92 237 272 547 709 908 1,086
Utilities 938 1,126 1,252 1,573 1,892 1,966 2,045
Apparel 676 702 677 825 772 767 503
Transpor
tation
2,732 3,107 2,969 3,970 4,465 3,744 2,928
Healthca
re
341 620 757 1,085 1,821 2,655 2,942
Entertain
ment
804 988 1,092 1,221 1,446 1,343 899
Source: Bureau of Labor Statistics, Consumer Expenditure Survey, 2008

Annual Public Health Expenditures Age Group Medicare Medicaid Other Public Total Public
0-18 $2 $819 $271 $1,092
19-44 $87 $662 $351 $1,100
45-54 $310 $737 $403 $1,451
55-64 $706 $1,026 $683 $2,415
65-74 $5,242 $1,112 $573 $6,927
75-84 $8,675 $2,058 $590 $11,323
85+ $10,993 $5,424 $590 $17,387
Source: Center for Medicare and Medicaid Services

Consumption Patterns
Seniors consume a different bundle of goods and services
Seniors consume more health care, more housing operations and maintenance, and less of almost everything else
Seniors attract a large amount of health expenditures when Medicare kicks in.

Roanoke MSA’s Largest Sectors
0
5,000
10,000
15,000
20,000
25,000
30,000
Em
plo
ym
en
t
Retail Trade
Health Care and Social
Assistance
Source: Virginia Employment Commission

The Good News

The Long View: Roanoke MSA Per Capita
Income as Percentage of U.S.
50
55
60
65
70
75
80
85
90
95
100
1929
1932
1935
1938
1941
1944
1947
1950
1953
1956
1959
1962
1965
1968
1971
1974
1977
1980
1983
1986
1989
1992
1995
1998
2001
2004
2007
96.7%
Source: Bureau of Economic Analysis
68.3%
You’ve come a long way.

Per Capita Income, 2009
$38,322
$44,057
$39,635
$35,000
$36,000
$37,000
$38,000
$39,000
$40,000
$41,000
$42,000
$43,000
$44,000
$45,000
Roanoke MSA Virginia United States
Source: Bureau of Economic Analysis
Roanoke MSA lags by a conventional measure.
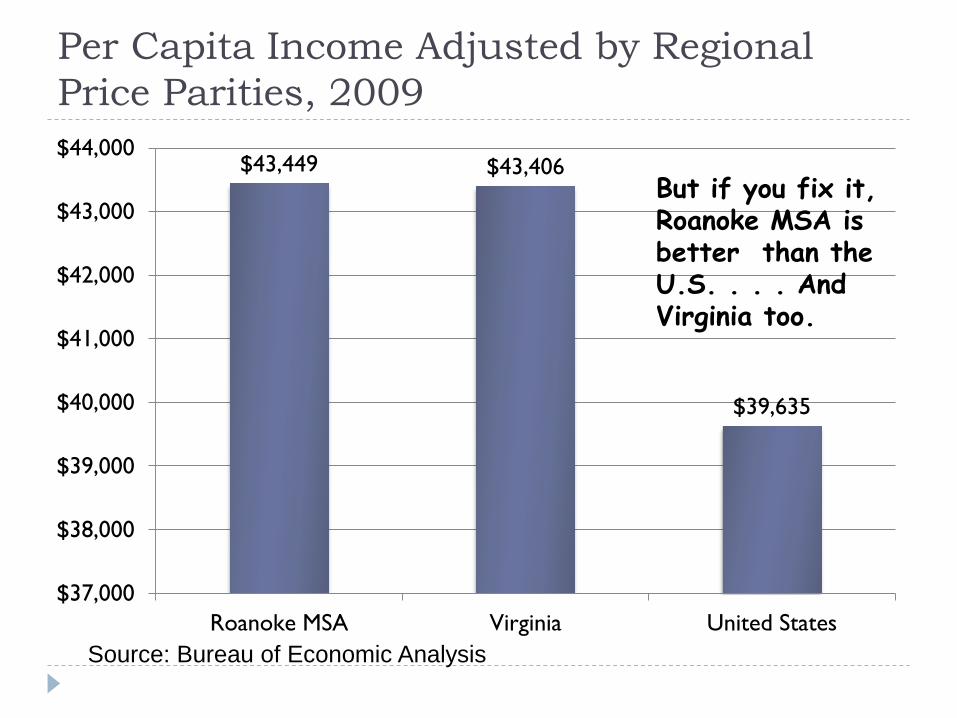
Per Capita Income Adjusted by Regional
Price Parities, 2009
$43,449 $43,406
$39,635
$37,000
$38,000
$39,000
$40,000
$41,000
$42,000
$43,000
$44,000
Roanoke MSA Virginia United States
Source: Bureau of Economic Analysis
But if you fix it, Roanoke MSA is better than the U.S. . . . And Virginia too.
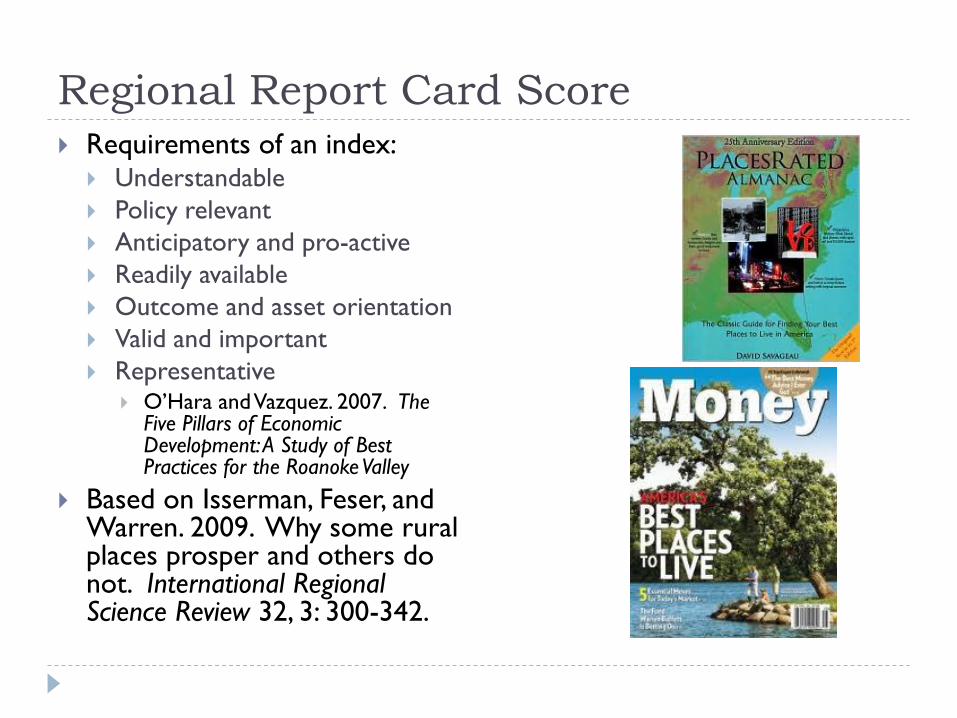
Regional Report Card Score Requirements of an index:
Understandable
Policy relevant
Anticipatory and pro-active
Readily available
Outcome and asset orientation
Valid and important
Representative O’Hara and Vazquez. 2007. The
Five Pillars of Economic Development: A Study of Best Practices for the Roanoke Valley
Based on Isserman, Feser, and Warren. 2009. Why some rural places prosper and others do not. International Regional Science Review 32, 3: 300-342.

The Fantastic Four Four Indicators
Poverty Rate
Unemployment Rate
Dropout rate (# of 16-19 year olds who are not enrolled in school and not high school graduates)
Housing problems rate. Percentage of households having one or more of following: (1) lacking complete plumbing facilities, (2) lacking complete kitchen facilities, (3) having more than 1 occupants per room, and (4) monthly owner costs 30% or more of household income.
To qualify as a prosperous place, you must do better than the nation on all four criteria

U.S. Prosperity, 2000
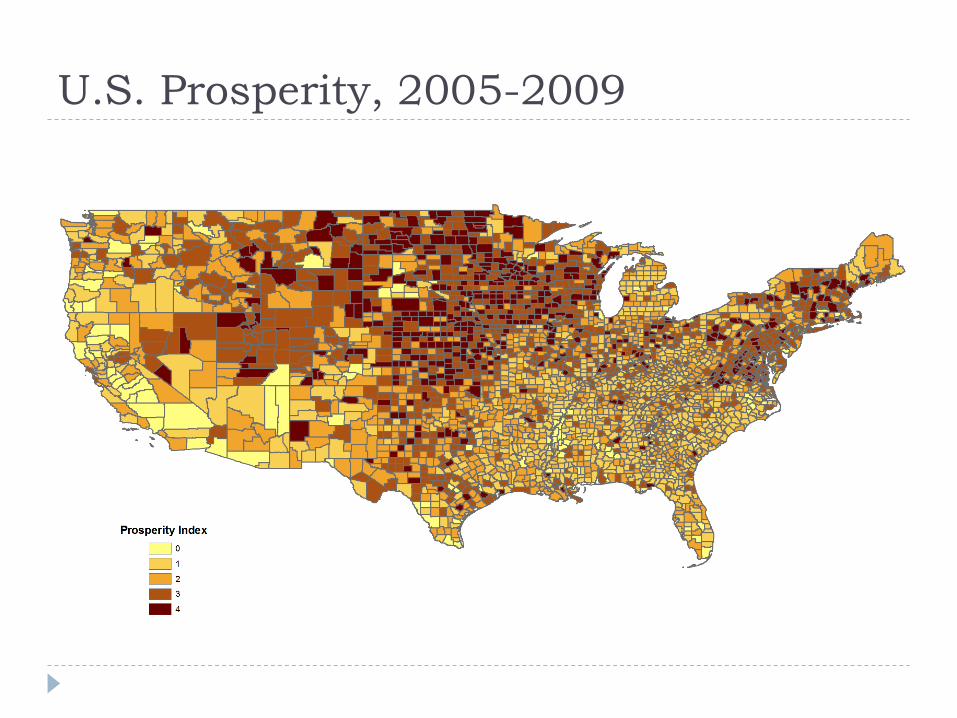
U.S. Prosperity, 2005-2009

Virginia Prosperity, 2000

Virginia Prosperity, 2005-2009
Roanoke MSA ranks 26th (out of 366) metro areas in the nation.

Why?
It’s not: . . . rapid growth
. . . location and accessibility
. . . industrial clusters
. . . amenities or cultural diversity
It is: . . . a more stable population
. . . a robust private sector
. . . a more educated population
. . . industrial diversity
. . . strong social fabric (civic and religious engagement)
It’s hip to be square

Finale
Roanoke MSA lags on some indicators exiting the recession (it also lagged on entering the recession)
The Roanoke MSA’s long-term development is being inexorably shaped by demographics in many ways
The Roanoke MSA has come far and ranks very favorably vis-á-vis the state and far ahead of the nation on key development indicators