growth, poverty and agriculture in africa: linkages and policy
DESCRIPTION
Growth, Poverty and Agriculture in Africa: Linkages and Policy. Joachim von Braun Director General International Food Policy Research Institute Accra, Nov. 2007. IFPRI’s Strategic Framework. Research. Partners, stakeholders, donors, IFPRI Board and Staff. Influence on policies - PowerPoint PPT PresentationTRANSCRIPT
Growth, Poverty and Agriculture Growth, Poverty and Agriculture in Africa: Linkages and Policyin Africa: Linkages and Policy
Joachim von BraunJoachim von BraunDirector GeneralDirector General
International Food Policy Research InstituteInternational Food Policy Research Institute
Accra, Nov. 2007Accra, Nov. 2007

Influence on policies
Impact on poor people
IFPRI’s Strategic FrameworkIFPRI’s Strategic Framework
Research
Capacity strengthening
Policy communication
Partners, stakeholders,
donors, IFPRI Board and Staff
Policymakers, media, opinion
leaders, and IFPRI

ECOWASCORAF
COMESA
ASARECA
IFPRI Offices
SAKSS Nodes
IFPRI in Africa
NEPAD
AU

Africa on the move: OverviewAfrica on the move: Overview
1.1. Growth for poverty reductionGrowth for poverty reduction
2.2. Africa’s new growth and development Africa’s new growth and development initiatives (NEPAD and CAADP)initiatives (NEPAD and CAADP)
3.3. Supporting implementation of Africa’s Supporting implementation of Africa’s growth agendagrowth agenda

AFRICA IS GROWING AGAINAFRICA IS GROWING AGAIN
-3
0
3
6
9
1980
1982
1984
1986
1988
1990
1992
1994
1996
1998
2000
2002
2004
2006
Per
cen
t (%
)
Agriculture, value added (annual % grow th)
GDP grow th (annual %)

GROWTH IS SPREADING

Agriculture GROWTH IS SPREADING

95
100
105
110
115
120
125
2001 2002 2003 2004 2005
World Africa
Index of Ag. Export Value (2000 =100)
TRADE PERFORMANCE IS PICKING UP
95
100
105
110
115
120
125
130
135
140
145
150
155
160
2001 2002 2003 2004 2005
World Africa
Index of Ag. Export Volume (2000 =100)
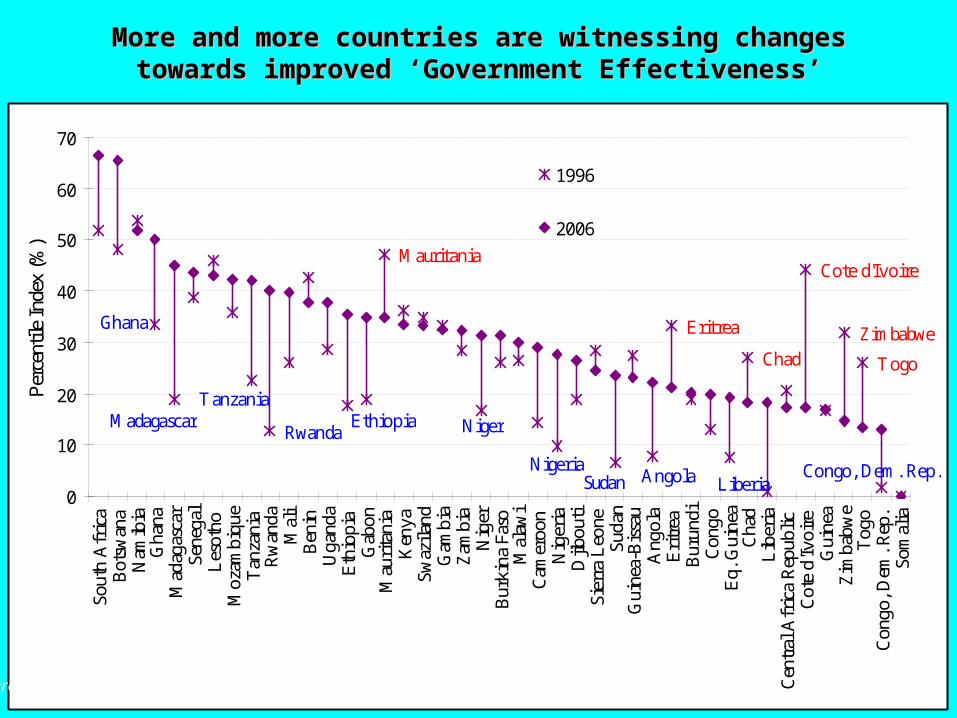
More and more countries are witnessing changes towards More and more countries are witnessing changes towards improved ‘Government Effectiveness’improved ‘Government Effectiveness’
Ghana
TanzaniaEthiopia
Nigeria
Cote d'Ivoire
Zimbabwe
Togo
Mauritania
Eritrea
MadagascarRwanda
Chad
Niger
Congo, Dem. Rep.LiberiaAngolaSudan
0
10
20
30
40
50
60
70
Sout
h A
fric
aB
otsw
ana
Nam
ibia
Gha
naM
adag
asca
rSe
nega
lL
esot
hoM
ozam
biqu
eT
anza
nia
Rw
anda
Mal
iB
enin
Uga
nda
Eth
iopi
aG
abon
Mau
rita
nia
Ken
yaSw
azila
ndG
ambi
aZ
ambi
aN
iger
Bur
kina
Fas
oM
alaw
iC
amer
oon
Nig
eria
Djib
outi
Sier
ra L
eone
Suda
nG
uine
a-B
issa
uA
ngol
aE
ritr
eaB
urun
diC
ongo
Eq.
Gui
nea
Cha
dL
iber
iaC
entr
al A
fric
a R
epub
licC
ote
d'Iv
oire
Gui
nea
Zim
babw
eT
ogo
Con
go, D
em. R
ep.
Som
alia
Per
cent
ile I
ndex
(%
)
1996
2006
Source: 2006 Worldwide Governance Indicators, The World Bank, 2007

Food retailers
top 10:$777bln • Wal-Mart • Carrefour • Royal Ahold • Metro AG • Tesco
C o
n s u
m e r s $4,000 b
illion
The world food system globalizesThe world food system globalizes
Food processors and traders
top 10: $363 bln
• Nestle • Cargill • Unilever • ADM • Kraft Foods
Agricultural input
industry
top 10: $37 bln
• Syngenta • Bayer • BASF • Monsanto • DuPont
Farms
Agricultural value added:
$1,315 bln
450 million>100 ha: 0.5%
< 2 ha: 85%
Source: von Braun, 2005
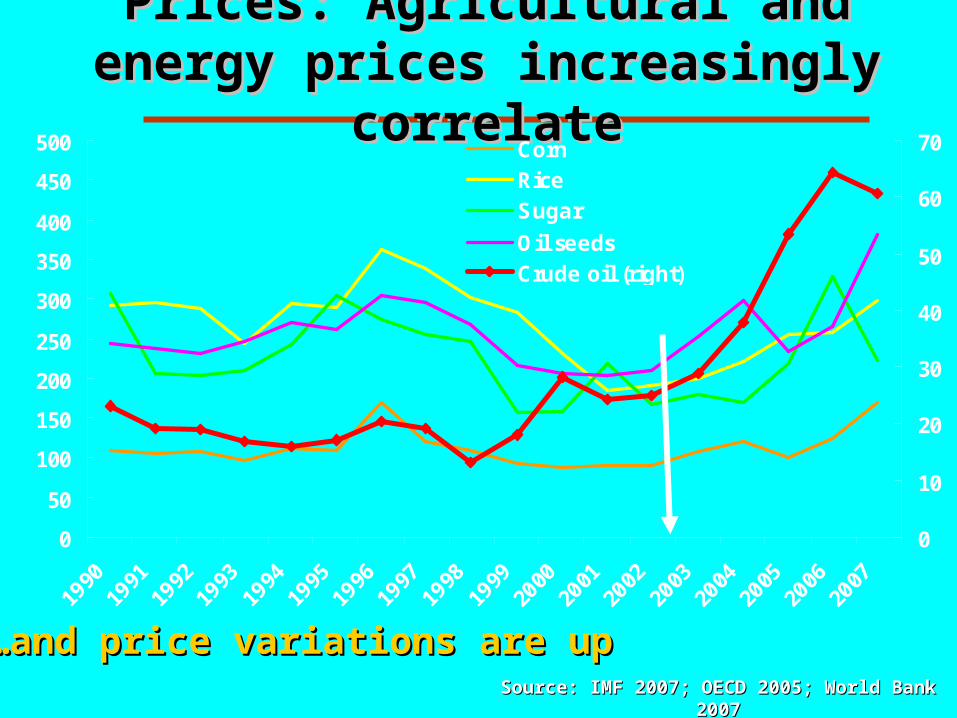
Prices: Agricultural and energy Prices: Agricultural and energy prices increasingly correlateprices increasingly correlate
Source: IMF 2007;Source: IMF 2007; OECD 2005; World Bank 2007OECD 2005; World Bank 2007
0
50
100
150
200
250
300
350
400
450
500
0
10
20
30
40
50
60
70CornRiceSugar
Oil seedsCrude oil (right)
……and price variations are upand price variations are up

Climate change & energy threatsClimate change & energy threats
• By 2020, 75-250 million people expected to be By 2020, 75-250 million people expected to be exposed to drought (mainly in Africa)exposed to drought (mainly in Africa)
- Adverse effect on livelihoods & food Adverse effect on livelihoods & food securitysecurity
- Exacerbate malnutrition & water-related Exacerbate malnutrition & water-related problemsproblems
- By 2020, yields could be reduced by up to By 2020, yields could be reduced by up to 50% (rain-fed agriculture)50% (rain-fed agriculture)
Energy: biofuels - food / biomass competitionEnergy: biofuels - food / biomass competition
Higher food prices (scenarios: 30 to 80% + prices)Higher food prices (scenarios: 30 to 80% + prices)
Instabilities increase (new risks for Africa’s poor)Instabilities increase (new risks for Africa’s poor)
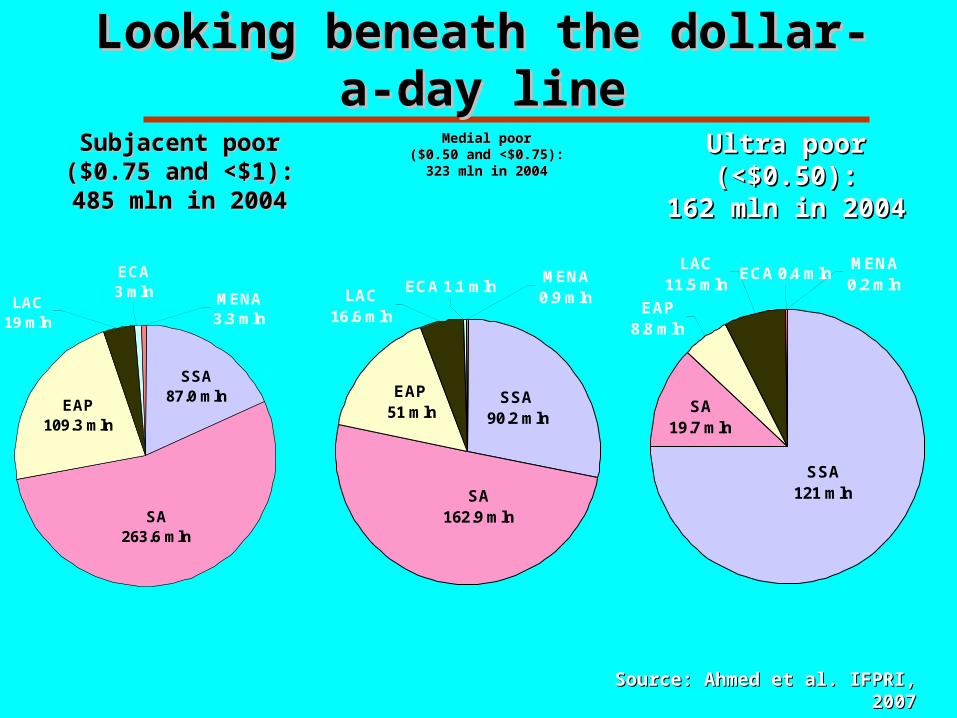
Looking beneath the dollar-a-day Looking beneath the dollar-a-day lineline
Subjacent poorSubjacent poor($0.75 and <$1):($0.75 and <$1):485 mln in 2004485 mln in 2004
Ultra poorUltra poor(<$0.50):(<$0.50):
162 mln in 2004162 mln in 2004
Medial poorMedial poor($0.50 and <$0.75):($0.50 and <$0.75):
323 mln in 2004323 mln in 2004
ECA 1.1 mlnMENA0.9 mlnLAC
16.6 mln
EAP 51 mln
SSA 90.2 mln
SA162.9 mln
MENA0.2 mln
ECA 0.4 mlnLAC
11.5 mln
EAP8.8 mln
SA19.7 mln
SSA121 mln
LAC19 mln
ECA3 mln MENA
3.3 mln
EAP109.3 mln
SSA87.0 mln
SA263.6 mln
Source: Ahmed et al. IFPRI, 2007Source: Ahmed et al. IFPRI, 2007

The share of the poorest in SSA is The share of the poorest in SSA is growinggrowing
-1.4
-0.9
-0.7
0.06 0.14
-2
-1.5
-1
-0.5
0
0.5
Developing World
East Asia & Pacific
South Asia
L America & Caribb.
Sub-Saharan Africa
% p
oin
t c
ha
ng
e
Source: Ahmed et al. 2007Source: Ahmed et al. 2007
Change in the share of poor living below .50$/day 1990-2004Change in the share of poor living below .50$/day 1990-2004

MDG progress (GHI), growth & MDG progress (GHI), growth & governancegovernance
-1.00
-0.75
-0.50
-0.25
0.00
0.25
0.50
0.75
1.00
-10 -5 0 5 10
low government effectiveness (1998) higher governnment effectiveness (1998)
Annual growth rate in GNI per capita, 1990-2004 (in %)
GH
I pro
gre
ss
ind
ica
tor
Congo DR
Ethiopia India China
Brazil
Nigeria
Ghana
Kenya Tanzania
Uganda
Source: Wiesmann 2007.
Low gov. effectiveness is assigned to countries in the lowest quartile of Worldwide Governance Indicators.

What explains the high poverty and What explains the high poverty and hunger incidences in Africa?hunger incidences in Africa?
1.1. Low agricultural productivity and output growthLow agricultural productivity and output growth
2.2. Poor access to infrastructure, production inputs Poor access to infrastructure, production inputs and rural services (e.g. health and education) and rural services (e.g. health and education)
3.3. Loss of competitiveness in domestic, regional and Loss of competitiveness in domestic, regional and world marketsworld markets
4.4. Years of neglect of food staples and livestock Years of neglect of food staples and livestock sectors sectors
5.5. Inadequate public and private sector investments, Inadequate public and private sector investments, especially in rural areasespecially in rural areas
6.6. Weak enabling environment: governance, Weak enabling environment: governance, institutions, standards and regulationsinstitutions, standards and regulations
7.7. Low capacity to deal with vulnerabilities to political Low capacity to deal with vulnerabilities to political instability and natural shocks (droughts, disease instability and natural shocks (droughts, disease and pests, health, such as HIV/AIDS and Malaria)and pests, health, such as HIV/AIDS and Malaria)
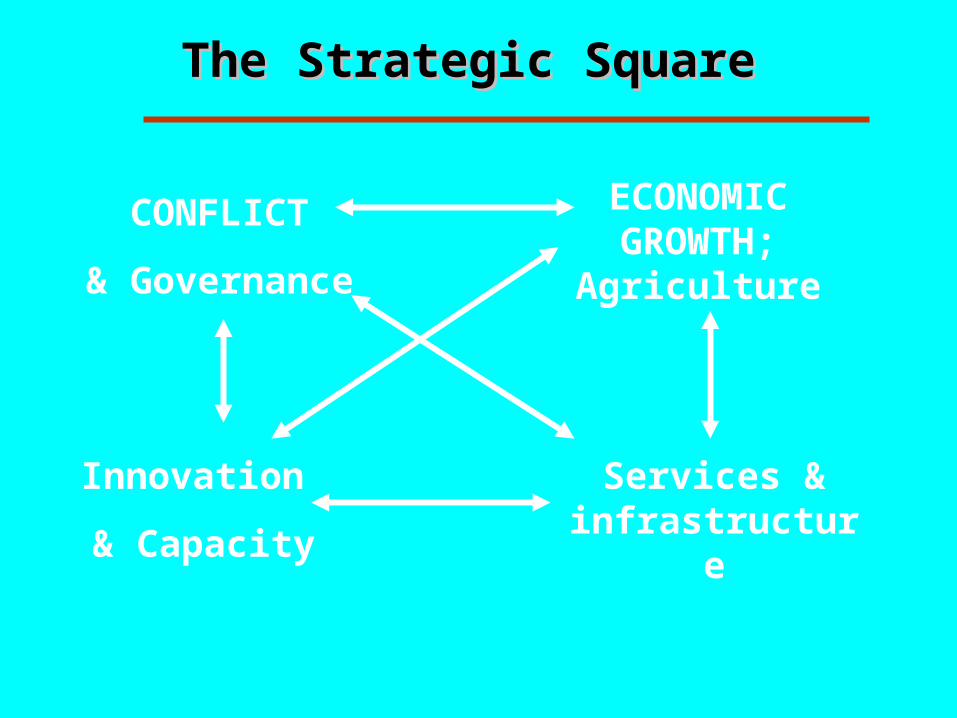
The Strategic Square The Strategic Square
Innovation
& Capacity
ECONOMIC GROWTH; Agriculture
CONFLICT
& Governance
Services & infrastructure

AGRICULTURE-LED GROWTH TO REACH MDG1AGRICULTURE-LED GROWTH TO REACH MDG1
TARGET GOAL OF 6% SECTOR GROWTH RATETARGET GOAL OF 6% SECTOR GROWTH RATE
INCREASED PUBLIC INVESTMENT (10% BUDGET SHARE)INCREASED PUBLIC INVESTMENT (10% BUDGET SHARE)
FOUR MAIN PILLARS TO GUIDE INVESTMENTFOUR MAIN PILLARS TO GUIDE INVESTMENT Land and water managementLand and water management Agribusiness and InfrastructureAgribusiness and Infrastructure Hunger and social safety netsHunger and social safety nets Science and TechnologyScience and Technology
POLICY EFFICIENCY, PEER REVIEW, ACCOUNTABILITYPOLICY EFFICIENCY, PEER REVIEW, ACCOUNTABILITY
EXPLOITATION OF REGIONAL COMPLEMENTARITIESEXPLOITATION OF REGIONAL COMPLEMENTARITIES
INCLUSIVENESS: FARMERS, AGRIBUSINESS, CIVIL SOCIETYINCLUSIVENESS: FARMERS, AGRIBUSINESS, CIVIL SOCIETY
MAIN FEATURES & PRINCIPLES
THE COMPREHENSIVE AFRICA AGRICULTURE THE COMPREHENSIVE AFRICA AGRICULTURE DEVELOPMENT PROGRAMME DEVELOPMENT PROGRAMME

Supporting implementation of Supporting implementation of Africa’s growth agendaAfrica’s growth agenda
• Analytical Agenda and M&E of CAADPAnalytical Agenda and M&E of CAADP
• Piloting Country Strategy SupportPiloting Country Strategy Support
• Establishment of ReSAKSSEstablishment of ReSAKSS
• Providing Roundtable Support to Implement Providing Roundtable Support to Implement CADDP at the National LevelCADDP at the National Level
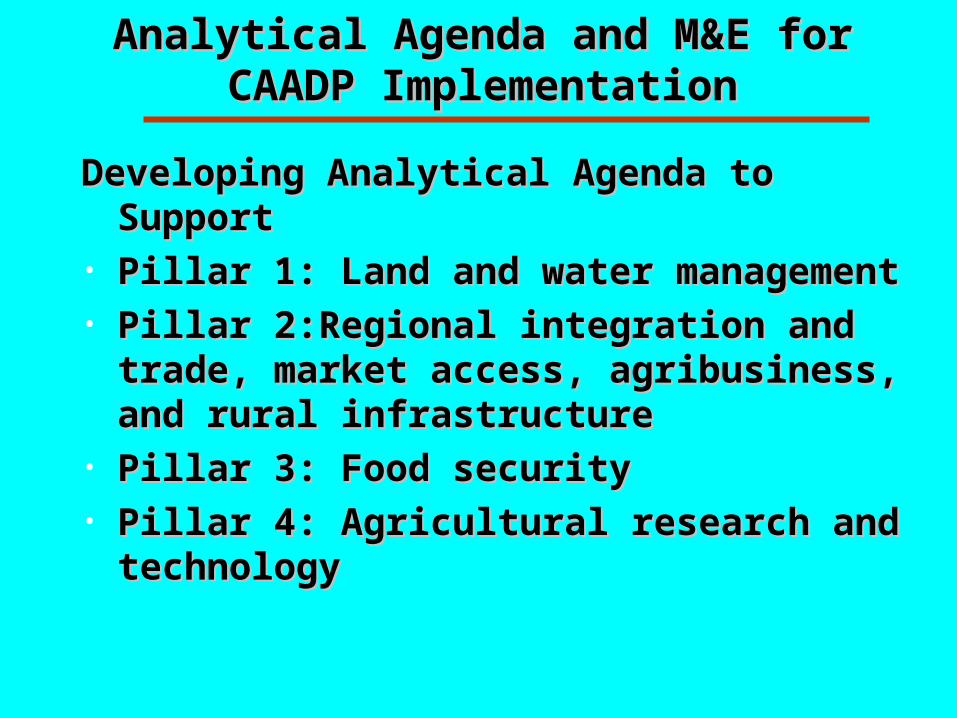
Analytical Agenda and M&E for CAADP Analytical Agenda and M&E for CAADP ImplementationImplementation
Developing Analytical Agenda to Support Developing Analytical Agenda to Support • Pillar 1:Pillar 1: Land and water management Land and water management • Pillar 2:Regional integration and trade, Pillar 2:Regional integration and trade,
market access, agribusiness, and rural market access, agribusiness, and rural infrastructure infrastructure
• Pillar 3: Food security Pillar 3: Food security • Pillar 4: Agricultural research and Pillar 4: Agricultural research and
technologytechnology

PROGRESS TOWARDS CAADP GROWTH TARGETPROGRESS TOWARDS CAADP GROWTH TARGET
-12
-9
-6
-3
0
3
6
9
12
15
18
1 3 5 7 9 11 13 15 17 19 21 23 25 27 29 31 33 35 37
Sample of countries (Total =37)
Gro
wth
Rat
e (%
)
2000-2003
2003-2005
CAADP 6% target

Progress against CAADP 10% goal (2004)Progress against CAADP 10% goal (2004)
0
5
10
15
20
25G
uine
a
Mad
agas
car
Nam
ibia
Mal
i
Cha
dG
ambi
a
Leso
tho
Zim
babw
eC
ote
d'Iv
oire
Mau
ritan
iaU
gand
a
Ken
yaE
thio
pia
Mal
awi
Cam
eroo
nM
ozam
biqu
e
Ben
inN
iger
iaS
eneg
al
Cen
tral
Afri
can
Rep
ublic
Zam
bia
Sw
azila
ndB
urki
na F
aso
Tan
zani
a
Tog
oB
urun
di
Nig
erG
hana
Gui
nea-
Bis
sau
Rw
anda
Per
cent
of
Ag
to T
otal
Sp
end
ing
(%)
Source: Fan et al., IFPRI (forthcoming)

Analysis SupportAnalysis Support
• 1. How agricultural growth vs. non 1. How agricultural growth vs. non agricultural growth contributes to national agricultural growth contributes to national development goalsdevelopment goals
• 2. How much investment is needed to 2. How much investment is needed to support needed agricultural growthsupport needed agricultural growth
• 3. How to allocate agricultural investment 3. How to allocate agricultural investment • 4. What are other complementary polices 4. What are other complementary polices
are needed to help the poor who will not are needed to help the poor who will not benefit from agricultural growthbenefit from agricultural growth
• 5. How to reform the governance structure 5. How to reform the governance structure

GhanaGhana
Source: IFPRI work in Progress
Ghana
50
75
100
125
15019
92
1993
1994
1995
1996
1997
1998
1999
2000
2001
2002
2003
Inde
x (1
985=
100)
AgricultureProducivity
HouseholdIncome
Poverty
Hunger

GHI Trends in Africa 1981 - 2003GHI Trends in Africa 1981 - 2003
Sub-Saharan Africa, Trends 1981-2003
0
5
10
15
20
25
30
35
40
45
50
0 500 1,000 1,500 2,000 2,500
Gross National Income per capita
Glo
ba
l Hu
ng
er
Ind
ex
Ghana
Mozambique
Ethiopia
Malawi
Zambia
SenegalUganda
Kenya
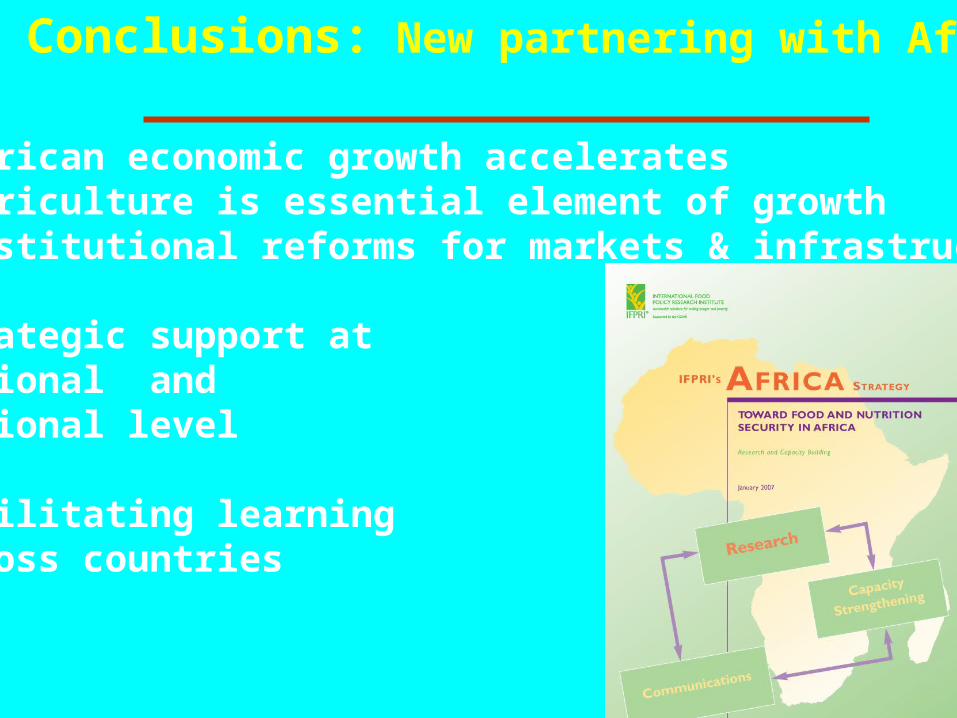
•African economic growth accelerates•Agriculture is essential element of growth •Institutional reforms for markets & infrastructure
Strategic support at National and regional level
Facilitating learning across countries
Conclusions: New partnering with Africa